September 16, 2021

3:46 pm

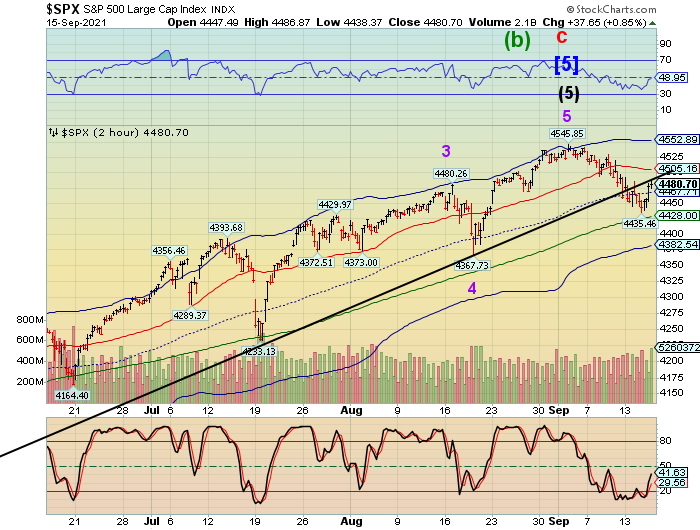
SPX appears to have completed its retracement (Wave 2).  Time to sell.  The retracement was comparatively weak, lesss than the 50% expected at 4490.52.  This market is going down.


7:30 am
Good Morning!

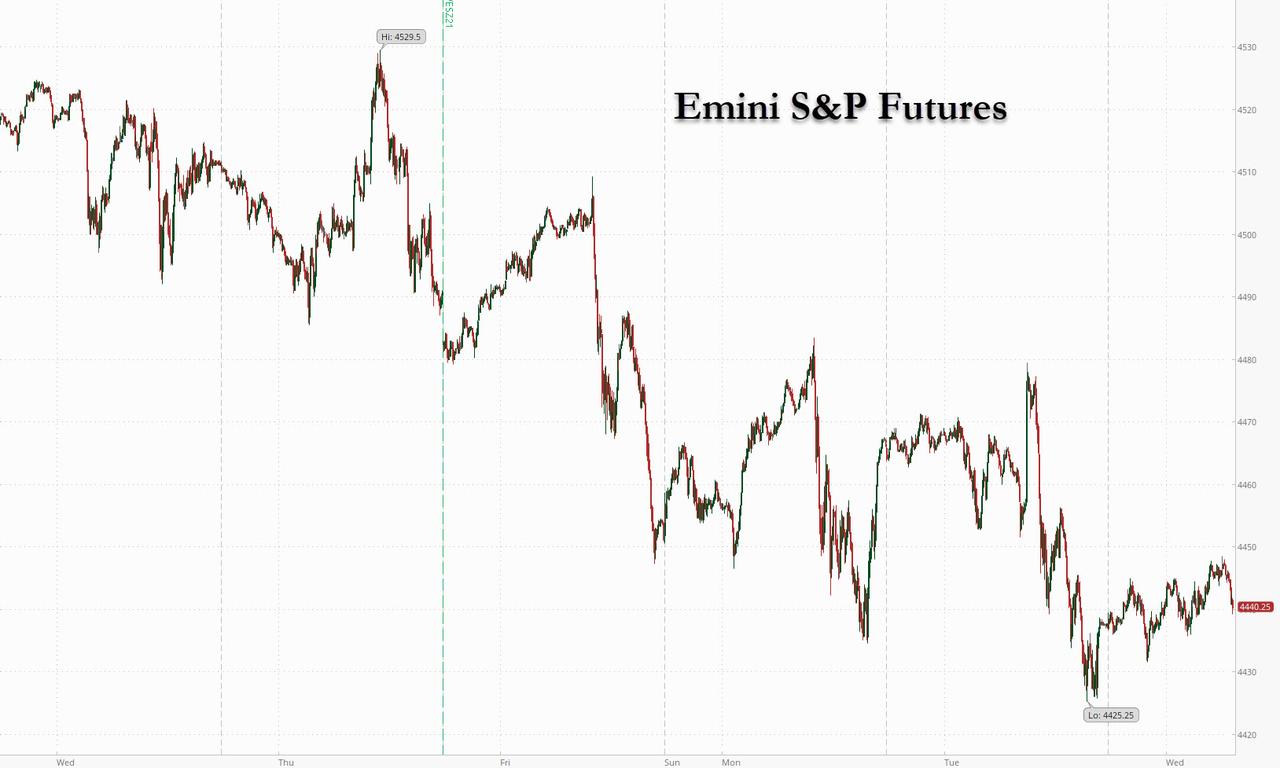
SPX futures are lower this morning after doing a double tap on the trendline yesterday.  Today may be a down day, as it appears that despite the panic rally from the low, the index is breathing fumes.  As the decline hasn’t quited taken hold this morning, there may be another attempt at the trendline that may fail.  The trendline and the 50% Fibonacci retracement are at 4490.78.  The ensuing decline may challenge the 50-day Moving Average at 4425.00.

Tomorrow’s Quad-Witching Options expiration shows calls are marginally higher at 4500.00 and above, while puts gain the upper hand at 4400.00 and below.  This may allow a wide-ranging day that would affect volatility and allow a possible failure beneath 4400.00.

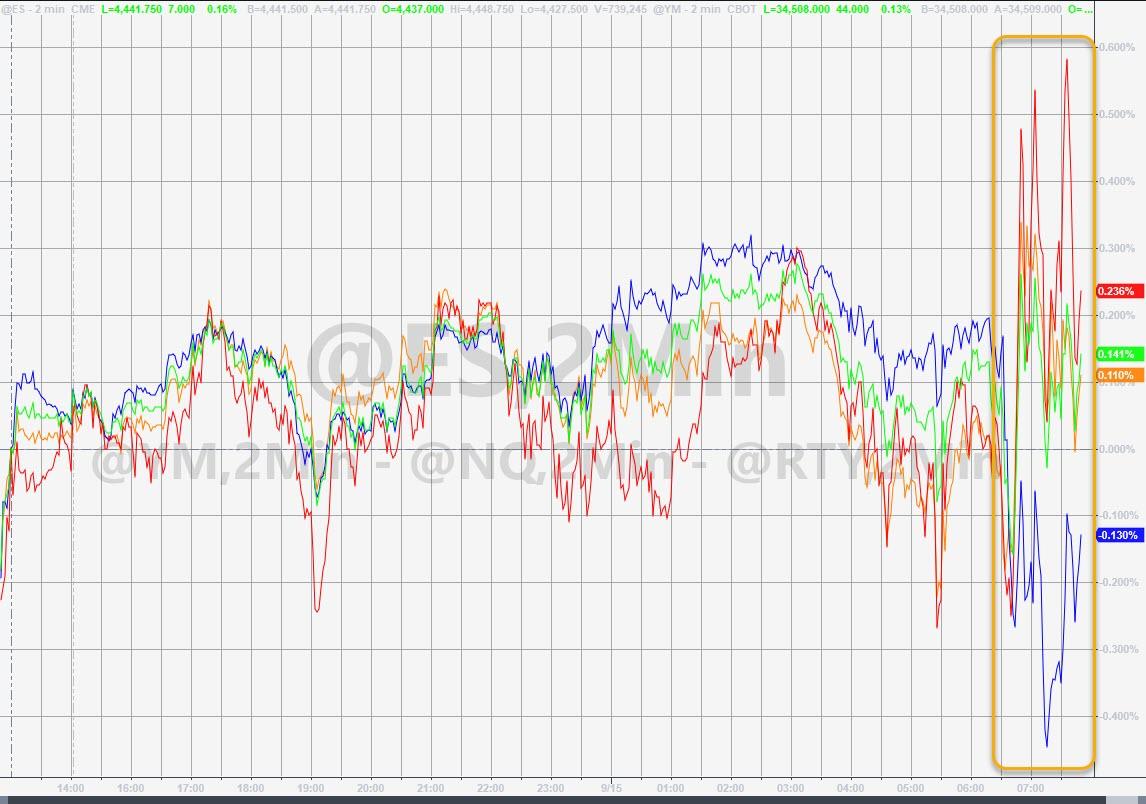
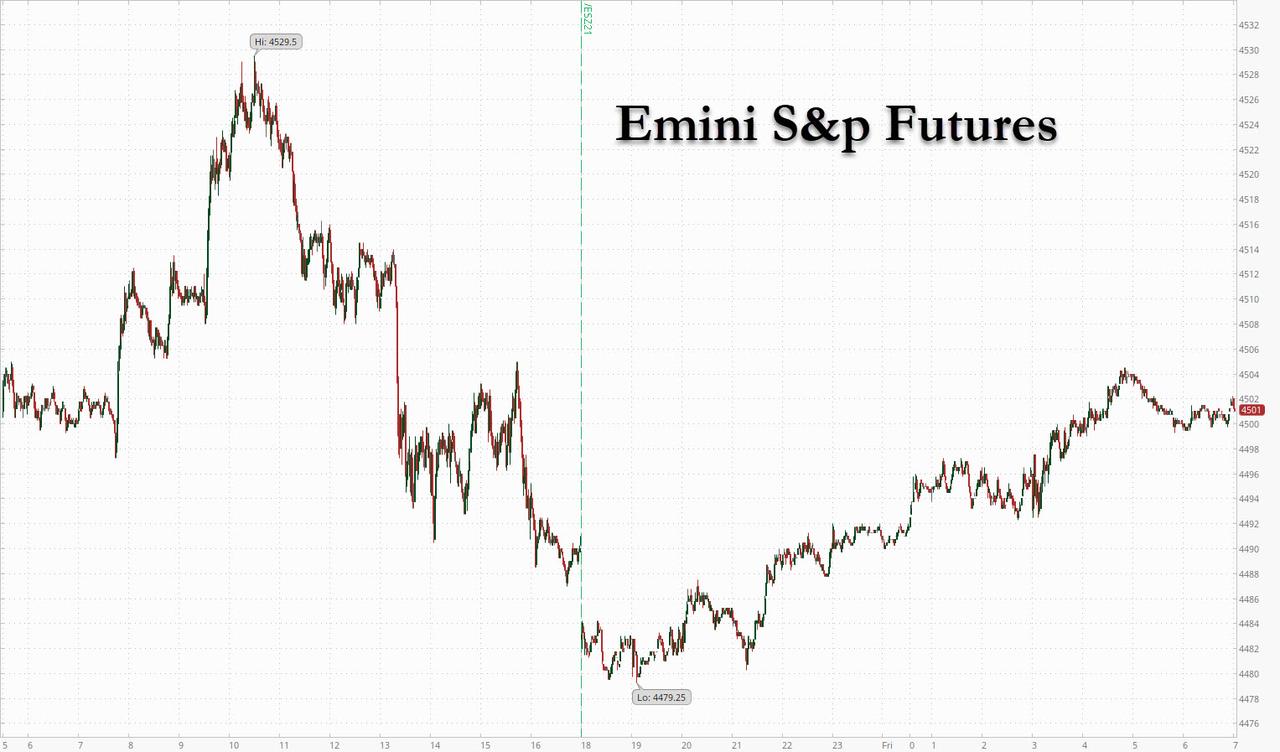
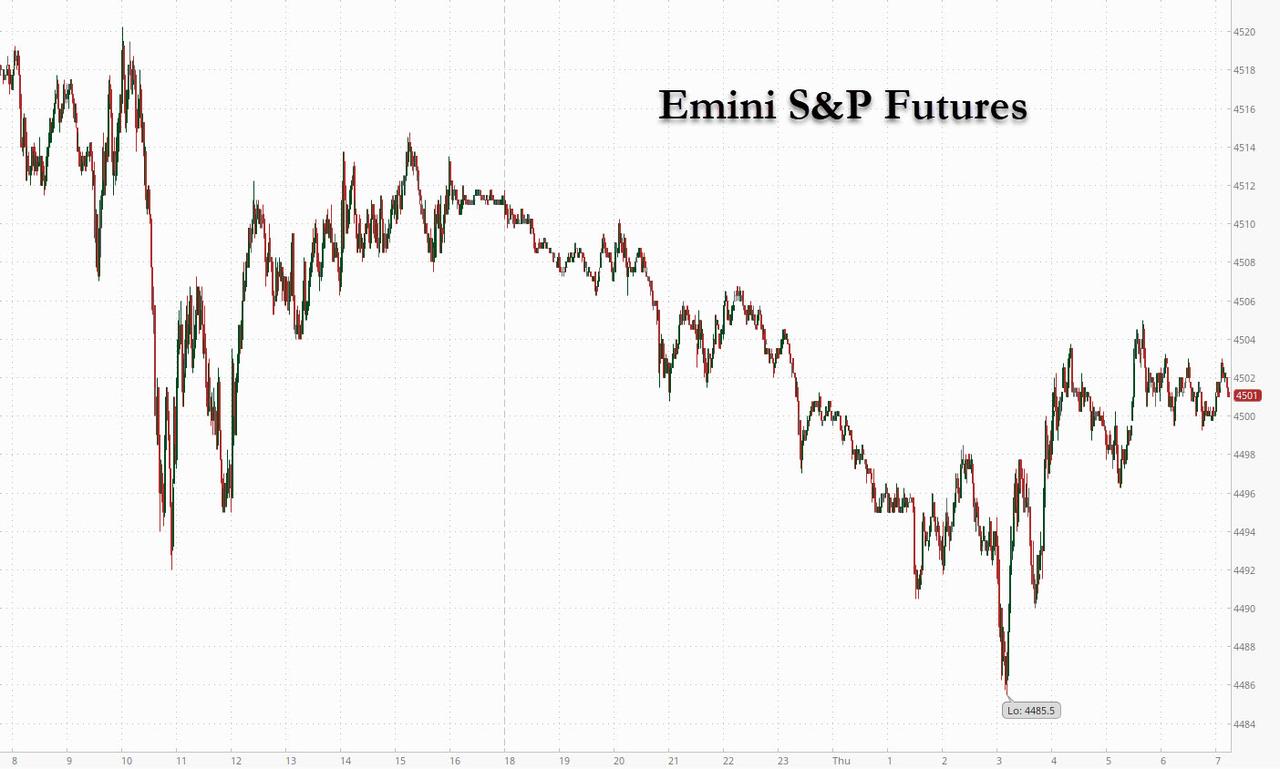
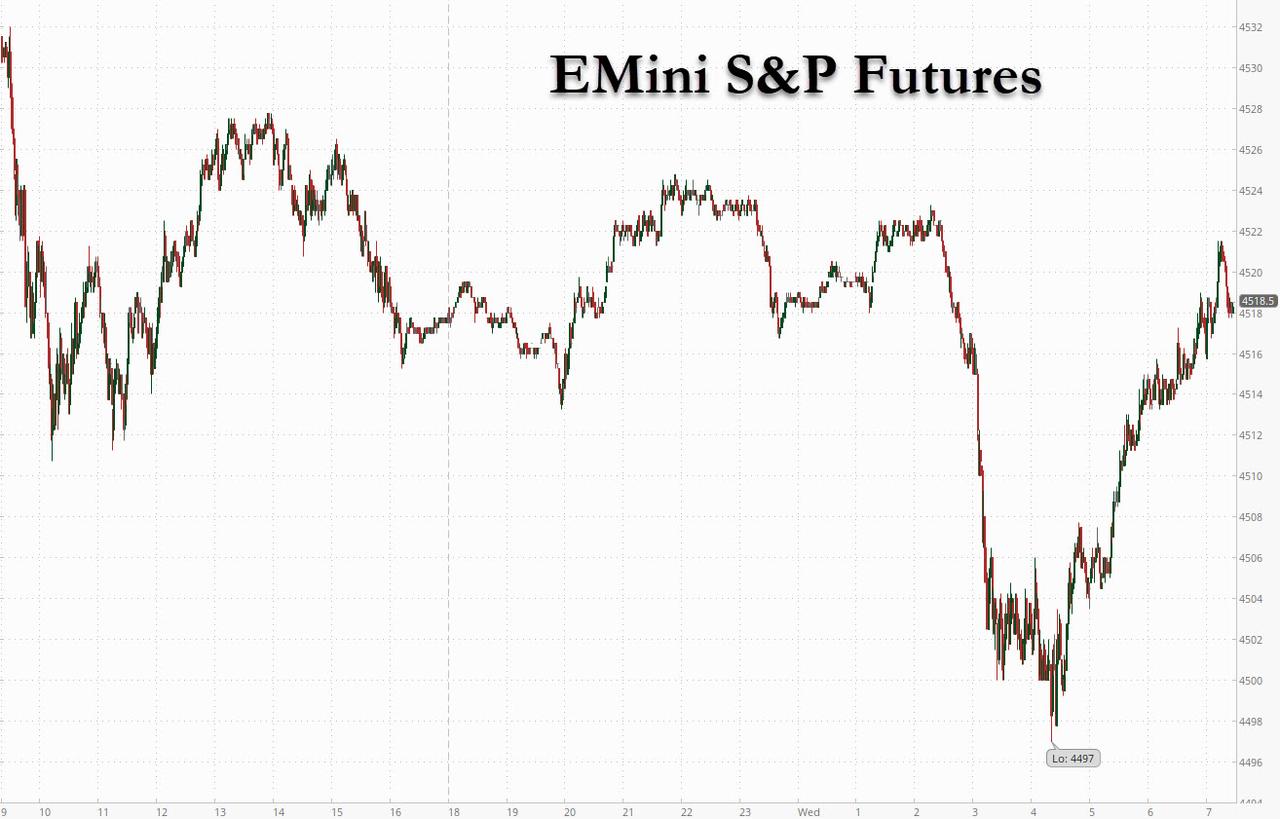
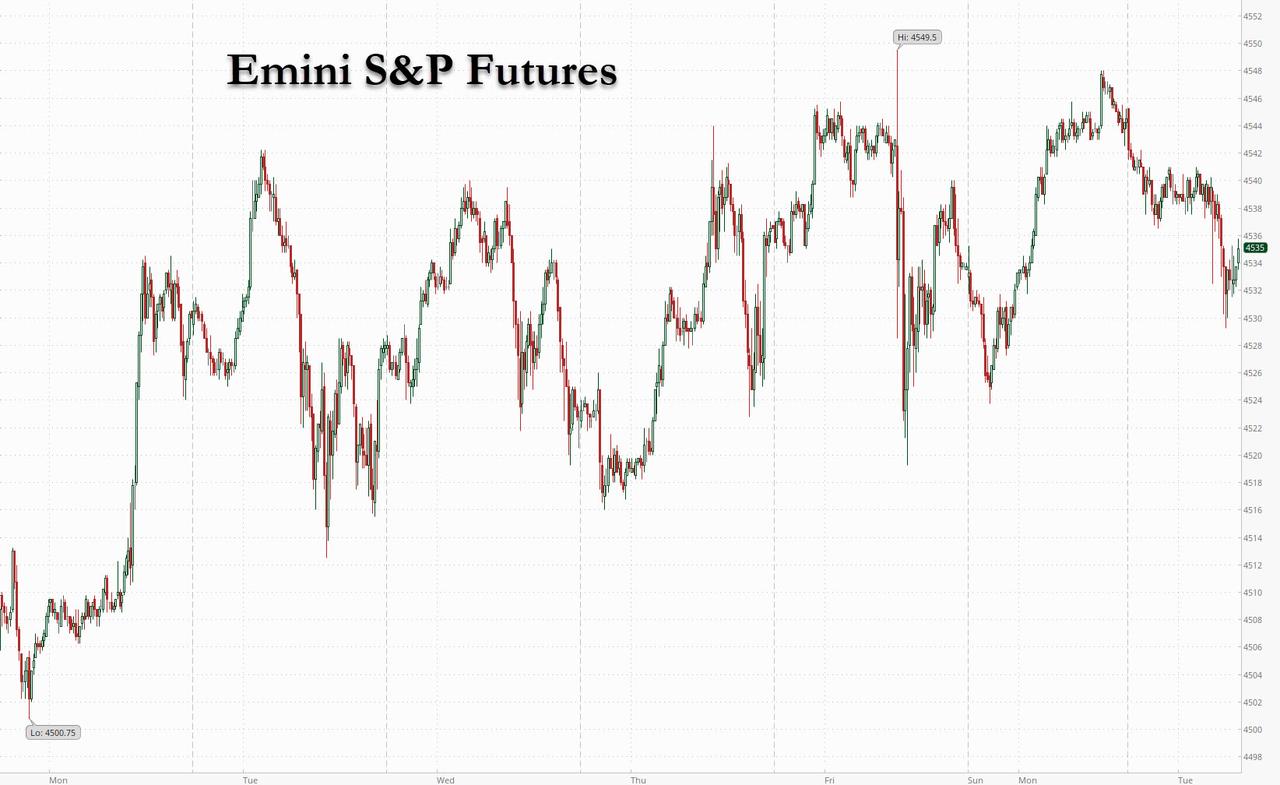
ZeroHedge reports, “US equity futures slid, fading Wednesday’s torried one-day rally, as investors awaited data on jobless claims and retail sales which are expected to show another decline as US consumers retrench.  European markets were solidly in the green while Asian stocks fell after the ongoing debt crisis at Evergrande – which halted all bond trades for the day – and China’s latest push to rein in private industries hurt sentiment. The dollar gained as Treasuries dipped while Bitcoin was little changed as gold and oil fell. S&P 500 E-minis were down 8.75 points, or 0.19% at 730 am ET, Dow E-minis were down 14 points, or 0.04%, while Nasdaq 100 E-minis were down 34.25 points, or 0.22%.”


The NYSE Hi-Lo Index closed at 26 out of over 3300 listings.  New highs show active participation while new lows indicate liquidation.

ZeroHedge reports, “The last time retail participation in the market dried up, was back in May when three months after retail investors took the stock market by storm sparking a series of historic short squeezes in meme stonks such as GME and AMC, the money from various stimmies dried up and retail enthusiasm for stocks suddenly faded.

We discussed this on May 9 when we said “Retail Participation In Stock Trading Has Collapsed“, and pointed to the plunge in call option volumes, which had emerged as the preferred investment vehicle for millions of GenZ and Millennial investors.

Perhaps coincidentally, our warning that day marked the top for the market for the next few weeks, with the S&P sliding some 200 points in just the next four days.

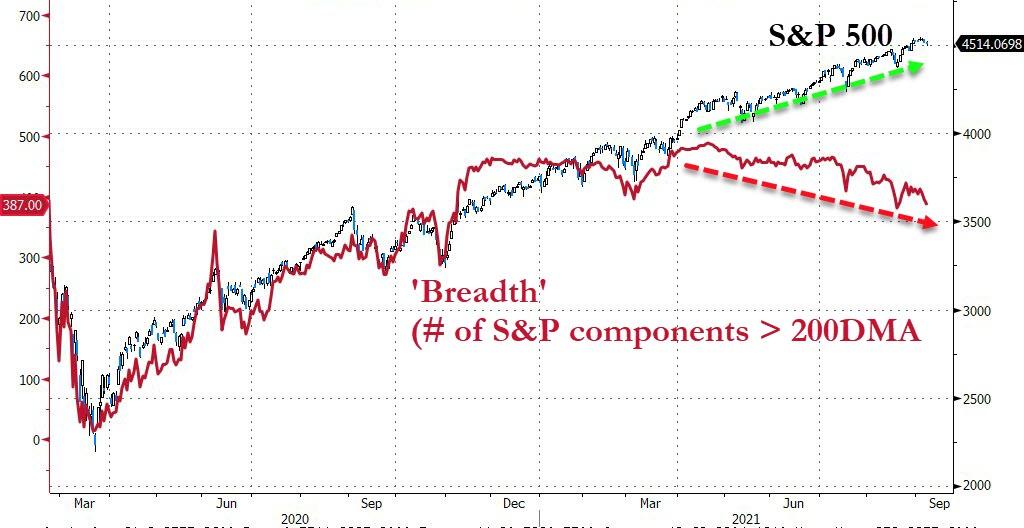
We bring this up because at a time when retail investors have become instrumental in propping up the market and buying each and every dip, this time around retail enthusiasm is once again fading.
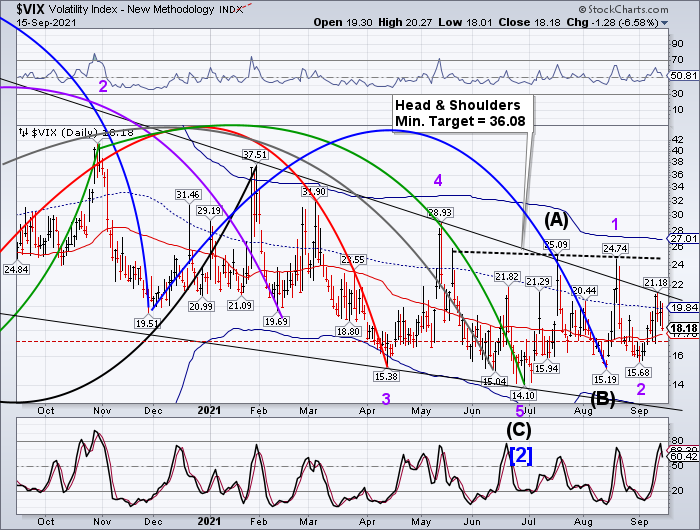
 

VIX futures rose off their low, reaching a morning high at 19.09.  The correction appears to be complete, with a near 61.8% retracement.
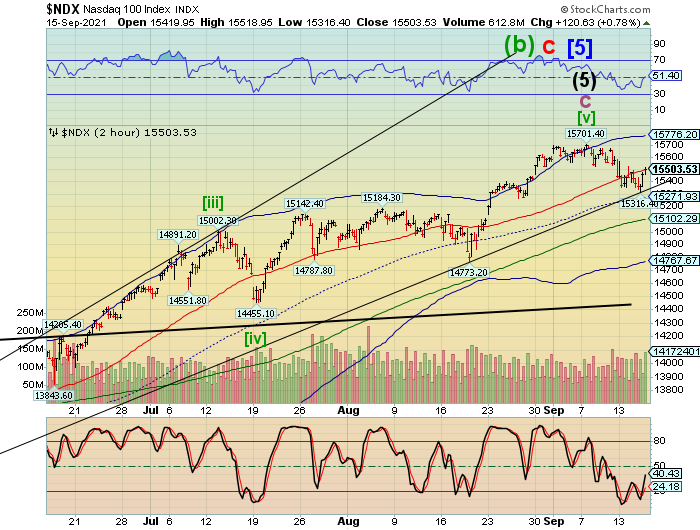
 

NDX futures declined to 15444.70 after closing very near Short-term support at 15500.09.  The trendline is near 15350.00 this morning, which confirms the sell signal.  The NDX Hi-Lo Index closed at -15.00, adding yet another confirmation to the mix.  The final sell signal confirmation comes beneath the 50-day Moving Average at 15102.29.  Tne NDX may come under the influence of the tech-heavy Shanghai Composite Index.

While the NDX options don’t reveal a lot of information due to the large size, the QQQs (Price:378.05) reveal overwhelming open interest in puts at 378.00 and below, while open interest in calls dominate at 379.00 and higher.  IT may only take a wobble of a decline from yesterday’s close to set off a self-reinforcing decline in QQQs/NDX.


The Shanghai Composite Index tumbled to a new daily low as liquidity is withdrawn from the market.  While Evergrande is no a tech company, techs have had their share of troubles as well.   This may force the NDX into a tailspin that it may not recover from.

ZeroHedge reports, “Earlier today we pointed out that in what can (obviously) only be a remarkable coincidence, China’s largest, and most systematically important real estate developer, China Evergrande (and its $300+ billion in debt), collapsed on the 13th anniversary of Lehman’s bankruptcy filing, when Beijing told Evergrande’s creditor banks that the insolvent company, which recently hired Houlihan Lokey as bankruptcy advisor, would not pay interest on its debt next week, nor would it repay principal, in effect blessing the coming default.

And yet there was some trace of hope, because as Forte Securities trader Keith Temperton said “The Asian banks will get hit hard if there’s a default, but then there will be a 10-year recovery process. The market’s getting a hang of it. The way they’ve managed the news flow seems quite clever. They haven’t let a swathe of bad news at once” giving investors and creditors some hope that the money could still miraculously reappear.”
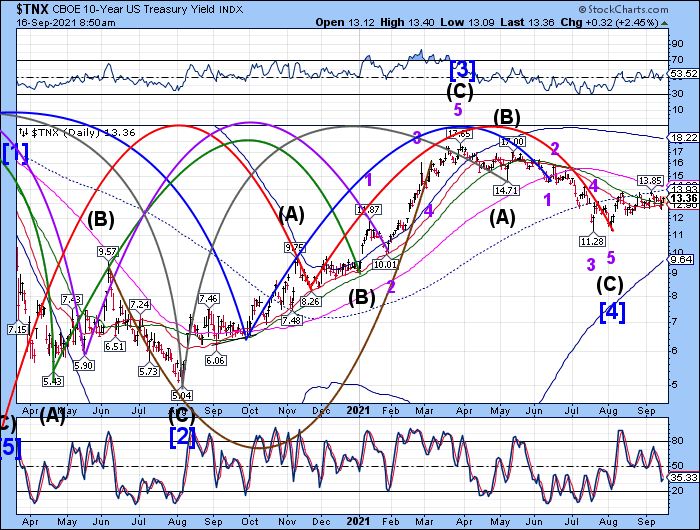
 

TNX soared above the 50-day Moving Average at 12.92 this morning and on a buy signal.  This may be confirmation that the August 4 low at 11.29 could be the terminus for Wave 5 of (C) of [4] as well as the Master Cycle low.  Note that I pointed out that particularly strong trends may have shorter Cycles and possible corrective truncations, or both.


Gold futures plumetted to 1758.75 this morning on liquidity issues.  The Retail sales report didn’t help.  The Cycles Model suggests may last until next mid-week, declining in strength.  It appears that the Head & Shoulder neckline may be broken.


Posted in Published | Comments Off on September 16, 2021

September 15, 2021

1:24 pm

SPX  has retraced most of the way to its trendline near 4485.00.  The 50% retracement value is 4490.78.  Currently it has gone to 4479.91, just above the 38.2% Fib retracement at 4477.72 in a Wave [a] of 2.  Wave [b] of 2 may be quite deep, with a floor near 4400.00.  The final surge may be on Friday, where it may revisit the trendline as it rises to +/- 4490.00.  We may see volatility go through the roof should the decline go beneath the 50-day Moving Average.

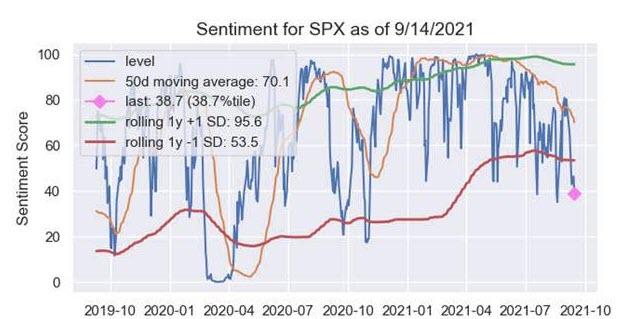
ZeroHedge comments, “This morning’s chaotic trading in stocks could be indicative of the pull and push that Nomura’s Charlie McElligott sees playing out over the next week or so.

Specifically, Nomura’s SPX sentiment index is cratering and at 38.7%ile, back near lows of the year.

Forward returns backtest to show sideways for the next 1m with negative excess return.

But it is the ultra-short-term which is most interesting…”


7:30 am

Good Morning!

SPX futures remained within a 16-point range of yesterday’s cloose.  This afternoon we may see an 8.6-day decline completed near the 50-day Moving Average at 4425.04, followed by a bounce into options expiration.  A 50% retracement of this decline will put SPX back up to 4485.00, near the trendline.

Today’s expiring options are heavily weighted with puts at 4450.00 and beneath.   The maximum pain level is 4465.00, suggesting a possible close in that area.  Friday’s optiosn expiration shows a wide neutral stance with puts dominating at 4400.00 and below, calls domination at 4500.00 and higher.  A gamma-induced sell-off to 4400.00 is possible today, but may still bounce back toward the trendline by Friday.

ZeroHedge reports, “While Microsoft did everything it could to halt the recent market drop which has dragged stocks lower on 6 of the past 7 days with its surprising announcement of a record, $60 billion stock buyback, the latest dismal data from China which missed across the board with retail sales, industrial production, fixed investment, property sales and investment all came in worse than expected, with retail sales growing at the slowest pace since August 2020 while industrial output also rose at a weaker pace from July…

… left a sour taste in the market, and left futures trading just barely in the green, higher by 0.1%, while Asia stocks dropped as weak Chinese economic data reinforced worries about slowing growth globally as well as in the world’s second-biggest economy amid fraught nerves over a still-dominant pandemic and tapering of central banks’ stimulus; European markets lacked direction. S&P 500 E-minis were up 5 points, or 0.11% at 07:20 am ET, Dow E-minis were down 16 points, or 0.04%, while Nasdaq 100 E-minis were up 28 points, or 0.18%. The dollar was steady and oil gained.”


VIX futures have remained neutral in the overnight session.  VIX may decline to the 50-day Moving Average in the next couple of days.  Today is monthly options expiration for the VIX and I would expect most of the decline to happen before the close. In today’s options expiration, puts dominate at 21.00 and lower, while calls dominate from 24.00 and higher.  A negative usrprise to the market may spike VIX to 25.00.


NDX futures rose to 15438.00 in th eovernight session, but have come down since.  NDX options are very light, but the QQQ (Price: 375.26) options chain shows puts d0minating at 376.00 and lower.  The decline in the NDX is incomplete and negative gamma may induce a further sell-off to the mid-Cycle support at 15259.50 or possibly lower.  The 50-day Moving Average stands at 15086.06.  This may induce a sell off in the SPX as well…an accident waiting to happen.

ZeroHedge observes, “Now that stocks have emerged from their 5-day losing streak, narrowly averting 6 consecutive days of declines which would have been the longest such streak since the February 2020 depths of the covid crisis, attention shifts to the market’s technicals and especially Friday’s upcoming quad-witch which sees some $1.5 trillion in SPX option expirations, as well as $1.4tln in options across underlyings expiring on Friday afternoon, including the 2nd largest expiration for single stocks outside of a January.

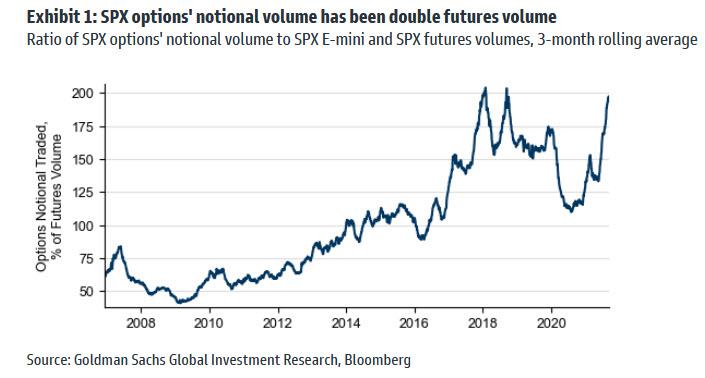
Courtesy of Goldman, here Four observations on option positioning ahead of Friday’s quarterly maturity:

1. Option volumes have been continuing to grow relative to delta-one volumes. Both index and single stock option markets have shown volume growth in Q3, while delta-one volumes (futures and shares) have fallen. Having traditionally traded well below 100%, SPX options notional volumes are now double the volume of futures traded.”


TNX declined this morning and may be on its way to 11.00 by Monday.  That move may sent UST to 135.00 at the same time.   Friday’s options chains for TLT (Price: 151.11) shows it is heavily dominated by calls and positive gamma may take over with today’s move sending treasuries higher.


The GSCI Agricultural Index may have made its Master Cycle low on Friday, September 10 (day 249).  This Master Cycle shows relative strength as it is ready to move to new heights instead of new lows (in stocks), as it bounces off the 43-week Moving Average (not shown).  The new Cycle may last until mid-December.  In the meantime, we may expect food prices to possibly double by the end of the year.

ZeroHedge warns, “An executive of Kroger, one of the largest supermarket chains in the United States, warned grocery prices are about to become even higher this year as inflation sets in.

Inflation is running hotter than previously anticipated, and prices are slated to rise an additional 2 to 3 percent over the second half of 2021, Kroger CFO Gary Millerchip said during a call with reporters.

Kroger will be “passing along higher cost to the customer where it makes sense to do so,” he said on Sept. 10.”

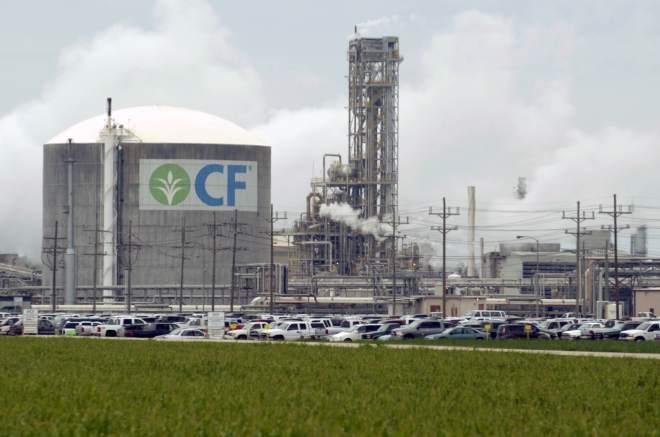
ZeroHedge further notes, “Spot prices for nitrogen fertilizer on the US Gulf Coast skyrocketed to a near-decade high on a report the world’s largest nitrogen manufacturing plant declared force majeure.

CF Industries Holdings Inc. in Donaldsonville, Louisiana, closed its massive complex ahead of Hurricane Ida. The complex has 19 plants, including six ammonia and five urea facilities, producing nitrogen-based products for agricultural and industrial markets.

According to the letter seen by Bloomberg, CF Industries said, “due to these circumstances, CF Industries Sales, LLC has declared an event of force majeure affecting the production and shipment of product from the CF Donaldsonville, LA nitrogen complex.” 

The letter was dated Sept. 3, and at that time, the facility remained closed. This stoked fears of production declines at a time when supplies are already tight.

As a result of the force majeure, US Gulf urea nitrogen fertilizer spot prices spiked 16.5%, according to Green Markets data.”


The Shanghai Composite Index plunged beneath the Cycle Top resistance, giving it a sell signal.  The Bank of China has been giving the market ample liquidity to the point of nearly overtaking the previous high at 3731.69, missing by only 9 points on Friday.  Now we know why there appears to be a sudden liquidity drain 12.9 years after Lehman.

ZeroHedge observes, ” Yesterday, when covering the non-stop drama surrounding China’s most insolvent property developer, Evergrande, we said that it would be remarkably ironic if Evergrande were to announce a default – which everyone knows is coming – today, on the 13th anniversary of Lehman’s bankruptcy filing on Sept 15, 2008.

Well, in this delightfully absurd world we live in, that’s just what happened only instead of Evergrande making the announcement, it was the entity that will soon control the massively overlevered property developer that made it for them: the Chinese government.

According to Bloomberg, Chinese authorities told major lenders to China Evergrande Group not to expect interest payments due next week on bank loans, which takes the cash-strapped developer a step closer the nation’s largest modern-day restructurings, and guarantees that China’s “Lehman Moment” is now just a matter of days, if not hours.”


Posted in Published | 2 Comments

September 14, 2021

1:23 pm

I finally figured that the problem with my charts originated at Google.  However, the new search engine doesn’t work the same.  It will take some getting used to.  As you can see, the SPX is on a chart sell signal.  The VIX supports the SPX sell signal, while the NYSE Hi-Lo Index opened at 13.00 and rose to 76.00.  We may get a better reading after the close.

7:53 am

Good Morning!

My webmaster is tring to find why my charts are being blocked at WordPress.  I hope to have an answer later today.

SPX futures have turned negative this morning after testing the underside of the Ending Diagonal trendline overnight.  We have a sell signal hat is confirmed by the trendline and VIX, but not the NYSE Hi-Lo Index, which closed at 52.00 after ramping to 103.00 earlier in the day.   The 50-day Moving Average is at 4421.93.

Tomorrow’s options expiration is weighted toward calls at 4500.00 and above, while puts dominate at 4450.00 and below.  Tomorrow’s options expiration is not heavily populated, as if speculators are taking a “wait and see” attitude.  Friday’s (monthly) options expiration is an enigma, with equal weighting of puts and calls all the way down to 4350.00.

ZeroHedge reports, “Having come dangerously close to dropping 6 days in a row, the longest streak since Feb 2020, US stock-index futures and European stocks hugged the unchanged line on Tuesday after rebounding furiously in the last hour of trading on Monday ahead of key CPI data that is expected to show a fourth month of U.S. inflation at 5% or more, and which will shape investor expectations about the likely timing of the Fed taper. S&P 500 E-minis were up 2 points, or 0.04%, at 07:15 am ET. Dow E-minis were up 10 points, or 0.03%, while Nasdaq 100 E-minis were down 2.75 points, or 0.02%. Treasury yields and the dollar were steady.”

At 8:37 ZeroHedge observes, “As anxiety over the timing of the taper (not the if but the when) rise, all eyes are anchored on this morning’s CPI (which was expected to rise MoM again but drop marginally on a YoY basis). Both headline (+0.3% MoM vs +0.4% MoM exp) and core (+0.1% MoM vs +0.3% MoM exp) CPI printed below expectations but on a YoY basis headline CPI rose 5.3% – as expected.

Source: Bloomberg

That is the 15th straight monthly rise in consumer prices and the fourth straight month above 5% on a YoY basis. On a side note, this is the first time MoM CPI printed below expectations since November 2020.

Core CPI slowed from +4.3% YoY to +4.0% YoY (well below the +4.2% YoY exp)…”


I must rescue a dame in distress (my daughter) this morning.  I hope my webmaster will find a solution to m problem.


Posted in Published | 3 Comments

September 13, 2021

12:50pm

SPX has dropped to 4453.63, a new low nad beneath the trendline at 4463.58.  This is a chart sell signal, having broken the Ending Diagonal formation to the downside. The 50-daqy Moving Average is at 4421.45 and is the next support level.  Most chartists use the 50-day Mofving Average as their sell signal.  I suggest that the accumulation of indicators tell us we may not wish to wait that long.

VIX is at 20.02, above the mid-Cycle support at 19.836 and on a confirmed buy signal.  Most chartists us the number 25.00 as their buy/sell signal.  There is an inverted Head & Shoulders neckline at 24.74, so be sure to be long above that number.

The NYS HiLo Index opened at 50.00 and rose to 91.00.  It appears that smaller companies are attracting speculators who feel they have a chance for a profit here.  Of course, the Hi-Lo closing number is what counts and, since there is a lag in the counting system, we won’t know the final number until tomorrow.

I am researching the source of my inability to show certain charts.  The problem seems to lie with WordPress.  I may have to change platforms.


8:00 am

Good Morning!

I wish to report a troubling situation with WordPress.  It refuses to allow any images of SPX to be presented.  I will use the DJIA as a model despite the fact that there are some differences.  For example, the DJIA topped out on August 16, while the SPX topped on September 2.  It still makes sense, since the point of origin for this Cycle in the Dow  was January 14, 2000, while the point of origin for the SPX was March 23, 2000.  Here we see the all-time highs within just a few weeks of each other.  The NDX ATH was on September 7, 2021.

In any event, we see the DJIA futures in a probable retracement bounce to its 50-day Moving Average at 34992.42.  SPX futures, still dominated by the unwind from options expiration is likely to bounce back to 4500.00 as the short positions are unwound.  Short-term resistance is at 4511.09 as a possible alternate resistance.

ZeroHedge reports, “World stocks ground higher with US futures and European stocks all in the green after a slow start of the week in Asia, amid concerns over accelerating inflation as well as tax and regulatory pressures on the world’s biggest companies. After five straight day of declines in US stocks, as concerns over the delta variant and tapering of the stimulus cooled risk appetite, and which led Wall Street indexes to lose between 1.6% to 2.2% last week as a surge in August producer prices and a sharp drop in jobless claims spurred fears the Federal Reserve could start unwinding stimulus as soon November, futures on major U.S. equity indexes all rose on Monday as traders await tomorrow’s CPI data. S&P 500 E-minis were up 23.50 points, or 0.53% at 730 am ET, Dow E-minis were up 200 points, or 0.58%, while Nasdaq 100 E-minis were up 78.25 points, or 0.51%. Industrial metals rose, with aluminum reaching $3,000 a ton in London for the first time in 13 years amid supply disruptions.”


VIX futures declined to 19.10 this morning.  There is critical support at 17.88, just above the 50-day Moving Average.  However, the Wave structure may not allow that deep a correction.  We will know shortly.


TNX is another chart that has been cut off by WordPress last Friday.  The Cycles Model suggests a week-long decline into its probable Master Cycle low.


Posted in Published | Comments Off on September 13, 2021

September 10, 2021

4:00 pm

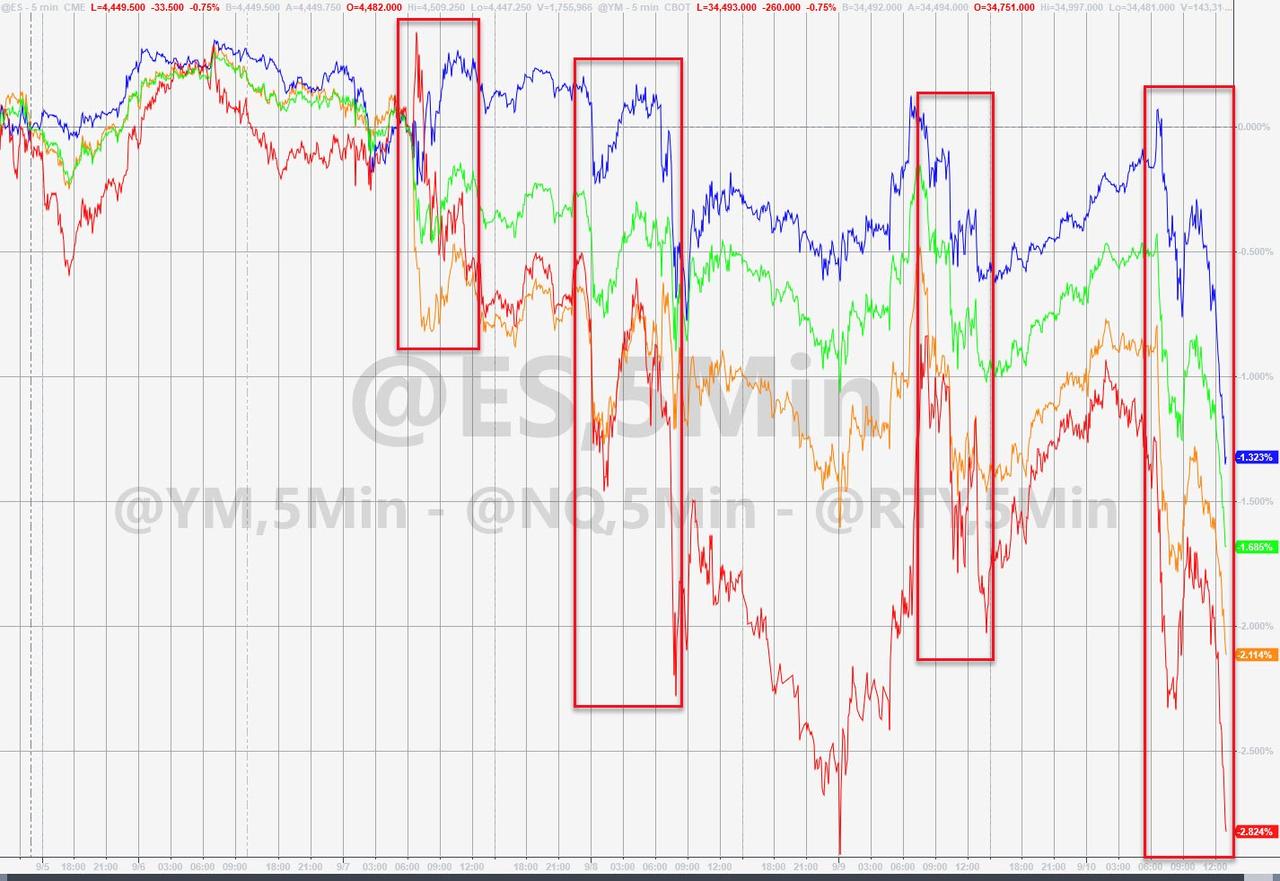
SPX gave us a probable sell signal, pending results which may not come in until Monday morning.  Most analysts are expecting a 10% decline.  However, we have 43 calendar days (30 market days) of decline as opposed to 22 market days in the March 2020 decline.  The initial target is the 2020 low.  Good luck and good trading!

ZeroHedge observes, “The S&P just suffered its worst week since mid-June…Small Caps were the biggest losers this week. Nasdaq was the least bad horse in the glue factory…

…threatening to make September the first loss-making month since January…”


1:10 pm

I adjusted the Ending Diagonal trendline down to 4460.00, which is also the location of the Intermediate-Tern support to serve as the trigger for a sell signal.  While the VIX remains elevated, the Hi-Lo Index is still rich (105.00).  Admittedly the first major group of put contracts is at 447.00 in the SPY, equivalent to 4470.00-4475.00 in the SPX.  However, the panic button may not be pushed until larger losses are made, so 4460.00 is likely where the dealers begin to panic.

Monday is when the dealers unwind their (mostly long) hedges, so it may still be wise to have an aggressive short position, even if the market stabilizes.


10:45 am

Still not geting charts.  SPY (448.20) is at the Max Pain level.  However, at 447.00, puts put contracs out number calls 25310 to 2537.  The slippery slope starts here.

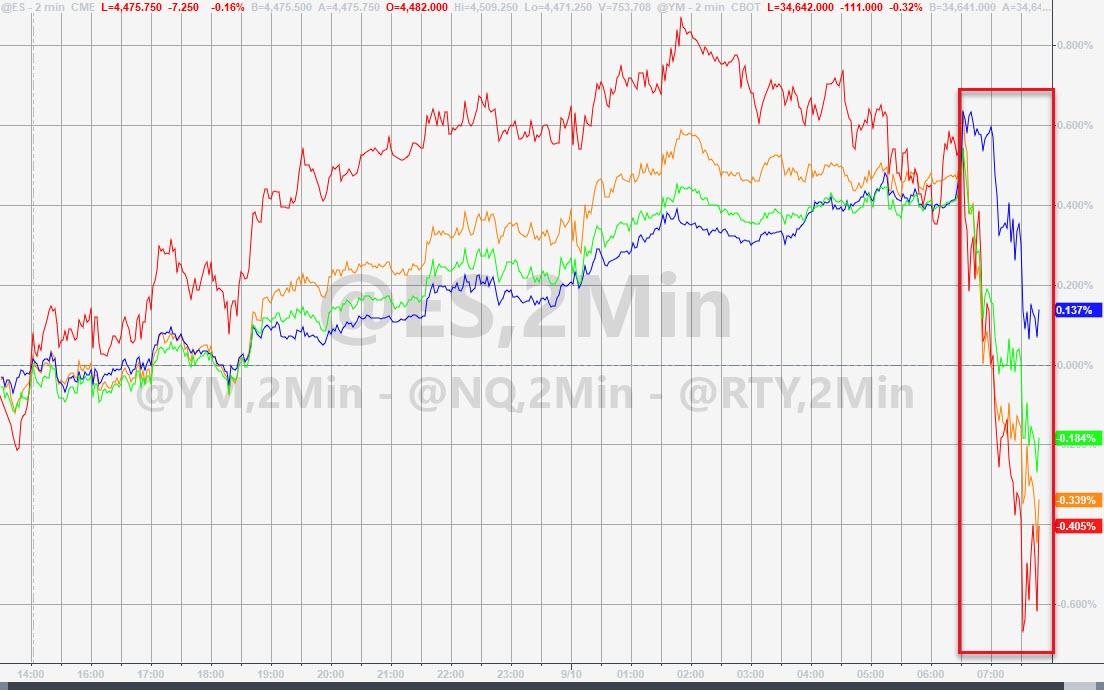
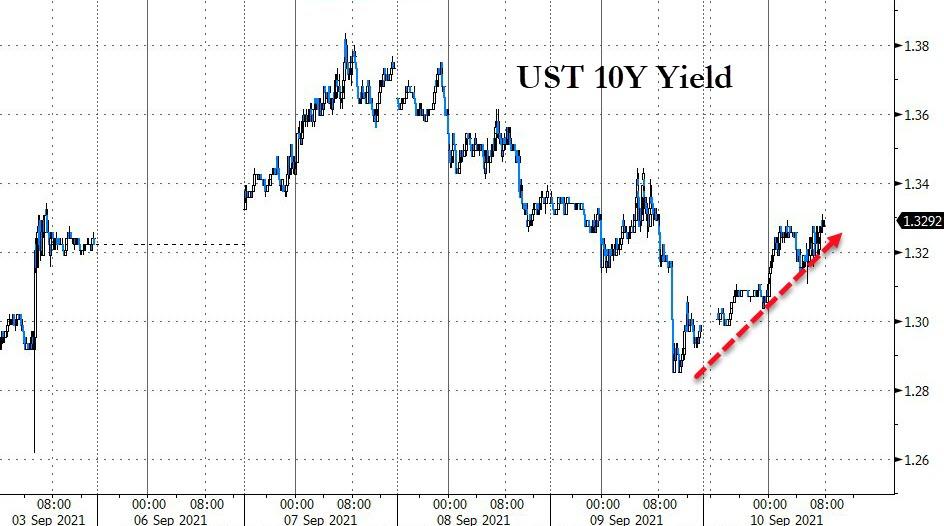
ZeroHedge observes, “Equity markets were higher overnight heading into the cash open… but that’s over now…

Bonds are also being sold, yields bouncing higher off payrolls low…”

7:50 am

Good Morning!

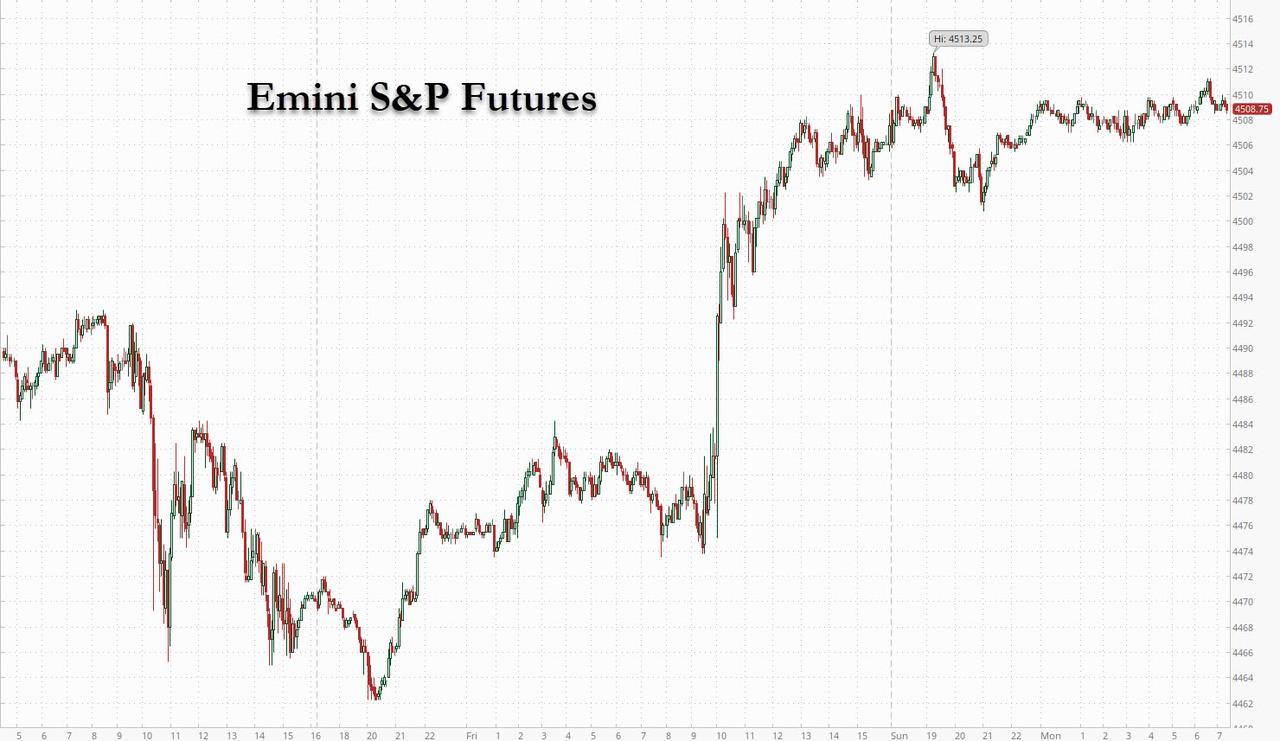
I am unable to load charts on to word press this morning.  It appears that SPX futures have completed their retracement to 4514.00, just shy of the 61.8% Fib retracement and may start the decline at the open, if not sooner.  Today’s options espiration is a minefield with puts dominating calls at 4500 and below.  Keep that in mind.   The Trendline at 4475.00 carries the sell signal.

ZeroHedge reports, “Global stocks rose and S&P futures rebounded from a freak selling episode late on Thursday after news that Joe Biden and Chinese leader Xi Jinping held a phone call, prompting speculation of detente between the two superpowers. Additionally, investor concerns eased about central bank stimulus (after the ECB launched a non-taper taper) and China’s regulatory crackdown. At 7:15am ET, S&P futures were up 0.4% or 19.50 points to just above 4,500; Dow futures were up 0.52% and Nasdaq futures were up  0.43%. The 10-year Treasury yield rose 3bps to 1.320%, oil was back over $69 a barrel and gold gained.”

Posted in Published | Comments Off on September 10, 2021

September 9, 2021

7:45 am

Good Morning!

I am dealing with a sprained wrist in a cast, which may explain possible typos in the text.

The September 2 high at 4545.85 on Day 267 remains the high for this Master Cycle.

SPX futures have weakened overnight, dropping to a low of 4487.30.  Friday’s options expiration shows an open interest in calls at 5052 while the open interest in puts is at 8549 at 4500.00.  The gap grows  larger as you go down the strikes beneath that level, especially starting at 4485.00.  The slippery slope begins there.

ZeroHedge repors, “US index futures fell along with European stocks amid jitters that the ECB could taper its asset purchases today as well as growing concerns over the slowing economic recovery while China’s ongoing regulatory crackdown on the tech sector weighed on sentiment. Nasdaq 100 and S&P 500 futures were each down 0.2%, but off worst levels, hinting at further losses after the underlying indexes dropped on Wednesday. Europe’s equity benchmark headed for a five-week low, while 10Y Treasury yields dropped along with the dollar. The dollar dropped, the euro snapped three days of losses and European bond yields steadied ahead of a European Central Bank policy announcement in which investors will be looking for information about bond buying plans for the fourth quarter. Treasuries advanced.”


INDU futures dropped to 34792.10, beneath its 50-day Moving Average at 34998.29.  Note that the high of  35510.70 was made on August 30.  Wave 5 of (5) appears to be truncated.  The probability of a new high lessens the longer the Dow stays beneath its 50-day.  Friday’s options expiration is also day 275 in the Master Cycle, should the attempt be made.  Cycles lasing that long are a rarity, so that option grows dimmer as the day progresses.


NDX futures declined to 15547.00 in the early morning session.  Cycle Top support is at 15574.77.  A breach of that level after being above it for a week is an aggressive sell.  The all-time high of 15701.40 was made on Tuesday, Spetember 7.

ZeroHedge comments, “A seesawing overnight session, and stocks within a point or two of record highs, hides the fact that market internals continue to weaken.

As RealInvestmentAdvice.com warns, Bob Farrell’s rule #5 states:

“The public buys the most at the top and least at the bottom.”

The graph below from Longview Economics speaks volumes for where the equity markets are in the investment cycle based on Bob’s logic.


VIX futures made a new high at 19.54 before settling down, still above yesterday’s close.  It is on a buy signal, but SPX is not yet confirmed, as the Hi-Lo closed at 60.00 yesterday.  Today’s options expiration in the VIX is telling.   At yesterday’s close open interest was  167,504 puts, vs 24,261 call contracts.  Open interest in calls doesn’t emerge until 22.00, where 64,667 calls dominate 42,998 puts.  Max Pain appears to be at 20.00.


TNX appears to have bounced off the 50-day Moving Averagee at 3.07, but is stalled beneath mid-Cycle resistance at 13.93.  The August 4 low at 11.29 appears to be a truncated Wave 5, but with less than two weeks to go to the Master Cycle terminus, it’s a toss-up on which direction TNX will take.

ZeroHedge reports, “While there was no way today’s 10Y auction could surpass last month’s stunning, blowout, record 10Y auction, today’s sale of $38BN in ten-year paper (down from $41BN last month) was not that much worse.

The auction priced at a remarkable 1.338% – remarkable not only because the yield was a drop from last month’s already stellar 1.34%, making it the lowest 10Y yield since February’s 1.155%, but because the auction stopped through the When Issued 1.352% by a whopping 1.4 bps, making this the fifth consecutive stopping through auction, the longest such stretch in recent history.

While the bid to cover of 2.59 was a modest drop from last month’s blockbuster 2.65, excluding the August blowout auction it was the highest BtC since July 2020. Naturally it was far higher than the six-auction average of 2.47.”


USD futures slipped beneath the 50-day Moving Average at 92.60 in the overnight session.  The options chain in UUP favors the puts by 821 to 100 open call contracts.  The Cycles Model suggests a strengthening USD up to the close of the Master cycle in two weeks.


Posted in Published | Comments Off on September 9, 2021

September 8, 2021

1:42 pm

Today’s action brings us to a pivot point in the charts.  NDX edged to a new all-time high at 15701.40 yesterday while completing an impulsive pattern.  SPX kept its September 2 high at 4545.85 with a sloppy pattern but both sold off to important pivots in regard to today’s and Friday’s options expirations.  For today,  open interest is 1587 call contracts to 1089 put contracts at 4525.00.  At 4500.00, open interest in puts outweigh calls 5341 to 2486.  Should SPX decline beneath 4500.00, gamma forces may outweigh any liquidity injection.  At 4475.00 open interest in puts outweigh calls by 5500 contracts!

It gets more difficult on Friday, as put and call contracts are almost dead even at 4525.00.  At 4500.00 puts outweigh calls by 3474 contracts, while at 4550.00 calls outweight puts by 7764 contracts!

At this point, SPX must maintain Max Pain status beneath 4525.00 and above 4500.00.  Friday’s Max Pain is at 4525.00.  Any deviation above those levels may incite a throw-over, while beneath thos levels begins the bear market.

ZeroHedge reports, “Morgan Stanley, Bank of America, Deutsche Bank, Citigroup, Credit Suisse And Goldman Sachs.

These are some of the biggest Wall Street banks that have issued “red alert” warnings on the US stock market in just the past few days, with some expecting an imminent correction of 10-20%, while others expect a slow burning drift lower over the next few months. Below we summarize the highlights of their surprisingly downbeat views.”


8:20 am

Good Morning!

SPX futures are lower this morning, most likely on their way to Intermediate-term support at 4450.00.  The Next two weeks will be critical, with a potential reversal at any time.  However, it may still have one more surge to the Cycle Top at 4601.80, at a minimum.  It may also “throw over” to as high as 4822.00 in a spectacular show of speculative frenzy as the fear of missing out prevails.

ZeroHedge reports, “World stocks receded from the previous session’s record highs, European stocks were headed for the biggest decline in almost three weeks and US futures were set for a third straight day of losses on Wednesday with the global growth outlook coming under increasing pressure while the dollar hit one-week highs and 10Y yields dipped as investors reduced exposure to riskier assets. S&P futures briefly fell 0.5%, tipping below 4,500 before, recovering losses after the S&P 500 fell 0.34% on Tuesday, while Dow futures were flat and Nasdaq emini futs were fractionally in the red as banks from Morgan Stanley to Citigroup turned cautious on US equities.”


VIX futures reached a high of 19.63 before coming back down to 18.24.  We amay see a rising VIX alongside a rising SPX in the final surge.  So, although the VIX is above its 50-day Moving Average, we still need confirmation from the Hi-Lo Index.  Otherwise the top trendline of the Ending Diagonal at 21.00 or the neckline of the Head & Shoulders may act as a trigger for an SPX sell signal.  In the meantime, the VIX itself is on a buy signal.


TNX futures pulled back this morning and may tag the 50-day Moving Average at 13.14 before moving higher.  TNX may have a show of strength in the latter half of the week which may continue through options week.


Posted in Published | Comments Off on September 8, 2021

September7, 2021

8:05 am

Good Morning!

I spent the week in St.Louis with my mother who was in the hospital.  When I arrived, there were doubts about her condition, which is inoperable for a 90-year ole woman with a heart condition.  However, she rallied and was released on Friday.  The next milestone is her 91st birthday in October, wich I plan to attend.


SPX futures rallied this morning to a high of 4545.40, on their way to 4555.00-4560.00.  The current Fibonacci level is 4541.00, so thee is stiff resistance above that level.  SPX must complete its pattern with a derivative of five Waves.  The sequence is 5, 9, 13, 17… There are currently 7 Waves, so another probe higher may complete the pattern.  The 21.5-year Cycle (258 months) from March 23, 2000 ends on September 23.  The 258th month will reach its halfway point tomorrow, so we may look for a reversal at any time.  Today is day 272 of the current Master Cycle.

ZeroHedge reports, “European bourses dipped in the red and a rally in US equity futures which traded near all-time highs after the Labor Day holiday fizzled, as  investors weighed China’s better-than-forecast trade data against the growing likelihood of fading central-bank support. S&P500 futures traded fractionally in the green and Nasdaq 100 indexes slipped and equity gains in China and Japan were followed by losses in Europe as investors speculated the ECB may get ready to roll back stimulus. The dollar and Treasuries yields rose, gold and cryptos dropped.”


VIX futures rose to a weekend high of 17.40, above the 50-day Moving Average at 17.28.  This has the potential of an aggressive buy signal, provided the Hi-Lo Index goes lower.  The Hi-Lo Index closed at 171.00 on Friday.

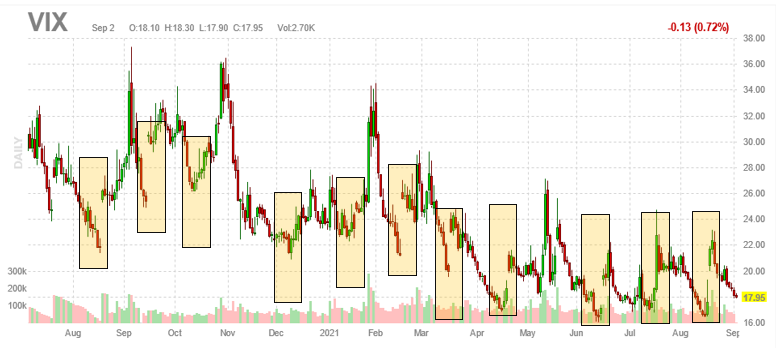
RealInvewstmentAdvice comments, “Will the mid-month VIX pattern hold yet again?

The graph of the VIX (volatility) below highlights a fairly reliable pattern that has been occurring mid-month for the last year. As shown, VIX tends to decline into the middle part of most months, rally sharply for a few days, and head lower again. The pattern has been especially pronounced the last three months.  One likely cause is the combination of mid-month options expiration and low volumes. The volume of trades needed to cover and roll options contracts may be enough to push volatility higher at these times.

September is thus far looking to repeat the pattern. A nice short-term trade may again occur if VIX approaches the 16.00-16.50 range later next week. 16 has been the recent floor so if you do get long the VIX and try to take advantage of the pattern, keep risk targets in place below 16.”

employment markets data, Markets Go Nowhere On Weak Employment Data


TNX may be on the verge of a breakout, reachign 13.72, just shy of its prior high at 13.75.  Mid-Cycle resistance is at 13.78, so that might be a more reliable focal point for a breakout.  TNX has only two weeks to its next Master Cycle high., which may break out abov ehte Cycle Top resistance at 18.43.


USD futures are primed for a reversal, with only two more weeks until its Master Cycle high.  It looks like September is going to be an active month. for the USD and TNX.


Posted in Published | Comments Off on September7, 2021

August 30, 2021

3:33 pm

Note:  I have booked an early morning flight to see my mother, who was admitted to the hospital Sunday afternoon.  The needed surgery to correct her condition may not be possible, since her cardiologist is concerned that her heart is too weak to handle that kind of stress.  Their aim is to stabilize her and probably send her home until the next episode.  Although I call her weekly, I think its time to be with her in person.  My apologies, but I may not be blogging until Friday, at the earliest.

As for the SPX, I have run out of  perceivable extensions with Wave (v) at 1.33 times the size of Wave (i).  The SPX is much like the dry tinder on the western forests.  The Fed can be compared to the US Forest Service, ignoring risks and taking the easy way out, until ignition.  Now the /Western forests are out of control with billions in collateral damage.

Take care!  I personally have placed my money anticipating a very large decline.  The next Master Cycle is not due until mid-October.


9:20 am

Note: I have received information that my 90-year-old mother is hospitalized, condition unknown.  I may have to leave for an indefinite period of time to be with her.

SPX futures hit a weekend high of 4516.50, which tells us there may be more.  As of Friday, the new target is 4520.00, where Wave (v) of [v] is equal to Wave (i) of [v].  It may go higher.  There seems to be an upper limit of 4537.00, due to possible structural limitations.  Today is day 264 of the current Master Cycle.

ZeroHedge reports, “After stocks closed on Friday at their 52nd record high of the year, when Powell’s unexpecteldy dovish Jackson Hole sparked a meltup in risk assets and a meltdown in the dollar, on Monday all indications are that we will get the 53rd record high with 2021 set to have a record number of all time highs. At 7:30 a.m. ET, Dow e-minis were up 10 points, or 0.03%, S&P 500 e-minis were up 3.50 points, or 0.07%, and Nasdaq 100 e-minis were up 16.25 points, or 0.11%. Oil dropped then gain, the dollar rebounded from Friday’s mauling and precious metals continued their ramp higher.”


VIX futures are rising, but still beneath the 50-day Moving Average at 17.40.  VIX may have made its retracement low at 16.11, but not confirmed.


TNX is lower this morning and may be reaching it retracement limit.  The Cycles Model suggests a possible burst of strength today.  If so, it may set off a 3-week rally to a new high.  Stand by for a reversal coming soon.


Posted in Published | Comments Off on August 30, 2021

August 27, 2021

1:47 pm

It originally appeared that the SPX at 4500.00 met all the requirements for the rally.  But the Fed will not allow a sell-off before Jackson Hole.  The revised target is now 4520.00 (+/-).  Today is day 261 in te Master Cycle.


8:15 am

Good Morning!

SPX futures tested Short-term support at 4464.98 by declining to 4466.90 in the overnight session.  It has bounced from that support to 4487.40, an approximate 61.8% retracement.  Of course, the SPX may bounce higher, but it may have fulfilled its retracement requirements.

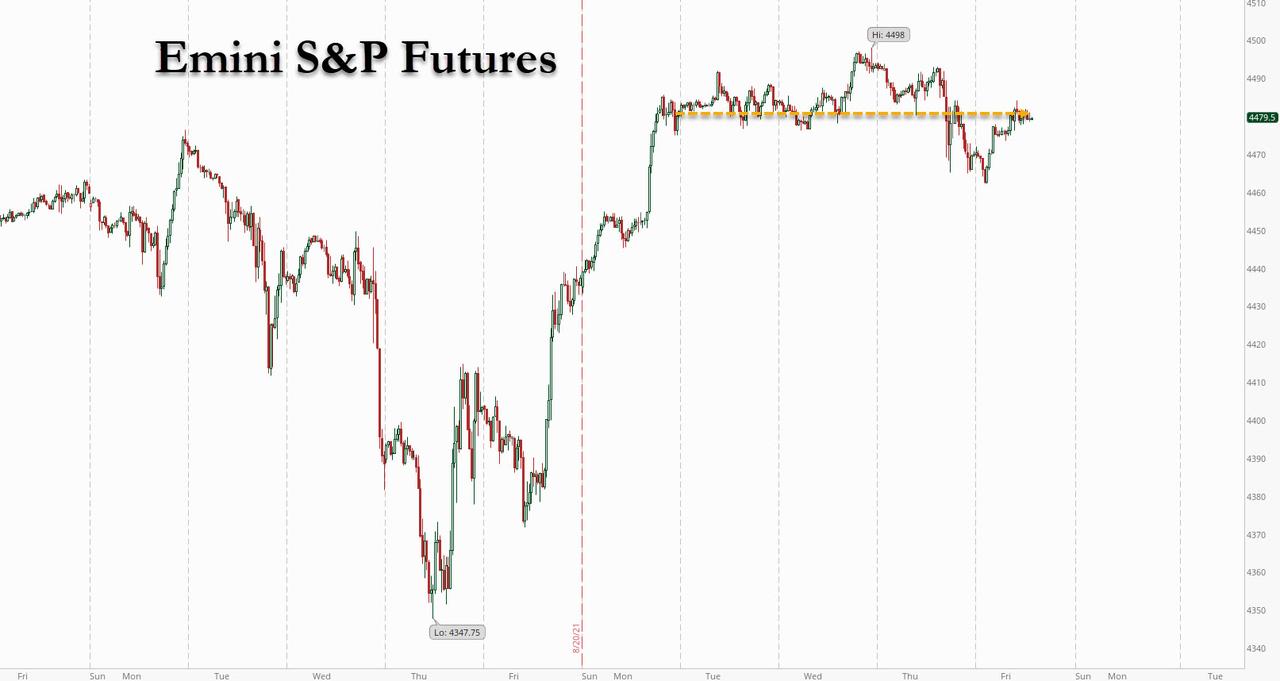
ZeroHedge reports, “US equity futures are trading where they were on Monday evening, having flatlined in a narrow, boring 20-points range on either side of 4480 for the past week, as virtually nobody wanted to take on any major new positions ahead of Jackson Hole. Well, the good news is that in less than 3 hours, J-Powell’s much overhyped speech at J-Hole where he will barely – if at all – mention the taper is almost behind us which hopefully should unlock some volatility in markets. At 700am, S&P futures were up 12.50 or 0.3% to 4479, Dow futures were up 80 to 0.22% and Nasdaq futures were up 50 or 0.33%. Treasury yields dipped, the dollar was flat and bitcoin was flat around $47,500.”


VIX futures declined to a low of  17.66 (an approximate 58% retracement) before bouncing back toward 18.00.  Volatility may be about to be set loose as Powell’s speech disappoints.

ZeroHedge advises, “It appears the investment world is starting to wake up to a message that we have been screaming from rooftops for more than 10 years : the Fed has boxed itself into the largest asset bubble in history.

And there’s no obvious way out.

Since 2009 we have been raising critical questions about how long the Fed would be able to kick the can down the road with its monetary policy, but even we could have never predicted the size and scope that QE would eventually mutate into.

With our Central Bank just casually doubling its balance sheet (and nearly the money supply) in the course of under two years, all markets – housing, bonds, stocks, consumer pricing – have screamed to new highs with no signs of stopping.

As each day goes by, it’ll slowly become more apparent to the public, the investment world and yes, even the rocket surgeons at the Fed, that the notion of bringing the economy in for a “soft landing” from this bubble is going to be far more difficult than ever imagined (assuming the Fed actually ever pondered the situation, which it likely hasn’t). That is to say, it could even be downright impossible.”


TNX sits atop its 50-day Moving Average at 13.35, waiting for the spike that will boost it above the remainder of its resistance zone.  It may drift lower until investors begin to realize that the Fed’s power over rates is overrated, if not non-existent.  The Cycles Model suggests that the 10-year yield may reach 20.00 by late September.  An alternate date may be mid-October.


USD futures appear to be consolidating in range this morning.  There may be a furhter pullback while it appears to be due for a trading Cycle low.  The Cycles zmodel suggests that strength may come back next week and last through options week.


West Texas Intermediate Crude rose to 69.05 this morning as it retraces to 50-day resistance at 70.68.  Today may be a show of strength with another two weeks of possible rally before a reversal, according to the Cycle Model.  The ensuing decline may last through the end of November.

Posted in Published | Comments Off on August 27, 2021