The Lord’s Prayer
Our Father, who art in heaven, hallowed be thy name. Thy Kingdom come, Thy Will be done, on earth as it is in heaven. Give us this day our daily bread and forgive us our trespasses, as we forgive those who trespass against us. And lead us not into temptation, but deliver us from evil. Amen.
10:41 am

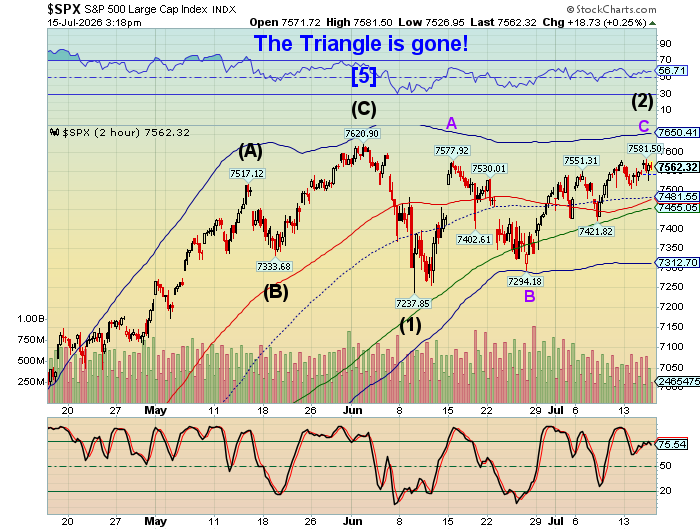
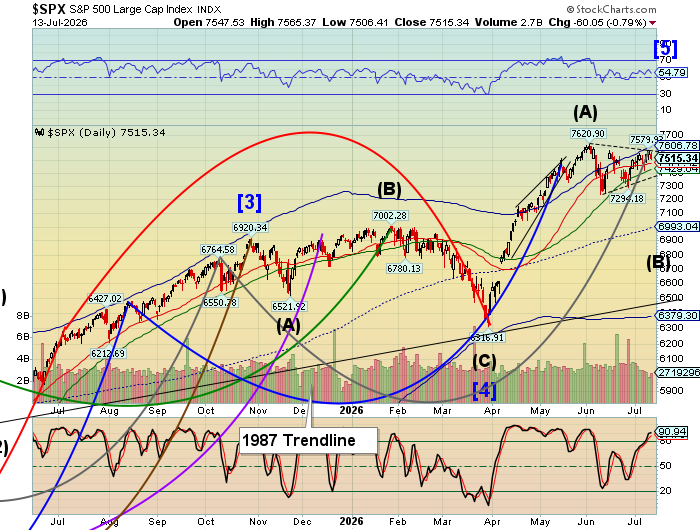
SPX may have reversed from its high to test round number support at 7500.00. A further decline beneath 7500.00 may offer an aggressive sell signal.
10:33 am

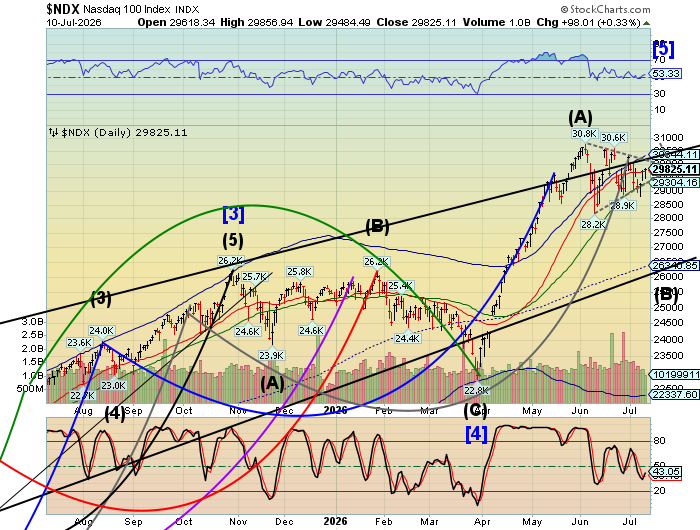
While the SPX is nudging its upper Triangle trendline, the NDX has already pierced its lower Triangle trendline and bounced. What follows may be a possible panic decline toward 27000.00, as all of the recent leveraged longs and ETFs may have to be unwound. A further decline beneath the 52-dau Moving Average and lower trendline at 29352.45 may announce the beginning of a rapid descent.
8:15 am

Good Morning!
SPX futures are hovering beneath the Triangle trendline at 7545.00 this morning. Investors are buying the dip in unprecedented volume as if there is no tomorrow, especially using leveraged ETFs to double down on anticipated gains. The Cycles Model calls for a “speed bump” that may rattle their resolve, suggesting a downdraft , possibly to 7200.00 or lower. This is not the beginning of a bear market, but may be the beginning of the end of the bull market.
ZeroHedge reports, “US equity futures are flat on the final trading session of the week, with Tech lagging, as traders hold off on big bets ahead of the weekend, with the fragile truce in the Middle East keeping geopolitical risk front of mind.”

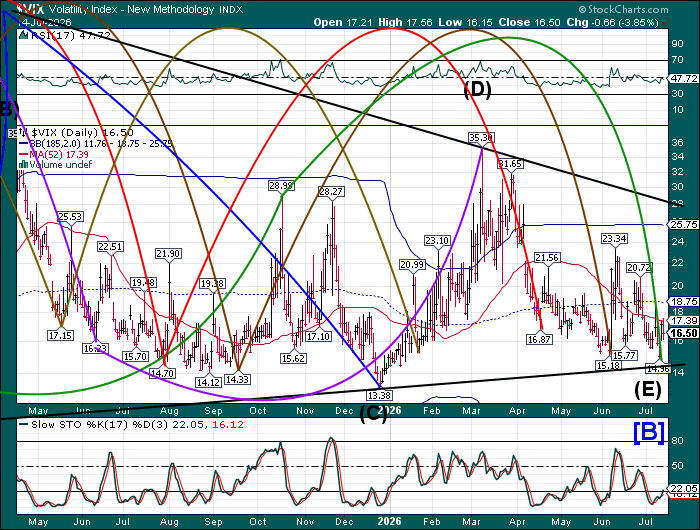
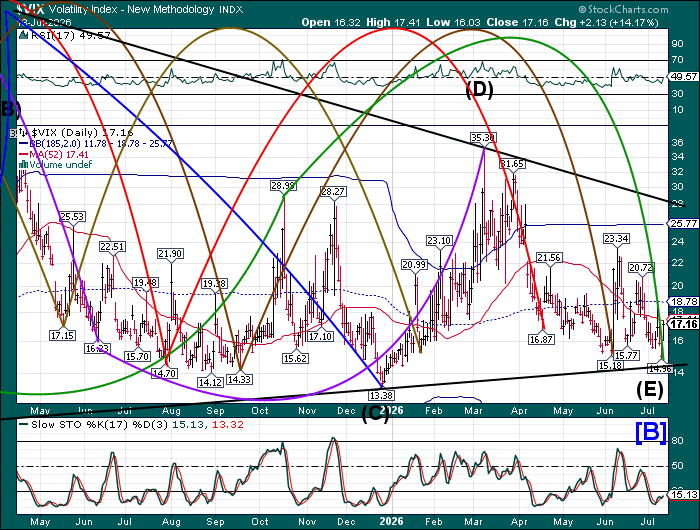
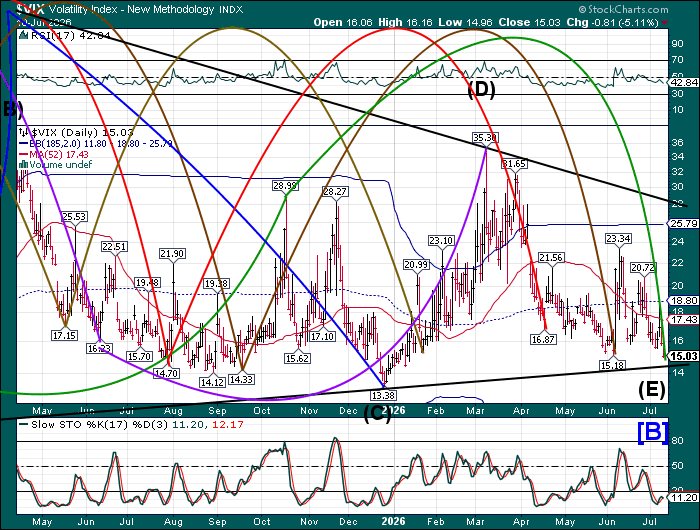
The premarket VIX is hovering near its July 6 low at 15.56 this morning. However, it may be due for a powerful reversal to test the Cycle Top at 25.79 or the upper trendline of the Triangle formation at 27.50 in the next week or so. The Cycles Model suggests it may be a very dynamic week.
ZeroHedge remarks, “Goldman Sachs’ volatility desk made the following comment:
“With the VIX back to its lowest levels in more than a month, our Vol desk is focused on hedging opportunities as 1-month S&P implied correlation is near its lowest level in 20 years.”
Simply, a low VIX can convey a sense of market calm on the surface, yet implied correlation tells a different story.”

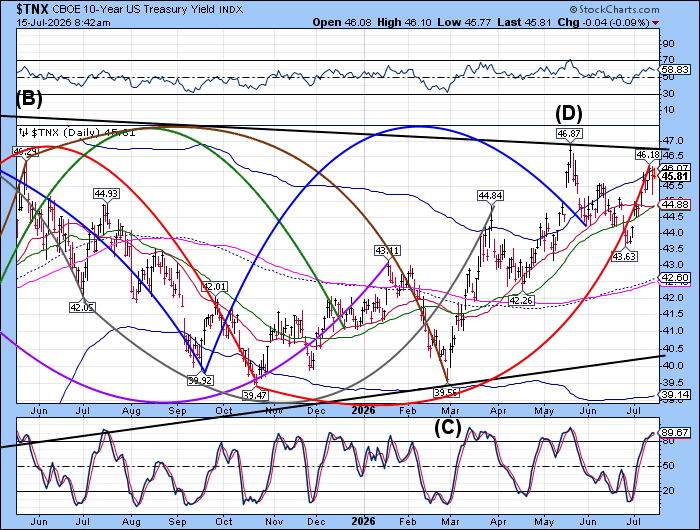
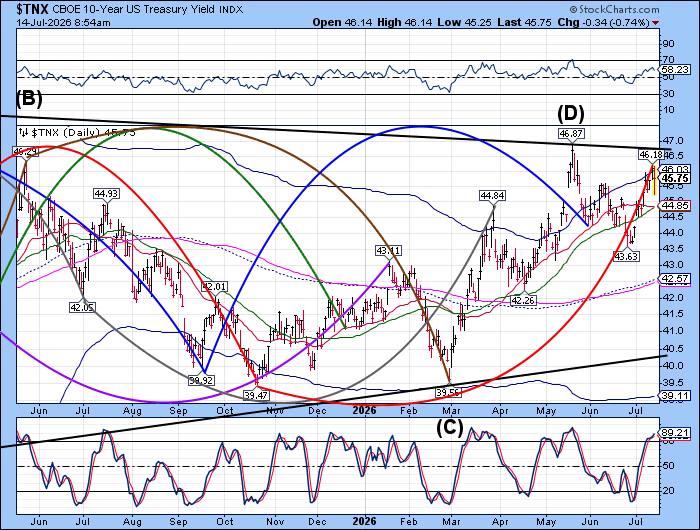
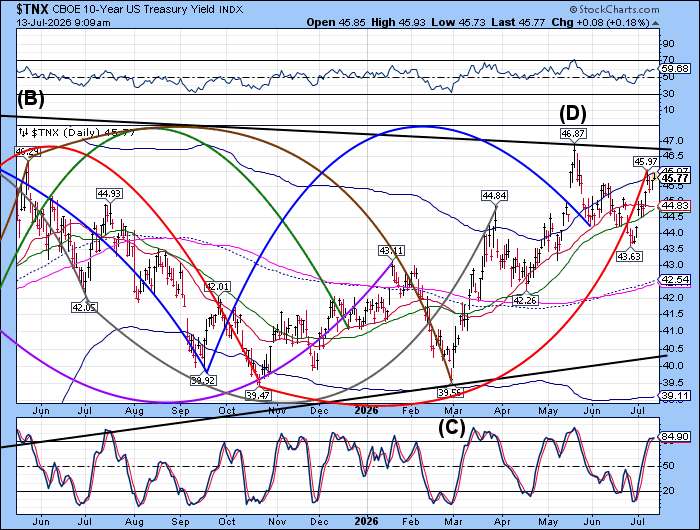
The US 10-year Bond Yield declined to 45.21 this morning with the cash market not far behind it. Thursday’s high may have marked the end of the Master Cycle. The new Master Cycle is dur to decline until early September, making this decline a strong one. The Model emphasizes a strong beginning this weekend the may change the current aggressive sell signal to confirmed beneath the 52-day Moving Average at 44.72.
ZeroHedge observes, “On the heels of yesterday’s stellar 10Y auction, this afternoon saw an even more stellar-er 30Y auction with the US government selling $22 billion bonds at 5.058%, the highest result since 2007, vs a 5.061% when-issued yield at the 1 p.m. New York time bidding deadline.”

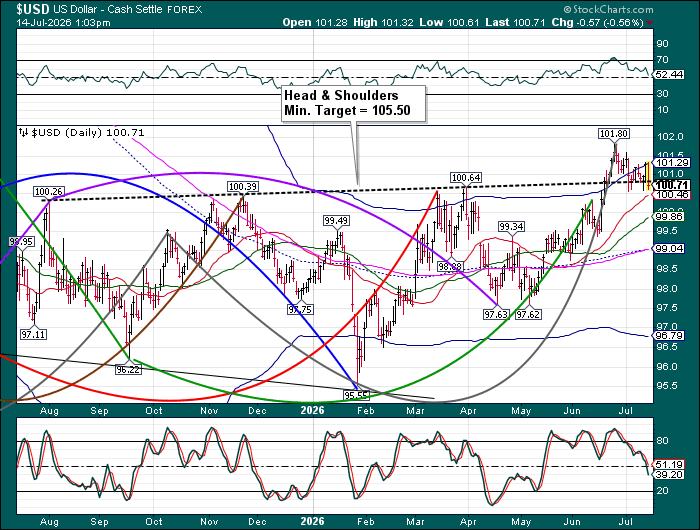
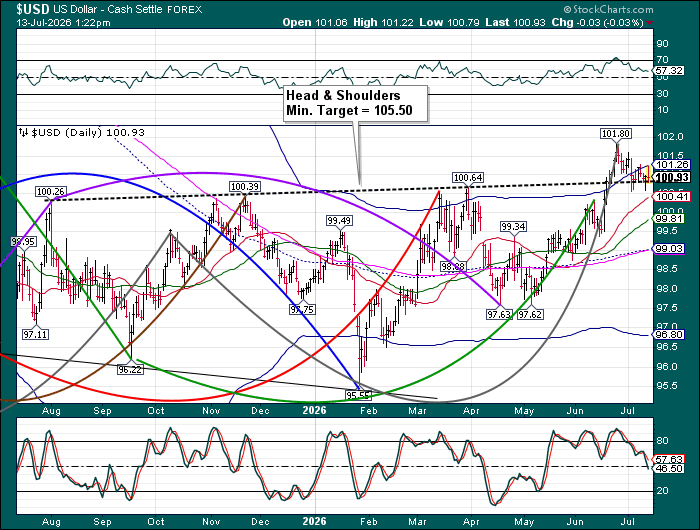
The US Dollar challenged the Head & Shoulders neckline at 100.80 and emerged back above it. Should it remain above the neckline, the USD may extend its rally to early August. In doing so, it may fulfil the Head & Shoulders target at 105.50. An analysis of the higher degree USD profile suggests the target may extend to 108.00. Dollar shorts are on tenderhooks.

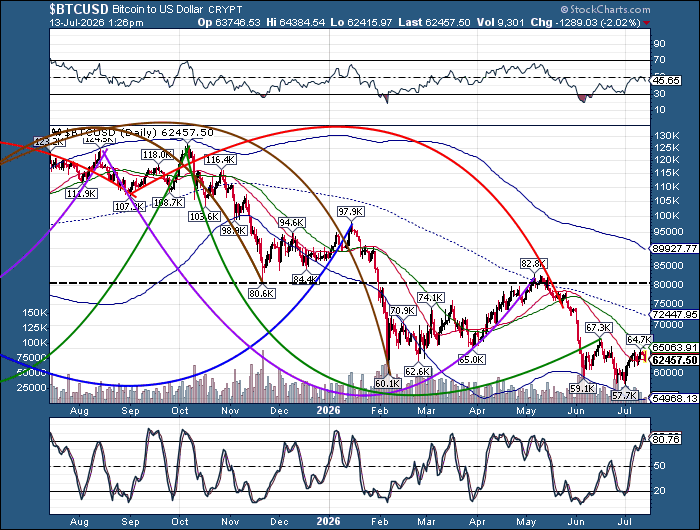
Bitcoin has made an attempt at a new high this morning, but failed. Despite the wide swings, the failure to make a new high leaves only one option…a further decline. The Cycles Model infers the decline may continue to early August. The first line of defense against the decline occurs at the Cycle Bottom at 54966.00. Lower potential supports occur at 50000.00 and 45000.00.
ZeroHedge remarks, “New Hampshire’s Executive Council narrowly rejected a proposal Wednesday that would have authorized a $100 million Bitcoin-backed bond, ending what supporters hoped would make the state a pioneer in digital asset finance, according to Bitcoin Magazine.”

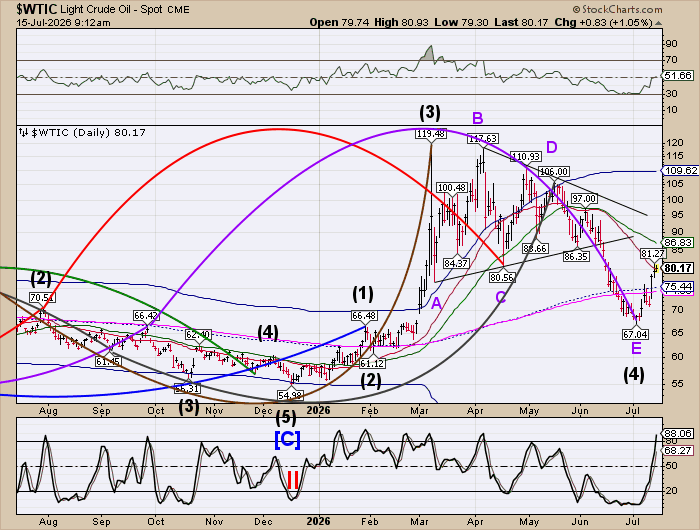
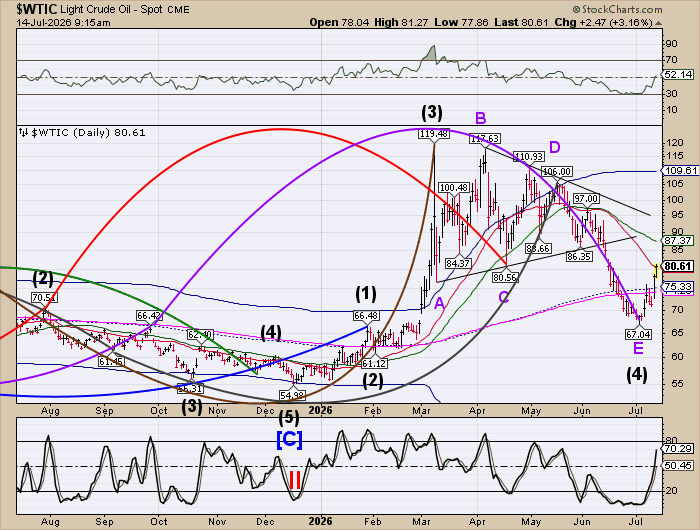
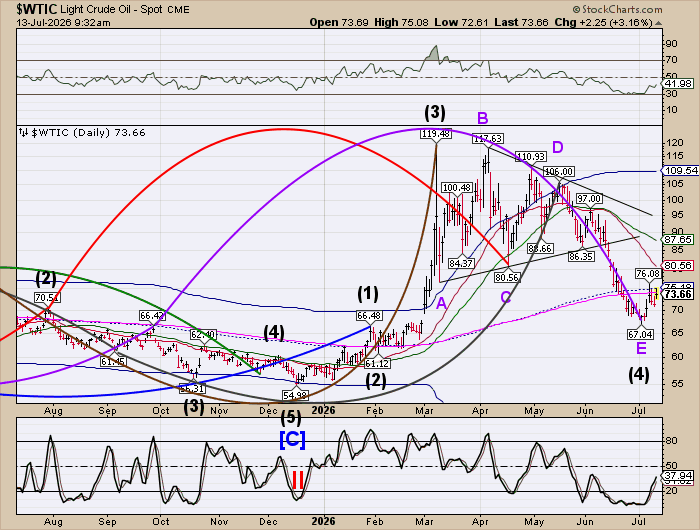
Crude oil has made a 54% retracement of its reversal from the Master Cycle low. While it may go lower, the retracement appears to be complete. Furthermore, the Cycles Model warns of increased volatility/strength beginning this weekend, as President Trump declared an end to the ceasefire. The new Master Cycle may be primed to accelerate higher to mid-August.

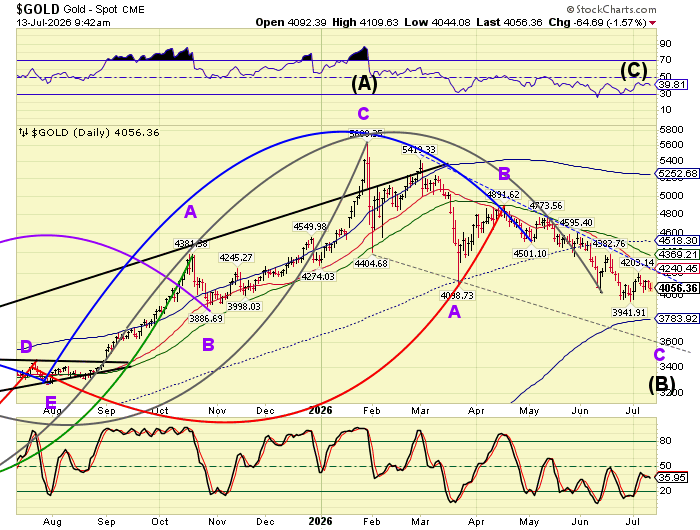
Gold is hovering as it prepares to finish its current Cycle. What is noteworthy is that trending strength is returning, suggesting the end may not be peaceful. The default support may be the Cycle Bottom at 3785.00, with a backup support at 3600.00, should the decline extend. The process may take up to a week to complete.
ZeroHedge remarks, “Gold’s break below key technical support of 4050 to the 4023 low in New York trading on Wednesday appears driven primarily by stop-loss liquidation and positioning rather than a material deterioration in macro fundamentals, according to UBS.”

The Ag Index may have begun its decline after extending its Master Cycle high until yesterday. There is no signal until it declines beneath its 52-day Moving Average at 359.86. The decline may only be 4 weeks long, but it may complete near the Cycle Bottom at 339.18.