September 8, 2023

12:43 pm

SPX has met the 50-day Moving Average target in the allotted time required.  The decline may resume shortly.


7:30 am

I am leaving early for a half-day event and may return for commentary this afternoon.

Good Morning!

SPX futures are positive and may lead to another attempt at the 50-day Moving Average at 4471.54 this morning.  The first hourly Cycle may be complete by mid-day, leaving the possibility of a resumption of the decline.

Today’s op-ex shows Maximum investor pain at 4455.00.  Long gamma starts at 4470.00 while short gamma begins ar 4450.00.  This is a very tight scenario.


VIX futures are consolidating this morning.  The Buy signal has been made.  Time to get busy.

ZeroHedge remarks, “The canary in the calm water…

Lou Mannheim and experienced seafarers know, calm waters never last forever. It has been the best of times from a volatility perspective over the past few months cross-assets and especially so in FX and equities. Astute readers of TME know that we now are leaning to being long equity volatility. Let’s have a look at some “best of times” charts and the canaries showing that it might be coming to an end.

Tight volatility regime

G10 volatility hit bottom in June; volatility regime prevailing since February 2022 is still in place, says Soc Gen.”


Posted in Published | Comments Off on September 8, 2023

September 7, 2023

8:00 am

Good Morning!

SPX futures have made a morning low at 4445.70 thus far, testing short-term support at 4444.00 (not shown on the daily chart).  It is on a sell signal with the next nearest visible support being the 100-day Moving Average at 4340.00 and the Head & Shoulders neckline at 4330.00.   A break of short-term support is likely to cascade down to the neckline.

Today’s op-ex reveals Maximum investor Pain at 4470.00.  Long gamma starts at 4480.00, while short gamma begins at 4440.00-4450.00.  While long gamma becomes less viable above 4500.00, Short gamma remains strong down to 4300.00 and possibly below.

ZeroHedge reports, “US stocks futures slumped, led by tech shares as Apple tumbled another 3% in premarket trading after Bloomberg reported that China – Apple’s biggest foreign market and global production base -seeks to expand a ban on the use of iPhones in sensitive departments to government-backed agencies and state companies. As of 730am ET, S&P futures were down 0.4%, while Nasdaq futures tumbled 0.7% as a 2% drop in Nvidia added to Apple’s woes. The dollar climbed to a six-month high and the yuan tumbled to the lowest level since 2007 as investors ramped up bets on further Fed policy tightening. Bond yields are lower, following the decline in European yields; commodities are also mostly lower with a modest decline in oil prices. Today, we get jobless claims data (exp. 234K, vs 228 prior), QSS and the revisions to Nonfarm Productivity and Unit Labor Costs. Keep an eye on the bond market moves following claims data. Fed’s Harker, Williams, Bostic, and Logan will speak today.”


NDX futures have plummeted to 15231.30 thus far, breaking through Intermediate support at 15266.93 and the 50-day Moving Average at 15214.00.  This action has created a confirmed sell signal in the NDX.  The next support is at 15120.00, but may not be likely to stop it.  The Head & Shoulders neckline is at 14550.00.  This decline may not be over until mid-October, so settle in to ride this decline out.

Today’s op-ex shows Maximum Pain at 15350.00.  Long gamma starts at 15400.00, while short gamma starts at 15300.00.  NDX may open deep in short gamma where there is little to stop the decline.

ZeroHedge remarks, “Apple – haven’t seen this in a while

The Apple China bear story continues today again. The stock is down almost 3% in pre market. That means Apple has gone from trading “well” above the 50 day moving average, to trading below the 100 day in 2 sessions. We haven’t seen that in a long time. Note the 200 day is down at 164 ish at the moment.

Source: Refinitiv

As Apple goes…

…goes the market? Apple remains the biggest “sentimentor” out there.


VIX futures have risen to 15.43 thus far, so there is no breakout yet.  However, it has given a confirmed buy signal yesterday by breaking above the 50-day Moving Average at 14.79.  The next hurdle to overcome is the long-term trendline at 18.00.  The Cycles Model shows trending strength in the VIX today.

Next Wednesday’s op-ex shows Max Pain at 14.00 with no short gamma.  Long gamma begins at 17.00 but does not have a lot of follow-through beyond 18.00.  Options investors are not prepared for a breakout in the VIX.


TNX futures have risen to 43.12 this morning and shows shows signs of strengthening as in may complete the current Master Cycle next week.  Don’t discount the Head & Shoulders formation.  The trend may remain until that target is met or exceeded.

ZeroHedge remarks, “The pressure on the Federal Reserve to relent on keeping rates higher for longer will become acute in the coming months as recession risk rises and inflation remains benign.

Recessions are rarely surprising, but they are often shocking. They are a feature of the business cycle and therefore their occurrence is to be expected. But their very nature means that the abruptness with which they occur is a shock that catches most people – and the market – unawares.

We are in a period now where the risk of a recessionary shock has risen and will continue to rise – right at the time when a soft or no-landing outcome has become the dominant narrative.”


Posted in Published | 1 Comment

September 6, 2023

1:55 pm

VIX has exceeded it 50-day Moving Average at 14.79, giving a confirmed buy signal.  This new Cycle may last into October.  Plan accordingly.


10:48 am

SPX declined beneath its 50-day Moving Average, producing a confirmed sell signal.  There may be push-back on this move, but the signal is clear.  Take appropriate action.


10:00 am

BKX, our liquidity proxy, has reversed from its Master Cycle high yesterday, day 260.  It has been on a sell signal since the end of July.  Yesterday’s rejection at the 50-day Moving Average reinforces the confirmed sell.  The Cycles Model suggests a potential decline to the October options expiration.

(Reuters) – U.S. lenders are holding onto large piles of cash as insurance against a slowing economy, continuing deposit outflows and looming tougher liquidity rules that could particularly impact mid-sized banks.

The buildup is another example of a risk-averse approach from a sector still trying to regain its footing after a string of springtime bank failures, one which could result in restrained lending.

“This is a logical response to a slowing economy and particularly to a scenario, where you’re seeing deposit outflows and you need to conserve cash,” said David Fanger, senior vice president at Moody’s rating agency.


7:45 am

Good Morning!

NDX futures slipped lower, to 15413.00 as it loses its grip on the rally.  Intermediate support lies at 15280.31 where a sell signal may be applied.  The correction reclaimed 77% of the July-August decline, leading investors to venture into long positions.   Should the above analysis be correct, they may regret that decision.

Today’s op-ex shows Maximum investor pain at 15620.00.  Long gamma has virtually disappeared while short gamma starts abruptly and strongly at 15600.00.  There is another large layer of puts at 15450.00.  Sentiment has definitely turned.

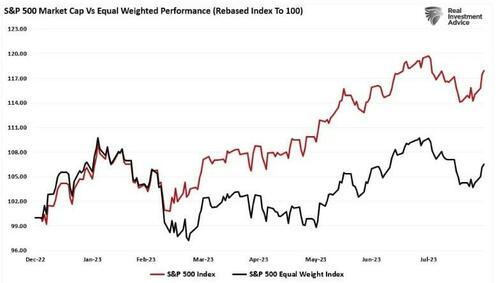
RealInvestmentAdvice points out, “Mega-cap stocks continue to dominate the market in 2023. The question is, why? After all, many other great companies have arguably much better valuations and fundamentals. Yet, those companies continue to lag the market’s overall returns as the bifurcation between the Mega-cap companies and everything else widens. The chat below clarifies the problem, which compares the market-capitalization weighted index to the equal-weight.


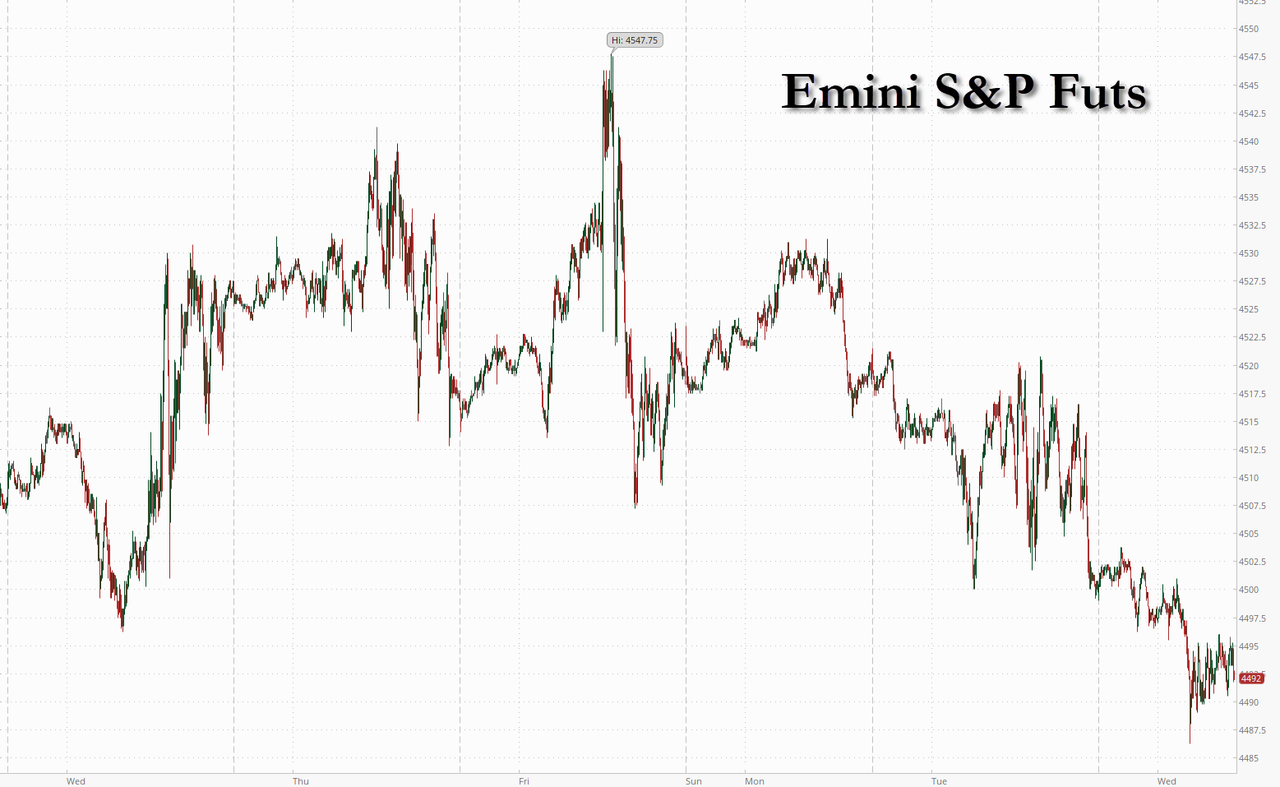
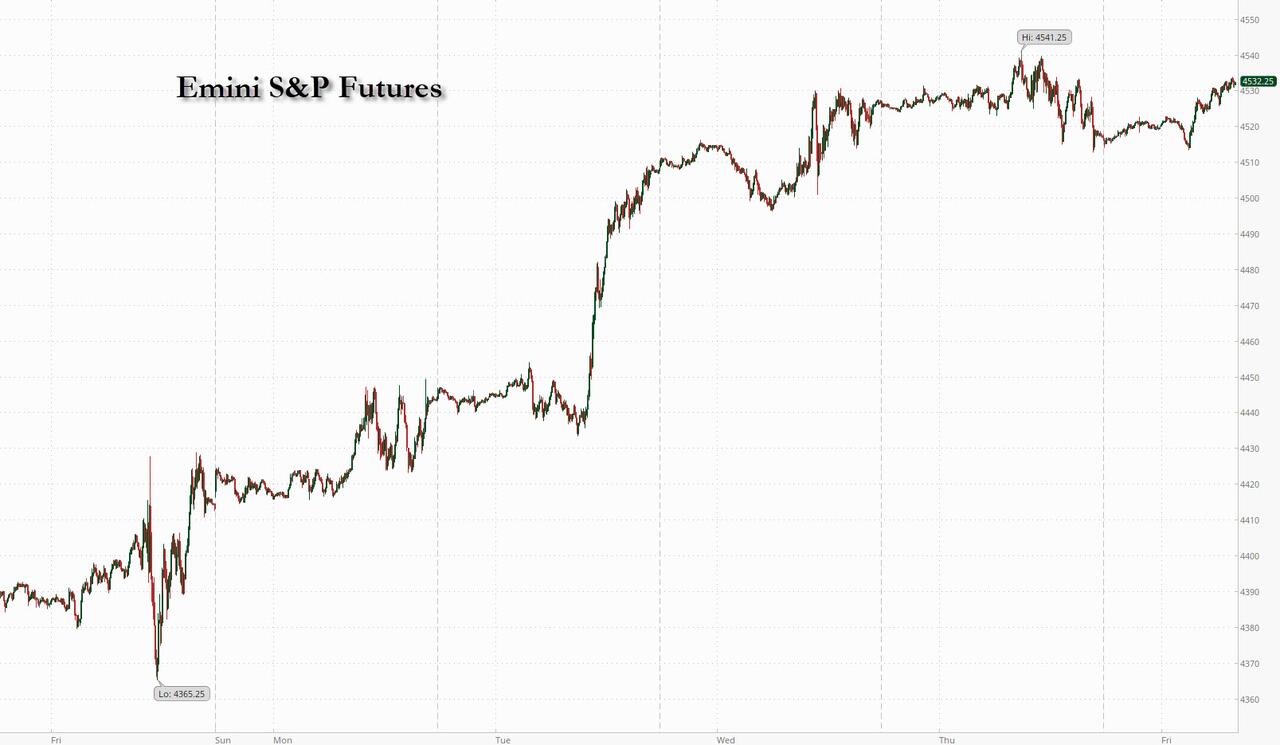
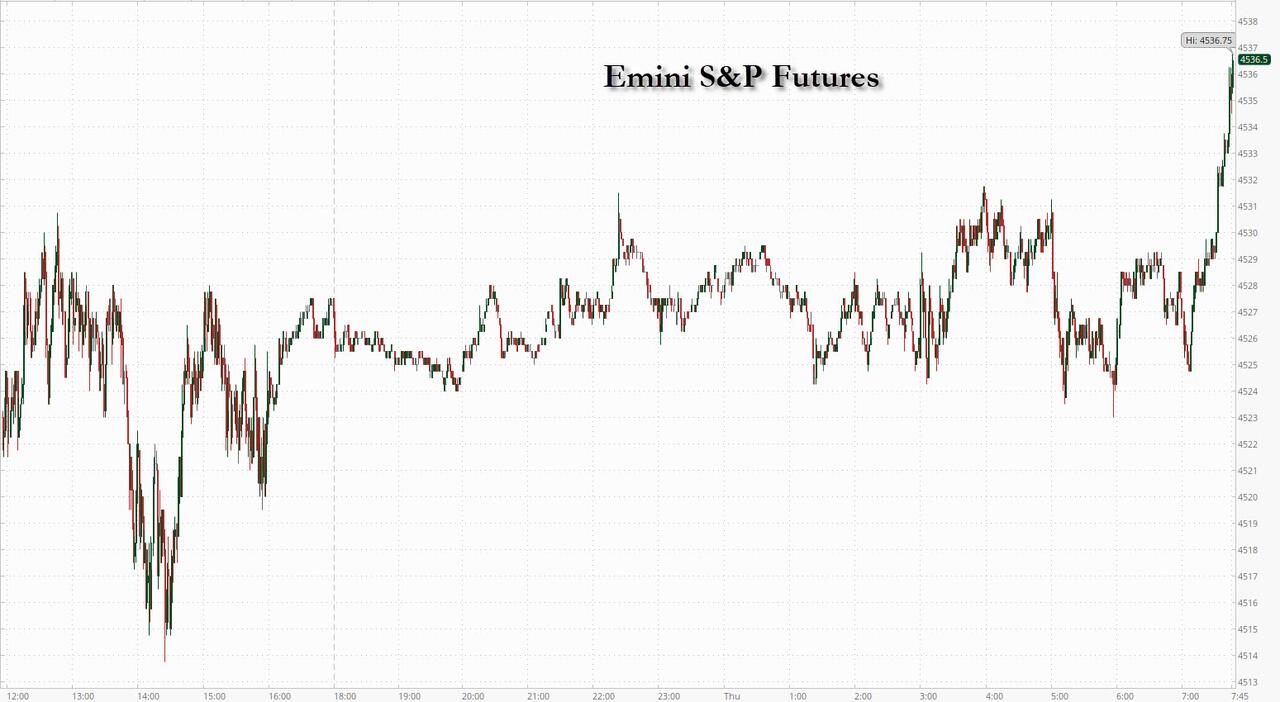
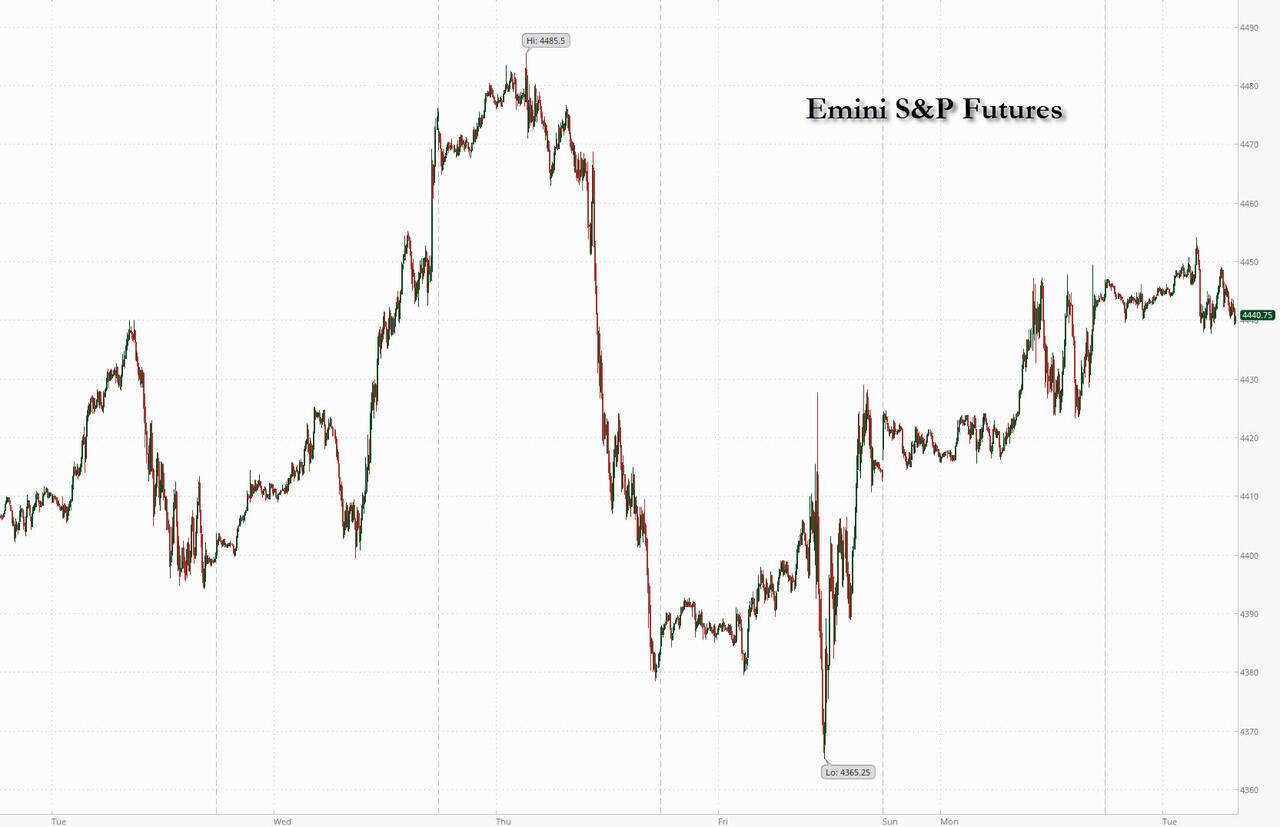
SPX futures slipped to 4481.00 thus far this morning, challenging Intermediate support at 4487.24.  Should it open beneath support, a sell signal may be generated.  The 50-day Moving Average at 4468.35 offers confirmation.  The yet-to-be-activated Head & Shoulders profile offers a potential targeting mechanism for this decline.

Today’s op-ex shows Max Pain at 4500.00.  Long gamma starts at 4520.00.  Short gamma begins at 4480.00.

ZeroHedge reports, “US equity futures and global markets are lower this morning with bond yields and the USD flat as collapsing German eco data and elevated oil prices reignited stagflation concerns across the euro area. As of 7:45am, emini S&P and Nasdaq 100 futures were down 0.2%. The Bloomberg Dollar Spot Index edged higher along with the Japanese yen, while oil-linked currencies retreated as Brent crude dipped from 2023 highs; commodities are weaker with a sell-off in energy and metals complexes. Treasury yields were little changed in a lackluster day for bond markets. Gold fell for a second day, while Bitcoin climbed for the first time in three days.”


VIX futures are consolidating after yesterday’s gap up from the low.  The decline to last week’s low was “out of season” and now it has some catching up to do.  The 50-day Moving Average offers a buy signal at 14.78.

Today’s opo-ex shows Max Pain at 14.50.  There is virtually no short gamma, while long gamma starts at 15.00 and rises in a lackluster fashion to 20.00.

ZeroHedge remarks, “VIX seasonality

Time to get busy…

Source: Nomura

VIX seasonality II

Ask yourself…how much can VIX go down from here, how much can it increase….and then assign a probability to it.”


The NYSE High-Low Index abruptly went from a Master Cycle high on Friday to plummet beneath mid-Cycle support at 17.00, going negative as well.  This is also a sell signal showing participation in the rally has dropped significantly.


TNX has pulled back to the Cycle Top support at 42.37, consolidating after yesterday’s spike higher.  The Cycles Model suggests a continued rise in yields to options expiration.


Gold futures declined to a morning low of 1946.25, beneath the 50-day Moving Average at 1950.34, placing it on a sell signal.  Should the decline continue beneath the lip of the Cup with Handle formation, a panic decline may ensue.

ZeroHedge remarks, “If you hold precious metals in your portfolio, there is a good chance you fear hyperinflation and the crash of fiat currencies.

You probably distrust governments in general and believe they are self-serving and have no interest in your economic well-being. It is likely that your holdings in gold are your lifeline – your hope to get you through these times while holding on to your wealth.

But have you ever given any thought to the possibility of having this lifeline confiscated by the authorities?”


USD futures continue to consolidate beneath its Friday master Cycle high.  In the last Master Cycle, it managed to emerge out of its year-long decline.  It may now pull back to its mid-Cycle support at 102.74.  The standard retracement takes an average of three weeks.  However, there are indications that this decline may be shorter.

ZeroHedge observes, “A stronger dollar adding to yuan pressure is an ongoing risk to liquidity in China and the rest of the world.

The yuan fell versus the dollar overnight, with USDCNY nudging near 15-year highs. This is not something welcomed by Chinese policymakers, as evidenced by the gap between USDCNY and the official fixing at near-historical extremes.”


Posted in Published | 1 Comment

September 5, 2023

8:10 am

Good Morning!

SPX futures consolidated between 4516.10 and 4495.10 over the holiday weekend, exceeding the Thursday and Friday lows.  It has completed a 5-week shallow Master Cycle, leaving a Head & Shoulders formation to inform us as to the possible outcome of the new Master Cycle.

Today’s op-ex shows Maximum investor Pain at 4515.00.  Long gamma starts at 4535.00 while short gamma begins with a wall of puts at 4500.00.

ZeroHedge reports, “Futures are lower, tracking European bourses and Asian markets, but well off session lows as a brief burst of China-linked optimism promptly following a Monday surge in property stocks and hopes of a Chine recovery turned to bust, as China reported the slowest service sector monthly growth so far this according to the August PMI survey, adding to a series of disappointing data. As of 7:50am ET, S&P futures were down 0.1% to 4,517 reversing the 0.2% gain during the Monday Labor Day holiday session; Nasdaq 100 futures dropped 0.4%. The US currency gained as much as 0.5% against its Group-of-10 peers, touching the highest level since March, sending commodities, gold and bitcoin lower. 10Y Yields are up to 4.22% and once again approaching the key resistance level of 4.25%, pressured not just by oil trading near 2023 highs but also in anticipation of a surge in corporate bond sales this week. Also, UK and euro-zone yields rose Monday and are extending that move. Today’s macro data focus is Durable Goods/Cap Goods plus Factory Orders. Later in the week we receive ISM-Srvcs and Jobless Claims.”


VIX futures ramped up to a weekend high at 14.46.  VX may have found its “floor” on Friday at 13.02, much deeper than I had anticipated.  It also extended its Master Cycle to day 273 in a super-extension.  (Day 275 is the upper limit.)  Note that Wave [B]s tend to be rogue Waves, stretching both time and length.  That is the nature of the market we are in.

Tomorrow’s op-ex shows Max Pain at 14.50.  Short gamma has a weak showing, while long gamma does a breakout above 15.00.

ZeroHedge comments, “A strategy of betting against equity market volatility has survived the summer doldrums with its status as a top-performing trade intact.

The August pullback in stocks in Europe and the US had pushed volatility readings higher, especially as investors braced for a burst of sentiment-testing central bank speeches in Jackson Hole. But while the VIX Index — Wall Street’s “fear” gauge — spiked to the highest since May, traders were quick to sell it again as the need to hedge against market risks quickly faded.”


TNX leaped above its Cycle Top support/resistance at 42.28.  Traders have not anticipated this, while the Cycles Model has been indicating a continued rally through mid-September.  The Head & Shoulders formation is active.

ZeroHedge remarks, “With stock markets in a bit of a “no man’s land” territory after a soggy August which saw the S&P suffer its biggest monthly drop since February (yes, believe it or not, the modest 1.8% drop in August was a hard stop to the 5 consecutive prior months of gains), the latest note from BofA CIO Michael Hartnett is not only somewhat shorter than usual (everyone has to take a break sometimes) but also focuses more on the rates market which was much more exciting in August than stocks.

As Hartnett points out in the “Biggest Picture” segment of his latest weekly Flow Show (available to pro subscribers), the 10-Year US Treasury is on course for a 3rd consecutive loss (after -3.9% in ’21, -17.0% in ’22 and -0.3% in ‘23), something which has not occurred once in the 250-year history of US republic since 1787.


USD futures consolidated between 104.06 and 104.80 over the holiday weekend, leaving Friday’s high of 104.85 as the probable Master Cycle high on day 261.   The Cycles Model offers room for a final probe higher this week.  However, the correction lower may be shallow and short-lived.


Posted in Published | 2 Comments

September 1, 2023

10:10 am

BKX, our liquidity proxy, is approaching the 50-day Moving Average at 83.50 on day 256 (average 258 days) of the Master Cycle.  While the Cycle may extend to early next week, it may be foolish to expect it to rally much higher, especially should interest rates resume their climb.   The Head & Shoulders target is still active.

ZeroHedge reports, “After last week’s brief (and small) dip, US money-market funds saw inflows once again last week, adding $14.4BN to reach a new record high of $5.5TN…”


8:00 am

Good Morning!

SPX futures have risen overnight to a high of 4527.20, thus far but await the Monthly Jobs Report.  Yesterday’s high at 4532.26 fulfilled the requirements for a Master Cycle on day 261 with a 72% retracement of the July decline.   In two weeks, the SPX went from oversold to overbought.

8:45 am

SPX futures spiked to 4538.90 at the release of the Employment Situation Survey.  Futures have eased down since then.  This extends the likelihood of a Master Cycle high today.

Today’s op-ex shows Maximum investor Pain at 4495.00.  Long gamma may begin at 4500.00, rising to 4600.00.  Short gamma begins at 4475.00 and has large contract sizes every 50 points down to 4300.00, indicating institutional interest.

ZeroHedge reports, “Futures and global markets are higher ahead of the NFP today at 8:30am ET (full preview here). At 7:40am ET, S&P futures rose 0.3% to 4,531 with Nasdaq futures up 0.2%. Major global markets are also higher, led by the UK (UKX +0.5%, SX5E +0.4%, SXXP +0.4%, DAX +0.1%), with the final Eurozone Mfg PMI is revised lower to 43.5 from 43.7, further boosting odds the ECB is done. On September ECB, Greg Fuzesi thinks that the July minutes and Isabel Schnabel’s comments yesterday (“growth had “moderated visibly”) both consistent with a pause in September ECB. He expects the final hike to happen in October after a pause in September. China reduced banks’ reserve requirement of foreign currency deposits, boosting the yuan, while China’s Caixin Mfg PMIsurprised to the upside: 51.0 vs. 49.0 survey vs. 49.2 prior. Bond yields are lower and the Bloomberg dollar index is flat. Commodities are mostly stronger led by oil. Key macro focus will be the labor data release today (NFP, Unemployment Rate, Avg. Hourly Earnings, Labor Force Participation) at 8.30am ET and the Mfg ISM at 10am ET.”


VIX futures declined to 13.22 thus far this morning after the DOL announcement.  This should not be alarming, since Wave {B}s tend to be rogue waves, extending further than the average.

Wednesday’s op-ex shows Max Pain at 14.50.  Long gamma begins at 15.00 and extends to 28.00.


TNX tested Intermediate support at 40.80 this morning and appears to have reversed course, rising above the neckline at 41.00.  Should it remain above the neckline today, a two-week rally may ensue, ending the current Master Cycle.


USD futures are lower as they may find a base at the mid-Cycle support at 102.74.  The Cyclles Model suggests that trending strength may re-appear next week.


Posted in Published | Comments Off on September 1, 2023

August 31, 2023

7:45 am

Good Morning!

NDX futures rose to 15491.20 thus far, in a probable attempt to reach 15500.00. (round number resistance and a short gamma wall).  This makes a 67% retracement of the July decline.  The current top-to-top Cycle has taken 43 calendar days and is due for a reversal.  Yesterday’s high was on day 266, which is getting long in the tooth.

Today’s op-ex shows Maximum investor Pain at 15520.00.  Long gamma runs from 15540.00 to 15600.00.  Short gamma starts at 15500.00.  That suggests NDX may open in short gamma today.

ZeroHedge observes, “The massive move lower in the AAII bull – bear spread (outlined here) has resulted in markets squeezing lately. Nothing new, but frustrating for the crowd.

Source: Refinitiv


Smart money

Smart or not, but they missed the latest squeeze…


SPX futures reached a morning high at 4529.50, but may be pulling back.  To reiterate, this Cycle is getting long in the tooth and is due for a reversal.  Thus far it has reached a 69% retracement on day 266.  Retail investors are coming back, buying at the highs.

Today’s op-ex shows Max Pain residing at 4510.00.  Long gamma starts at 4525.00, running to 4600.00.  Short gamma has a 15,582 put wall at 4500.00 and running strong to 4400.00.   Short activity appears to be institutional, due to the large sizes.

ZeroHedge reports, “US stock futures, European bourses and Asian markets all rose, while the 10-year Treasury yield traded near a three-week low and the USD eeked out its first gain of the week as traders reacted to a modest improvement in China’s mfg PMI and looked ahead to Thursday’s PCE data and Friday’s jobs report. At 7:45am ET, S&P futures rose 0.25% to 4,535 while Nasdaq 100 futures reversed earlier losses. Europe’s Stoxx 600 benchmark stayed in the green, buoyed by record profits at UBS as a result of its emergency takeover of Credit Suisse. Commodities are stronger led by oil and metals with natgas and wheat the biggest laggards. Today’s macro data focus includes jobless claims, income/spending and the PCE Deflator. Chicago PMI, expected to rise to 44.2, may point to a stabilization in mfg. Tomorrow we cap off the week with NFP.


VIX futures made a new low at 13.72 this morning, extending its Master Cycle to day 271.  This is still within the normal limits for the Master Cycle.  This Cycle low has been much stronger than anticipated.  The 50-day Moving Average was pierced.  However, we also saw this in equities.  In addition, the August 18 high was weak, while this low was very strong.

Next Wednesday’s op-ex shows Max Pain at 14.00.  Short gamma is non-existent.  Long gamma begins at 15.00 with only modest participation above 20.00.  This is a perfect setup for a runaway VIX, as no one is expecting it.

ZeroHedge notes, “The VIX reset, but…

The VIX went from 13ish to 18 during the initial August sell off, and then basically all the way down again. Don’t forget that volatility is mean reverting and has a “natural floor” level. For VIX this is around 13, give or take. Our favorite contrarian “sell side” indicator, the VIX guy, has not called yet, but we are eagerly awaiting to pick up his call…

Source: Refinitiv

The VVIX crash

The Vix of Vix, VVIX, has put in one of the more aggressive resets we have seen in a long time. Nomura’s McEligott has been spot on explaining the dynamics well over the past weeks. In his latest note he writes: “VIX Dealer “Short Calls” now to 28%ile from what was 1%ile just two weeks ago into VIXperation”.


TNX futures declined to 40.84, approaching Intermediate support at 40.72.  This may be the launch of a two-week rally into the Master Cycle high, due in mid September.

ZeroHedge reports, “One of The Fed’s favorite inflation indicators – Core PCE Deflator – rose 4.2% YoY in July (as expected but higher than June’s +4.1%). Headline PCE jumped up to +3.3% YoY (also as expected) – the biggest jump in YoY prints since June 2022…

Source: Bloomberg

Even more focused, is the Fed’s view on Services inflation ex-Shelter, and the PCE-equivalent shows that is very much stuck at high levels


USD futures declined to a new retracement low at 103.09 this morning.  It may correct down to the mid-Cycle support at 102.76 before resuming its rally until mid-October.  USD hasn’t broken above the June high at 104.61, so most analysts still consider the USD to be in a bear market.  The Cycles Model suggests a return of trending strength next week.


The Euro is an almost inverse image of the USD.  It is currently correcting the decline from its July high.  The possible target may be the 50-day at 109.73.    What is not shown is a potential collapse into the end of the year.  Negative interest rates since 2014 have backfired.  No one wants to buy European bonds.


Posted in Published | 1 Comment

August 30, 2023

7:45 am

Good Morning!

NDX may have closed out its Master Cycle on day 259 above the 50-day and Intermediate resistance at 15301.76.  It has completed a 60.6% (near Fibonacci) retracement and may be ready to resume its decline.  With the Master Cycle complete, a confirmed sell signal awaits beneath the 50-day at 15214.04.

NDX futures made an overnight high at 15429.50, an approximate 63.4% retracement before easing down.  The futures are still above Intermediate support/resistance at 15301.76.  An aggressive sell signal awaits there, with confirmation beneath the 50-day.

Today’s op-ex shows Maximum investor Pain at 15375.00.  Long gamma starts at 15390.00 while short gamma begins at 15300.00.  Note how the 50-day matches short gamma.

ZeroHedge notes, “Oversold is gone

On August 20 (here) we pointed out just how oversold the market was. Fast forward to today, and the RSI has moved sharply higher. The question is whether or not we see overbought again?

Source: Refinitiv

NASDAQ seasonality

Right on time….although the more interesting part of the chart comes after September.”


SPX futures rose to an overnight high of 4507.20, overshooting the 61.8% Fibonacci retracement at 4503.40.  It has since eased beneath 4500.00.  An aggressive sell signal awaits at Intermediate support at 4588.95, which upgrades to a confirmed sell signal beneath the 50-day at 4459.79.

Today’s op-ex shows Max Pain at 4475.00.  Long gamma starts at 4490.00, while short gamma begins at 4450.00.


VIX futures consolidated beneath the 50-day at 14.76 this morning.  It has met its downside target, a 74% retracement.  It is now set up to rise above the Cup with Handle trendline.  A buy signal awaits above the 50-day Moving Average at 14.76.

Today’s op-ex shows Max Pain at 16.00.  While there is no shor gamma, long gamma becomes very strong at 18.00.


TNX has risen off the Head & Shoulder neckline, possibly activating that formation.  The Cycles Model suggests trending strength returning next week , leading to a Master Cycle high in mid-September.

ZeroHedge reports, “If there was any concern that today’s post-JOLTS yield plunge would lead to reduced demand for today’s closely watched belly-of-the-curve auction, they evaporated moments ago when demand for 7Y paper was almost off the charts.

Pricing at a high yield of 4.212%, today’s sale of $36BN in 7Y notes priced at the highest yield on record, and about 13bps above the July auction which stopped at 4.087%. And despite concerns that a lack of concession could lead to lower demand, the auction stopped through the 4.232% When Issued by 2bps, the widest stop through since January, with just one tail in the past 4 auctions.

The bid to cover was a solid 2.66, the highest since Jan 2023 and another indication of the solid demand for today’s sale.”


USD futures have declined to 103.04 thus far after making its Master Cycle high on Friday August 25.  It may find support at the mid-cycle at 102.76 although it may go lower.  Trending strength may return later this week or early next week.


Posted in Published | 2 Comments

August 29, 2023

12:11 pm

One of the conditions for the Master Cycle was to end at a high above the 50-day Moving Average at 4459.51.  That was accomplished this morning with a high at 4485.50, short of Intermediate resistance at 4488.49.  A reversal on day 259 of the Master Cycle may create a sell signal, especially beneath the 50-day.  The new MasterCycle is due to decline to mid-October.  The Head & Shoulder formation offers a minimum target for this decline.

RealInvestmentAdvice offers this information, “About once a year, I have to address the issue of chasing the “10 Best Days” of the year. Statista recently presented the analysis:

“There is clear evidence that market timing is difficult. Often, investors will sell early, missing out on a stock market rally. It can also be unnerving to invest when the market is flashing red. By contrast, staying invested through highs and lows has generated competitive returns, especially over longer periods. The graphic below shows how trying to time the market can take a bite out of your portfolio value, using 20 years of data from JP Morgan.”


8:00 am

Good Morning!

NDX futures rose to an overnight high at 15108.60, then settled back toward 15000.00.  The 50-day Moving Average is at 15207.00, so there may be a failure to thrive in the retracement.  Today is day 259 of the Cycles Model.  Should the NDX make a new low in the next week, it may qualify as a Master Cycle low.  However, the Master Cycle may have terminated early, on day 248.  Should that be the case, the decline may continue through mid-October.  This is a very dangerous place to make any assumptions about a recovery.  A decline in the next couple of days beneath the neckline at 14557.83 may trigger the Head & Shoulders formation.

Today’s op-ex shows Maximum investor Pain at 14990.00.  Long gamma may begin at 15000.00 while short gamma may begin at 14960.00.

ZeroHedge observes, “While hedge funds are getting squeezed (as we predicted), and long-onlies are refusing to buy the dip, the late summer volumes remain too anemic for any major market moves. But that may change if Goldman trader John Flood is correct in warning that CTAs are once again relevant in US equity markets after being a non-factor for the last 3+ months.

According to Flood, CTAs are now long $28BN S&P (77th percentile in terms of historical length)

… and have $5.2BN of S&P to sell this week in a flat tape.”


SPX futures made a higher high over yesterday’s trading range, to 4445.30. unable (thus far) to reach the 50-day at 4457.38.  It is now testing new morning lows at 4425.00.  This may be a failed high, suggesting a decline through the Head & Shoulders neckline may follow.  A possible extension of the Cycle may only be to a higher level, which does not seem to be the case thus far.

Today’s op-ex shows Max Pain at 4440.00.  Long gamma starts at 4455.00 while short gamma begins ar 4400.00.

ZeroHedge reports, “US stock futures erased gains of as much as 0.3% following another parade of modest China stimuli as investors monitored the outlook for interest rates ahead of key inflation and jobs data later this week, with the Federal Reserve’s data dependence in firmly mind. Contracts on the Nasdaq 100 and S&P 500 traded flat by 7:30 a.m. in New York after gaining as much as 0.4% and 0.3%, respectively. In Europe, the Stoxx 600 rises for a second day while Asian stocks closed at the highest level in two weeks, as Chinese equities extended their gains following the country’s market-boosting measures. A fall in Treasury yields also helped sentiment. Treasury yields and the dollar were steady; the USDJPY rose to 146.97, the highest level since November, and a red line for imminent BOJ intervention.”


VIX futures are higher, after bottoming out at 14.95, just above the 50-day Moving Average at 14.74.  The retracement may be over, as the target came into view.  Today may be (have been) a Trading Cycle low.  The next Trading Cycle may be  a high in the latter part of October.  Remember, Cycles are not sine waves.

Tomorrow’s op-ex shows Max Pain at 17.00.  Short gamma starts at 16.00 while long gamma begins at 18.00.

ZeroHedge comments, “Fearless VIX

VIX down on a Monday is not that common as we are supposed to “catch up” the weekend effect. You don’t compare mean reverting assets to trending assets over longer time periods, but shorter term gaps should not be dismissed. Last time VIX traded here, the SPX was 100 points higher…”


TNX rose after testing its Cycle Top at 42.04 this morning.  This shows the rally on a steeper gradient since the April low.  Investors are now accepting higher yields, especially after the breakout.  The Cycles Model shows another week of rising rates into a new Master Cycle high.

ZeroHedge reports, “90 minutes after the day’s first coupon auction in what is a truncated week, the US Treasury sold another coupon bond, this time  $46 billion in 5 Year paper, in what was another solid auction.

The bond priced at a high yield of 4.400%, tailing the When Issued 4.399% by 0.1bps, the third consecutive tailing auction in a row. The yield was also well above last month’s 4.170%, and like the 2Y auction earlier, was the highest since July 2007.

The bid to cover of 2.54 was below last month’s 2.60 but just above the recent average of 2.533.”


Posted in Published | 1 Comment

August 28, 2023

7:30 am

Good Morning!

NDX futures rose to 14991.80 over the weekend session.  The retracement may be over, or nearly so, and the decline through the neckline near 14450.00 may be imminent.  Today is day 258 of the Master Cycle.  Friday’s low on day 255 does not qualify as the Master Cycle low because it is not deeper than the low of 4665.31 on the 18th.  That leaves the market to make a possible new high (15200.00 – 15300.00) or low beneath the neckline this week.   Normally, the week of Labor Day is positive.  However, investors are no longer positive.

In today’s op-ex Maximum investor pain is at 14950.00.  Long gamma starts at 14975.00 while short gamma begins at 14900.00, leaving a narrow neutral zone.

ZeroHedge remarks, “Last Thursday, when he reiterated his reasons to remain skeptical – and bearish – on this market, Goldman’s flow guru Scott Rubner highlighted various technical, micro and macro considerations, and when responding to the top client question, namely “why did the most important stock in the world (NVDA) absolutely crush earnings and close up “only” 10bps on the day w/ a ~400bps reversal in NDX futures?”, his response was that “there is a supply and demand mismatch and those dip buyers are already “very full”. The US equity market has been trading, “Escalator up, “Elevator down ” behavior.”


SPX futures rose to 4418.20 thus far this morning with a possible retest of the 50-day Moving Average at 4456.15 this morning.  As mentioned earlier, today is day 258 in the current Master Cycle.  It is likely to make a high at or above the 50-day Moving Average or a new low beneath the neckline this week.

Today’s op-ex shows Max Pain at 4405.00,, sitting uneasily above short gamma, beginning at 4375.00.  Long gamma starts at 4425.00.

ZeroHedge reports, “US futures ticked up Monday in a muted session with the UK on holiday, after China unveiled a raft of modest stimulus measures meant to lift its equity market (it worked… for a few hours) and as the market looked set to build on gains made Friday on Powell’s cautious Jackson Hole comments on future interest rate moves. S&P futures climbed 0.2% while contracts on the Nasdaq 100 rose 0.3% by 7:42 a.m. ET; stocks also advanced in Europe and in China, where the government announced support for equity markets; however what was the biggest rally in 5 years quickly fizzled as a gain of over 5% in the CSI300 quickly faded to just 1%. Both the S&P 500 and Nasdaq are set for their first monthly decline since February amid concerns that the Fed could keep a hawkish policy outlook given the resilience of the US economy.”


VIX futures consolidated over the weekend inside Friday’s trading range.  A retest of the 50-day Moving Average at 14.73 may be in order this week.  Once that takes place, the rally may resume.

Wednesday’s op-ex shows Max Pain at 17.00  Short gamma starts at 16.00 but there is little follow-through beneath it.  Long gamma begins at 18.00.

ZeroHedge remarks, “The VVIX puke

VVIX has crashed recently and is trading close to summer lows.

Source: Refinitiv

VIX as well

VIX has moved lower as well, although not as aggressively as the above mentioned indexes. Chart two shows the VIX term structure and the shift lower across the curve (especially the short end of it) compared to August 17, the lowest close for the SPX since late June.


TNX os now testing the Cycle Top support at 41.96.  The neckline at 41.00 may also be tested before the rally resumes.  TNX has about two more weeks of rally left in the current Master Cycle.  The rally may be substantial, as indicated b the Head & Shoulders formation.

ZeroHedge notes, “Rates markets have begun to accept the higher-for-longer mantra from central bankers. But it may soon come undone if economies are nearer to recession than surface data implies.

Central bankers at last week’s Jackson Hole symposium did nothing to disabuse the notion that their intention is to keep interest rates elevated for an extended period.

In the US, the real peak SOFR rate has remained over 2% since June. Short-term real yields are also historically elevated, with 2yr TIPS yields close to highs going back to 2004 (outside of their GFC spike).”


USD futures are also consolidating above the channel trendline and 200-day Moving Average.  Today is day 257 in the current Master Cycle.  It may be due to peak early this week.


Posted in Published | 2 Comments

August 25, 2023

9:52 am

The Ag Index made an early Master Cycle low on August 15.  It did not make the expected 61.8% retracement at 387.40.  Nonetheless, it is on an aggressive buy signal with the reversal from the cycle Bottom at 396.97.  Consumers already know that food prices are rising at the grocery shelves, but his indicate yet higher prices to come.  The Cycles Model implies rising prices through the end of September as the harvest season is underway.

ZeroHedge observes, “When mainstream economists and politicians cite “improvements” to the inflation problem in the US in recent months, what they are commonly referencing are changes to the Consumer Price Index (CPI).  However, the CPI is not a measure of total inflation, rather, it is a median snapshot of prices at a particular point and time.  True inflation is cumulative – A 10% increase one year and a 5% increase the next year is not a win, it means that you are now paying 15% more on average for everything you buy in the span of only two years.

When CPI falls this does not mean that prices on goods and services are going down, it only indicates that prices are rising slower than they were the month or the year before.

Another misconception about CPI is that it measures the inflation rate accurately for regular consumers on common purchases.  In reality, the CPI represents mean average price rate increase for a vast basket of goods; over 94,000 items and services with over 200 separate categories.  Most of these items and services you will never use or rarely purchase in the span of a year.  In other words, inflation declines in uncommon goods can dilute the numbers, making it seem like inflation is dropping while prices on daily necessities continue to spike. ”


7:55 am

Good Morning!

NDX futures completed its decline at 14745.80, then rose to a morning high of 14847.50, but has since eased back.  It may continue its bounce toward 15000.0 this morning as it completes a correction before resuming its decline.  The swings may be fast and wide, but the trend is down.  The technical indicators are now bearish.  Short term support/resistance (not shown in the daily chart) declined beneath the 50-day Moving Average last Friday in a bearish cross.  The decline will steepen, with a potential short-term panic low by mid-week.  However, the decline may extend another week beyond.

Today’s op-ex shows Maximum investor Pain at 14825.00.  Long gamma begins at 14850.00, shile short gamma starts at 14800.00.

ZeroHedge confirms, “NASDAQ’s bearish cross

The 21 day has now crossed the 50 day moving average. NASDAQ futures putting in the biggest down candle in a long time and it looks like we have a new short term trend channel to watch.”


SPX futures completed their decline at 4370.00, then bounced toward 4400.00 – 4410.00, where short-term resistance lies.  It is noteworthy that the SPX short-term resistance made its bearish cross yesterday, as the SPX peaked at the 50-day.  The Cycles Model suggests a short-term (panic) low by mid-week.  However, other panic lows may follow for another week after.

Today’s op-ex shows Max Pain at 4400.00, a highly contested strike with 8, 113 calls and 7,902 calls.  Long gamma starts at 4420.00 while short gamma erupts at 4390.00.  SPX must stay above 4400.00 to have any equilibrium.

ZeroHedge reports, “Futures are slightly higher ahead of today’s Jackson Hole main event, with tech flat following yesterday’s violent Nvidia “sell the news” dump even as yields ticked modestly higher again. At 8:00 am, S&P futures were higher by 0.3% on the day, trading just around 4,400 and paring a portion of Thursday’s session losses while Nasdaq 100 futures are flat after the index sank more than 2% yesterday. Europe’s Stoxx 50 rises 0.6%, extending its first weekly advance in four as commodity shares led gains as oil and iron ore prices climbed; Asian equities slumped Friday, paring their first weekly gain since July, as Chinese stocks slid and technology shares were sold off. Quality is leading, Growth is lagging; Cyclicals flat vs. Defensives.”


VIX futures edged higher to 17.22 last night before easing back.  A rally above the mid-Cycle and trendline resistance at 18.24 is likely today.  The Cycles Model suggests the VIX may rally to mid-October in the current Master Cycle.

Next Wednesday’s op-ex sows Max Pain at 17.00.  There is a solitary strike of short gamma at 16.00, while long gamma begins at 18.00 and may range to 37.00.


TNX appears to be consolidating, waiting for the pronouncement from Jackson Hole.  There is some hope that Powell may lower interest rates, or at least not raise them.  The current Fed Funds Rate is 5.33%.  A study shows that the Fed has been consistently behind market rates since 1949.

ZeroHedge remarks, “In a declining nominal growth environment, where cash yields 135 basis points per quarter, the outcome of a tightening versus easing policy is an important factor that makes a difference to cross-asset return expectations.

Most analysts anticipate that at Jackson Hole central bankers will reiterate a “job not done” message, indicating the need for an extended period of tighter monetary policy. This implies the intention to raise further short-term real interest rates (even by being on hold as inflation slows further), despite a noticeable reduction in inflationary pressures and poor PMI readings and maintain those until a clearer evidence of building labor market slack. This is what we call here the Volcker scenario – a decisive win against inflation, whatever it takes. (55-70% market implied probability)”


USD futures are steady this morning, awaiting Jackson Hole.  The Cycles Model shows increased trending strength this weekend and more so until mid-week.  There may be a breakout above the Cycle Top at 105.32.


Crude Oil futures rose above Intermediate Term resistance at 79.26 after testing it intraday and completing its Master Cycle.  Should that be the case, crude may rise to 82.00.  The danger is that the correction may take crude lower.  I have no trading thoughts on crude at this time, other than the trend may be down from the Cycle Top currently at 84.32.


Posted in Published | 1 Comment