
12:11 pm

One of the conditions for the Master Cycle was to end at a high above the 50-day Moving Average at 4459.51. That was accomplished this morning with a high at 4485.50, short of Intermediate resistance at 4488.49. A reversal on day 259 of the Master Cycle may create a sell signal, especially beneath the 50-day. The new MasterCycle is due to decline to mid-October. The Head & Shoulder formation offers a minimum target for this decline.
RealInvestmentAdvice offers this information, “About once a year, I have to address the issue of chasing the “10 Best Days” of the year. Statista recently presented the analysis:
“There is clear evidence that market timing is difficult. Often, investors will sell early, missing out on a stock market rally. It can also be unnerving to invest when the market is flashing red. By contrast, staying invested through highs and lows has generated competitive returns, especially over longer periods. The graphic below shows how trying to time the market can take a bite out of your portfolio value, using 20 years of data from JP Morgan.”
8:00 am

Good Morning!
NDX futures rose to an overnight high at 15108.60, then settled back toward 15000.00. The 50-day Moving Average is at 15207.00, so there may be a failure to thrive in the retracement. Today is day 259 of the Cycles Model. Should the NDX make a new low in the next week, it may qualify as a Master Cycle low. However, the Master Cycle may have terminated early, on day 248. Should that be the case, the decline may continue through mid-October. This is a very dangerous place to make any assumptions about a recovery. A decline in the next couple of days beneath the neckline at 14557.83 may trigger the Head & Shoulders formation.
Today’s op-ex shows Maximum investor Pain at 14990.00. Long gamma may begin at 15000.00 while short gamma may begin at 14960.00.
ZeroHedge observes, “While hedge funds are getting squeezed (as we predicted), and long-onlies are refusing to buy the dip, the late summer volumes remain too anemic for any major market moves. But that may change if Goldman trader John Flood is correct in warning that CTAs are once again relevant in US equity markets after being a non-factor for the last 3+ months.
According to Flood, CTAs are now long $28BN S&P (77th percentile in terms of historical length)…

… and have $5.2BN of S&P to sell this week in a flat tape.”

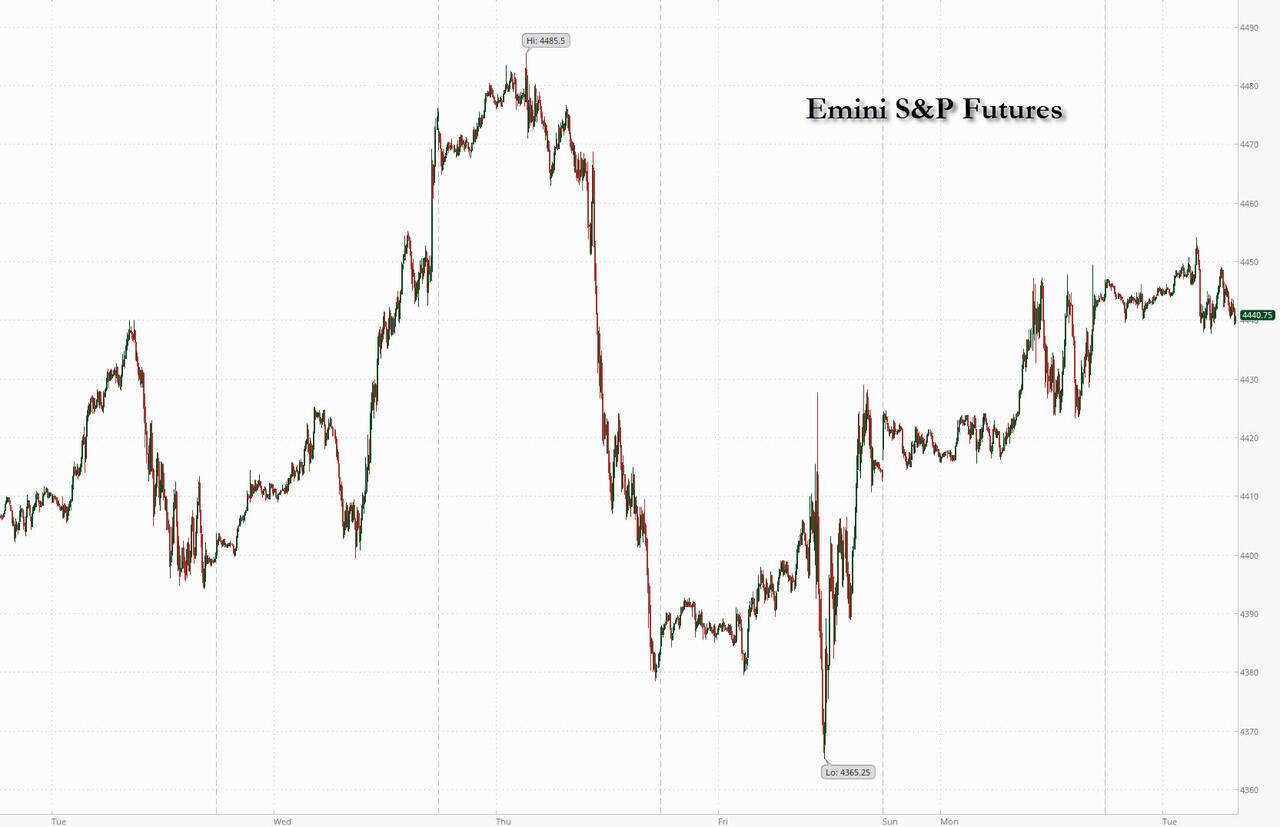
SPX futures made a higher high over yesterday’s trading range, to 4445.30. unable (thus far) to reach the 50-day at 4457.38. It is now testing new morning lows at 4425.00. This may be a failed high, suggesting a decline through the Head & Shoulders neckline may follow. A possible extension of the Cycle may only be to a higher level, which does not seem to be the case thus far.
Today’s op-ex shows Max Pain at 4440.00. Long gamma starts at 4455.00 while short gamma begins ar 4400.00.
ZeroHedge reports, “US stock futures erased gains of as much as 0.3% following another parade of modest China stimuli as investors monitored the outlook for interest rates ahead of key inflation and jobs data later this week, with the Federal Reserve’s data dependence in firmly mind. Contracts on the Nasdaq 100 and S&P 500 traded flat by 7:30 a.m. in New York after gaining as much as 0.4% and 0.3%, respectively. In Europe, the Stoxx 600 rises for a second day while Asian stocks closed at the highest level in two weeks, as Chinese equities extended their gains following the country’s market-boosting measures. A fall in Treasury yields also helped sentiment. Treasury yields and the dollar were steady; the USDJPY rose to 146.97, the highest level since November, and a red line for imminent BOJ intervention.”

VIX futures are higher, after bottoming out at 14.95, just above the 50-day Moving Average at 14.74. The retracement may be over, as the target came into view. Today may be (have been) a Trading Cycle low. The next Trading Cycle may be a high in the latter part of October. Remember, Cycles are not sine waves.
Tomorrow’s op-ex shows Max Pain at 17.00. Short gamma starts at 16.00 while long gamma begins at 18.00.
ZeroHedge comments, “Fearless VIX
VIX down on a Monday is not that common as we are supposed to “catch up” the weekend effect. You don’t compare mean reverting assets to trending assets over longer time periods, but shorter term gaps should not be dismissed. Last time VIX traded here, the SPX was 100 points higher…”


TNX rose after testing its Cycle Top at 42.04 this morning. This shows the rally on a steeper gradient since the April low. Investors are now accepting higher yields, especially after the breakout. The Cycles Model shows another week of rising rates into a new Master Cycle high.
ZeroHedge reports, “90 minutes after the day’s first coupon auction in what is a truncated week, the US Treasury sold another coupon bond, this time $46 billion in 5 Year paper, in what was another solid auction.
The bond priced at a high yield of 4.400%, tailing the When Issued 4.399% by 0.1bps, the third consecutive tailing auction in a row. The yield was also well above last month’s 4.170%, and like the 2Y auction earlier, was the highest since July 2007.
The bid to cover of 2.54 was below last month’s 2.60 but just above the recent average of 2.533.”