August 24, 2023

9:38 am

BKX continues its bounce from yesterday’s low.  There is no particular target for this bounce, as it may remain weak.  It may resume its decline shortly with a potential Master Cycle low in the first week of September.

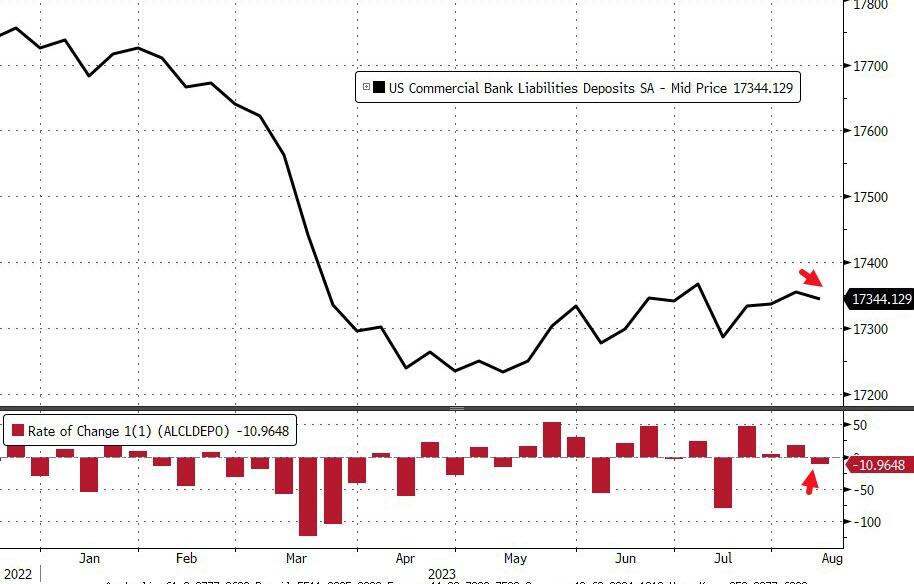
ZeroHedge observes, “In March, Silicon Valley Bank collapsed, plunging its parent company SVB Financial Group into bankruptcy a week later.

While many expected a wave of bank failures to follow, much of this has since been averted – but cracks have begun to emerge with Moody’s recent downgrading of 10 small and mid-sized banks.

Across the wider corporate landscape, bankruptcies have begun to tick higher. Overstretched balance sheets coupled with 11 interest rate hikes since last year have added to mounting challenges for companies across many sectors.”

 (Reuters) – Shares of several U.S. banks fell on Tuesday, the day after ratings agency S&P Global followed Moody’s in cutting its credit ratings on some regional lenders with high commercial real estate (CRE) exposure.

S&P’s action will make borrowing more costly for a banking sector aiming to recover from a crisis earlier this year, when three regional lenders failed, prompting broader industry turmoil.


8:00 am

Good Morning!

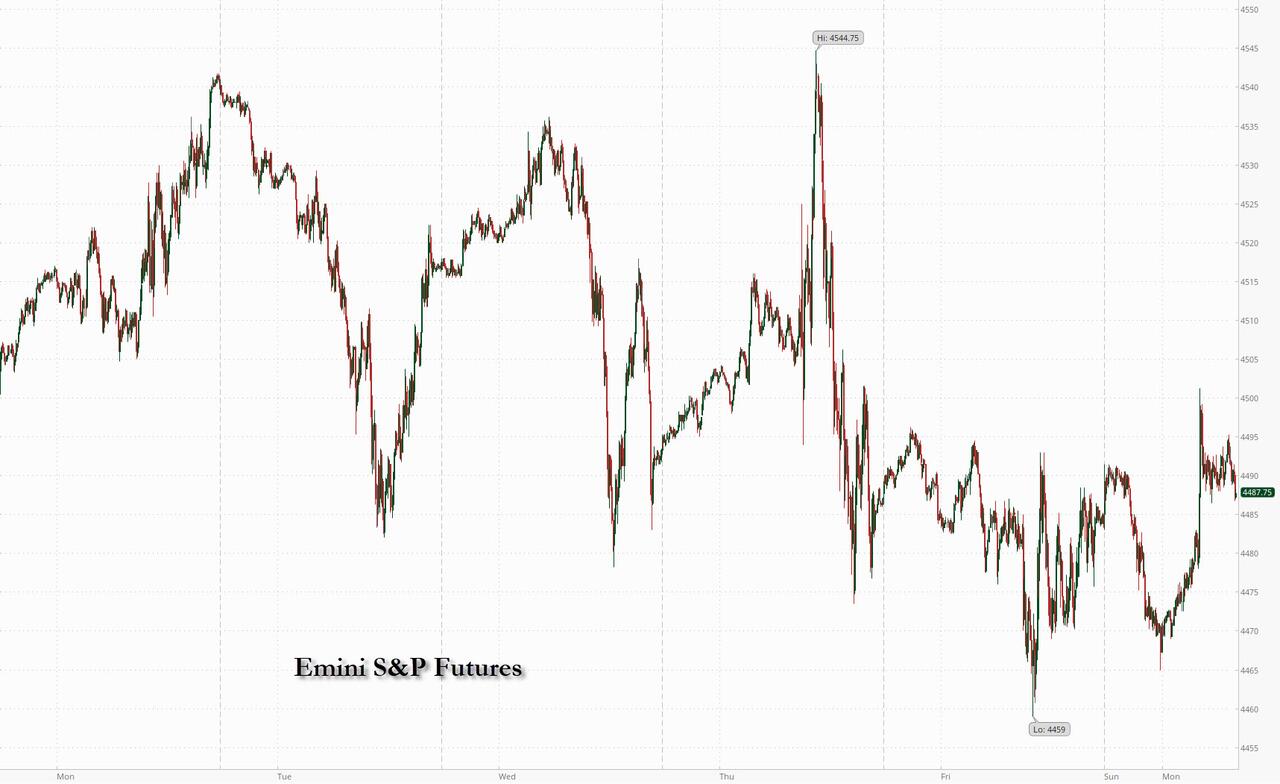
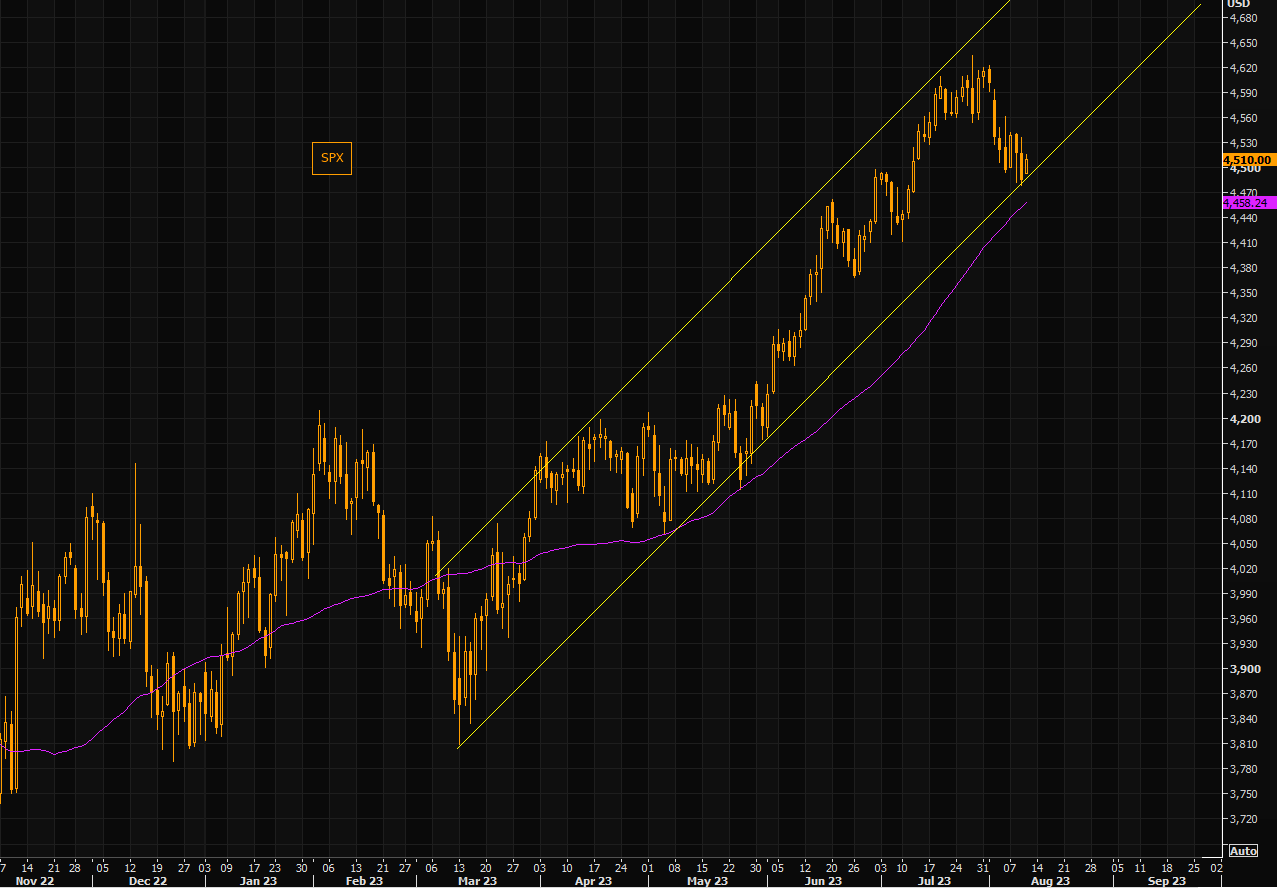
SPX futures rose to 4473.90, overshooting their target of the 50-day Moving Average at 4453.38.  They have since eased down to the 50-day.  Should it remain beneath it, there is a strong likelihood of a reversal this morning.  However, a reluctance to decline may improve the chances of a probe toward Intermediate resistance at 4489.15 in the next 24 hours.

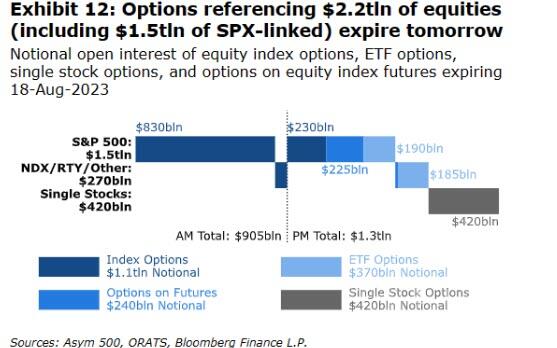
Today’s op-ex shows Max Pain for options investors at 4425.00.  Long gamma may start at 4450.00, while short gamma may begin at 4400.00.

ZeroHedge reports, “US equity futures and global markets rallied after NVDA’s blowout earnings, which sent the stock to a new record high above $500, gave fresh impetus to the artificial intelligence hype that’s boosting tech stocks this year. As of 7:30am ET contracts on the Nasdaq 100 rose 1.2%, while S&P 500 eminis gained 0.6%. Semiconductor firms gained in Europe, while tech also outperformed in Asia. The Bloomberg Dollar Spot Index rallied from its lows of the day, pressuring all G10 currencies, with the yen undoing all its gains in the past 24 hours. Bond yields are flat-to-lower with the 10Y yield at 4.21%, below the 4.25% support level. Global bonds also rallying in the wake of weaker than expected PMI data. Commodities are higher with Ags continuing to lead; gold advanced for a fourth day, set for its longest winning streak since mid-July. Brent crude climbed for the first time this week, while Bitcoin rose. Today’s macro data focus includes durable goods/cap goods orders, jobless claims, KC Fed, and one Fed speaker. As we prep for Jackson Hole comments, the question is: do we receive another hawkish surprise which sends stocks tumbling anew?”


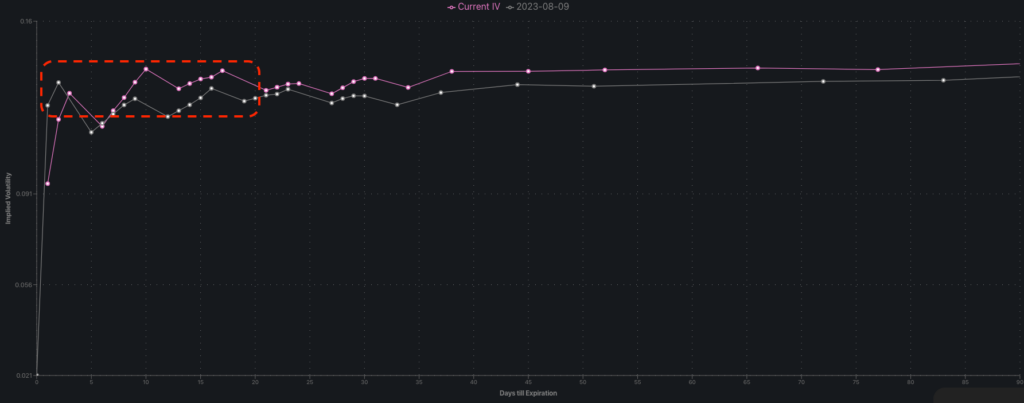
VIX futures made a new retracement low, declining to 15.48 this morning.  A probable support may be the 50-day Moving Average at 14.64.  the hourly Cycle may be due to end this afternoon, so we may see a reversal based on rising concern about the contents of the Jackson Hole presser.


10-year Treasury Note futures declined to a low of 41.75, then found support at the Cycle Top at 41.78.  TNX is at the correction stage for the next week and may consolidate between the Cycle Top and the high.


USD futures are consolidating inside Friday’s trading range and above the trendline.  USD is gaining strength, especially over the coming weekend and into next week, where there may be a Master Cycle peak.  The Cycle Top at 105.35 provides the next probable target.


WTIC futures are consolidating within yesterday’s trading range.  However, it may resume it decline through the end of this week to a Master Cycle low near the 50-day Moving Average and mid-Cycle Support at 75.79.


Gold futures are consolidating within yesterday’s trading range.  Should it decline beneath the mis-cycle support at 1926.80, it may resume its decline through mid-September to a Master Cycle low.  A likely target may be between the Cycle Bottom at 1782.12 and straight line support at 1810.00.


Posted in Published | 1 Comment

August 22, 2023

6:00 am

Good Morning!

A few thoughts in preparation to leaving.

SPX futures have reached an overnight high of 4417.90 on their way toward the 50-day Moving Average at 4448.34.  It has cleared short gamma at 4400.00 and may probe higher in a short squeeze.  Be prepared for a reversal in the next 24 hours.

Today’s op-ex shows Maximum investor pain at 4415.00.  Long gamma may start at 4425.00 while short gamma begins at 4440.00 and is well populated in 50 point intervals, suggesting institutional shorting.


VIX futures have slid to a morning low of 16.73 thus far.  We may see the VIX correct down toward the 50-day Moving Average at 14.56 in the next 24 hours.  Today may offer a buy-the-dip opportunity.

Wednesday’s op-ex shows Maximum investor pain at 18.00.  Short gamma resides at 14.50-16.00, while long gamma begins at 20.00.


TNX futures have pulled back to 43.07 thus far this morning.  While there may be an occasional pullback. TNX remains on a trending mode higher through mid-September.

ZeroHedge observes, “Unlike last year’s fire and brimstone last-minute-revised speech, when the Fed found itself flailing to catch up with runaway inflation, most economists don’t expect Powell to send strong signals about the near-term policy path during his Jackson Hole speech Friday morning.”


Posted in Published | Comments Off on August 22, 2023

August 21, 2023

12:36 pm

SPX is on its second day of retracement.  It has pulled out of Short gamma beneath 4375.00 and may be heading toward Max Pain at 4395.00 into the close.  There may be a need to “buy more time” as SPX may be gathering strength to rise to its 50-day prior to Jackson Hole.


9:44 am

BKX, our liquidity proxy, is due for a bounce.  The 50-day Moving Average is in sight , at 83.74.  However, there may be yet another two weeks of decline to complete the Master Cycle.

ZeroHedge comments, “With money-market fund assets hitting new highs, and banks’ usage of The Fed’s emergency funds facility at record highs, we wonder how much longer The Fed can keep the dream of rising deposits alive (after last week’s massive NSA inflows).

On a seasonally-adjusted basis, The Fed says that total deposits dropped $11BN last week (the first decline in 4 weeks). We also note that the prior week’s inflow was revised higher…


7:30 am

Good Morning!I am taking a short, two-day trip and plan to return on Thursday.

NDX futures have risen t 14793.00 thus far in the weekend session.  Although I did not comment on the NDX last Friday, it may undergo a similar retracement to the SPX.  Today’s short-covering session may rise to retest the 50-day Moving Average at 15163.73 where many speculators have gone short last week.  This short squeeze may only last a day, but it can be brutal.  This is why shorting the market is so difficult and wearing.

Today’s op-ex shows Maximum Pain for options investors at 14700.00.  Long gamma begins meekly at 14800, but rockets up to 14950.00.  Short gamma starts at 14600.00 and may extend to 14250.00.

ZeroHedge comments, “Shorting local lows?

One thing is sure, this market continues to do what it does best; frustrate the crowd. Reposting one of the more important charts over the past days via Goldman’s PB. Shorting has been huge lately. Imagine we bounce…

Source: GS

Oversold in a pic

On July 19 (here) we pointed out just how overbought markets were. Fast forward a month and we are at most oversold levels in a long time…”


SPX futures have risen to 4394.1 thus far this morning.  As mentioned on Friday, the bounce may extend to the 50-day Moving Average at 4446.11.  This short squeeze may only last a few days, but it may be fierce.  The Cycles Model implies a much deeper decline ahead, so plan accordingly.

Today’s op-ex shows Maximum investor pain at 4395.00.  Long gamma starts at 4400.00 and is heavily populated to 4500.00.  Short gamma starts at 4375.00 and climaxes at 4300.00.

ZeroHedge reports, “US equity futures and global stocks are solidly higher to start the new week after a bruising August so far for investors, whose attention now turns to the week’s Jackson Hole symposium (which last year set off a powerful selloff that sent stocks into a painful bear market). Risk is on despite global bonds broadly weaker, with 10Y TSYs rates rising above the 4.25% level that had acted as strong near-term support. As of 7:45am ET, emini S&P futures were 0.5% higher at 4,405, well above Friday’s multi-month lows of 4,350, while Nasdaq futures rose 0.6%. Europe is also solidly in the green, with major markets such as Italy/France/SX5E up more than 1%. Asian stocks were little changed, steadying after six-straight daily losses, even as stocks slumped in Hong Kong and mainland China after Chinese banks made a smaller-than-expected cut to the one-year prime lending rate, confusing markets and traders after last week’s unexpected rate cut.”


VIX futures are consolidating  this morning.    Friday’s high may have been the Master Cycle high, at day 259.  If so, the VIX may also revisit its 50-day Moving Average at 14.49.  The Cycles Model is unclear on how long the retracement may last.  It may be subject to wide swings during the next week, frustrating investors.


TNX is rising this morning after a weekend of trending strength, pushing futures to a high of 43.13 thus far.  The Cycles Model calls for rising rates through mid-September, with occasional pull-backs.  This may fulfil the Head & Shoulders formation target.


USD futures have pulled back to a low of 103.04, possibly testing support at the Mid-Cycle at 102.86.  The Cycles Model warns of a possible resurgence of strength, leading to a trendline breakout.  The rally may continue for another week, with the Cycle Top at 105.79 as a possible target.


Posted in Published | 1 Comment

August 18, 2023

10:50 am

SPX bounced off the named support at 4335.00 this morning and has moved above the wall of puts at 4350.00.  Another wall awaits at 4400.00, while Max Pain lies at 4450.00.  This pattern has created  a new Head & Shoulders formation.  Note the left shoulder is at 4448.47, so an attempt to reach Max Pain is possible.  Even if it should fall short, today’s action may bring the SPX within striking distance of the October low in the following weeks.

ZeroHedge remarks, “Today’s option expiration comes at the end of the worst week for US equities since the collapse of SVB triggered a mini-crisis. According to former Goldman options guru Rocky Fishman, founder of derivatives analytical firm Asym 500, some $2.2 trillion of longer-dated contracts tied to stocks and indexes are scheduled to expire today.”


8:10 am

Good Morning!

SPX futures declined to a morning low of 4345.70 and are hovering near their lows.  The nearest known support is the Minor Wave 4 low at 4335.00.  Should it bounce there it may set up   a waterfall decline to 4060.00 next week.

Today’s op-ex shows   Maximum investor Pain is at 4450.00 with over 30,000 puts and 30,000 calls.  There are walls of puts at 4300 and 4350 that may be defended today.  If so, look for a bounce to 4400.00 or higher.

ZeroHedge reports, “After another very weak session in the US which saw the S&P500 and Nasdaq close lower by -1.2% and -1.1% respectively, with the S&P dropping below 4,400 for the first time since June, today’s $2.2 trillion option expiration session has started on the back foot as stocks slumped putting MSCI’s global benchmark on track for the biggest weekly loss since the March bank crisis, as worries about China and higher global interest rates sapped sentiment.

Europe is red across the board and Asia was down again this morning heading for its 6th consecutive daily decline, with S&P futures trading near session lows down more than 0.5% at 7:45am ET, although there is some respite compared to yesterday’s losses as 10Y Treasury yields retreat mildly from their near 15Y highs this am (yields are modestly lower across the rest of the curve currently too); Nasdaq futures are down more than 0.7%. Treasuries are slightly higher, in line with bonds in Europe, as their declines in recent days take a pause. Iron ore prices are bouncing, oil is marginally lower, while bitcoin is nursing losses from the $2000 flash crash that came out of nowhere late on Thursday afternoon.”


VIX futures have rallied to a morning high of 18.87 and are continuing to hover near their highs.  VIX may be approaching a probable Master Cycle high in the next few days.  A probable target may be the Cycle Top at 24.75.

Wednesday’s op-ex shows Max Pain rising to 18.00.  There is some short gamma below 16.00, but dwindling.  Long gamma begins at 20.00 and rises to 33.00.


TNX futures pulled back this morning to a low of 42.17, while the cash low came in at 42.43.  This suggests TNX may be finished with its correction and may run even higher.  The Cycles Model supports that thesis by showing trending strength over the next few days.

ZeroHedge remarks, “Global yields are heading towards a 15-year high as inflation concerns remains persistent and signs of economic downturns are still elusive.

The latest push higher was partly driven by the minutes of the July FOMC meeting, which revealed that the Committee members’ opinions are diverging. A large majority of the FOMC still saw upside risks to the inflation outlook, which would require further tightening after July. However, a couple of participants had actually preferred to leave the policy rate on hold. A gradual slowdown in economic activity appeared to be in progress, and that increases the risk of ‘overtightening’. The San Francisco Fed argues that Americans have depleted their excess savings from the pandemic, which has so far helped to prop up consumption throughout the hiking cycle.”


USD futures challenged the 200-day Moving Average at 103.36, rising to 103.58.  Trending Strength is rising into the probable Master Cycle high due next week.  A likely target ay be the Cycle Top resistance at 105.90.  However, it may go higher, given the circumstances.

Investing.com observes, “We start with the bigger picture monthly chart for the U.S. Dollar Index (DXY) as the longer-term price patterns can influence the shorter time frames. Let’s review the history briefly to provide some context for the current environment. DXY rallied into the 88.6 Fibonacci retracement in September, peaking at a trend high of 114.78.

The beginning of that uptrend began around February 2021 as the index flirted with support around the 200-month exponential moving average (EMA). That was the second successful test of the 200-month line as support and price eventually reversed higher. Being above the 200-month EMA is bullish and supportive of a continuation higher.”


Posted in Published | Comments Off on August 18, 2023

August 17, 2023

2:05 pm

SPX is approaching a minor support near 4380.00.  You may see a bounce back to 4400.00.  Otherwise, the decline continues for another possible two weeks.  Short gamma is getting even shorter.

ZeroHedge remarks, “Bonds and stocks are trading heavy again today, continuing the recent trend (and reversing the high correlation regime of the prior three months)…

And, if Nomura’s Charlie McElligott is right, that trend could accelerate in the days ahead.

First, in bond-land, the UST long-end has struggled mightily now for a month-and-a-half.”


8:10 am

Good Morning!

SPX futures rose to 4415.90 this morning after yesterday’s sell-off.  The most likely buyer(s) may be Japanese, as the SPX denominated in Yen is still above the 50-day Moving Average, although a reversal from the peak occurred on August 1.  In the US, options gamma and dealer gamma are both negative for the first time, suggesting selling still has a way to go.  The Cycles Model suggests selling may continue to the end of August.

Today’s op-ex shows options in a very tight spot with Max Pain at 4430.00.  Long gamma starts at 4435.00 while short gamma begins at 4425.00.  All it takes is a hiccup to start the selling.

ZeroHedge observes, “Yesterday, when looking at the key levels across the systematic universe, we warned our subs that we are “On The Verge Of A Systematic Dump” and that  “a Drop > 1% Sees Good Size Selling, A Move >2% Is Gonna Be A Mess“. And judging by today’s slide, which broke below all key support levels…

… and closed at the lows, that was indeed the case, with stocks sliding another 0.7% after yesterday’s late session dump with the Fed’s hawkish minutes only adding fuel to the selloff.”

This morning ZeroHedge reports, “S&P futures reversed earlier losses that brought them perilously close to the 4400 support level, as global govt bond yields extended their recent surge to the highest levels since the financial crisis after Fed minutes showed the central bank remains worried about persistent inflation and signaled the possibility of further rate hikes while stubbornly resilient US economic data – one might say purposefully manipulated for political purposes and boosted by massive deficit spending – challenges the view that central banks rates are peaking.

As of 7:30am ET, S&P futures were up 0.2%, reversing a similar drop earlier in the session. Nasdaq 100 futures also rose 0.2% The USD reversed an earlier gain and trade near session lows, helping commodities catch a bid. Sentiment was hammered around the globe: European stocks slumped for a third day with Spain outperforming on the move lower (UKX -0.3%, SX5E -0.5%, SXXP -0.4%, DAX -0.2%.) while Asian stocks dropped to their lowest level since March amid further signs of weakness in China and mounting concerns over elevated interest rates in the US. Today’s macro/micro focus is on jobless claims, the Leading Index, and AMAT/WMT earnings.”


VIX futures eased back down to 16.61 in a slight retracement.  The Cycles Model suggests a further probe higher, possibly into next week.

Next Wednesday’s op-ex still shows Max Pain for investors at 17.00.  Short gamma shrank considerable while long gamma starts at 20.00 and currently runs to 33.00.

ZeroHedge remarks, “Despite the 3% decline in the S&P 500 over the month of August, both S&P 500 realized volatility and implied volatility has remained muted.

“Market down, volatility down/flat” is NOT something we are used to seeing!

This lack of shift in implied volatility is exhibited by the SPX term structure, shown below.


What about VIX?

If the reduction of options positions with expiration leads the SPX to break below 4,400, we may see a meaningful increase in volatility, with the VIX quickly moving to 20.


The other surprising factor when reviewing this expiration is the low level of implied volatility present in most stocks.”


10-year Treasury bond yield futures reached 43.18 this morning, fast approaching the October 21, 2022 high at 43.33.  TNX may end the week on a higher note, as trending strength peaks over the weekend, per the Cycles Model.  The rally may continue to mid-September after the potential breakout to new highs.  The Head & Shoulders formation may have been completed by then.

Investing.com remarks, “Did you know that 2022 was the WORST year for US Treasuries in American history?

The benchmark 10-year Treasury fell nearly 18%, and the United States 30-Year Treasury collapsed by over 39%. Many other bonds did even worse.

Even if you go back 250 years, you can’t find a worse year for Treasuries, the foundation of the colossal global bond market.

It should forever end the ridiculous—yet pervasive—delusion that Treasuries are “risk-free.”

Many people and almost every financial institution have long thoughtlessly accepted this trope.”


USD futures declined to 102.96, testing the mid-Cycle support at 102.90 after testing the upper trendline at 103.50 and 200-day Moving Average at 103.32.  Should we see a breakdown, the Cycles Model allows a decline to a new low by the end of the month.


Crude oil futures hit a low of 78.95, just above the trendline at 78.00.  The Cycles Model calls for the decline to continue for about two more weeks.  A likely short-term target for the decline may be the 50-day Moving Average at 75.20.  However, the Cycles Model suggests a lower target later this fall near the 61.8% retracement of the 2020-2022 rally at 53.97

ZeroHedge notes, “According to the Forbes Global 2000, Saudi state oil enterprise Saudi Aramco is once again the world’s most profitable company – this time with a big lead over second-placed Apple as oil and gas prices skyrocketed as part of the global energy crisis in the aftermath of the Russian invasion of Ukraine.

As Statista’s Katharina Buchholz reports, there are now three oil and gas giants among the top 8 most profitable companies in the world – up from just one in 2019.

Infographic: The Most Profitable Companies in the World | Statista

You will find more infographics at Statista

Saudi Aramco had already been touted as the most profitable company in the world before going public in late 2019.”


Gold futures declined to 1919.30, challenging the mid-Cycle support at 1921.26.  Gold has bounced to 1933.25, but it may not last.  The Cycles Model suggests trending strength may increase as the decline moves beneath critical support.  The next visible support may be at 1810.00, followed by the Cycle Bottom at 1765.97.  The decline may extend to mid-September.


Posted in Published | Comments Off on August 17, 2023

August 16, 2023

8:00 am

Good Morning!

NDX futures have remained in a tight range overnight, venturing higher, but settling beneath the 50-day Moving Average at 15149.46.  It is on a confirmed sell signal with possibly up to two weeks of decline ahead.  The 100-day Moving Average at 14232.63 lies beneath it.  But, more importantly, the August high at 13720.91 may be a worthy target.

Today’s op-ex shows Maximum Pain for options investors at 15040.00.  Long gamma starts at 15100.00 wile short gamma begins at 15000.00.

ZeroHedge remarks, “Regular readers – and certainly market traders – may remember June best for being the month the S&P finally broke out above the 4,200 resistance level that had capped the rangebound market since last August.

And courtesy of the just released Treasury International Capital data released moments ago by the Treasury, we now know who was behind this powerful breakout higher.”


SPX futures edged lower in the overnight markets to 4431.30before levelling off near the close.  It remains just beneath the 50-day Moving Average at 4439.05, giving it a confirmed buy signal.

Today’s op-ex shows Max Pain at 4450.00.  Long gamma may begin at 4470.00 while short gamma starts at 4420.00.

ZeroHedge reports, “US equity futures and European stocks are little changed, having swung between gains and losses, following a broadly negative session in Asia where concerns surrounding the Chinese economy (home prices fell for the first time this year, fueling recession concerns despite increasing expectations for more stimulus) and the implosion of shadow banking giant Zhongrong (China’s Blackstone) continued to weigh on sentiment with focus remaining on earnings.

As of 7:30am, S&P 500 and Nasdaq 100 futures were unchanged, with JPM’s trading desk wondering if “there is enough momentum to stage a relief rally today” (full note available to pro subs). Commodities are rebounding across all three complexes with USD weaker. Government bonds in the US and Europe were broadly stronger, with US 10-year yields falling 3bps to 4.18%, halting a run of losses that was fueled by concern interest rates will be kept at high levels for longer than expected. The dollar rebounded from an early selloff while the pound strengthened as UK inflation topped expectations. Today’s macro focus is the Fed Minutes, housing data, Industrial Production, and Consumer-sector earnings.”


VIX futures edged higher, to 16.58 as it remains inside yesterday’s trading range.

Today’s op-ex shows Max Pain near 16.00.  Short gamma rules from 13.00 to 16.00.  Long gamma starts at 17.00 and runs to 60.00.  Options volume falls off after today’s expiration until the September 20 monthly expiration, so there is dealer incentive to hold the line to the close today.

Hedgeye observes, “For most of the past two decades, the S&P 500 and VIX have been inversely correlated: When one goes down, the other goes up. That changed abruptly in 2022. What caused the S&P and VIX to suddenly move in unison?

“I’ve never seen it before. This is unusual and not something we should expect to see,” says Tier 1 Alpha Senior Executive Advisor Mike Green. “This chart highlights the frequency with which weird things happen.”

Tier 1 Alpha: Are 0DTE Options Killing The VIX? - Tier1 Alpha SPX VIX Correlation Fixed

The red vertical line running through 2022 identifies a pivotal point when the CBOE introduced Tuesday and Thursday expirations for 0DTE options.”


TNX pulled back from yesterday’s high and may attempt to find support at the Cycle Top at 41.12.  However, trending strength is staging a comeback this weekend.  We may expect to see the uptrend resume.

ZeroHedge observes, “The recent rise in yields will push mortgage rates higher which, along with consumer credit that has already been tightening, will squeeze consumption further. Higher-duration consumer discretionary and retailing stocks are likely to underperform.

With US rates nudging 2008 highs, the outlook for yield-sensitive consumption is darkening. Higher yields are leading to higher mortgage rates. This is not a fait accompli as it also depends on the mortgage spread, but the correlation between yields and spreads has become much less negative, and thus it is reasonable to expect higher yields will bring higher mortgage rates.”


USD futures continue to consolidate between the mid-Cycle support at 102.92 and the 200-day Moving Average at 103.14.  A breakout is possible, as the current Master Cycle continues to the end of the month.


Crude oil futures are bouncing inside yesterday’s trading range.   Its Master Cycle terminated at the CycleTop and reversed, creating an aggressive sell signal.  The Cycles Model suggests a possible bounce off the trendline by the end of the month.  Beneath the trendline is a confirmed sell signal.


Posted in Published | Comments Off on August 16, 2023

August 15, 2023

1:37 pm

SPX came within points of the 50-day Moving Average at 4339.00 and bounced to 4460.00.  It is coming back down for a retest.  Supports vanish beneath that level, so we may expect quite a drawdown once the break occurs.  Remember, SPX is in short gamma beneath 4470.

ZeroHedge remarks, “After last week’s dovish CPI print (which sent stocks spiking higher before they closed near session lows), Goldman’s traditionally bullish flows guru, Scott Rubner, refused to backtrack on his recent bearish posture and with dealer Gamma flipping negative for the first time in 2023…

… he told clients to “sell the CPI“, a call which similar to his previous bearish reco, has so far proven correct.”


10:48 am

The Ag Index has fallen to new lows as consumption lags behind production of foodstuffs.  This gives us an opportunity to stockpile nonperishable food and accumulate shares of agricultural commodities and companies.  There is only another week left in this current Cycle as GKX may decline to 380.00 to 387.00.


10:26 am

BKX, our liquidity proxy, is slipping beneath the 50-day Moving Average at 83.57. BKX is now on a confirmed sell signal.  The decline may continue into the first week of September.  A panic may develop in the final week of the decline.

ZeroHedge observes, “At the start of August, Fitch Ratings downgraded the US government’s top credit rating. Last week, Moody’s cut the credit ratings of small and midsized US banks because of higher funding costs, potential regulatory capital weaknesses, and rising risks tied to commercial real estate loans. Now, another week, another possible downgrade, this time of major banks.

Fitch analyst Chris Wolfe told CNBC another round of turmoil could be nearing for the banking industry. He said the ratings agency is mulling over sweeping rating downgrades for dozens of banks, including ones as big as JPMorgan Chase.”


8:15 am

Good Morning!

NDX futures declined to 15092.90 in the overnight session.  It has not broken down to new lows yet, but has fallen beneath the 50-day Moving Average at 15134.39, reinforcing the confirmed sell signal.  The Cycles Model indicates a decline to the end of August, ending the current Master Cycle.  Readers have asked, “Why the spike high/low at the end of the day?”  There are other considerations, but, from a Cyclical point of view, A spike high/low at the end of the day often indicates the end of a  Cyclical segment and may precede the opposite move the next day.

For the recent readers of this blog, a brief explanation is in order.  Cycles are not sine waves.  They are not linear.  They are multi-faceted and may be observed on an hourly, daily, weekly, monthly and annual basis.  My Cycles Model employs six Master Cycles, all working in unison with one another.  Cycles have a memory, which introduces support and resistance.  They have an element of time and space, which establishes boundaries and trendlines.  Cycles work in co-ordination with the cash (daytime) market, the futures market and the options market.  Cycles are not easy to learn.  It takes discipline and a certain courage of your convictions.  While Cycles often act with precision, they may be subject to misinterpretation, even to the most trained eye.  However, with a bit of humility one may recover quickly and get back on track.

In today’s op-ex, Maximum Pain for options investors lies at 15175.00.  Long gamma starts at 15200.00 and shows pockets of bullish sentiment to 15350.00.  Short gamma begins at 15150.00 and shows investor interest down to 15000.00.

Wall street would love to keep everyone fully invested, especially in a bear market.  Unfortunately, the following articles come out at market peaks, when the statistics appear most favorable.  You will note that this article did not appear last October, at the market low and will not appear again for several years after this.

Zerohedge remarks, “Timing the market seems simple enough: buy when prices are low and sell when they’re high.

But, as Visual Capitalist’s Dorothy Neufeld details below, there is clear evidence that market timing is difficult. Often, investors will sell early, missing out on a stock market rally. It can also be unnerving to invest when the market is flashing red.

By contrast, staying invested through highs and lows has generated competitive returns, especially over longer periods.”


SPX futures declined to a morning low of 4452.10, back into short gamma after yesterday’s closing spike high.  The spike high may have been due to an effort by the dealers to get SPX out of short gamma territory beneath 4470.00.  The short squeeze may have also been an effort to elevate the SPX above the 50-day at 4434.00.  Once beneath the 50-day, there are no visible supports down to the mid-Cycle support at 4140.00 or the 200-day Moving Average at 4128.00.  This is where the heretofore stair-step decline turns into a stumble and fall..

Today’s op-ex shows Maximum investor Pain at 4485.00.  Long gamma starts at 4510.00 and remains strong to 4550.00.  Short gamma begins at 4470.00 and stretches to 4350.00.

ZeroHedge reports, “US futures and global markets are weaker and bond yields resume their ascent, amid growing concerns that China’s economic slowdown and debt problems – which prompted Beijing to unexpectedly cut rates the most since 2020 amid mounting economic gloom …

… will spread to the global economy. As of 7:45am ET, S&P futures were at session lows, down 0.7% while Nasdaq futures dropped 0.6%, with Tech outperforming on the move lower.”


VIX futures rallied back to 15.99 this morning.  Monthly options expiration for the VIX are on Wednesday and trending strength may remain until the end of the week.

Tomorrow’s op-ex shows Max Pain for investors at 17.00.  Short gamma runs from 16.00 down to 11.50.  Long gamma begins at 17.00 and may run to 60.00.

ZeroHedge remarks, “hese more aggressive moves in markets (two-way price action) are because of the market’s overall shift to negative gamma as we highlighted previously.

Once it entered that range, price action became visibly choppier, as expected during these conditions. However, it is still in a small percentage range relatively speaking. We would expect that percentage range to increase the longer we remain in negative gamma territory.”


TNX futures spiked to 42.80 this morning (cash high at 42.74) to complete a probable impulse higher.  Today we may see a retracement back to the Cycle Top at 41.01.  The Cycles Model supports a continued rally until mid-September.  UST (close at 110.58) shows an inverse profile to TNX.  It has broken beneath the neckline of a massive Head & Shoulders formation with a target near 80.00.  For those who are trying to decide between stocks and bonds, the answer may be “Neither.”

RealInvestmentAdvice speculates, “Government bonds or stocks? If you were picking an asset class to outperform over the next 18-24 months, which would you choose? Such was an interesting point made by Greg Feirman last week. To wit:

“The market has now priced in a soft landing based on the idea that the Fed can get inflation under control without causing the economy to roll over into recession. As a result, investors have piled into QQQ and completely lost interest in TLT. Personally, I’m of the opposite view:

All the Fed’s tightening is still working its way through the economic system and will eventually cause the economy to roll over into recession. In addition, Big Tech is now mature and will have to be repriced from growth stocks to value stocks, putting significant pressure on the indexes. If I’m correct, this creates one of the best contrarian trades I’ve seen: Long TLT, Short QQQ. TLT closed Monday at $95.58, while QQQ closed at $375.19. My 18-month price targets are TLT $135 and QQQ $280.“”


USD futures are consolidating within yesterday’s trading range.  This week may see a pullback to either the 50-day Moving Average at 102.09 or Intermediate support at 101.60.  Next week shows a return of trending strength through the end of the month.  Once above the 200-day Moving Average at 103.44, the Cycle Top at 106.09 my be considered.


Posted in Published | Comments Off on August 15, 2023

August 14, 2023

10:15 am

The Ag Index is heading into its last week of decline prior to its proposed Master Cycle low.  As reports of the harvest season come inwe may gain insights on the adequacy of the harvest.  However, world wide news shows shortages already rising.  This (week) is the time to accumulate food and food-related investments while at the low.  The weekly target may be 380.00 to 387.00.

ZeroHedge warns, “We live in perplexing times. It’s almost inconceivable to think that there’s a war being waged against food, an absolute and undeniable necessity of life. Yet, here we stand, on the precipice of what looks like a catastrophic agenda against global sustenance.

So, what’s this newfound hostility against the thing that keeps us alive?

Take a deep breath. Farming uses nitrogen, and suddenly, nitrogen is the new antagonist in the tale of global warming. The narrative is simple: eliminate nitrogen, save the world. Yet, in the name of “preservation,” entire segments of our food production are under siege.

Consider rice – a staple for half the world’s population. Renowned agencies claim, “Rice accounts for roughly 10% of global methane emissions,” emphasizing the urgent need to curtail its production. But the ramifications? Starvation for billions.”


9:55 am

BKX, our liquidity proxy, has declined beneath Intermediate support at 85.43, which may change its signal to a confirmed sell.  The Cycles Model affirms that the decline may continue through the end of the month.  The Head & Shoulders target is currently in play.

ZeroHedge reports, “Money-market funds saw inflows and banks’ usage of the Fed’s emergency BTFP facility hit a new high this week, so what malarkey does The Fed have in store when it tries to explain what happened to bank deposits.

Seasonally-adjusted, total deposits rose by $17.6 billion last week (the 3rd straight week on SA inflows)…

Source: Bloomberg

And for once, non-seasonally-adjusted deposits rose too (by a huge $121 billion!)”

ZeroHedge further comments, “In the euphoria of buoyant equity markets over the last few months, the many challenges facing regional banks have receded into the background. While it certainly has not been our view, a narrative has emerged that the issues in the sector which erupted in March are largely behind us. Moody’s rating downgrades of 10 US banks last week provide a reminder that the headwinds of increasing capital requirements, higher cost of funding, and rising loan losses continue to challenge the business models of the regional banking sector. While the total volume of debt downgraded thus far is relatively small at around $10 billion, Moody’s put six banks on review for possible downgrade and changed the outlooks of 11 banks to negative from stable. Thus, the volume of bank debt facing the prospect of a downgrade is much higher – well over $100 billion.”


900 am

SPX futures have been hovering between 4448.90 and 4485.60 over the weekend session.  It is trapped in short gamma.  Any jolt or quiver may send the SPX into a self-reinforcing spiral as short gamma forces dealers to sell low and buy high, chasing the ebb and flow of the markets.  This week is monthly options expiration, which may lead to a panic decline, especially after the SPX breaks through the 50-day Moving Average at 4428.82.

In today’s op-ex, Maximum Pain for options investors is at 4475.00.  Long gamma starts at 4500.00 while short gamma may begin at 4450.00.

ZeroHedge reports, “Futures have reversed earlier losses and are trading higher amid speculation (what else) for Chinese stimulus to address mounting financial and real estate risks, with European markets mixed and Asia slumping on the latest barrage of bad news out of China which however have not (yet) spilled over to the ROW. As of 7:45am ET, S&P emini futures were up 0.2% while Nasdaq futures traded 0.3% higher. 10Y TSY yields are flat at 4.15%, stabilized near their highest level since November. Commodities are lower with USD flat; energy and base metals coming for sale on weaker Chinese growth expectations while Ags mixed on Black Sea headlines. This week’s focus is on Consumer-sector earnings and Retail Sales data, but aside from that this week is an information vacuum into next week’s Jackson Hole so look for positioning/liquidity to guide markets.”


VIX futures rose to a morning high at 16.06 as it rises back toward the trendline.  The Cycles Model calls for rising trending strength through the end of the week.

In Wednesday’s (monthly) op-ex, Maximum Pain for options investors is at 17.00.  Short gamma is heavily populated between 13.00 and 16.00.  Long gamma may begin at 17.00 and has strong support to 60.00.  Remember, long or short gamma can be self-reinforcing.

ZeroHedge observes, “The Fear & Greed Index, created and popularized by CNN, is a powerful tool that captures investor sentiment and confidence levels. It rises when markets are greedy and falls when investors are fearful.

In this infographic sponsored by Fidelity InvestmentsVisual Capitalist’s Rida Khan and Alejandra Dander compare the Fear & Greed Index with the CBOE Volatility Index (VIX) to see the connection between volatile markets and the impulses of investors.”


TNX futures rose to a morning high of 42.00 as it seeks to overtake the August 4 high at 42.06.  The Cycles Model suggests another month of rising rates which may lead to the Head & Shoulders target.

9:40 am

The 10-year futures rate just exceeded the prior high.  The cash rate may soon follow.

ZeroHedge (Thanks, Mish) observes, “US Treasury yields rose last week despite a relatively tame CPI report. Mortgage rates rose as well. What’s going on?

30-year mortgage chart courtesy of Mortgage News Daily, annotations by Mish

30-Year Mortgage Chart Notes

  • On Friday, August 11, 2023, mortgage rates jumped to 7.19 percent and approach the October 20, 2022 high of 7.37 percent as noted by Mortgage News Daily.
  • The 7.37 percent rate was the highest since October of 2000, nearly 23 years ago.”


USD futures rose to a morning high of 103.33, crossing above the mid-Cycle resistance at 102.95.  USD is on a buy signal \.  Above the 200-day Moving Average at 103.48, the target may be the Cycle Top at 106.15.  The Cycles MOdel suggests the USD may rise through the end of the month.


Posted in Published | Comments Off on August 14, 2023

August 11, 2023

3:12 pm

SPX is caught in short gamma with heavy layers of puts at 4500, 4480 and 4465 trapping it and effectively keeping it from rallying.  At the same time there are more clusters of puts at 4450 and below that may exacerbate the decline, forcing dealers to sell on the way down and reinforcing the decline with even more selling.  Currently there appears to be a stalemate.  At some point a breakdown may occur, especially as the markets approach monthly options expiration next week.

ZeroHedge observes, “Under the hood change

Intraday volatility has surged, and along with short gamma, it could spark more serious moves as dealers need to adjust deltas dynamically. Most short gamma dealers hedge according to models, but when markets start exhibiting a “sudden” increase in intra day volatilities, those models tend to get overruled by “fear”…often resulting in dealers selling lows and chasing highs.

Source: Tier1Alpha

SPX – momentum levels to watch

Scott Rubner outlines:

4457 – short term CTA momentum turns negative…will unlock $5bn SPX supply over 5 sessions….but 4278, medium term is the big one to watch. 4427 is the 50 day moving average. Downside is the main risk with the 1 month big down scenario being absolutely massive: $267bn to sell (-$79bn to SELL in S&P).


9:17 am

BKX continues to lose ground toward the 50-day Moving Average at 84.85.  A decline beneath that level may produce a confirmed sell signal.  The Head & Shoulders formation is still active and may produce another waterfall event such as that seen in March.  The key is that third Waves are never the smallest in a series, suggesting that the Head & Shoulders target is reasonable.  Banks are losing deposits to money market funds at a staggering rate.

ZeroHedge reports, “US Money Market funds saw a fourth straight week of inflows ($14 billion this past week) to a new record high of $5.53 trillion…


7:45 am

Good Morning!

NDX futures are hovering at the lower part of its trading range, beneath the 50-day Moving Average at 15135.00.  This constitutes a confirmed sell signal.  The Cycles Model infers a rising volatility going into next week’s monthly options expiration.

Today’s op-ex shows Maximum investor pain at 15120.00.  Long gamma begins at 15150.00.  Put options gain ascendancy at 15120.00, while short gamma tales over below 15030.00.  Sentiment in options is turning bearish with growing put positions beneath 15000.00.

ZeroHedge observes, “Meaning of the day

Goldman’s Scott Rubner nails it: “Market moves are exacerbated, and no longer muted, this is new, and changed today”. This is very true, and very important going forward.

SPX – the only thing that matters

The “holy” trend channel since March lows. We are in the lower part of the channel, still slightly above the 50 day…

Source: Refinitiv

So rates matter after all?

Reality kicking in lately…although the gap between NASDAQ and the 10 year (inverted) remains extremely wide.”


SPX futures are trading flat this morning, bouncing between a new low of 4460.10 and a high of 4479.50.  SPX is deep in short gamma, which may take over at the open.  Conditions are such that the slightest tremble in the markets may set off a landslide.

Today’s op-ex shows Max Pain at 4485.00.  Long gamma starts at 4500.00 with some follow-through to 45550.00.  Short gamma begins at 4480.00 with a put wall of 11,036 contracts.  Large put positions occur at 4465.00 and 4450.00 with another substantial put wall at 4400.00.  Puts are well populated down to 4250.00.

ZeroHedge reports, “US futures are flat, with European and Asian stocks red, as concern about local government debt in China and hawkish language from a US central banker put traders in a risk-off mood. Meanwhile, in the latest diplomatic fiasco from Joe Biden, the US president blasted China’s economic problems as a “ticking time bomb” and referred to Communist Party leaders as “bad folks,” his latest barb against President Xi Jinping’s government even as his administration seeks to improve overall ties with Beijing. As of 7:45am ET, S&P futures were flat while Nasdaq 100 futs were down 0.1%. Treasurys yields are 1-4bps lower led by the front-end with 10Ys at 4.10%; the USD reversed an earlier gain and was last trading near session lows. Commodities are mixed with oil reversing earlier losses and following gold higher. Today, the macro focus will be PPI and U of Mich survey: the Street expects PPI to print 0.2% MoM vs. 0.1% prior, while U of Mich Consumer Sentiment is expected to drop to 71.3 consensus from 71.6 prior.”


VIX futures traded lower to 15.48 before recovering to the flat line.  The dhart structure implies a Cup with Handle formation with an average target at 23.55.  It is more likely that the VIX amy rise to the Cycle Top resistance at 25.15.

Wednesday’s op-ex shows Max Pain for options investors at 17.00.  Short gamma starts at 16.00 and remains well-populated to 13.00.  Long gamma starts at 18.00 and has strong positions to 60.00.


TNX has risen above the neckline of the Head & Shoulders formation at 41.00 this morning.  The Cycles Model shows growing trending strength, suggesting a new high may be pending.  Should that be so, the next resistance is the October high at 43.33.

ZeroHedge reports, “With much trepidation ahead of refunding week following some dire forecasts about a deluge Treasury supply in the coming quarter, moments ago the Treasury sold the last coupon auction of the week when it placed $23BN in 30Y paper in willing hands and while the sky did not fall, the auction was clearly the ugliest of the lot.

Stopping at a high yield of 4.189%, the 30Y auction priced at the highest yield since July 2011, and was well above last month’s 3.910%; it also tailed the When Issued 4.175% by 1.4bps, the highest tail since February.

The bid to cover was 2.42, the lowest since April and below the 6-auction average of 2.39.”


USD futures rose to 102.61,  exceeding the 50-day Moving Average at 102.14.  It is on a buy signal with rising trending strength to the end of August. Just above it are the mid-Cycle resistance at 102.97 and the 200-day Moving Average at 103.53.


Posted in Published | 7 Comments

August 10, 2023

3:00 pm

Update:  SPX declined to a new low this afternoon, just above the short gamma wall at 4450.00.  A bounce has ensued with the intent (?) of closing at Max Pain at 4495.00.  However, this probe may be stopped at 4485.00, which is mid-Cycle resistance.  So the decline may resume this afternoon with a minimum downside target of 4415.00, using Elliott Wave guidelines.  It is back in negative-to-short gamma, so we will see whether the dealers can defend the current low…or not.


11:25 am

BKX, our Liquidity proxy, resumes its decline as it may retest the 50-day Moving Average at 84.60 today.  Beneath that level is a confirmed sell signal.  The Cyclies Model infers that the decline may last until early September.  If you thought the decline to the March 24 low ws bad, this one has the potential to be a disaster.  Third Waves cannot be the smallest.  In this case, the Head & Shoulders target may meet this test.

ZeroHedge remarks, “Money supply growth fell again in June, remaining deep in negative territory after turning negative in November 2022 for the first time in twenty-eight years. June’s drop continues a steep downward trend from the unprecedented highs experienced during much of the past two years.

Since April 2021, money supply growth has slowed quickly, and since November, we’ve been seeing the money supply repeatedly contract—year-over-year— for six months in a row. The last time the year-over-year (YOY) change in the money supply slipped into negative territory was in November 1994. At that time, negative growth continued for fifteen months, finally turning positive again in January 1996. ”


10:40 am

SPX extended its Cycle for a day as it finally corrected the 9-day decline with a 45% retracement.  I had mentioned earlier that Monday’s high at 4519.84 needed to be met.  Yesterday’s morning futures only went to 4517.10, falling short of the retracement requirement, but I gave it a pass.  Now that the correction has been made, a decline beneath the mid-Cycle support at 4484.58 tells us the decline may be resuming.  Recall that puts are dominant beneath Max Pain at 4495.00 with short gamma beneath 4450.00.

ZeroHedge advises, “Earlier in the week, we warned “the clock is ticking on negative market gamma”, noting that the longer the market remains trapped in negative market gamma territory, the more dangerous it gets because there is more opportunity for fragility (from declining liquidity and shock absorbing gamma) to meet a burst of systematic market risk or other kind of momentum event.

Today, we see a potential ‘event’ in the rebound in CPI (albeit as expected) and – as it does – the US equity market has decided that is a buy, with stocks up over 1% out of the gate (after some initial chop)…

But, just as he did last week, Goldman Sachs’ Flows Guru Scott Rubner has issued a note telling clients to “Sell The CPI Green, Again”.


8:00 am

We mourn and pray for those residents and visitors who lost so much in Lahaina.  My wife and I have had many fond memories going back 40 years to our first visit. Now, they are only memories.

Good Morning!

SPX futures bounced to 4497.40, testing resistance at 4500.00.  The most likely explanation for these overnight bounces, especially since August 3, is due to short gamma.  As the SPX closes in short gamma, the dealers and hedge funds have to monetize those short option profits.  Many people think of the options market as “insurance.”  That could not be further from the truth, as dealer-held positions that cover those options must be sold.  In other words, dealers must cover shorts or buy long positions to pay off the profitable put options.  To make things more difficult, speculators have been piling into 0-DTE puts, aggravating the daily swings.   This condition cannot last.  Something may break…and soon.

We will be watching closely at the CPI announcement at 8:30 am.

In today’s op-ex, Maximum Pain for options investors is at 4495.00, which also explains the overnight bounce-back.  Long gamma starts at 4540.00, while short gamma begins at 4450.00.  There is a very large put wall (7135 contracts) at 4400.00.

ZeroHedge reports, “US equity futures and European bourses rebounded from yesterday’s slump and are higher into CPI, which may provide clues on the Federal Reserve’s next steps, with slight outperformance from MegaCap Tech. As of 7:45am ET, both S&P and Nasdaq 100 futures were up 0.5%. The Stoxx 600 was up 0.4%, with travel and luxury companies among the biggest gainers on speculation that companies will benefit an increase in Chinese tourism spending after Beijing lifted travel curbs. The dollar dropped against all majors except the yen; bond yields are flat and oil slipped while metals and ags prices are higher. Today’s focus is on the CPI print at 8.30am; there are two Fed speakers this afternoon.”


VIX futures are consolidating within yesterday’s trading range.  The VIX ix on a confirmed buy signal, which means shares/options may be purchased on the pullbacks.


Next Wednesday’s monthly op-ex shows Maximum Pain for options investors at 17.00.  There is a massive put wall at 14.00-15.00.  Long gamma becomes very strong at 20.00 and has pockets of strength up to 60.00.  Should long gamma take hold, we may see a move very much like the one last seen in March 2020.

ZeroHedge reports, “Expectations for this morning’s must-watch CPI print were for a MoM and YoY rise in the headline, and modest slowing of the core YoY. However, The Fed will be watching its new favorite signal – Core Services CPI Ex-Shelter – which reaccelerated in July (+0.2% MoM, and from +3.9% to +4.0% YoY)…”


The TNX correction may have “bottomed out” this morning as yields may rise with higher inflation (see above article).  The 10-year yield rose briefly to 40.38 before pulling back.   The Cycles Model points to rising trending strength the rest of this week and early next.  Should TNX break out, we may see it rise to 45.00 or higher.

ZeroHedge reports, “When the Treasury issued its latest refunding schedule last week and yields blew up on the ominous TBAC forecast of a lot more issuance on deck, few expected this week’s auctions to be outstanding. Yet yesterday’s 3Y auction was nothing short of stellar, and despite fears that we would see some blow up in today’s sale of $38BN in benchmark 10Y paper, not only was today’s just concluded auction strong but it was in fact one of the strongest 10Y auctions this year.”


USD futures slid to 101.60 before a bounce brought it back toward 102.00.  For the time being, Intermediate support at 101.56 may be the low.  The 50-day Moving Average is at 102.17.  A breakout above the 50-day may mean a resumption of the rally.


WTIC stretched its Master Cycle to the last possible day – 275, before an overnight reversal.  The Cycles Model implies a sharp decline into the end of August may be on deck.  The Wave structure suggests a decline to the mid-60’s may be in order in this decline.

ZeroHedge notes, “Oil prices are higher (again) this morning, with WTI testing $84 – 2023 highs – as fears of global markets tightening continues. European NatGas prices are also pulling oil (and coal) higher and a weaker dollar is helping.

“There is no doubt that there is plenty of momentum here, and traders are really ignoring all the bad news that is embedded in the Chinese data, which many analysts are trying to drum as loud as they can,” Naeem Aslam, chief investment officer at Zaye Capital Markets, said in a note.

“Oil traders are feeling highly comfortable with their approach when it comes to trading oil prices, and the clear trend seems to be skewed to the upside,” he wrote.

After last week’s record-breaking drawdown, all eyes will be on the crude inventory report for a bounce (or follow through).”


Gold futures tumbles through critical supports yesterday, creating a confirmed sell signal.  The overnight futures then bounced to 1963.30 before crashing back through the 50-day support at 1958.51 and Intermediate support at 1953.78.  Volatility is rising and with it a possible decline lasting through late September.  The initial support for this decline may be the Cycle Bottom at 1754.23.


Posted in Published | 8 Comments