April 14, 2021

3:04 pm

Using the Cycle Top trendline as an Ending Diagonal, we may take a small (aggressive) short position here.  There’s a long way to go to get confirmation, so patience is still the key word.

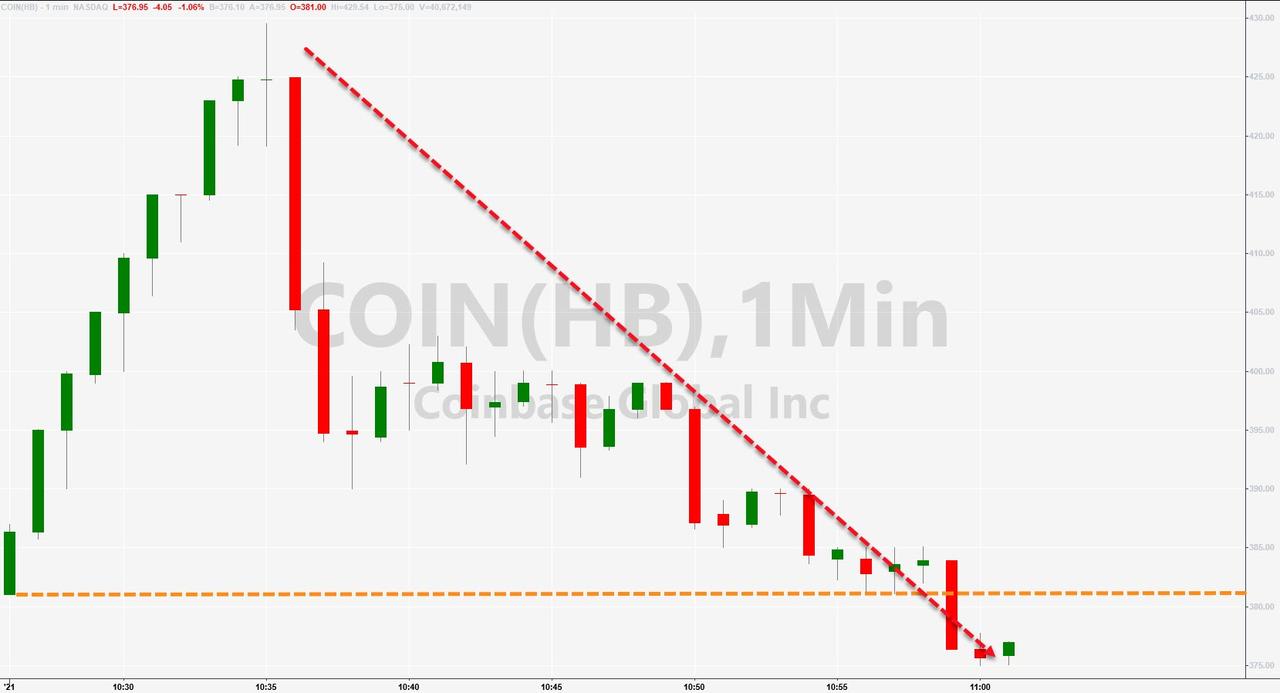
ZeroHedge observes, “Having surged from an open at $381 to almost $430, COIN has tumbled back to $375…

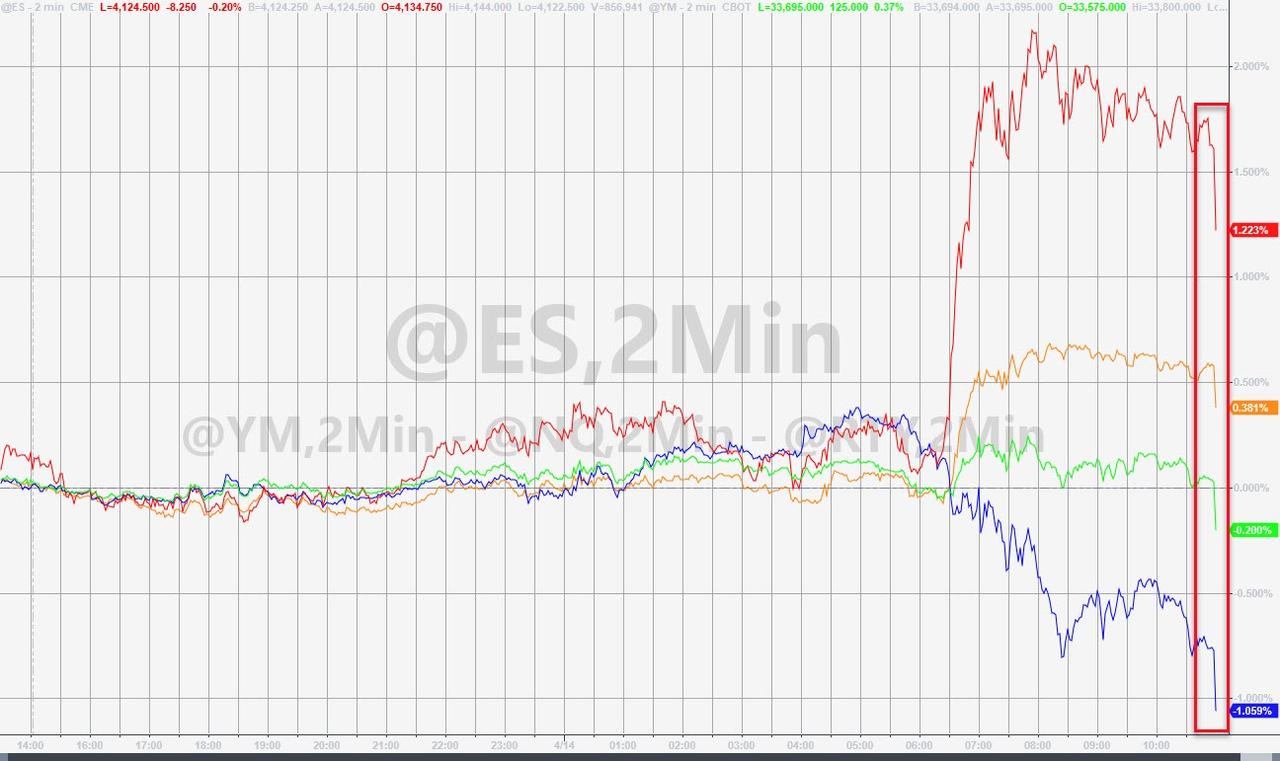
And the moment COIN broke its opening print, US equity markets appeared to puke…

Is this really the market now? …as goes COIN, so goes US stocks?

Bitcoin also legged lower…”


8:10 am

Good Morning!

The Ending Diagonal has narrowed down to an impossibly thin space (24 points).     SPX futures have been confined to an even narrower space (4130.00 – 4139.00).  EW relationships suggest the final high may be near 4200.00.  Following that, a  breakdown may be imminent, just in time for options expiration.


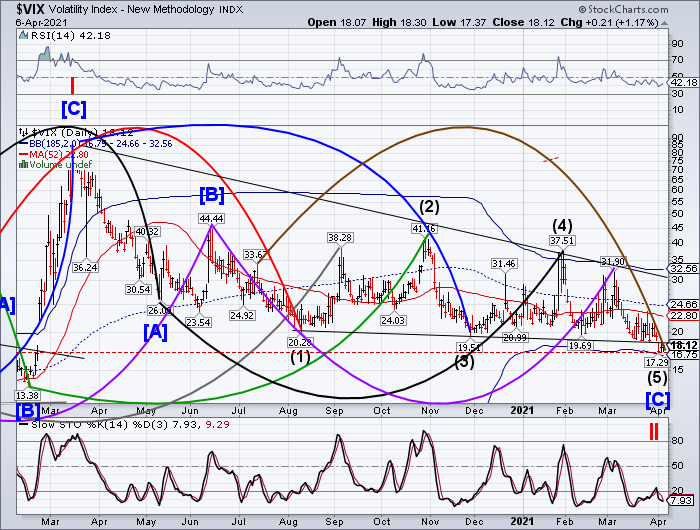
VIX futures have dipped again, with a possible low at 15.70.  If so, VIX has a new Master Cycle low on day 246 of the current Master Cycle.  There is no surprise here.  VIX options/futures expire at the end of today.

Sven Henrich tells us, “m a very lonely voice in equity markets right now. Technically nothing has really surprised me yet, not the VIX crush to the February gap fill, nor the move toward the 4156 zone on ES, all of these were part of the risk spectrum since the beginning of the year. The only surprise here is the velocity of the prices, the complete lack of respect for any deviating correlations such as moves in the dollar and yields.

Everything continues to be ignored. But because things are ignored doesn’t mean they don’t matter.

Nothing matters inside of a bubble until it does. The phrase new paradigm is becoming ever more prevalent to justify prices and the tape. Truth be told, there is no new paradigm except this one: More artificial liquidity than ever and more debt spending than ever and as a result people chasing stocks into higher valuations than ever.

That’s it. There is no mystery.”


Posted in Published | Comments Off on April 14, 2021

April 13, 2021

9:55 am

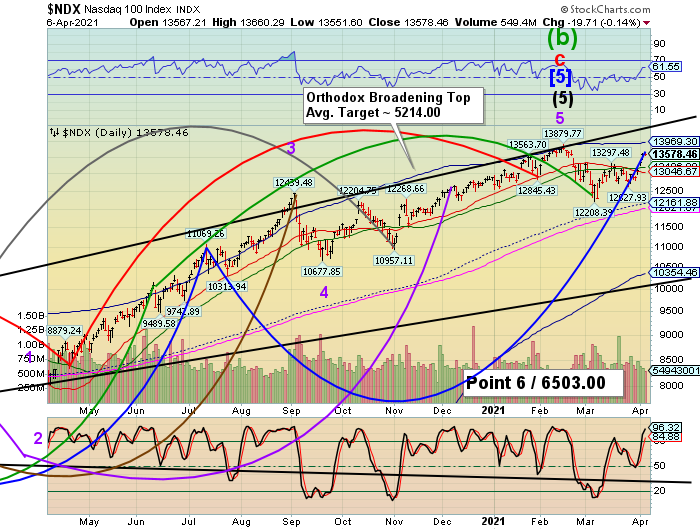
NDX just made a new all-time high, confirming the Ending Diagonal formation in it, also.  It appears that the Cycle Top resistance at 14058.60 may be the stopper.  A nearby trendline (not shown) is at 14100.00.  Standby for some fireworks!


8:00 am

Good Morning!

SPX futures are down, making an overnight low of 4101.62.  We await the crossing of the Short-term support at 3997.28 (4000.00) for an aggressive sell signal, unless otherwise indicated by the VIX and Hi-Lo.  I have carefully considered all of the indicators (VIX, Hi-Lo, etc.) and have concluded that the end may be closer than we think.  This observation supports an Ending Diagonal, which has been camouflaged by all the stimulus and liquidity thrown at the market.  An Ending Diagonal may end this week.

ZeroHedge reports, “After trading flat for much of the overnight session in anticipation of today’s key event, the CPI report (due out at 830am ET), US equity futures and European markets tumbled at precisely 7am after a report that the US will pause Johnson & Johnson vaccines amid health concerns, potentially dealing a blow to efforts to reopen the world’s largest economy.

Futures on the S&P 500 fell and reopening sensitive Russell 2000 contracts lost almost 1% after the New York Times reported and FDA confirmed that the US would will call for an immediate pause in use of Johnson & Johnson’s single-dose coronavirus vaccine  after six U.S. recipients developed a rare disorder involving blood clots. All the six recipients were women between the ages of 18 and 48. One woman died and a second woman in Nebraska has been hospitalized in critical condition, the NYT reported.”


The Shanghai Composite just crossed beneath mid-cycle support at 3401.15, which doubly confirms its sell signal.  If my thesis that China equities will lead the decline is correct, this is a warning shot that the air is being let out of the bubble.

ZeroHedge reports, “Last Tuesday we reported that”China Credit Impulse Is Set To Collapse As Beijing Orders Banks To Curtail Loan Growth For Rest Of 2021“, and just a few days later we got the latest confirmation of this critical – for the global economy – transition.

Overnight, China reported that the sequential growth of total social financing (TSF) moderated in March following a strong rebound in January and February, with robust loan growth offset by a contraction in shadow lending.


As mentioned before, the NDX appears to be following the tech-heavy Shanghai Composite.  NDX futures are putting up a valiant struggle, but have not gone higher than 13833.00 in the overnight session.  I am sticking to my guns that the peak was made in mid-February and this secondary high is due for a collapse at any time.   The NDX may lead the domestic equities on their way down by following China’s lead globally.

ZeroHedge observes, “On one hand, the coming earnings season (77% of the S&P 500 market cap will announce results between April 19 and May 7) will be one of the strongest on record at least when measured on a Y/Y basis for the simple reason that Q1 2020 was the first quarter of the covid pandemic. On the other hand, as Deutsche Bank’s Binky Chadha writes, the sellside now expects impressive beats having lifted the bar high enough to where just mere “strong” EPS reports may not be sufficient (incidentally, consensus currently forecasts aggregate sales growth of 5%, margin expansion of 66 bps to 9.9%, and EPS growth of 19%. However, median EPS growth will be only 10%).  Finally, as Goldman notes, no matter how strong earnings are, they will not matter and instead all investors will care about is future guidance which however may be quite disappointing due to the recent surge in input costs which could lead to a big hit to projected profit margins.”


VIX futures appear to be consolidating within yesterday’s trading range.  Options expiration for the VIX is tomorrow and it may perhaps continue range-bound until options expire.


TNX hit an overnight high at 17.03 before pulling back.  With only a week left in the Master Cycle, it appears that the path of least resistance is down to the 50-day Moving Average.  Nervous investors in stocks may still think of treasuries as the primary “safe haven,” pushing down yields as they exit stocks.

ZeroHedge observes, “The Fed tipped its hand today, and unveiled its “viral reaction function” revealing the timetable according to which the Fed will start talking about QE tapering.

As discussed previously, James Bullard, president of the St. Louis Federal Reserve, said in an interview with Bloomberg Television that getting 75% of Americans vaccinated would be a signal that the pandemic was ending, which is a necessary condition for the central bank to consider tapering its bond-buying program. According to our calculations, extrapolating current vaccination rates would mean that – all else equal – we could see the Fed’s 75% bogey be hit in just two short months.”


USD futures appear to be testing Intermediate-term support at 91.89.  Should the support hold, USD may end its Master Cycle at the Cycle Top at 95.02.  There are two weeks left in this session and a liquidation in the equities markets may find solace in the cash dollar.


Gold futures bounced this morning, but did not break out of yesterday’s trading range.  It appears that the April 8 high at 1759.40 was the end of the Master Cycle (day 248), unless something dramatic happens in the next week or two.  If my observation is correct, the next Master Cycle low is due in early June.  The whipsaws of the past nine months may give way to an utter collapse in that period, ,due to the multiple bearish formations.


Posted in Published | Comments Off on April 13, 2021

April 9, 2021

4:30 pm

The panic bid in the last half hour set back the bearish view…at least until after options expiation.  The reason why is that Wave iii cannot be the smallest Wave.  By default, we may have just ended Wave iii at 275 points.  Wave i was 260 points.  What comes next is a pullback that may go as low as 4000.00 early next week…then a final blast into options expiration.  My guess is that this rally may end near 4250.00.

ZeroHedge remarks, “Including last Friday’s shortened day (during which futures were open around the payrolls print), Nasdaq has soared and Small Caps disappointed (especially notable given the spike in Small Caps on the jobs print). We must say we enjoyed the farcical ramp in the last few minutes of the day that sent ..


11:42 am

VIX made its Master Cycle low on day 241 of its current Master Cycle by making a low of 16.20, nearly matching the low made on February 21, 2020 at 16.19.  This extreme low is likely to be matched by an extreme high in May, according to the Cycles Model.

ZeroHedge remarks, “On the heels of yesterday’s warning that the VIX term structure was signaling potential trouble ahead, Bloomberg reports one trader place a huge bet yesterday that today’s calm will give way to a storm soon.

Source: Bloomberg

As we detailed yesterday, while spot VIX languishes complacently at pre-pandemic lows, Bloomberg notes, the middle part of the VIX curve that shows expectations for late summer and early fall tells a different story.

The spread between the VIX Index and implied 30-day volatility four months from now stands near the highest level since 2012.”


11:34 am

SPX is creeping up its Cycle Top support at 4094.84 this morning.  A dip beneath it may signal the tank is bone dry.  Things may be downhill from there.  The Daily Cycle Top support is very near the 2-hour.  An aggressive short position may be warranted beneath that level.


7:30 am

Good Morning!

SPX futures peaked at 8:45 pm (20.45 hours) at 4102.38.  This may have met the 5th Wave requirement for completion of this rally.  However, a secondary (lower) high in the futures may provoke yet another probe higher in the cash index.  The maximum level for Wave (v) is 4114.00, assuming the Wave structure is correct.  Today is day 282 in the value indexes, while the China/NDX indices are at day 266.  China (Shanghai Composite) may have already peaked on Wednesday.


NDX futures peaked at 13839 at 8:45 pm.  It has since gone negative, bolstering the idea that the peak may have been made yesterday.  We’ll know more at the open.

ZeroHedge remarks, “ech was hated only two weeks ago and everybody saw further downside. Fast forward 2-3 weeks, and the same guys are now telling us how great tech is.

Regular readers of TME know our latest logic on FAANGMs, which has basically driven the latest tech melt up (see here and here).

The long big tech logic played out well, but we are reaching the first big NASDAQ resistance levels here. This is not the time to get greedy, so it is time booking profits and possibly roll some call spreads higher in case NASDAQ has more short term legs. For the long stock people, we would look at replacement strategies here, basically switching from long stock to upside calls in case you think there is more upside in tech from here, but you make sure to monetize the recent melt up.”


VIX futures declined to 16.92 last night and appears to be hovering there this morning.  This may be giving us mixed signals as to the directionality of the markets this morning.

I’ll be absent for an hour or so, but may return near the open.


Posted in Published | Comments Off on April 9, 2021

April 8, 2021

3:30 pm

Will 4098.19 be the top?  The last half hour of the market day may bring in the sellers.  The two hour Cycle top acts like an Ending Diagonal trendline and is at 4085.58.  Aggressive shorts may be considered should SPX decline beneath that level.


1:15 pm

It appears that SPX may be going to 4000.00 after all.  Wave v of (v) of [v] of 5 is subdividing even more than I had anticipated.  It has one more lurch higher, then the decline begins.  Virtually no one is anticipating a turn this soon and the degree to which it may collapse.  I’ll be out for a while, but may come back before the close.

Best wishes!


11:04 am

The Daily Cycle Top resistance is at 4095.00.  It may be the final stop for this rally. while 4100.00 is looking less probable.  The car is running on empty, so it is hard to tell if the final bit of fumes takes it higher or not.


7:30 am

SPX futures reached a new all-time high of 4092.62 before easing down.  Should SPX rise to the trendline, it may reach 4100.00 or higher in the last Wave to completion.  Today is day 268 in the NDX/China Master Cycle, still in the normal range, while the SPX Master Cycle is in day 282.

ZeroHedge reports, “European stocks hit a new record highs on Thursday, buoyed by optimism in Britain over easing lockdown restrictions, while the benign outlook on US interest rates revealed in the latest FOMC Minutes where the Fed indicated it will maintain its commitment to supportive policy, helped push S&P futures to new all time highs after the cash index closed at a record on Wednesday. Treasury yields dropped, the dollar slipped and crude oil fell as the pandemic worsened in key regions just as OPEC+ prepares to add supply over the coming months.

At 7:30 a.m. EDT, Dow E-minis were flat, S&P 500 stock futures up 13.75 points or 0.34% and Nasdaq 100 E-minis were up 122 points, or 0.89%. The S&P 500 and the Dow ended a choppy session near record highs on Wednesday, while the tech-heavy Nasdaq is still more than 3% below its February all-time high.”


The Shanghai Composite Index has pulled away from its Intermediate-term support at 3482.66 and is currently retesting that support.  It may be on an aggressive sell signal, provided it closes beneath that support/resistance line.


NDX futures rose to 13743.12 in a final probe to its Wave (2) high.  The Wave structure does not support a new all-time high as long as the china impulse is over.  The NDS may follow the turn in China by a day or two.  Liquidity is being drained as another highly levered hedge fund blows up.

ZeroHedge observes, “In the aftermath of the Archegos blow up, the biggest nightmare on Wall Street – where there is never just one cockroach – is that (many) more Archegos-style, highly levered “family office” blow ups are waiting just around the corner.

Well, in a transaction after the close that is sure to spark much heated controversy tonight and tomorrow morning, Bloomberg announced that JPMorgan was offering a 9 million block of Academy Sports and Outdoors (ASO) stock. Since this is virtually identical to what happened two Fridays ago when similar public BWICs by Goldman and other banks proceeded to unwind the Archegos portfolio, the immediate question on everyone’s lips is whether a second highly levered family office has blown up.

There are more similarities: the block offered by JPM is massive: the 9MM shares represents almost a quarter of ASO’s float and roughly 10% of ASO’s total outstanding shares.”


VIX futures declined to a low of 16.91, testing but not exceeding yesterday’s low at 16.87 thus far.  VIX is also responding to  the China/Tech impulse.  A rally above the trendline at 18.50 will put us on high alert for an aggressive buy signal.  Above the 50-day at 22.72 puts the VIX on a confirmed buy signal and a probable sell signal for the SPX/NDX.


TNX appears to have bounced off the Cycle Top support at 16.52 yesterday and may be on its way to its target near 19.71.

ZeroHedge comments, “On the rates front, the market tightened significantly after the FOMC statement but has recently eased back as hopes for Biden’s stimulus malarkey faded a bit…

Source: Bloomberg

With all eyes on the latest FOMC Minutes for any signs of The Fed walking back any of its unprecedentedly easy policies, we note that Federal Reserve Bank of Dallas President Robert Kaplan warned today that “I do worry about excesses and imbalances,” adding that “failing to communicate Fed exit could stoke risk-taking,” adding that The Fed “should withdraw some accommodation once the pandemic is over.”


While USD futures are lower than yesterday’s close, there is evidence of a possible reversal off the mid-Cycle support at 92.24.  The current Master Cycle appears to be targeting its cycle Top at 95.26 by the close of options expiration.


The S&P Ag Index is on an aggressive buy signal while testing   mid-Cycle resistance at 388.06.  Once above it, and especially above the 50-day at 390.79 the signal becomes confirmed.  This is a very shallow Wave [2] with only a 23.8% retracement, testifying to the strength of this trend.  The next target appears to be over 600.00.  With China suffering a major food crisis and a drought of major proportions in the Southwest, food prices may skyrocket.  My family just pooled together to buy a half of a beef.

ZeroHedge reveals, “Scientists have begun using the term “megadrought” to describe the multi-year drought that has been plaguing the western half of the country, and now we are being told that it looks like 2021 will be the worst year of this “megadrought” so far by a wide margin.  That is extremely troubling news, because major water reservoirs have already dropped to dangerously low levels, some farmers have been told that they will not be allowed to use any water at all this year, and the dust storms in the western U.S. are becoming so large that they can actually be seen from space.  This is a major national crisis, and it is only going to get worse.

As you can see from the latest U.S. Drought Monitor map, nearly the entire western half of the nation is experiencing some level of drought at this moment.

But even more alarming is the fact that much of that territory is currently in one of the three most serious levels of drought…

A year ago, about 4% of the West was in a severe drought. Now, about 58% of the West is classified as being in a severe, extreme or exceptional drought.”


ArmstrongEconomics reports, “People are unaware of the agenda with food and why Bill Gates has become the largest holder of farmland in the United States. There is a whole new agenda unfolding, and, of course, mainstream media has been bought off. Farmers in France and Croatia are standing up to EU policies. Farmers in France have even brought in tractors to combat the police. The goal appears to be to end traditional farming and ranching as we have known it. Europe is 100% under the control of the World Economic Forum and now has a new seed law that CRIMINALIZES traditional seed saving. They are using drones and satellites now to monitor all fishing in real-time.

Croatians are deeply concerned about the EU Ag Census, which takes total inventory of all food production — farms, animals, bees, anything — because it was only 1945 when Yugoslavia LAST conducted such a census prior to seizing control of all farms, transforming it into a state-run collectivized industry. The government then ordered all farmers off their land. The patterns are the same, which is reminiscent of the communist total takeover.”


Posted in Published | 1 Comment

April 7, 2021

7:15 am

The Shanghai Composite appears to completed its Master Cycle on day 267.  The new Cycle has all the earmarks of a panic Cycle.  This is made even more probable should liquidity be curtailed.

ZeroHedge remarks, “One month after global markets underwent a brief hiccup after China’s top banking regulator said he’s “very worried” about risks emerging from bubbles in global financial markets, Beijing is now looking inward and as the FT and Bloomberg reported, China’s central bank has asked the nation’s major lenders – which are all at least partially state-owned which means it wasn’t ‘asked’ but rather ‘ordered’ – to “curtail loan growth for the rest of this year after a surge in the first two months stoked bubble risks.”

The report goes on to note that at a meeting with the People’s Bank of China on March 22, banks were told to keep new advances in 2021 at roughly the same level as last year. The directive targeted not only domestic lenders but also “some foreign banks” which were also urged to rein in additional lending through so-called window guidance after ramping up their balance sheets in 2020.”


NDX futures are also easing away from a lesser high, very similar to the Shanghai Index.  It appears that the Tech-heavy Shanghai and the NDX are tracking very closely and are influencing the US equities market.  The absence of liquidity in the Chinese market may have a knock-on effect in the US markets, regardless of the FOMC decisions.

ZeroHedge observes, “In its chart of the day, DB credit strategist Stuart Sparks writes that history teaches us that although investments in productive capacity can in principle raise potential growth and r* in such a way that the debt incurred to finance fiscal stimulus is paid down over time (r-g<0), it turns out that there is little evidence that it has ever been achieved in the past.

The chart below illustrates that a rising federal debt as a percentage of GDP has historically been associated with declines in estimates of r* – the need to save to service debt depresses potential growth.

As Sparks concludes, and this will probably get him kicked out of his favorite neighborhood club for confused Keynesians, “the broad point is that aggressive spending is necessary, but not sufficient. Spending must be designed to raise productive capacity, potential growth, and r*. Absent true investment, public spending can lower r*, passively tightening for a fixed monetary stance.”


SPX futures are flat, ostensibly awaiting the FOMC announcement.  However, as noted above, decisions being made elsewhere may have as much or more influence.  Note that the overnight volume on the US exchanges plummeted for the first time this year prior to the FOMC decisions being announced.

ZeroHedge reports, “Global stocks were stuck in a holding pattern on Wednesday at record high levels, with US equity futures unchanged from Tuesday’s close, as investors awaited details of the latest FOMC minutes. The 10-year Treasury yield reversed an earlier loss, while the dollar paused after a four-day slide.

While COVID case numbers rose in several parts of the world and geopolitical tensions between China and Taiwan and between Russia and Ukraine ensured it was by no means a fairytale, markets had a Goldilocks feel again with MSCI’s 50-country world index grinding out a sixth day of gains. Futures on the S&P 500 and Nasdaq 100 fluctuated after the underlying gauges retreated overnight as volume on U.S. exchanges dwindled below 10 billion shares for the first time this year.”


VIX futures briefly plummeted to 16.87, finally filling the open gap at 17.08 left in the VIX a year ago.  It quickly bounced bac above 18.00.  This explains the subdued action of the VIX for the past few days.  It also implies either a new Cycle beginning at the July 10, 2020 high, or an early termination of the Cycle beginning on August 11 (see the chart).


TNX bounced to 16.74 tis morning after testing the Cycle Top support at 16.41. This appears to launch the final probe toward its target at 19.71 which may be due in two weeks.

ZeroHedge remarks, “he late Everett Dirksen, a long-serving Minority Leader of the Republicans in the U.S. Senate, is famously quoted as saying a billion here, a billion there, and soon we’re talking real money. That was back in 1969. At the time, a billion dollars was about one-tenth of 1 percent of GDP.

What about today? 

During 2020, the federal government provided a total of $3.2 trillion of Covid relief, starting with a mere $8.3 billion, then adding $104 billion, then adding $2.2 trillion, and finishing off the year with another $900 billion.

We’re now three months into 2021, and the federal government has provided yet another $1.9 trillion in Covid relief; and, the Biden administration has just asked for $2 trillion for infrastructure.

To put these amounts into perspective: A trillion dollars is today about 4 percent of GDP.”


USD futures made a new low at 92.20 in the overnight session before moving back to the flat line.  There is about a week left in the Current Master Cycle and the liklihood of a final probe to the Cycle Top at 95.34 is high.


Posted in Published | Comments Off on April 7, 2021

April 6, 2021

8:20 am

Good Morning!

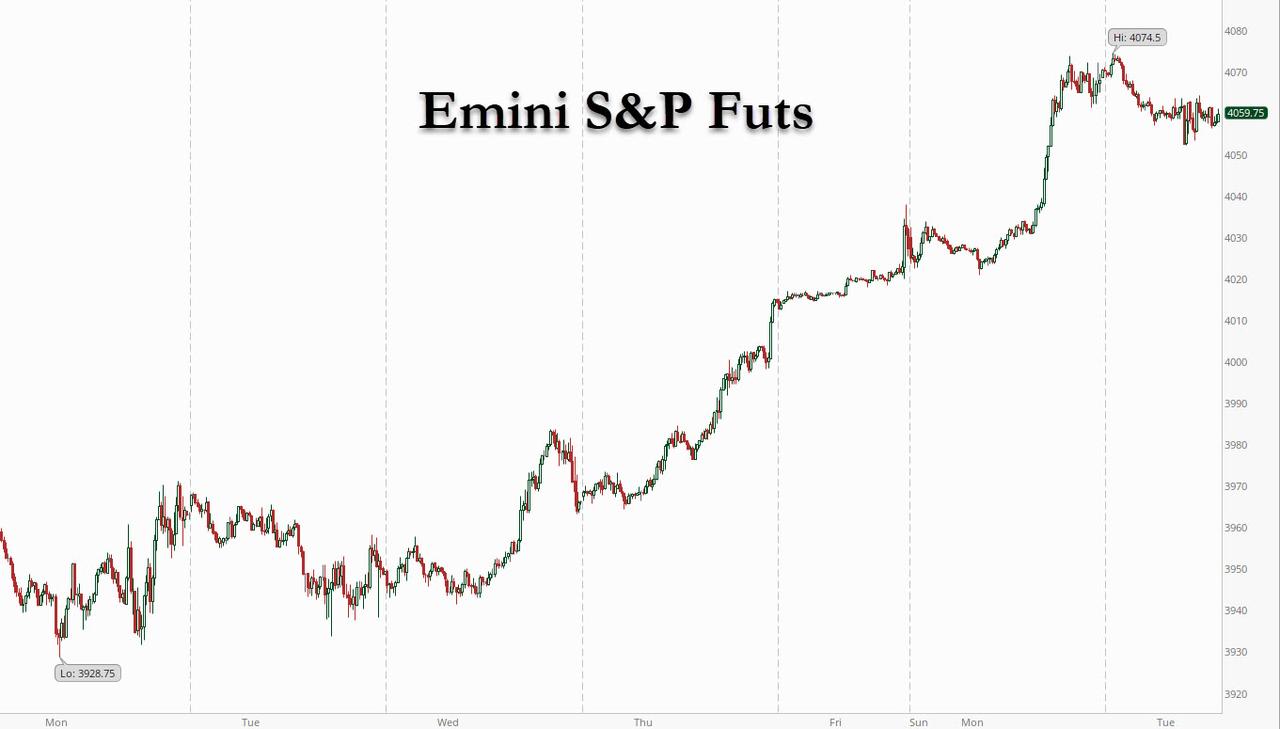
SPX futures have dipped to 4052.62 this morning, not enough to call a reversal, but showing some exhaustion.  By coincidence, the Cycle Top support at 4034.50 is precisely at the Fibonacci target for this secular rally.  The first indication of a reversal les beneath that level while the trading channel trendline lies at 4000.00.  Should yesterday’s high be the top, the Cycles Model suggests a 17-day decline may ensue.  This high may also mark the end of a 252-month Cycle starting on March 23, 2000.

ZeroHedge reports, “Global stocks hit record highs on Tuesday, supported by strong economic data from China and the United States, although US equity futures slipped as concern China is curtailing loan growth tempered optimism stoked by the U.S. economic rebound.  Nasdaq underperformed as investors locked in some gains on renewed reflation concerns hopes while currency and bond markets paused for breath after a month of rapid gains in the dollar and Treasury yields. At 715 a.m. ET, Dow E-minis were down 41 points, or 0.11%, S&P 500 E-minis were down 8 points, or 0.20% and Nasdaq 100 E-minis were down 11.5 points, or 0.23%.”


VIX futures dipped to a low of 17.37 this morning.  It may be an effort to boost stocks in a tail-wags-the-dog back door effort to launch a momentum rally.  VIX may have already made its Master Cycle low last Thursday, but recognition of the Master Cycle bottom is  still dim.


NDX futures dipped to 13525.50 tis morning as it, too is nearing exhaustion.  There may be an attempt to reach the Cycle Top resistance at 13707.03.  Wave (C) equals Wave (A) at 13678.00.


TNX slid lower this morning but the weakness may be over as TNX rallies for the next 12 market days.  This may be the last straw for equities, as the potential target appears to be 19.71.

ZeroHedge observes, “One look at the S&P500, which closed today at a fresh all time high well above 4,000, suggests that after a period of rangebound trading and some modest quarter-end market jitters, traders once again don’t have a worry on their mind with even mega cap tech stocks ramping in recent days as concerns about reflation and higher rates are seemingly fading away.

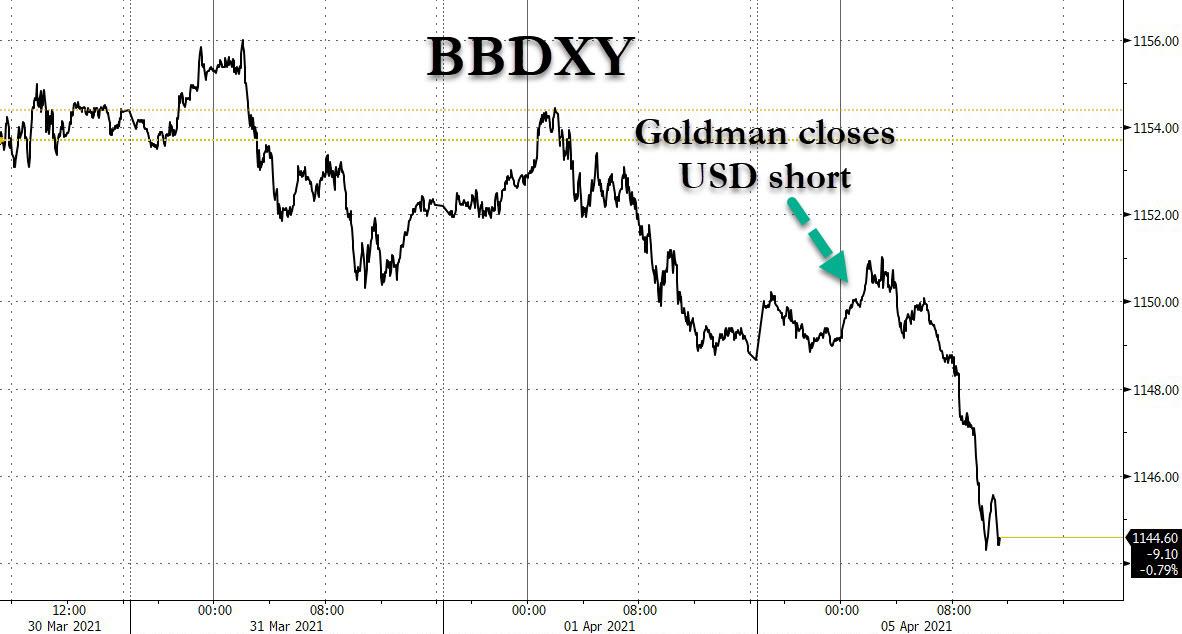
Commenting on the market’s endurance and willingness to push higher even amid higher yields, Bloomberg’s Ye Xie notes that after a record services PMI, and nearly 1 million jobs added, “treasuries barely changed much over the past two days.” As he notes, “that perhaps suggests a lot of bad news for bonds is in the price. After all, the markets have now priced in four rate hikes through the end of 2023, when the Fed indicated it plans to keep rates unchanged throughout.” And with yields stalling, the dollar’s rally seems to also be losing some momentum (ironically, just as Goldman covered its dollar short), and as the DXY index is sitting right at the 200-day moving average. As for equities, Xie notes, “yield stability allows for some breathing room as stock benchmarks hit new records.”

He is right… the only question is how much longer with this yield stability persist. Because if Deutsche Bank rates strategist Steven Zang is correct, the next move higher in yields is on its way.”


USD futures hit a new low at 92.52 in the overnight session.  However, the pullback may be complete.  USD futures have a date with options expiration day, as that may be the end of the current Master Cycle.  The Cycle Top resistance at 95.43 appears to be the likely target, although it may go to the Broadening Wedge trendline.

ZeroHedge comments, “It may not be quite a “Thomas Stolper reco“, but the dollar reaction to Goldman’s announcement on Friday to close its long-running dollar short is certainly one that brings back a few memories of the infamous Kermit photo.

In a Friday note from Goldman’s Zach Pandl titled aptly “Tactical Retreat“, the bank’s chief FX strategist said that “after a choppy few months we are closing our recommended USD short trade, expressed vs a basket of G10 commodity currencies (AUD, CAD, NOK, & NZD).” While we doubt Goldman’s trade reco was the catalyst, the Bloomberg dollar index has tumbled in kneejerk response, sliding to a two week low as US stocks soared on Monday, one day after the blockbuster payrolls report.”


West Texas Intermediate Crude futures bounced back to retest its 50-day Moving Average at 59.58 after falling through that support yesterday.  There appears to be an early Master Cycle low on March 23 at 57.25.  If so, we may have seen a flat correction that may lead to a substantial decline over the next month.  The outcome may be clearer by Friday, as a brief spike testing the Cycle Top may be due.

ZeroHedge observes, “After its exuberant rip on the day that the latest OPEC+ deal was announced last week, crude prices have collapsed, with WTI plunging back below $60, as reality sets in on what that supply surge really means (combined with Iranian output rising) and demand fears (as European nations lockdown and China demand lags).

The OPEC+ decision to gradually raise output “was contrary to some expectations that the group would take a status quo approach over the near-term,” said Robbie Fraser, manager, global research & analytics at Schneider Electric.

It also “suggests that members are both confident about a continuing demand recovery, and potentially cautious as U.S. shale looks to bounce back from 2020 losses.”

But the rise in OPEC+ output combined with concerns over Chinese import demand may be factors in Monday’s weakness.”


Posted in Published | Comments Off on April 6, 2021

April 5, 2021

8:20 am

Good Morning!

SPX futures rose to an all-time high of 4033.88 this morning, just ticks shy of the long-term target of 4034.00 (see the Friday report).  Today is day 280 of the Master Cycle and the fruit is rotting on the tree.

ZeroHedge reports, “S&P futures surged and most Asian stocks climbed (Europe remains closed for Easter holiday) as investors digested Friday’s unexpectedly strong jobs report which showed the strongest jobs growth in seven months and could mark the beginning of the best annual economic growth in nearly four decades. Bond yields rose modestly after Friday’s spike, while the dollar and gold were both unchanged.

At 730am, Dow E-minis were up 226 points, or 0.68%, S&P 500 E-minis were up 23 points, or 0.57% and Nasdaq 100 E-minis were up 59.75 points, or 0.45%.”


The Industrials made their (all-time) high at 33259.00 on March 19 thus far.  This morning the DJIA futures high was 33292.50, so it is possible that the all-time high may be this morning.  Wave [5] equals Wave [1] times Pi at 33255.82.  Perhaps this morning both time and target will be confirmed.

RealInvestmentAdvice comments, “n retail investing, do the “blind lead the blind?” Such was a question I asked recently about young investors who are “Long Confidence And Short Experience.” However, a recent survey by MagnifyMoney dug much deeper into the subject.

Our previous article’s gist is that throughout history, markets have a way of separating investors from their money. Such is the reason every great investor in history has one rule in common: “Don’t lose money.” The reason, of course, is that if you lose your capital, you are “out of the game.”

As I noted, the market’s current speculative behavior is not uncommon throughout history.

“Bubbles are characterized by extreme predictions, tend to dominate conversations and induce people to leave their jobs. The warnings of bubble skeptics get invariably met with scorn and derision.” – William Bernstein

Today, more individuals are searching “google” for how to “trade stocks” than at any point in history. (If data was available back to 1999, I am sure it would be similar.)”


VIX made its Master cycle low on April 1 at 17.29.  This morning VIX futures rose as high at 18.14 before pulling back.  In other words, VIX is not confirming the new highs in the SPX and DJIA.


TNX rose this morning, threatening a new breakout.  There is much debate regarding which level the TNX will affect the equities market.  The Cycles Model suggests that TNX may keep rising through options expiration.  The target appears to be 19.71, which may appear to be a threat to equities.


Posted in Published | Comments Off on April 5, 2021

April 2, 2021

9:55 am

The futures data feed was turned off at 9:14:48 am.  The cash market data feed has not been turned on due to Good Friday.  The 10-Year Treasury yield futures continues to rise to 17.23 at this time.

I would not be surprised to see the market open lower on Monday.

8:20 am

SPX futures reached an all-time high of 4037.62 (at 8:50 am) this morning as we wait for the March payroll report.

ZeroHedge reports, “While US cash markets are closed for Good Friday today, S&P futures continued their Thursday ramp higher, and after rising above 4,000 for the first time yesterday were last trading at 4,022, up 0.3%, ahead of the March payrolls data (preview here) expected to show the biggest increase in jobs in five months (and potentially much more). While cash bonds are open, most other markets were also closed for Good Friday.

As previewed yesterday, if it is a big outlier, the jobs report will likely roil the bond market as trading volumes will be extreme thin during today’s holiday-shortened session and all trades will be focused in rates as Treasuries will be the only asset open (until noon) while the New York Stock Exchange is closed today.”


VIX futures data feed has not been activated this morning.  The gap from   February 21, 2020 closes  completely at 17.08.  The daily Cycle Bottom is at 16.94.  The EW structure allows that both targets may be hit.  At the same time, the Master Cycle is stretched beyond the normal range of 241-258-275 days at 293 days!


TNX futures have risen to 16.98 after the jobs report.  The data feed to StockCharts apparently has not been turned on.

ZeroHedge reports, “It wasn’t quite the whisper number of 1 million jobs, but it was close: moments ago the BLS reported ago that in March the US added a total of 916K jobs, smashing expectations of 660K, nearly triple the original February print of 379K and was the strongest payrolls report since last August.

Developing”


Talk about being stretched!  SPX is in a throw-over position above the 1987 trendline and met the 2.618 Fibonacci Wave Relationship this morning.  Mission accomplished.


Here’s another Wave relationship that explains why the DJIA has not reached a new high this morning.  It already accomplished this feat on March 29.


Posted in Published | Comments Off on April 2, 2021

March 31, 2021

2:32 pm

SPX tested the upper trendline of its trading Channel shortly after 1:30 pm.  While it may retest it by the end of the day, the Cycles Model infers that this may be the top at 275 days.  Investors may be noticing the mere 1.1% gain in the last 45 days with rising volatility and lower liquidity.  There are likely to be some skeletons still hidden in the Archegos failure.  In addition, massive tax hikes are being proposed by the Biden administration that are taking some of the excitement out of investing.

Look for a cross beneath Short-term support at 3936.89 for an aggressive short signal.  Oddly enough, the DJIA did not make a new high today.


12:28 pm

TNX has pulled back since this morning.  However, it appears poised for a surge higher by the end of the week.

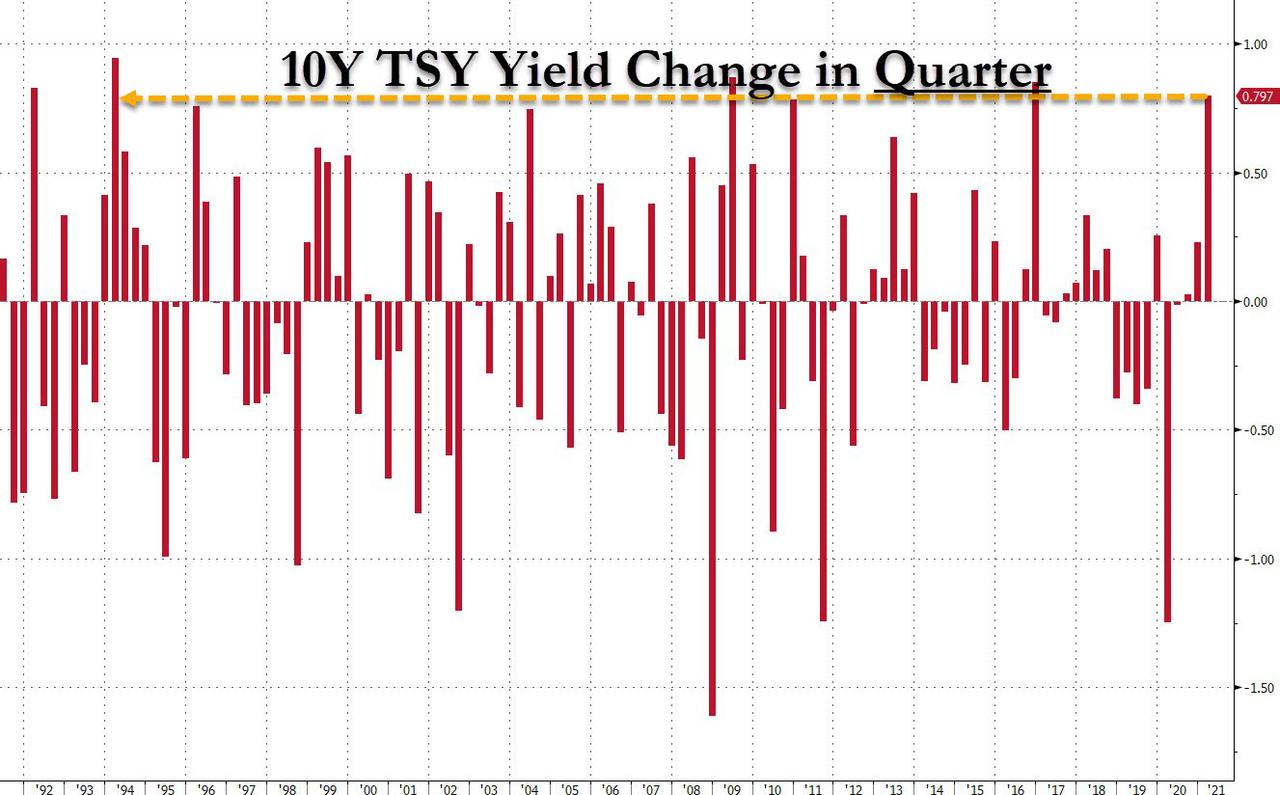
ZeroHedge remarks, “On the last day of Q1, the quarter seems to be ending very much how it began, with Treasury yields rising to fresh highs as investors await the announcement of further spending proposals in President Biden’s infrastructure package while buying stocks first (the S&P just hit a new all time high) and asking questions later.

Indeed, as DB’s Henry Allen writes, the rise in 10yr Treasury yields in Q1 so far had reached a massive +82.7bps (0.797bps at the time of writing), which puts them just shy of the 21st century’s other quarterly records back in Q4 2016 (+85bps) when President Trump won the presidential election, and Q2 2009 (+87bps) as the global economy was climbing out of the financial crisis. Of note: even the 2013 taper tantrum was a far more modest, and slow move compared to what we have seen now.

And while everyone is waiting for Biden to reveal further details from his infrastructure package on Wednesday, should today’s Biden speech spark a further climb in yields, that could then leave this as the biggest quarterly rise going all the way back to the Great Bond Massacre of Q1 1994, when yields blew out +94.4bps.”


10:05 am

NDX shot up to test its mid-Cycle resistance at 13081.33, while stomping the VIX down to 18.90.  This is the strongest surge of all the stock indices.  None have made new highs.  Note the bearish cross of the mid-Cycle with the 50-day Moving Average.  Big money is ramping the indices (especially the NDX) to:  1.  See if new highs may be made.  And 2.   Raise FOMO sentiment among the retail investors.

10:15 am  The Dow has gone negative…

12:15 pm  NDX is now at the 50-day Moving Average and appears to be overbought with Slow Stochastics at 99.7.  The DJIA remains at breakeven.

ZeroHedge proclaims, “Well that just happened… Buy Mortimer, buy!

The Dow, S&P, Russell 2000 all spiked dramatically at the US cash open (Nasdaq did not initially then decided to join the momo party because, well, someone must know something right?)

So much for the massive JPM-predicted forced month-end selling!?

No move in bonds or the dollar at all, but gold did pop a little…”


8:00 am

Good Morning!

SPX futures are flat this morning It appears that the effort to preserve the market gains until the end of the quarter may be successful.  However, the inability to make new highs tells us that there may be no more fuel in the tank.  today may be the last day for an all-out effort to make a new high.  However, should this Wave structure be correct, a decline, the magnitude of which hasn’t been seen before, may commence.  The first major low, according to the Cycles Model may be at options expiration, or shortly thereafter.

The DJIA also failed to make new highs, suggesting that the indices may now be in sync.

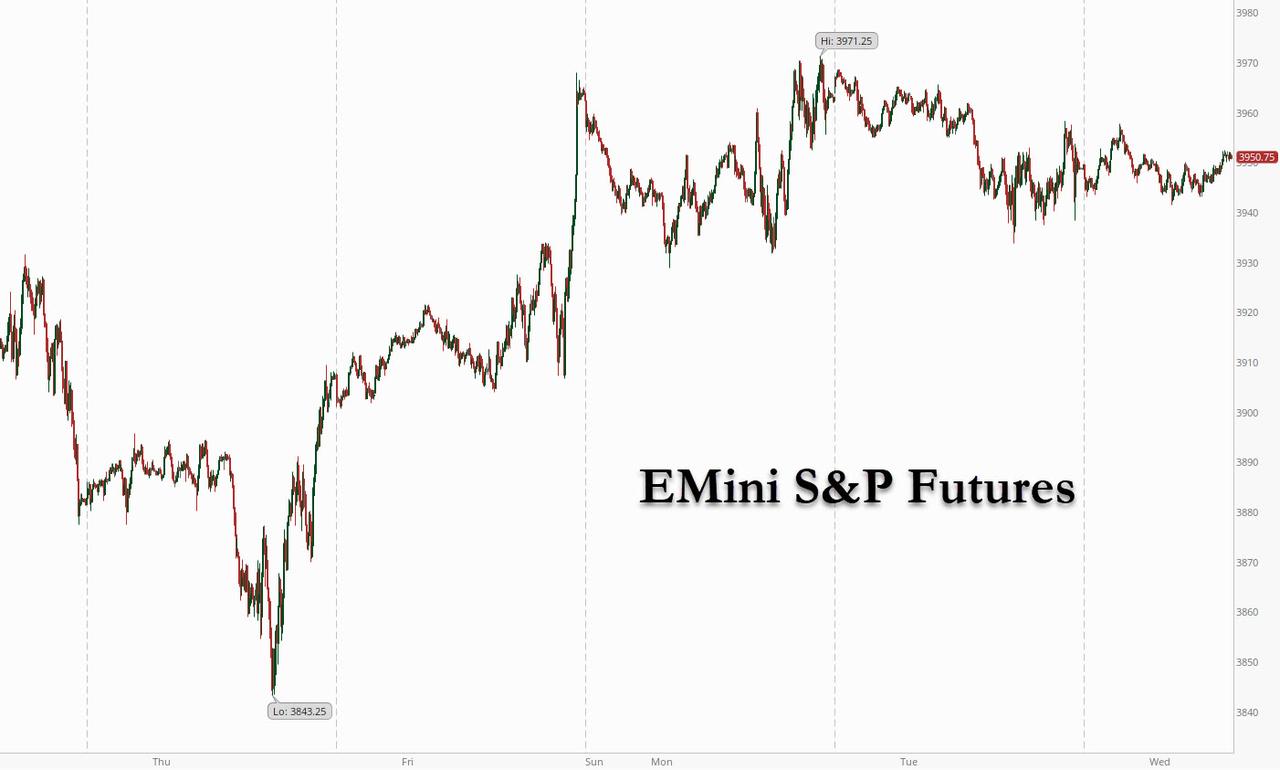
ZeroHedge observes, “US index futures were little changed and global stocks treaded water on Wednesday as Treasury yields resumed their upward march ahead of Joe Biden’s Pittsburgh event where he will announce a $2.25 trillion dollar plan – one which the administration says will be the most sweeping since investments in the 1960s space program and 1950s interstate-highway system – to rebuild America’s infrastructure, with traders weighing the inflation and tax impact of the stimulus.

At 07:30 a.m. ET, Dow E-minis were down 27 points, or 0.06%, and S&P 500 E-minis were up 3.5 points, or 0.09%.
Nasdaq 100 E-minis were up 75 points, or 0.56%, as Apple Inc rose 1.6% after UBS upgraded the stock to Buy on stable long-term demand for iPhones with better authorized service providers.”


NDX futures rose to a high of 12975.75, short of Monday’s retracement high at 13013.50.  The Cup with Handle formation is still operative and may be triggered with a decline beneath the Lip just beneath 12700.00.   There is some indication that the bloodletting may not be over.

ZeroHedge reported yesterday, “Unlike the devastating London Whale debacle in 2012, which was all JPMorgan eventually drawn and quartered quite theatrically before Congress (and was a clear explanation of how banks used Fed reserves to manipulate markets, something most market participants had no idea was possible), this time JPMorgan was nowhere to be found in the aftermath of the historic margin call that destroyed hedge fund Archegos. Which is may explain why JPMorgan bank analyst Kian Abouhossein admits he is quite “puzzled” by the recent fallout from the Archegos implosion (or maybe JPM simply was not a Prime Broker of the notorious Tiger cub), which however does not prevent him from trying to calculate the capital at risk from the Archegos collapse.

In a note published this morning, Kian writes after Nomura yesterday confirmed (at least) a $2Nn potential claim and fellow Japanese bank Mitsubishi UFJ Securities Holdings announcing today of another potential $300MM loss – which as the JPM strategist admits “for a likely non-material PB player is surprising to us” – JPMorgan now expects losses well beyond normal unwinding scenario for the industry: and explains that it now sees “the losses as very material in relation to lending exposure for a business that is mark-to-market and holds liquid collateral” and makes Nomura’s indication of potentially losing $2bn and press speculation of CSG $3-4bn losses “as not an unlikely outcome” according to the JPM strategist.

So why is JPM surprised?

Because as Abouhossein writes, “in normal circumstances… we would have suspected industry losses of $2.5-5bn. We now suspect losses in the range of $5-10bn.” In other words, JPM has doubled its max loss estimate to as much as $10BN, a number which could yet rise.”


VIX futures took another dip to an overnight low of 19.12.   This may be due to the effort by the powers-that-be to maintain the SPX at or near its quarterly high.  The new Master Cycle may be due to end at the end of April at a high.


TNX appears to be pulling back from its new high.   However, it may be brief, due to the oncoming Master cycle high in the latter part of April.  The target appears to be the November 2019 high at 19.71.  The Treasury Department announced that it will ramp up offerings/auctions in April to $170 billion.


USD futures pulled back after their breakout above the 200-day Moving Average.  The pause in the rally may be brief, as USD is due for a Cycle high at the end of April.

Investing reports, “Stronger than expected economic reports drove the U.S. dollar higher against all of the major currencies. There’s no question that of the G3 currencies (USD, EUR and JPY), the U.S. is leading the recovery, and data is beginning to show the benefits of a smooth coronavirus vaccine rollout. Seventy percent of Americans 65 or older have received at least one COVID-19 vaccine dose, with more than a third of the overall adult population receiving their first jab. Businesses are reopening and economic activity is accelerating. As a result, jobless claims fell to 684,000, its lowest level in more than a year. Fourth quarter GDP growth was also revised up to 4.3% from 4.1%. The U.S. economy is still a long way from normal, but the numbers show that it is moving in the right direction. With more Americans getting vaccinated every day, further improvements are likely. Personal income and spending numbers are due for release tomorrow.”


Gold futures bounced off the Broadening Wedge trendline this morning.  The bounce may go as high as the Cycle Bottom resistance at 1707.93 and last until Friday, a day of strength.  However, it is due to resume its decline through April options expiration.  There appears to be two bearish formations that indicate a very deep decline which may proceed from this juncture.

Investing comments, “Gold spot we wrote: outlook negative and holding first resistance at 1715/17 re-targets 1707/05 then 1700/1698. A good chance of further losses eventually to very important strong support at 1685/75.

What a call! gold collapsed straight to very important strong support at 1685/75 and bottomed exactly here.

This was perfect! The break below hit 1705 and even the bounce topped exactly at 1715/17. Outlook now negative.”

 

Posted in Published | Comments Off on March 31, 2021

March 30, 2021

7:40 am Tuesday of Holy Week

Good Morning!

DJIA futures are lower this morning after making a new all-time high at 33259.00.  This morning the INDU futures slid back beneath 33000.00.  Today is day 274 of the current Master Cycle, a very stretched Cycle.  However, it may stretch another day to preserved the gains made in the past quarter.  Usually, 275 days (258 + 17.2 days) is the upper limit of the normal range of the Master Cycle.  There appears to be a final probe left before the reversal.


NDX futures slid to a morning low of 12839.62.  It is hovering above the Lip of the Cup with Handle formation at 12700.00.  A decline beneath that formation denotes the final breakdown that ushers in the bear market.  This is the opposite of the DJIA, as money rotates out of the NDX and into the DJIA.  Confidence is being lost as the NDX is very close to having a negative quarter for the first time since a year ago.

ZeroHedge remarks, ”

See the source image

When analyzing the markets, it is important to differentiate between one’s longer-term and shorter-term outlook. Our longer-term outlook, spelled out in detail in our newest  issue, is focused primarily on the government’s record-breaking efforts to stimulate the economy, flooding the financial system with easy money and credit.

While this may be enough to stave off a major crash for some time, it may not be enough to sustain the market’s vastly overextended bull run of the past several months. Increasingly, in the short-term, we see important signs of exhaustion that could lead to a painful correction.”
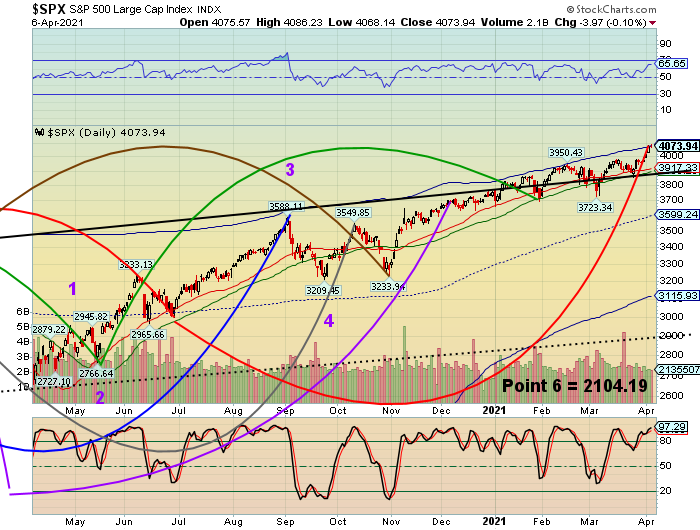
 

SPX is caught in between, with the SPX futures hanging on, but showing signs of exhaustion.  Another probe higher and it may have made yet another all-time high and completed its Elliott Wave pattern.  The question is, can it last another day and make that new high?  Critical support lies at the mid-Cycle/Intermediate-term support at 3902.96.  A double trendline and gamma neutrality lies at 3850.  Beneath that the trap door opens.

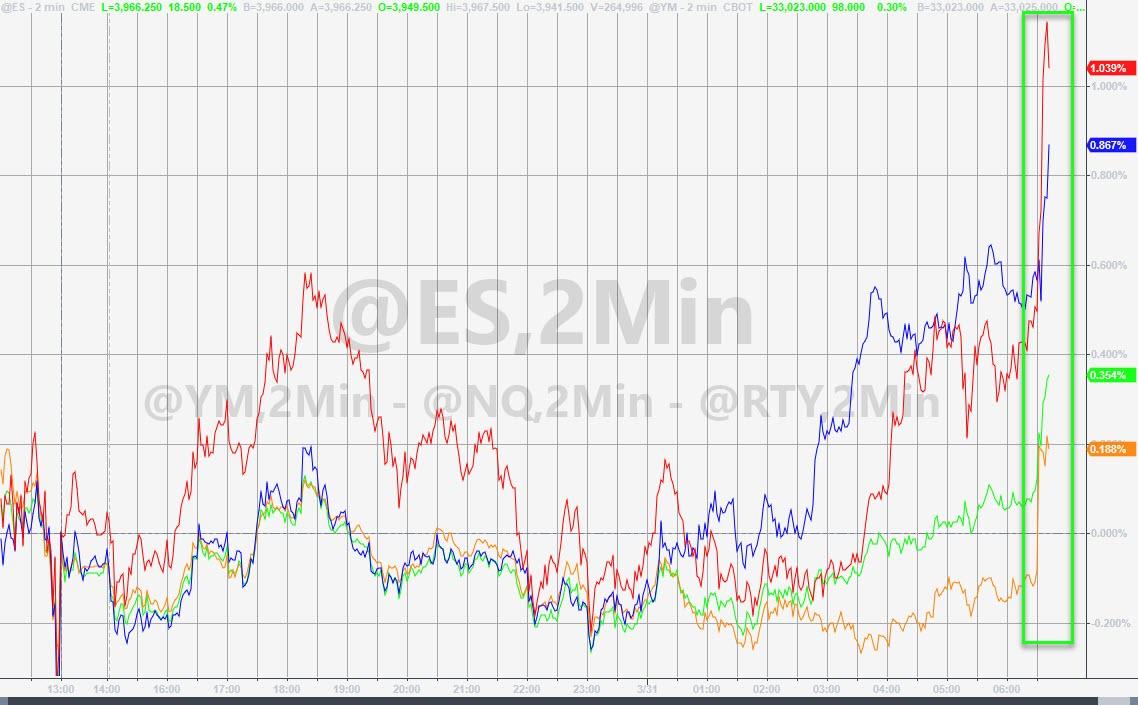
ZeroHedge reports, “US index future slumped on Tuesday as traders continued to fret over fallout from the implosion of Archegos (especially after Morgan Stanley said it was not done selling residual blocks) and as Treasury yields soared to the highest since Jan 2020.

Emini S&P futures were down 13 points or -0.3% to 3,946, with ViacomCBS shares rising 2.6% premarket; Discovery Inc. and the American Depositary Receipts of Chinese companies linked to the Archegos block trades also posted gains. Tesla fell after a report Xiaomi Corp. plans to invest $15 billion to make electric cars. Industrial stocks and banks such as JPMorgan, Morgan Stanley and Boeing added between 0.9% and 1.4%. American Airlines rose 1.2% after an upgrade from Jefferies. The carrier expects to put most of its fleet back in service in the second quarter on signs of a travel rebound.”
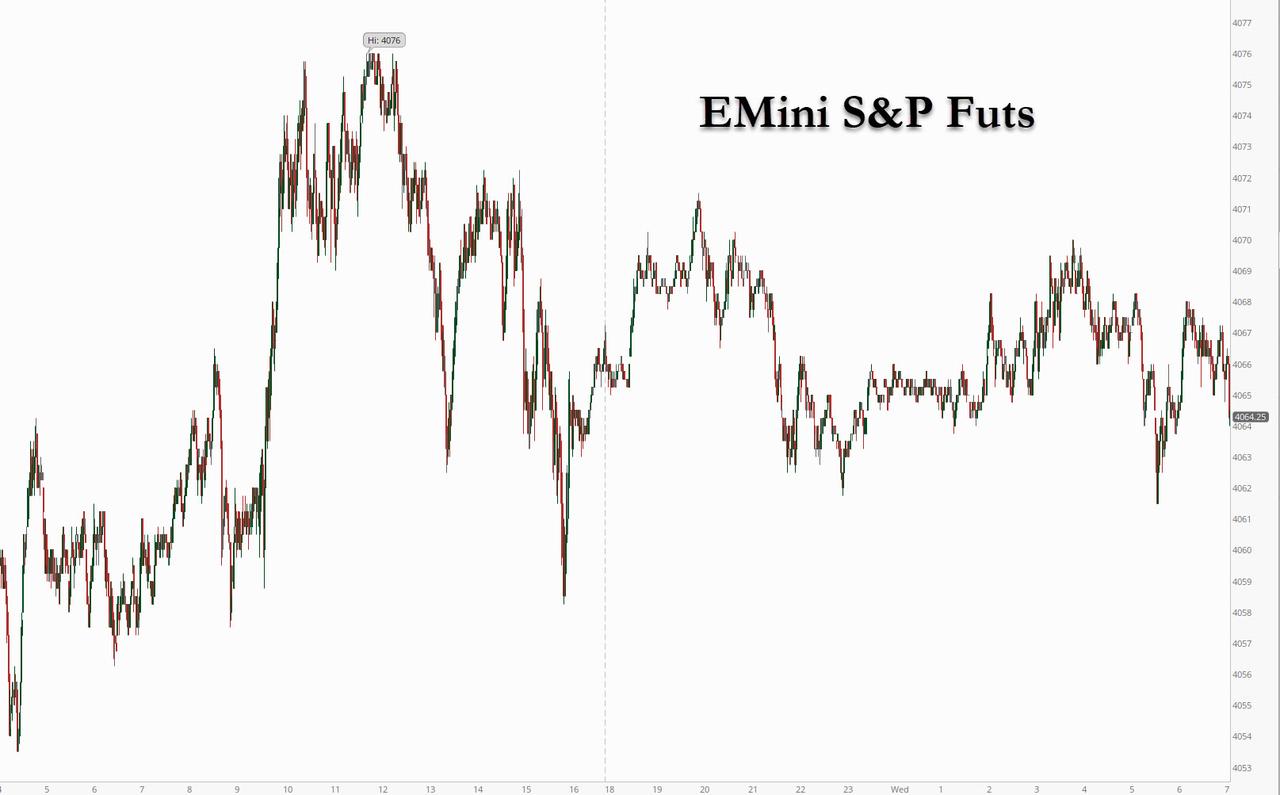
 

VIX futures are consolidating at the high end of yesterday’s trading range.

YahooFinance brings us, “(Bloomberg) — The Cboe Volatility Index may have just wiped out the pandemic-induced doom and gloom, but Munich money managers Daniel Danon and Tobias Knecht are fretting over the warning signs still flashing across the stock market’s underbelly.

The recent decline in the Wall Street fear gauge to pre-virus levels belies the “tension beneath the calm” within the volatility landscape, according to the traders at Assenagon GmbH with 27 billion euros ($32 billion) under management.

“The price for protection against sharp downside moves, sharp correlated moves or for just outright volatility exposure is high,” Danon and Knecht, who specialize in such derivatives strategies, wrote in an email.”


TNX has broken out while TNX futures have made an overnight high at 17.76.  The Cycles Model implies that there may be another three weeks of rally, ending at April options expiration.  TNX may have completed a” running correction” Wave 4.  While TNX may still pull back to its Cycle Top or one of the lower supports, the target for this move may very well be near 20.00.  The next chart resistance level is the November 4. 2019 high at 19.71.

ZeroHedge reports, “Gold and bonds are getting dumped amid the ongoing fallout from the Archegos debacle, and the dollar is bid, as it appears a broad-based demand for liquidity is trumping any quarter-end rebalancing flows that may have been expected. At the same time, bitcoin has been stable and acted as a source of stability.

Rather unexpectedly, Treasuries are being sold into quarter-end, with 10Y yields back above 1.75%…

Source: Bloomberg

Gold futures are back below $1700 as the sell first, think second plan for liquidity appears to be in play..”


Gold futures made a morning low of 1678.80 as it also has three weeks to its Master Cycle low, which may be devastating for the gold bugs.  The reason is that it is now testing the combination Broadening Wedge and Head & Shoulders formations.  These two formations foretell the probable depth of Wave (3) of [3].

There are two possible “ultimate bottoms” to this decline.  The first is the 61.8% Fibonacci retracement of the entire rally from August 1999 to August 2020 at 954.55.  The second is the Cycle Wave IV low at 681.00.


Posted in Published | Comments Off on March 30, 2021