March 9, 2021

11:54 am

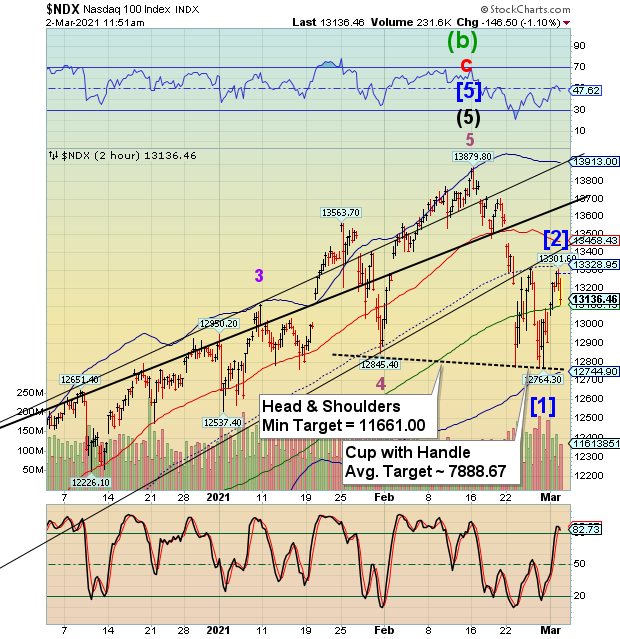
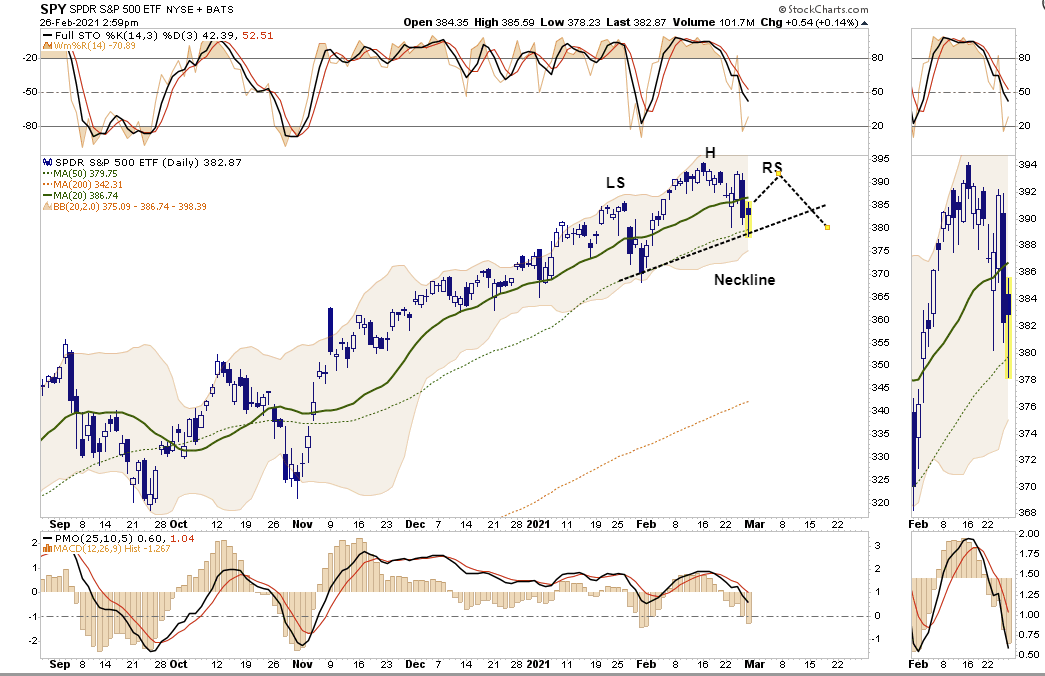
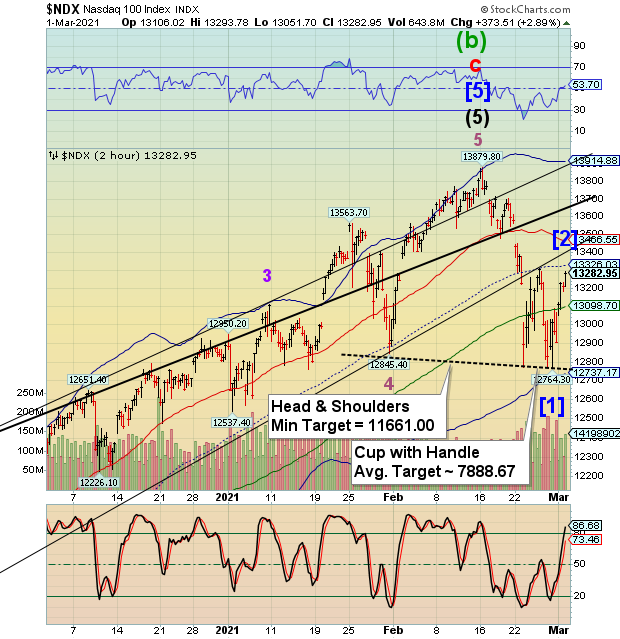
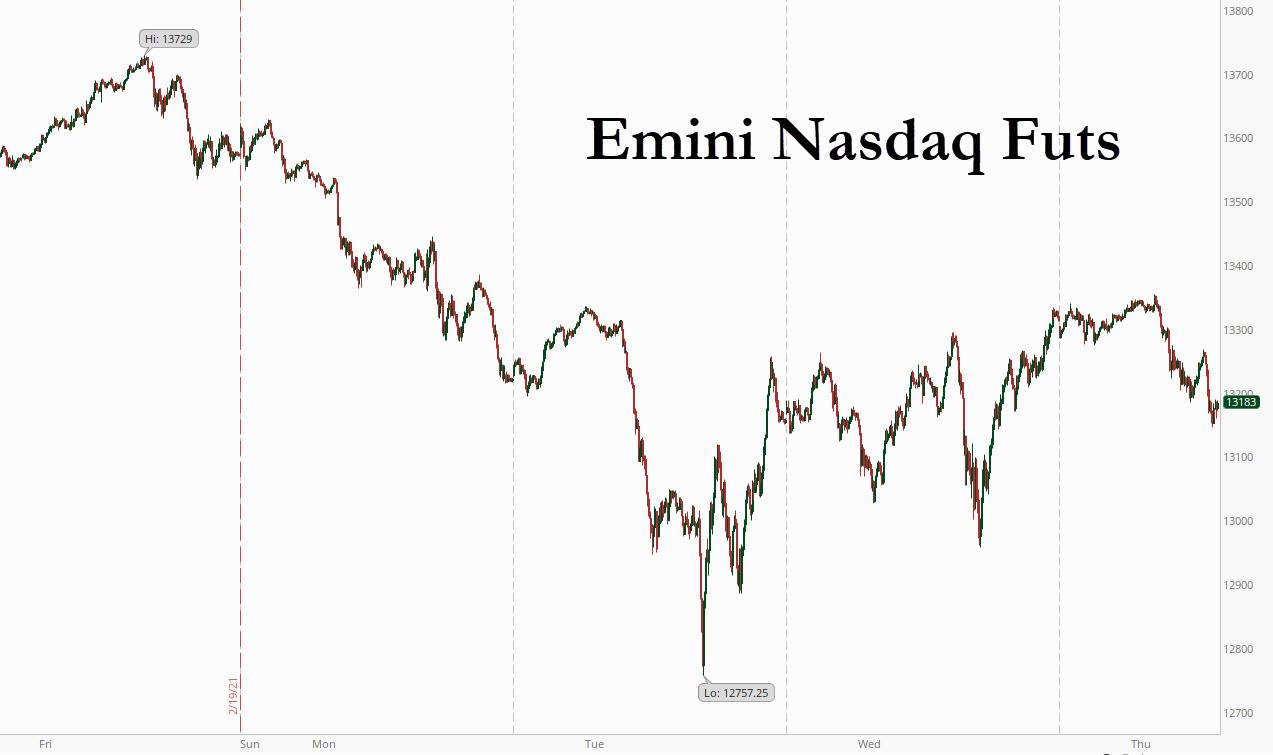
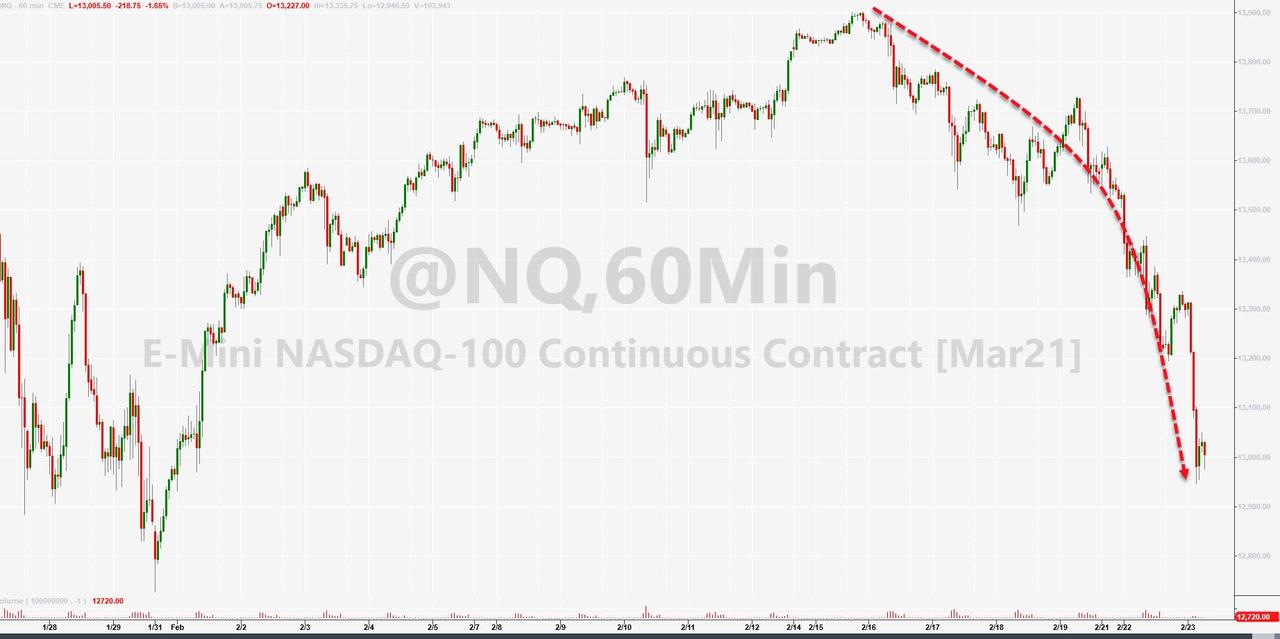
NDX appears to be slipping beneath the Neckline/Lip at 13735.00 which may end the surge from yesterday’s closing low.  While the Lip of a Cup with Handle formation is somewhat permeable, the Neckline of a Head & Shoulders formation generally is not.  This appears to be the case.  So, despite the PPT injection, the NDX is still behaving in a bearish fashion.

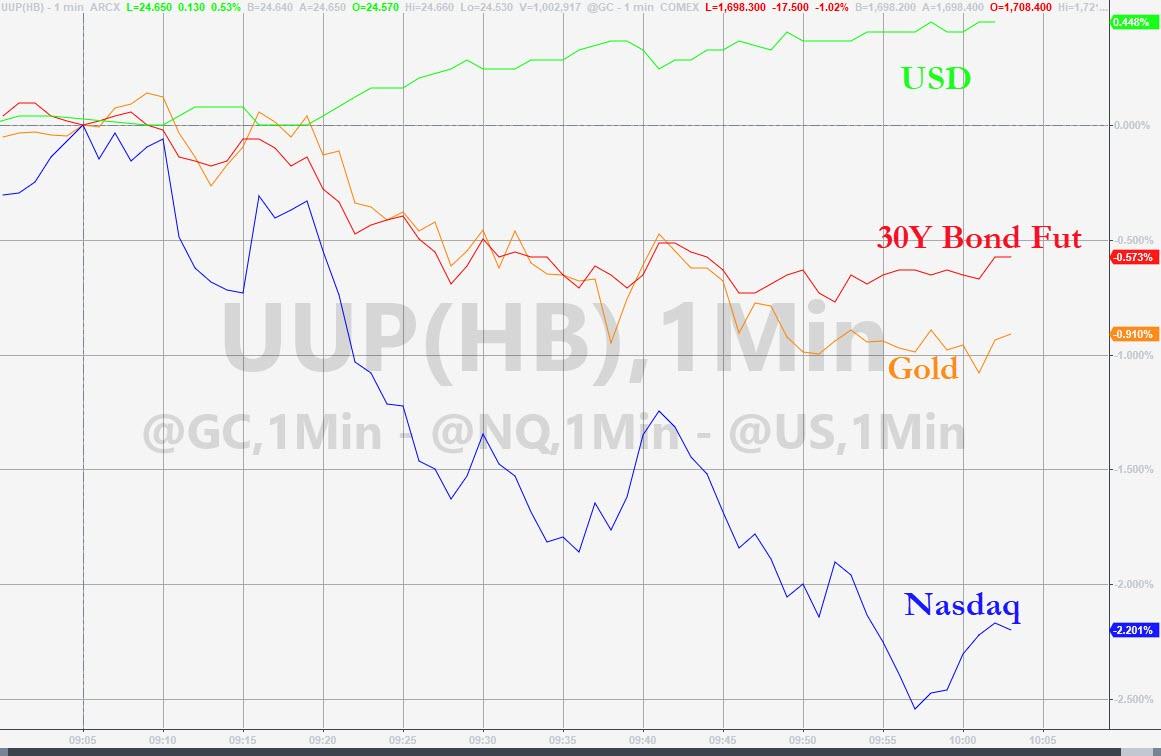
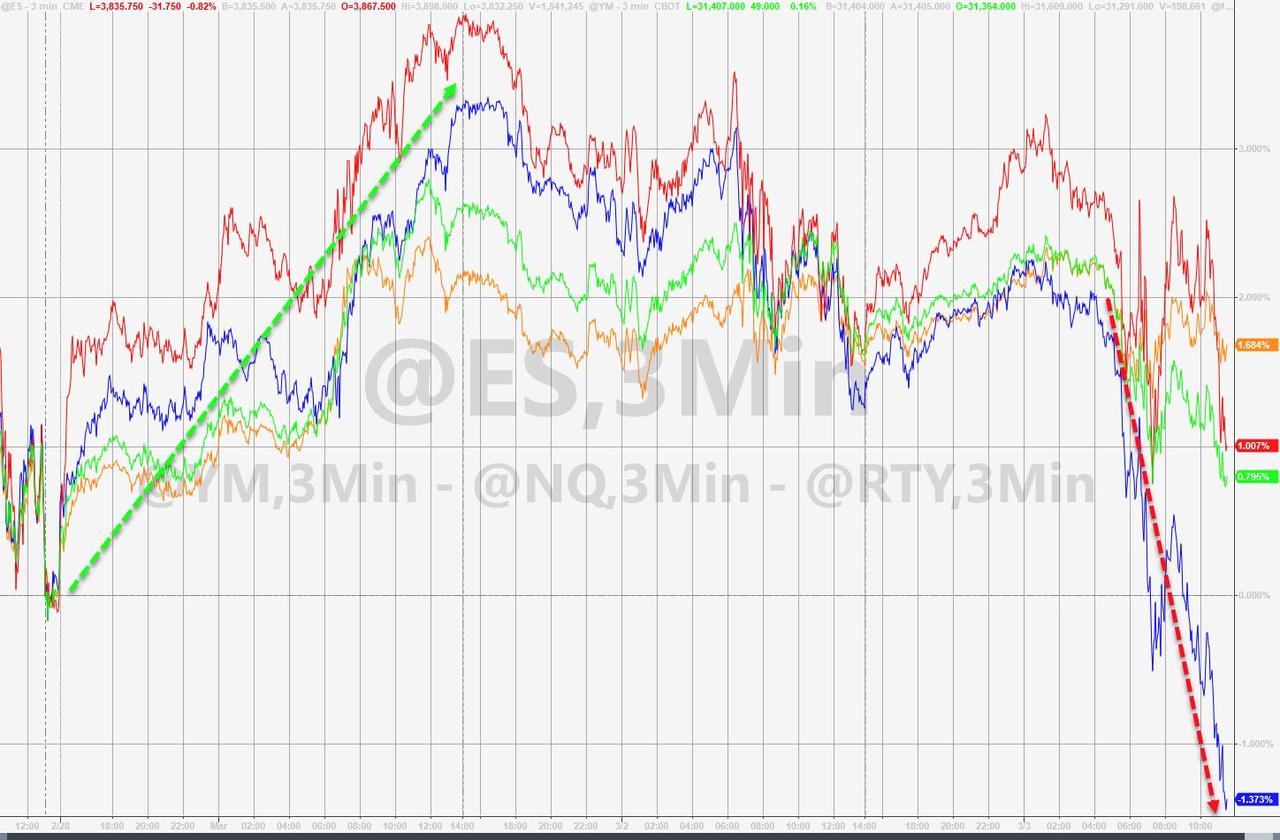
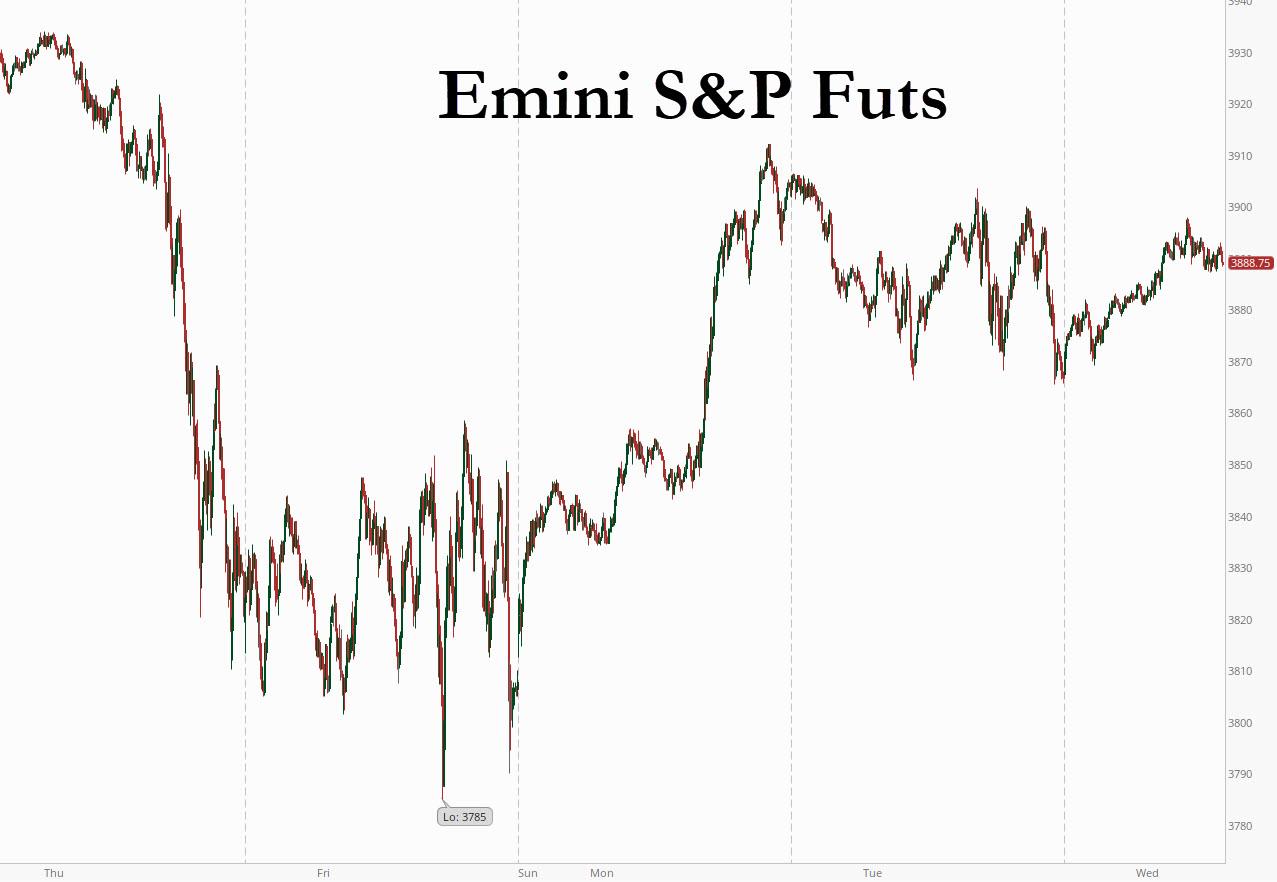
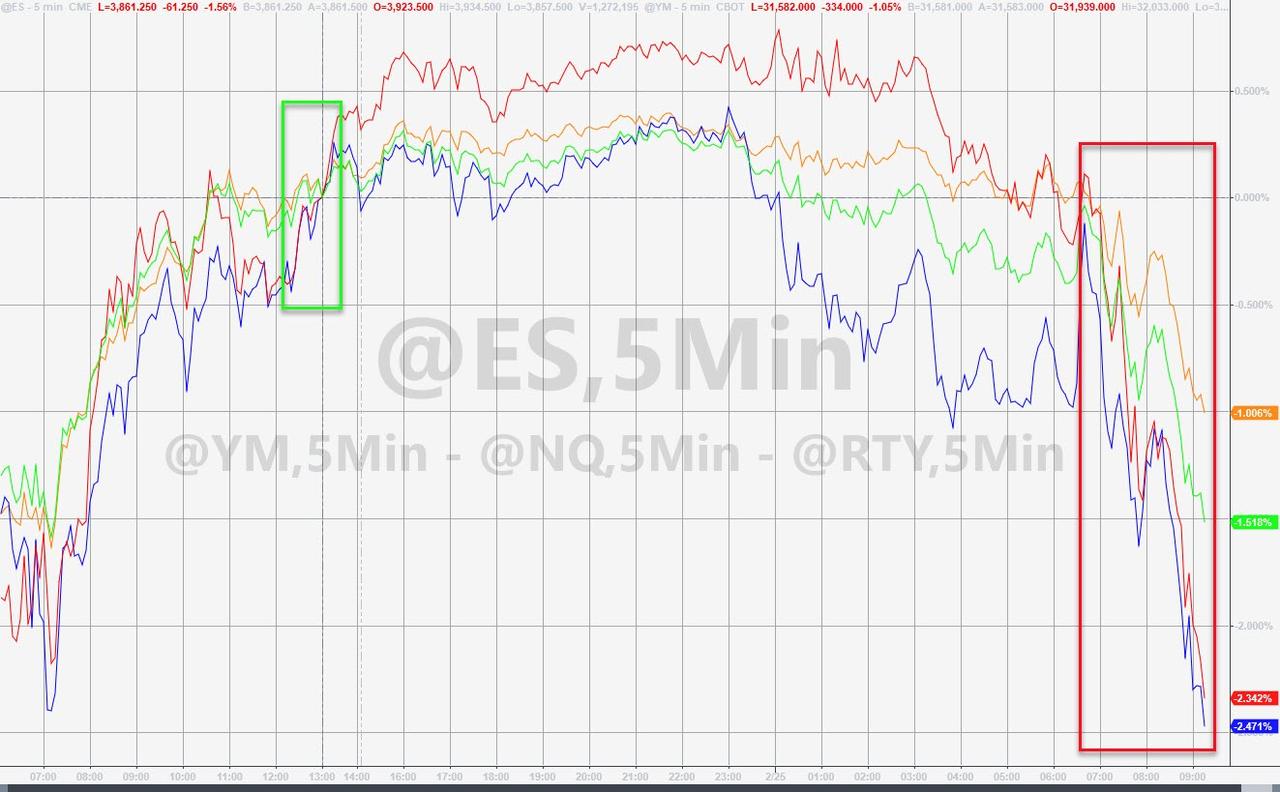
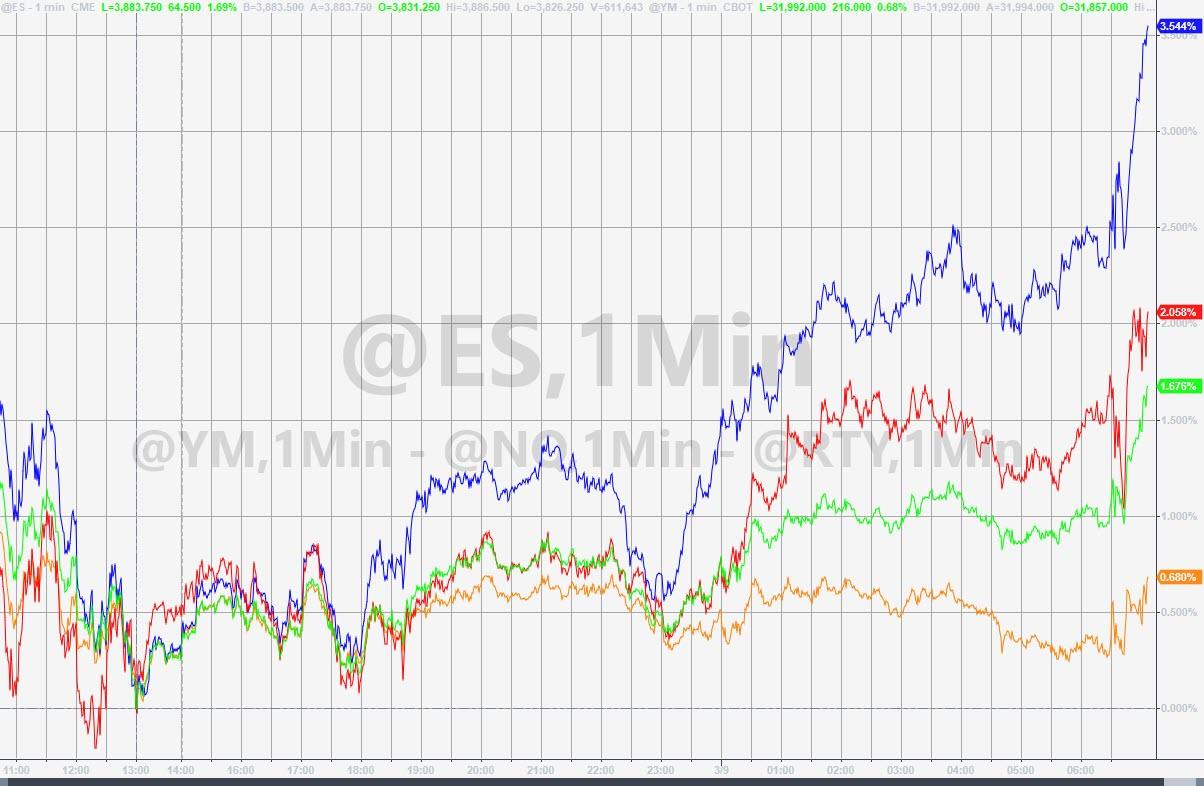
ZeroHedge observes, “With a little nudge from China’s plunge protection team, growth/momo traders are panic-buying big-tech this morning, lifting Nasdaq up a stunning 3.5% from last night’s close…dramatically outperforming The Dow (in a total mirror of yesterday’s price action)…

Nasdaq bounced hard off its 100DMA…

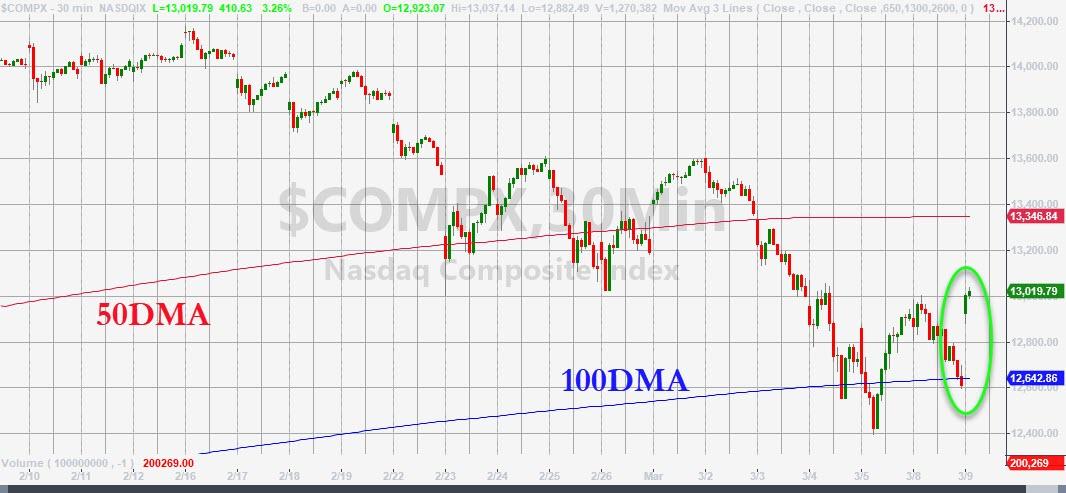
But now faces some resistance at recent peaks…”

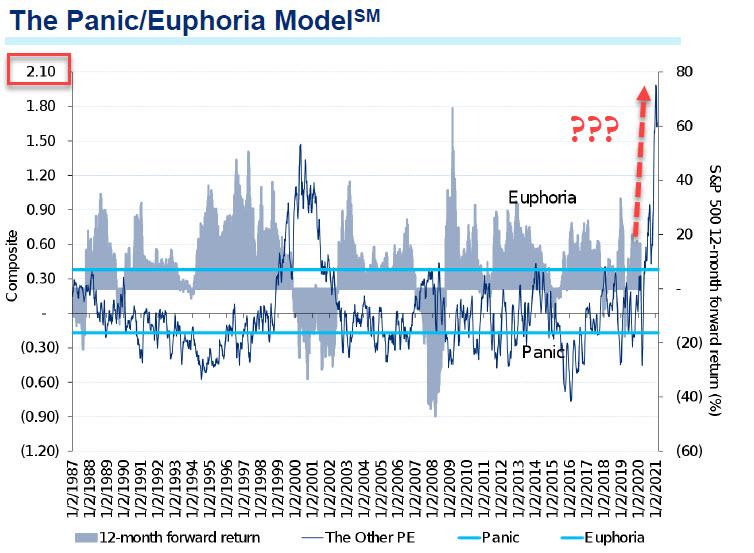
RealInvestmentAdvice comments, “Last week’s sell-off left the “bull market” on shaky ground.

The big question for investors at the moment is whether the 11-year old bull market is ending or is this just a “pause that refreshes?” 

While the optimistic “hope” is that this is just a pause within a continuing “bull market” advance, from a money management standpoint getting the answer “right” is vastly more important to long-term investing outcomes.

The easiest way to approach this analysis is to start with the following basic premise:

“Bull markets are born on pessimism, grow on skepticism, and die on euphoria.” -Sir John Templeton”

Ed. Note:  I have been privileged to know Sir John from 1981 to his death.  I have some fond memories of interactions with Sir John that I may pass on to my grandchildren.


11:05 am

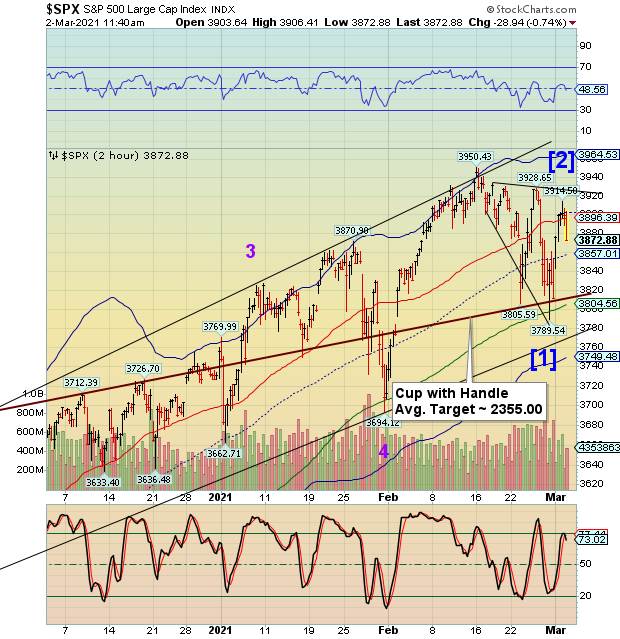
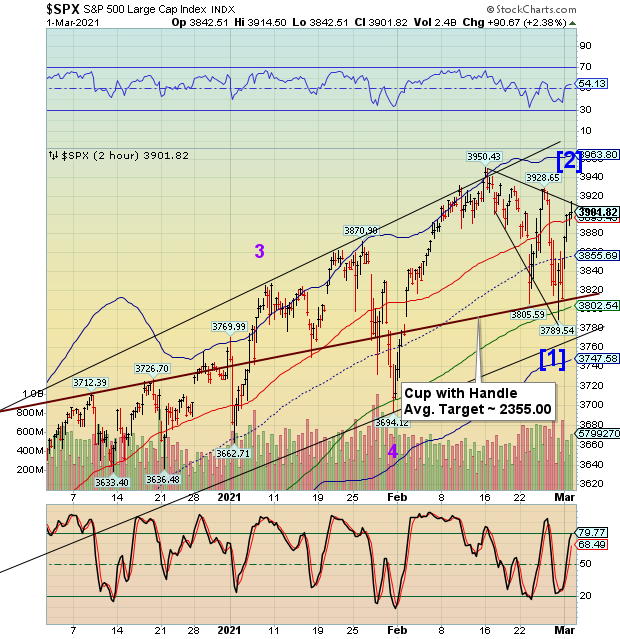
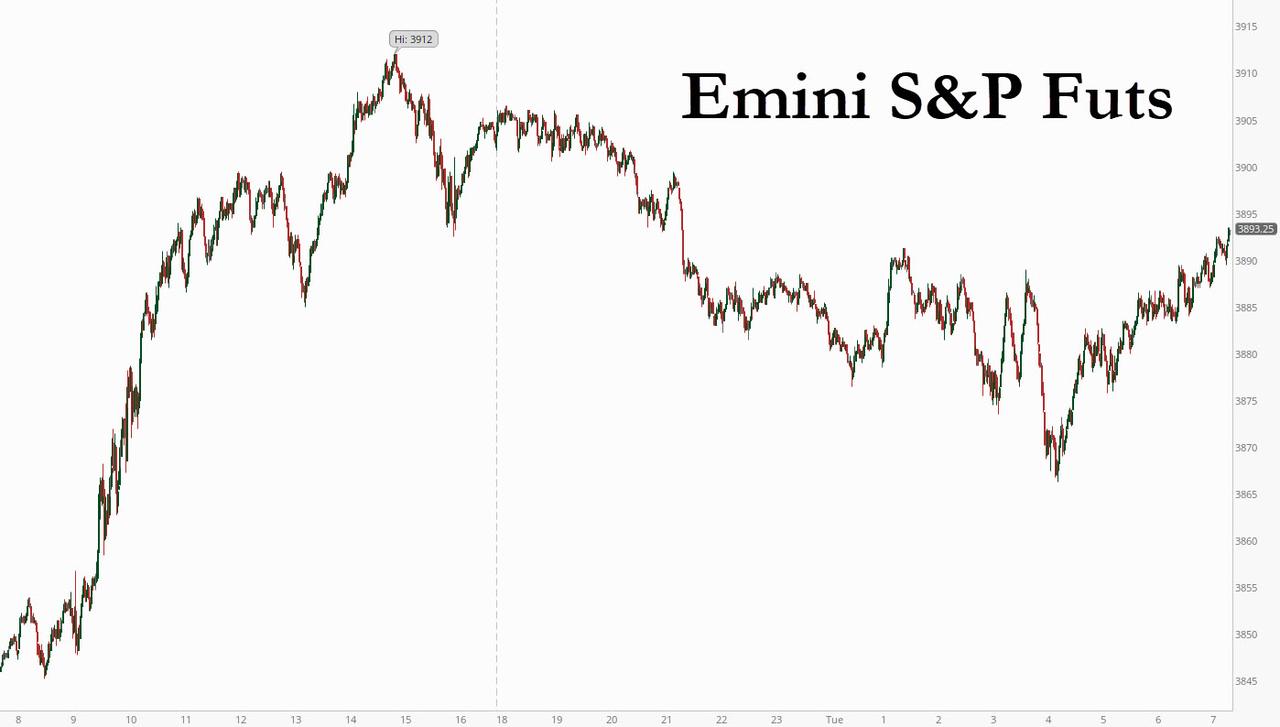
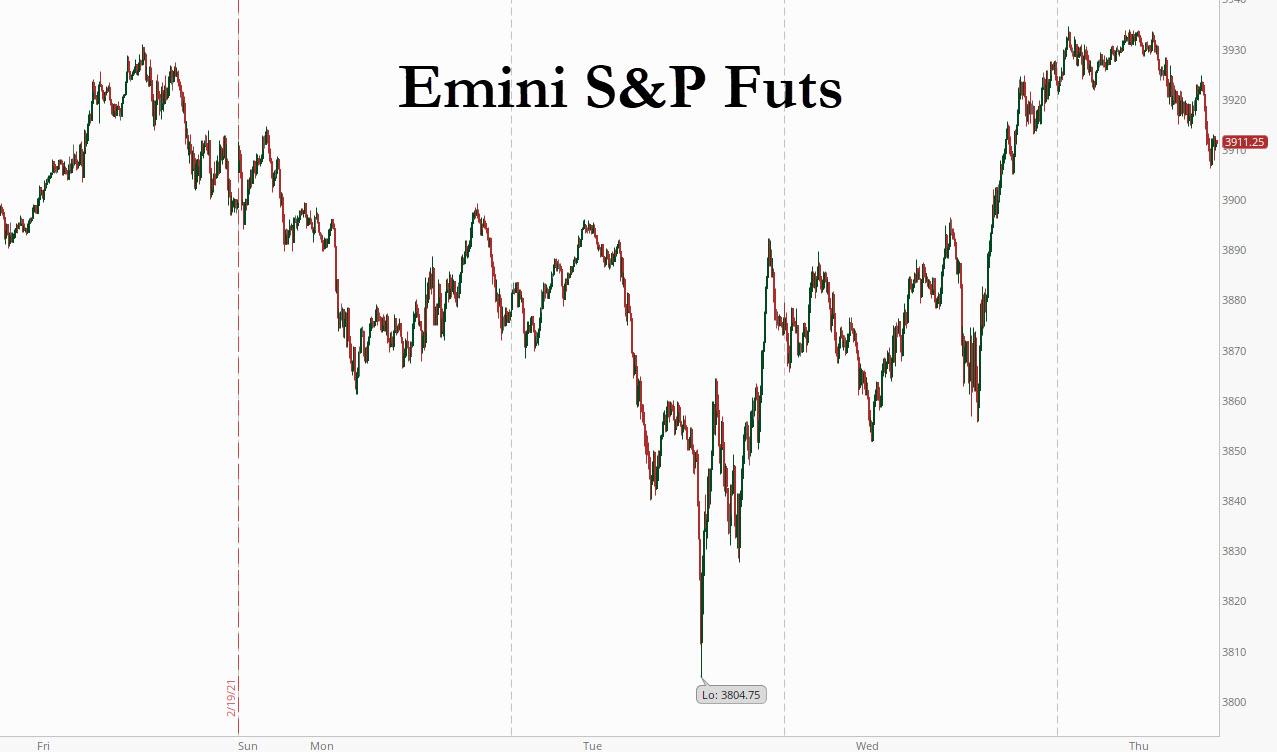
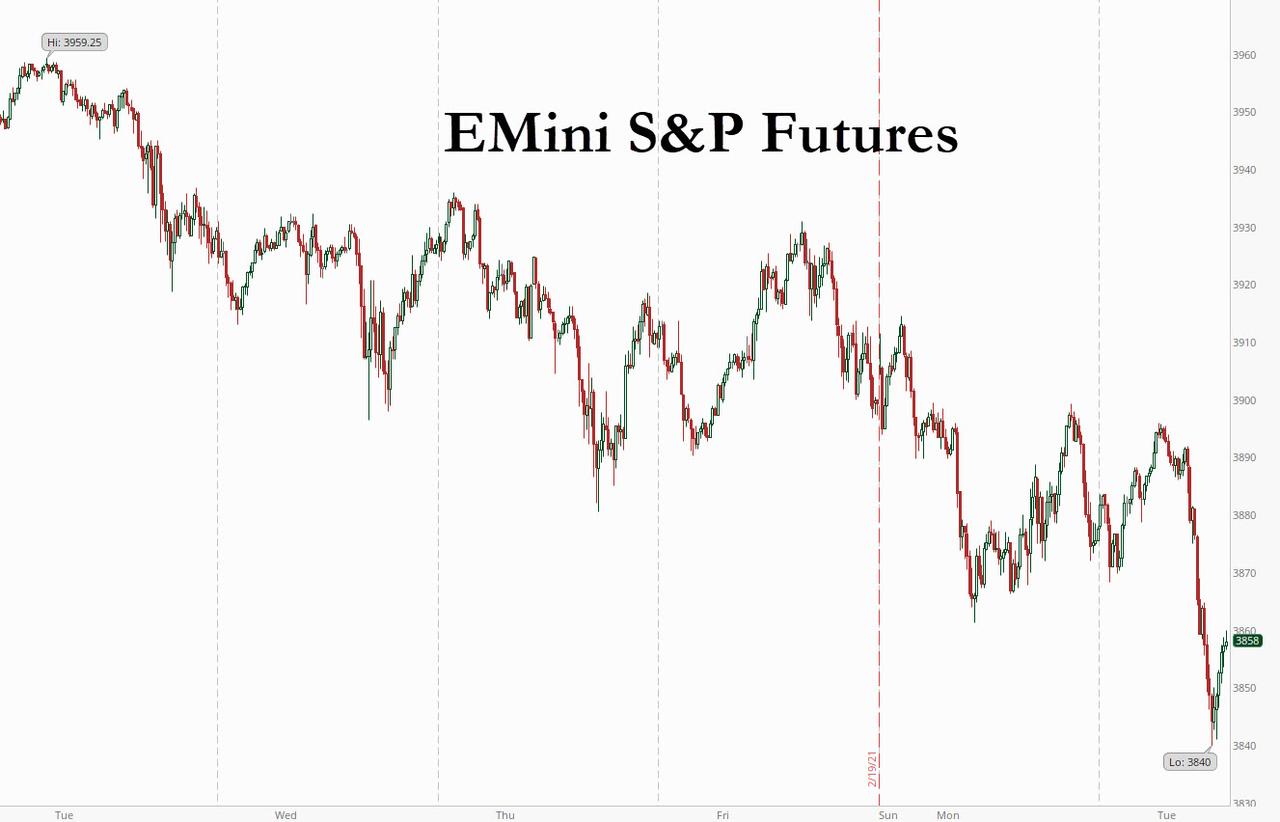
SPX has morphed into a [1]-[2] formation since the rally is now a 5-Wave affair.  It is also now testing the right shoulder target at 3900.00 and completing an expanding Leading Diagonal formation.  What a series of whiplashes!  The implications are enormous.  I had first discussed a crash formation starting at 3928.65, then at 3914.50 and now 3900.00.  This may be where the panic decline officially begins.  After 15.5 days of going virtually nowhere, the decline may now produce 90% of the damage in the next 4.3-6.45 days.

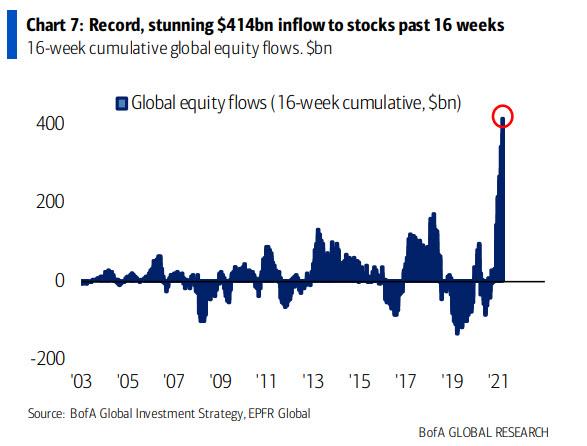
ZeroHedge observes, “The set up for late March: a lot of selling. We are going from the “best inflow” picture in like forever to what seems to be some heavy equity selling in the second half of March.

1. Pension Rebalance: numbers still unclear but rest assure that there will be large $ equities for sale vs. bonds

2. 60-40 rebalance quarterly will also be a massive number. Given the increase in AUM of 60-40 strategies, the rebalancing back to bonds, which now looks like a 61%/39% or 62%/38% could be big.

3. Systematic de-leveraging. Systematic supply aka de-leveraging is in process given the breakdown from key technical levels. It’s also important to note, that systematic strategies are not buying from here. GS has -21B for sale over the next 1-month. More important, “up big” we have -$8B for sale, but “down big” we have -$180B for sale.

4. Momentum. 12m momentum changes at the end of the quarter is bad for the S&P 500 Index composition. (this is selling large cap and largest weights vs. buying the smallest index weights). There is heavy length in long momentum strategies.

5. Issue with issuance. Issuance remains strong, perhaps too strong. YTD US equity and equity-linked issuance (traditional IPOs, SPACs, follow-ons) is off to the hottest start on record ($139bn raised). Previous YTD record was in 2000 ($70bn raised by this point in the year).

6. Taxes. April 15th tax payments. -$1.64T worth of realized capital gains in 2020.

All this is happening into a poor liquidity tape (S&P500 futures liquidity at 6 month low) which will be further exasperated by Easter Holiday vacation (April 2nd is Good Friday. Quarter-end is on Wednesday). Remember that on February Month-end, ES1 sold off -60 handles in the last 10 minutes when it was posted -$2.5B for sale. This one has the potential to get much bigger.”


7:45 am

Good Morning!

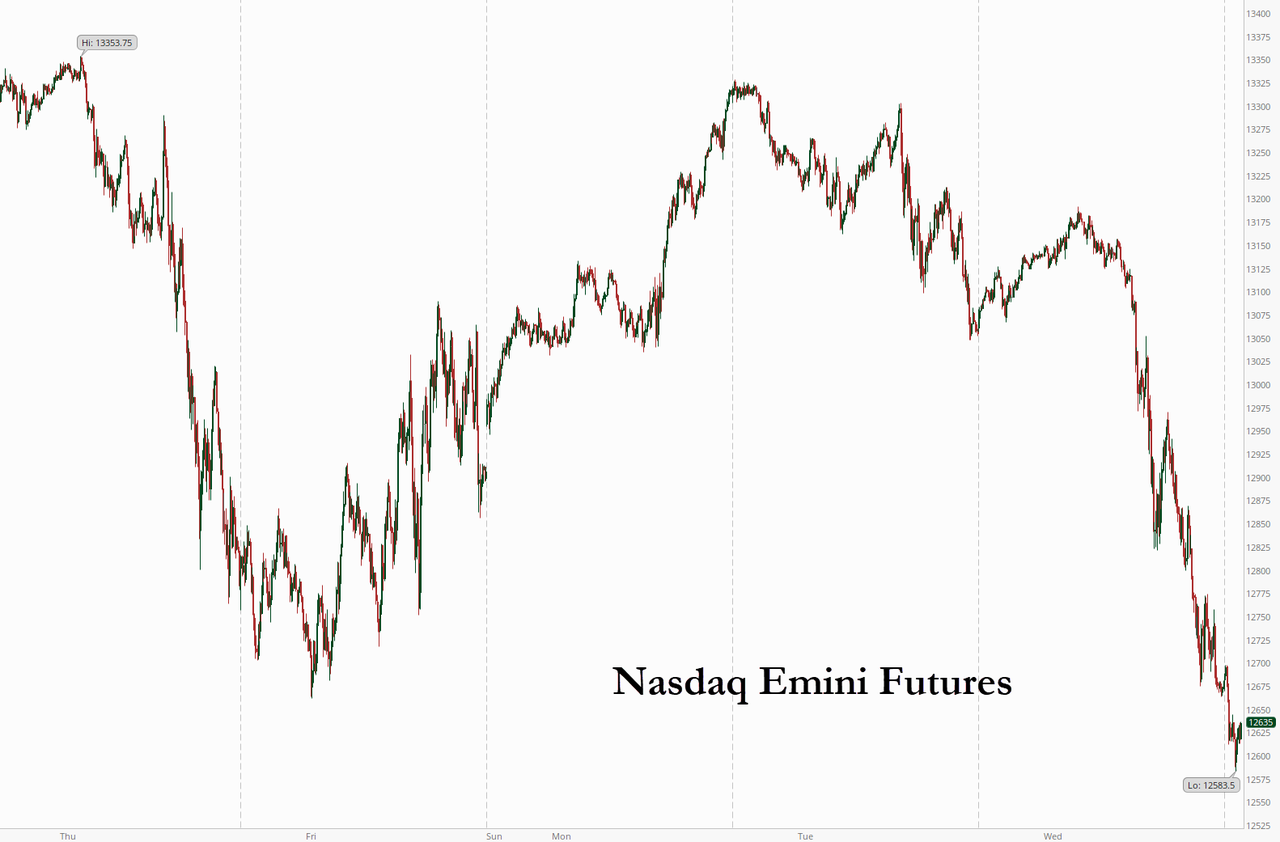
NDX futures made an overnight high at 12610.00, but pulled back beneath Cycle Bottom resistance at 12563.28.  These swings are unusually large, but necessary to allow the volatility to break down supports.  Should selling resume at the open, we may see a test of the 200-day Moving Average at 11387.84.

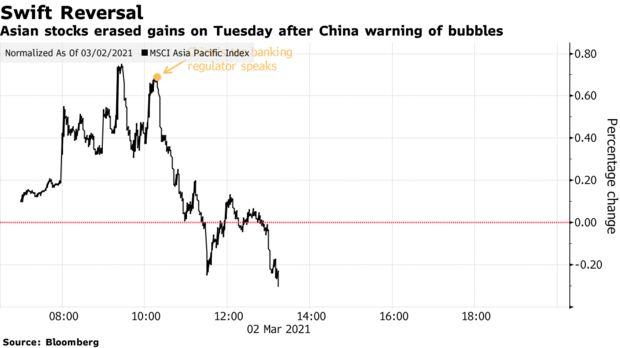
ZeroHedge reports, “Sometime trading really is this easy. Literally minutes after we predicted last night that it was just a matter of time before central banks step in to halt the rout…

… Beijing did just that when shortly after China’s markets reopened on Tuesday (a little after 9pm ET), Bloomberg reported that state-backed funds – i.e., China’s Plunge Protection Team – had intervened to shore up the market in morning trading. The funds, known as China’s “national team,” had stepped in order to ensure stability during the National People’s Congress in Beijing, Bloomberg reported citing “according to people familiar with the matter” with a Hong Kong-based trader saying entities linked to mainland funds were actively buying shares through stock links with Hong Kong Tuesday morning.”


The Shanghai Composite is closed for the day after declining to 3328.21 before closing at 3359.29.  I have no explanation for tis anomaly, other than the Chinese PPT had stepped in near or after the close.  In any case, it was due for a bounce at or near the mid-Cycle support at 3344.19.


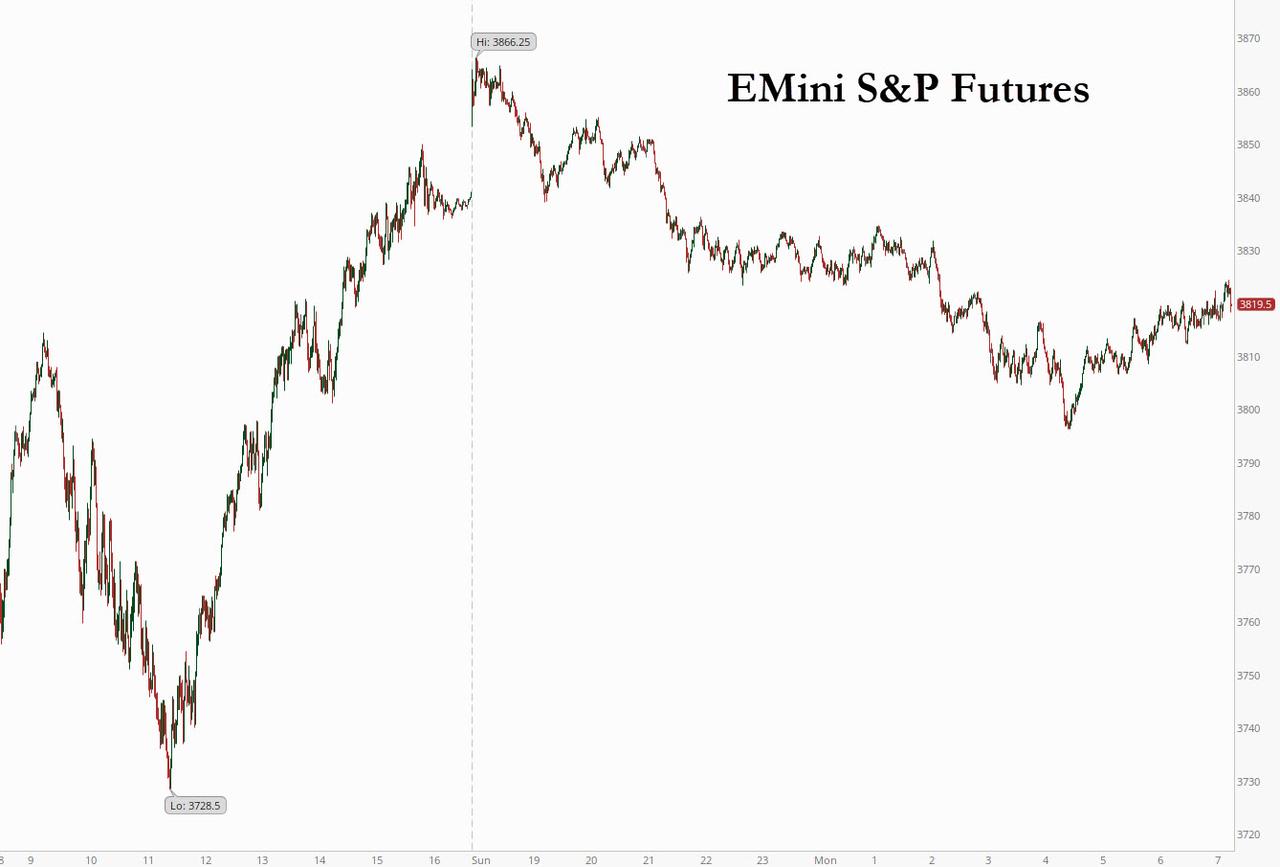
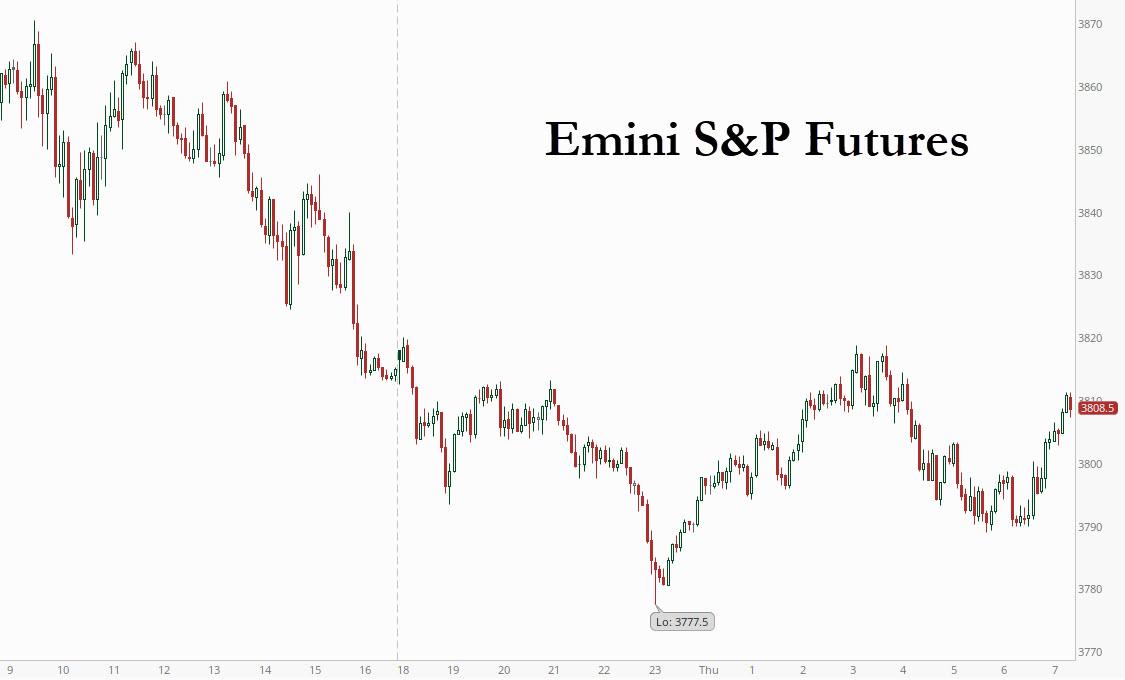
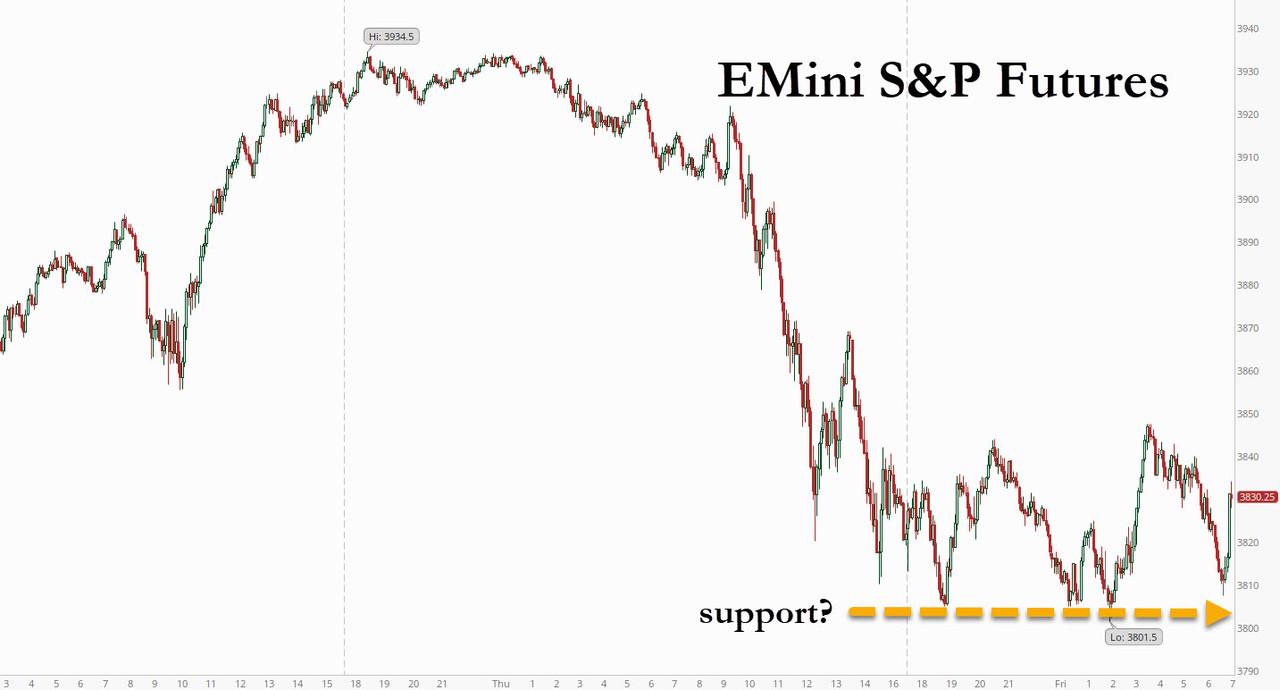
SPX futures rallied to 3865.12, challenging the mid-Cycle resistance at 3859.92, but has slipped back beneath it.  Key support is at the 50-day Moving Average at 3819.53.  The horrible whipsaw that we have been experiencing may be resolved soon.  There is another week of decline ahead of us with bearish implications.


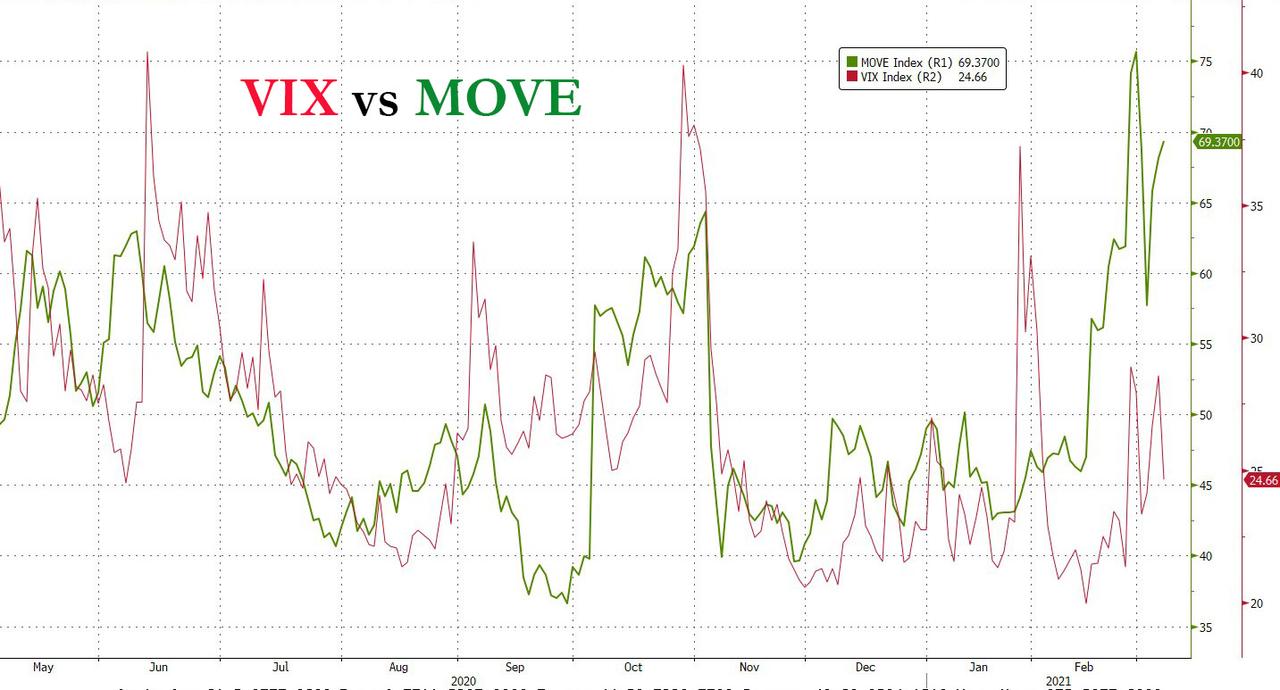
VIX futures are also being whipsawed, but the 50-day support line at 24.04 was not violated.  The Cycles Model suggests the next surge in trend strength may occur by this weekend.


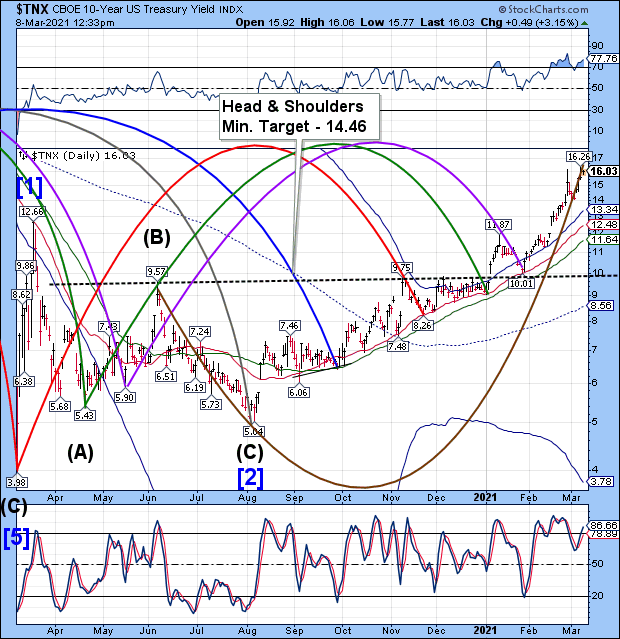
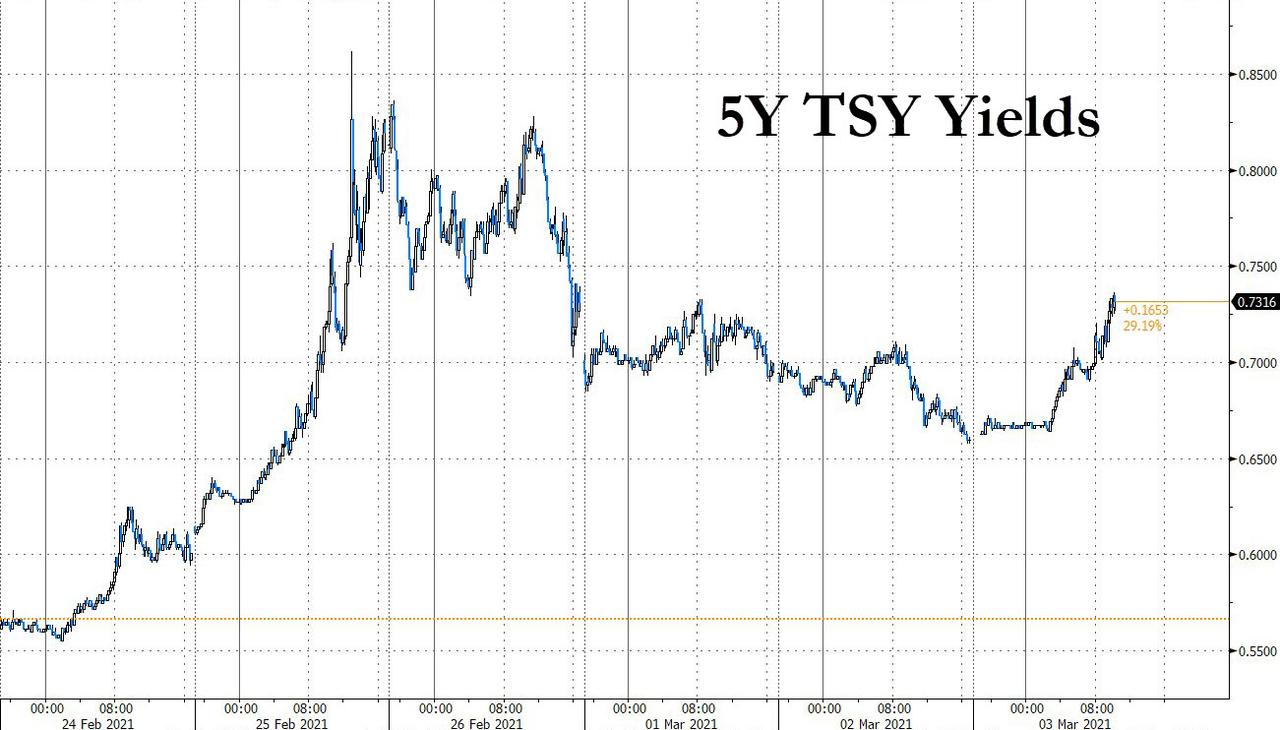
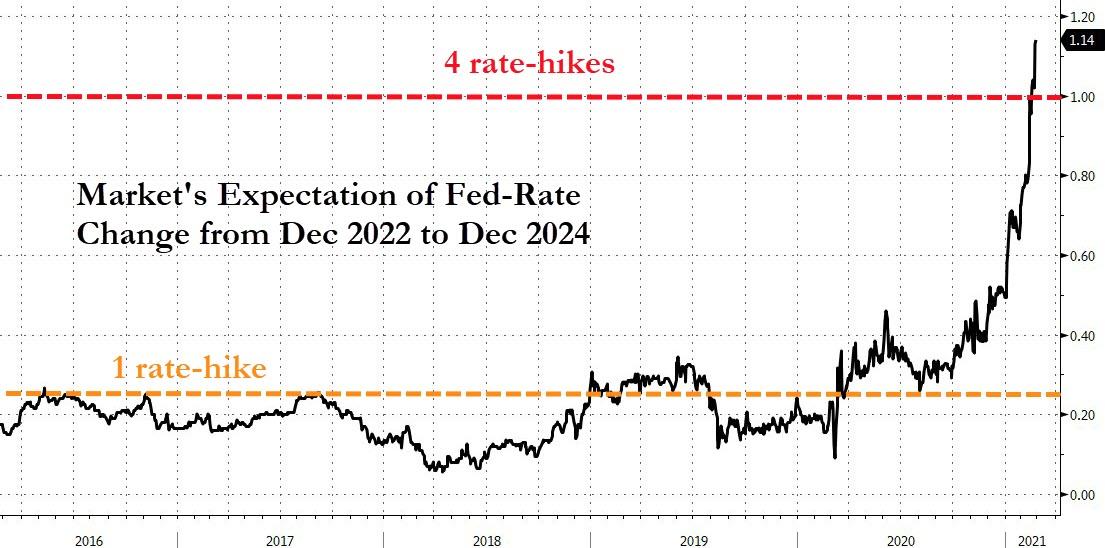
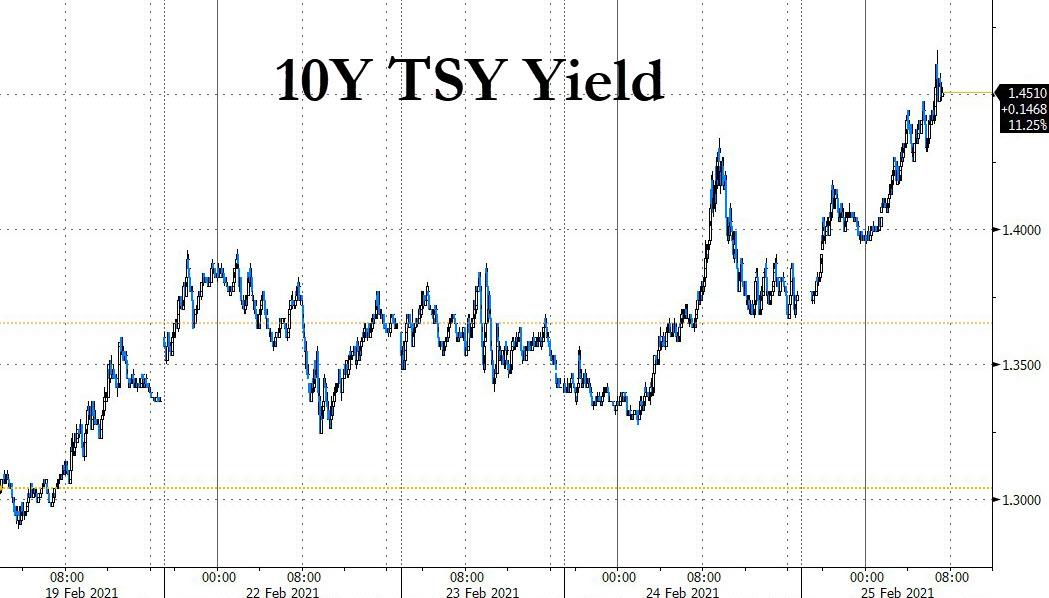
TNX has pulled back from its high, but the surge to a higher price may not be over.  The Cycles Model suggests that today and Thursday may show trending strength.  Today is day 277 in the Master Cycle, which is unusually long.  While the Head & Shoulders target has been exceeded, the Elliott Wave structure calls for yet another surge higher.

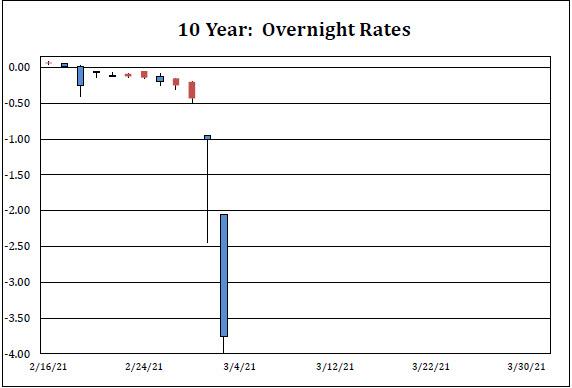
ZeroHedge reports, “The Federal Reserve and Jay Powell want to pretend that all is well with the repo market, but nothing could be further from the truth.

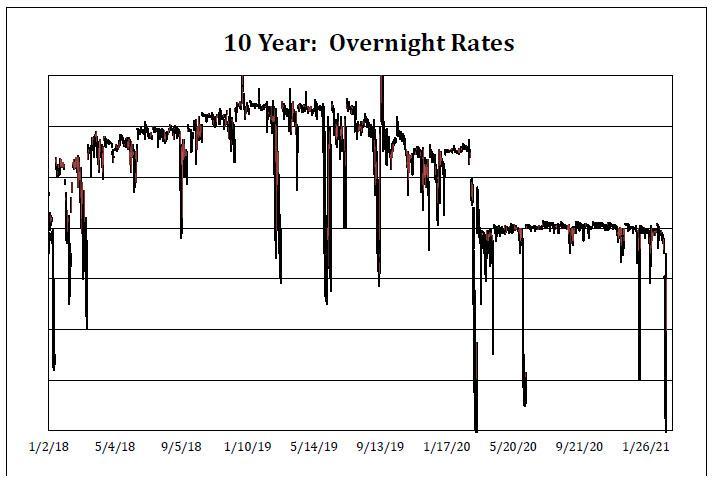
Last Thursday, we presented to our readers the latest repo market data showing just how broken and inverted the traditional fund flows surrounding the world’s “most liquid” and important security had become in “Historic Repo Market Insanity: 10Y Treasury Trades At -4% In Repo Ahead Of Monster Short Squeeze.” One day later, the chaos got even worse as discussed in “10Y Treasury Hits A Stunning -4.25% In Repo As Yields Blow Out.” Very simply, this meant that an investor in the repo market lending money so others could short the 10Y would end up paying rather than getting paid. As we explained said “this is a clear breach of one of the most fundamental relationships in the repo market, where lenders of cash always get paid – however little – in order to make a more liquid and efficient market.”

The repo rate sliding far below the “fails charge” of 3.00% which is viewed as the lowest theoretical level where dealers are punished for not delivering a 10Y Treasury i.e., there is a delivery “fail”, was striking but what was even more striking is that the recent repo crunch has been surpassed just once in history: when the 10Y hit a record low repo print of -5.75% during the fear and loathing of the covid crash chaos on 3/13/20, when the Treasury bond market essentially broke down for several hours.”


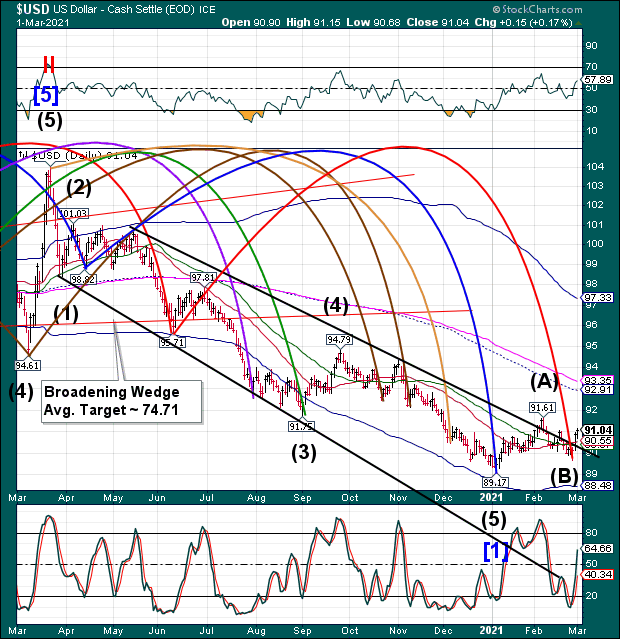
USD futures pulled back to a low of 91.91 this morning in a consolidation.  The Cycles Model shows another week of rally before the USD resumes its decline, enough to cause pain among the short sellers.


Posted in Published | Comments Off on March 9, 2021

March 8, 2021

12:52 pm

SPX may be completing its Head & Shoulders formation imminently.  The right shoulder reaches equality with the left shoulder at 3900.12.  In this case it may be stopped by Short-term resistance at 3878.64.  The last three weeks have been whipsawing investors in both directions.  Remember, lower lows and lower highs signify a probable change in trend, regardless of the number of people buying the dip.

One thing overlooked by investors is the declining population.  ZeroHedge comments, “Next to language, money is the most important medium through which modern society communicates. The Federal Reserve is responsible for signaling how fast this money should be created or destroyed via its federal funds interest rate. When demand is high and capacity/supply low, the Fed should ideally make rates low to support growth of loans to boost capacity/supply. When demand is low and capacity/supply high…the opposite. Instead, the Fed is doing the inverse…trying to focus on getting consumers to use more credit/debt (think record low mortgage rates) to create more demand and necessitate higher capacity (think homebuilders).

In a ridiculously difficult chart to decipher below (so I’m told), I highlight the year over year change in working age population (yellow shaded area), year over year change in employees among them (grey shaded area), housing permits (blue line), and the 30 year mortgage rate (white line…driven by the Federal Reserve’s federal funds rate and MBS purchasing). The current situation of soaring permits against declining working age population and tanking employees among them…overridden by the speculative fervor created by record low mortgage rates is a case in point.”


12:33 pm

TNX is above 16.00 again.  As mentioned earlier, the 10-year rate may stay pinned near the top if not going higher this week.  I made an error in announcing the 10-year auction on March 4.  That was supposed to be the announcement date.  The actual auction is to be held on Wednesday, March 10, according to TreasuryDirect.

ZeroHedge updates us on the Liquidity Tsunami, “Exactly one month ago we explained that the US economy and capital markets were about to be flooded with a $1.1 trillion liquidity wave as the Treasury drew down the amount of cash held in the Treasury General Account which would plunge to just $800 billion by March 31, down a record $929BN from $1.729 trillion at Dec 31, 2020.

In other words as of early February, the Treasury expected the decline in the cash balance this quarter – which is being spent to fund last December’s fiscal stimulus – to be the main driver of funding needs.

This matters, because as we and repo guru Zoltan Pozsar explained (here and here), this massive flood of liquidity entering the market would trigger a multi-faceted domino effect across assets, potentially pushing funding rates (FRA-OIS, repo, etc) negative, even as the glut of “safe collateral” hit demand for longer-duration, resulting in curve steepening and higher yields in longer-dated paper. And since the market is now extremely sensitive to any yield increases – reflationary or otherwise – a paradox emerged: despite over $1 trillion in liquidity hitting the market, the impact on risk assets would be largely negative.”


12:10 pm

NDX was repulsed at the neckline, a common occurrence for a Head & Shoulders formation.  The NDX has turned bearish again, having lost all near-term supports.  The next probable support lies at 10957.00, beneath the minimum target for the Head & Shoulders formation and possibly beneath the 200-day  Moving Average at 11538.00..

RealInvestmentAdvice observes, “In a “market mania,” retail investors are generally “long confidence” and “short experience” as the bubble inflates. While we often believe each “time” is different, it rarely is. It is only the outcomes that are inevitably the same.

I recently penned an article about Charles Mackay’s book “Extraordinary Popular Delusions And The Madness Of Crowds.” As noted, that book was an early study in crowd psychology. To wit:

“Essential is the understanding of the role psychology plays in the formation and expansion of financial manias. From the 1711 ‘South Sea Bubble’ to the 2000 ‘Dot.com crash,’ all bubbles formed from a similar ‘panic’ by investors to chase ongoing speculation.”

A recent UBS survey revealed some fascinating insights about retail traders and the current speculation level in the market.”


8:00 am

Good Morning!

NDX futures are down this morning after testing the neckline, but not beneath Friday’s low.  There is a good probability that the failed test of the neckline is all that is needed to resume the decline.

ZeroHedge reports, “US equity futures and global markets jumped higher at the reopen of Asian trading late on Sunday following news of the Senate’s passage of the Biden $1.9TN stimulus plan and the spike higher in oil following the Houthi drone attack on Aramco facilities in the Gulf, but have since dipped amid renewed reflationary fears which pushed Treasury yields as high as 1.61% overnight hitting tech stocks with lofty valuations even as value stocks and European markets were broadly in the red. After rising above $71, Brent has since faded gains and was last trading near where it closed Friday at $69. Bitcoin soared as HK-based firm the latest institution to convert cash into Ethereum and Bitcoin.

At 7:10 a.m. ET, Dow e-minis were down 16 points, or 0.07%, S&P 500 e-minis were down 16.5 points, or 0.44%, and Nasdaq 100 e-minis were down 154.25 points, or 1.20%.

Futures tracking the Nasdaq 100 index sank as much as 2%…

… as the passage of a $1.9 trillion COVID-19 relief package by the U.S. Senate lifted bond yields, pressuring richly valued technology stocks and sparking inflation concerns. As a reminder, on Saturday the Senate passed the stimulus package – the biggest in U.S. history – and President Joe Biden said he hoped for quick passage of the revised bill by the House of Representatives so he could sign it and send $1,400 direct payments to Americans. According to JPMorgan, every $1 trillion of fiscal stimulus adds around $4-$5 to companies’ earnings per share, implying 6-7% upside for the remainder of the year.”


SPX futures are challenging the 50-day Moving Average at 3814.46, having reached a low of 3796.38 earlier this morning.  The next support is the 1-year trading channel trendline at 3790.00.  The Cycles Model suggests the decline may continue through this week.  The loss of near-term supports portends an acceleration of the decline into a panic selling rout.

ZeroHedge comments, “Something bizarre is happening in the stock market: for the past three weeks stocks – and especially tech – has gotten hammered, with the Nasdaq briefly sliding into a 10% correction while the S&P has also been hard hit (although one can’t say the same for reflation stocks such as energy which have soared in recent weeks). Some other notable casualties: Apple has tumbled 15% since late January. Tesla has lost more than a quarter-trillion dollars in market value in three weeks, and more than $1.5 trillion has been wiped off the Nasdaq in less than a month.

And yet, despite this hit to risk assets on the back of the recent in surge in interest rates, accompanied by a parallel spike in both the VIX, and its bond market equivalent, the MOVE index…

… on Friday we reported that according to the latest EPFR fund flow data, $22.2Bn in new money flowed into equities last week, following the previous week’s massive $46.2Bn inflow which was the 3rd biggest on record, bringing the total 16 week inflow to $436BN, a stunning burst of inflows as shown in the chart below.


The decline in stocks has pushed the VIX back above its mid-Cycle resistance at 25.97, but not to new highs, yet.  There is no commentary on the VIX as the assumption is that we have seen al this before…


TNX has hit a morning high of 16.13 thus far.  That leaves Friday’s high as the potential  high for a very stretched Master Cycle (273 days).  Unfortunately, the next four days show an extraordinary trend strength in the Cycle that may extend it even further, or at least keep yields pinned near the high for the rest of the week.

RealInvestmentAdvice explains, “Eric Hickman discusses the recent signal to buy 30-year bonds.

A technical indicator with a reliable history is signaling that 30-year Treasury yields will soon decline.

A relative strength index (RSI) can be measured for any price series and represents how much and frequency gains are occurring versus losses. The index is used as a contrary or turning-point indicator. After periods of strong, persistent selling, buying is expected and vice versa.

It isn’t a complicated calculation. The RSI takes the average price change of days with gains compared to the average price change of days with losses over the last x days. This is converted into an oscillator that can take any position between 0 and 100. When prices (or yields) are rising fast and persistently, the oscillator will approach 100; when selling occurs with lower prices, it will approach 0. The oscillator spends most of its time in the middle, say between 30 and 70. Extreme readings (close to 0 or 100) happen rarely. We can study these extremes historically to see how useful the index is at identifying major turning points in markets.”


USD futures hit a new retracement high at 92.34 this morning.  This makes US assets more valuable to foreign investors, especially bonds.  The rally in USD may last until mid-April.


Posted in Published | Comments Off on March 8, 2021

March 5, 2021

9:00 am

Good Morning!

SPX completed a 12.9 day Cycle at 2:00 pm yesterday.  However, the Master Cycle have up to 8.6 days to go, completing on March 17.  If correct, we are due for a bounce that may stay beneath the 50-day Moving Average at 3815.08.  The top trendline of the Orthodox Broadening Top appears to lie in close proximity if not in agreement with the 50-day.  That is also the 50% Fibonacci retracement level.

SPX futures have ramped above 3800.00 this morning on the BLS February Employment Survey

ZeroHedge reports, “A much better than expected improvement in the labor market (unemployment rate down and bigger jump in payrolls) was not at all what the market wanted to see.

The ‘good news is bad news’ narrative is back, tilting attitudes slightly less dovish as the economy is believed to be back on the ascendance as more states ready for reopening.

That sent rates spiking higher…”


The 10-year note yield jumped to 16.26 this morning, then pulled back beneath 16.00.  It may extend a bit higher today, but it is also likely that this is the Master Cycle high, or nearly so.  Today is day 273 in the Master Cycle.  The time window is closing…


VIX futures have pulled back to 26.15, a 50% retracement of yesterday’s rally.  The Wave structure appears to be a (1)-(2), 1-2.  If so, the correction may be over in the first hour of the cash session.


Posted in Published | Comments Off on March 5, 2021

March 4, 2021

3:06 pm

SPX has broken the uptrend from last March’s low.  It has retested the trendline and may resume its decline with greater momentum.

ZeroHedge reports, “Just out from Tradestation:

Valued Futures Clients,

Due to potential market volatility, reduced intraday Futures Margin Rates will be suspended at 3:00pm ET.

All Futures accounts will be required to have full maintenance margin when trading futures products by 3pm ET.

Reduced intraday Futures Margin Rates will be available again at 8:00am ET Friday morning.

The last hour of trading is about to get very chaotic.”

ZeroHedge observes, “No hints at a ‘Twist’, refuses to speculate on repo issues, no pushback against recent bond vol, and no mention of SLR exemption.

This was the closest he came to saying anything of note:

“We monitor a broad range of financial conditions and we think that we are a long way from our goals,” he said.

“I would be concerned by disorderly conditions in markets or persistent tightening in financial conditions that threatens the achievement of our goals.”

Which is just more of the same generic platitudes, and that is not what the market wanted to hear…

Nasdaq is now down over 10% from its highs and the S&P has joined Nasdaq in the red for the year…”


7:50 am

Good Morning!

I thought I’d share a long view chart of the SPX that I keep for reference.  You may recall that I had mentioned 3950.00 as a possible target in the past month.  Here it is in all its glory.


SPX futures dropped to an overnight low of  3778.50 before rising to test the 50-day Moving Average at 3813.79 tis morning.  Others see a possible Head & Shoulders formation, but I disagree because the Head & Shoulders is much more rigid in its structure, while the Cup with Handle formation allows anomalies to occur.  This is a very bearish formation.

In reviewing the Cycles, I find an alternate to my original thinking that may explain the slow development of the decline.  The original Cycle layout called for the Master Cycle to be complete by Friday.  That does not appear likely with the bearish formation just being triggered.  The alternate calls for the Master Cycle to decline into options expiration week.  That would be in agreement with the destructively bearish targets in both the SPX and NDX.

ZeroHedge reports, “U.S. futures slumped alongside tumbling European and Asian stocks on Thursday, but have since rebounded and were back near unchanged levels as traders awaited remarks from Jerome Powell following a recent bout of bond market turmoil. Treasuries and bitcoin were steady, while the dollar and oil were slightly higher. Nasdaq futures rebounded after falling to a two-month low, wiping out all 2021 gains.

At 6:45 a.m. ET, Dow E-minis were down 48 points, or 0.15% and S&P 500 E-minis were down 10 points, or 0.26%. Nasdaq 100 E-minis were down 36points, or 0.29%.

The S&P 500 is set to open below its 50-day moving average, an indicator of short-term momentum that has proved to be a support line in the recent days.


NDX futures dipped to 12513.38 before bouncing back to breakeven.  The neckline is near 12700.00 and may be an attractor until it is tested.  You can see how much more structured the Head & Shoulders is in the NDX as opposed to the SPX.  However, it also simultaneously has a Cup with Handle formation with a much more bearish outcome.  It almost seems as if the market is hell-bent to decline no matter what Powell says.

ZeroHedge remarks, “As the NASDAQ took another drubbing on Wednesday, leading many to think that the turmoil of late isn’t just going to go away on its own, all eyes were on the market’s latest “visionary” investor, Cathie Wood at ARK Invest.

Wood has been in the news over the last 12 to 18 months due to the meteoric rise in ARK’s flagship ETFs, including the ARKK Innovation Fund. But of late, even more eyes have been on Wood because questions loom about how Wood’s fund would handle the tech bubble, that has been building in size and speed since March 2020’s Covid lows, if it burst.

And if this week has been any indication, we may find out soon enough.

Heading into Wednesday night, the NASDAQ had turned red on the year.”


VIX futures rose to a high of 27.78 before receding back to the mid-Cycle support at 25.98.  The Cycles Model suggests a possible explosion of strength through the weekend.  Further strength may occur during options week.


TNX made a low of 14.50 overnight, then began its probe higher.  We have a Powell speech this morning and a 10-year treasury auction, to boot.  The market may be on tenderhooks until then.  A probable targe for today may be 17.00 or higher, depending on the reaction of the crowd.  Once the peak is in, the rush to cover may be astonishing.

ZeroHedge reports, “Something crazy happened in the repo market today: according to Curvature repo guru Scott Skyrm, the 10Y traded as low as -4.00% in repo, a record low level and an unprecedented dislocation for the world’s most liquid security, one with potentially tremendous consequences for what Jerome Powell may say tomorrow. Incidentally, Skyrm was far more dramatic about this historic move:

It’s all over for the 10 Year Note! Clearly a significant amount of shorts rolled forward and now short-demand has overwhelmed the available supply. The issue traded as low as -4.00% today and already traded at -3.05% for tomorrow. Both of those rates are lower than Fail Charge, which is the equivalent of -3.00%.

What is remarkable is that the 10Y was barely “special” last Thursday when yields exploded higher amid the liquidation panic.

Actually scratch that: last week there were barely any shorts in the 10Y – that’s why the massive stop loss liquidation after last Thursday’s 7Y auction was just longs puking. It was only after that the flood of shorts arrived and hammered the 10Y to “fails” levels in repo.”

ZeroHedge further observes, “One of the biggest buzzwords in finance right now is the three letter acronym SLR, which stands not for a discontinued and particularly expensive Mercedes model, but for Supplemental Liquidity Ratio – a limit on how leveraged US banks can get – and whose fate could mean the difference between a stabilization in the bond market a violent, marketwide crash.

Here’s what’s going on.

Back on April 1, 2020, just as the market was crashing and one week after the Fed unleashed its bazooka to avoid a total systemic collapse, the Fed announces temporary change to its supplementary leverage ratio (SLR) rule “to ease strains in the Treasury market” and “increase banking organizations’ ability to provide credit to households and businesses.” Specifically, the Fed change would exclude U.S. Treasury securities and deposits at Federal Reserve Banks from the calculation of the rule for holding companies. The change would be in effect until March 31, 2021.”


USD futures rose to 91.22 this morning, still consolidating, but ready to move higher.


Posted in Published | Comments Off on March 4, 2021

March 3, 2021

3:20 pm

NDX broke through the neckline/lip of the Cup with Handle formation.   This should prepare us for a panic decline that is likely to catch on to the SPX and DJIA.  The Hi-Lo indices appear to be off kilter (going higher) or it may be that retail is still buying smallcaps.  The final figures aren’t available until tomorrow’s open.

ZeroHedge reports, “Things have accelerated south as the day wears on, with US equities all down hard led by a 2.5% plunge in big-tech.

Nasdaa is now down almost 1.5% since the end of February (and down almost 5% from Monday’s exuberant highs)…


10:58 am

TNX is approaching/testing its 15.00 pain threshold for stocks.  It appears that the target may be 17.00 or higher which may set off a panic in equities.  The 5-year note is also approaching its threshold at .75.

ZeroHedge remarks, “Just around the time we showed that 5Y breakevens have soared to 2.50%, a level last seen just before the 2008 global financial crisis (and when oil was trading at $140), Mizuho rates strategist Peter Chatwell cautioned that with the 5Y nominal yield rising dangerously close to 0.75% again, this is  “warning #2 for stocks and credit.”


7:30 am

Good Morning!

NDX closed beneath its 50-day Moving Average at 13112.96 yesterday.  NDX futures rallied above the 50-day overnight but appear to have retreated back beneath it this morning.  Should it be unable to hold its grip on that support, the next target is the neckline/lip of the Cup with Handle formation.  This formation is as bearish as it gets.

There are two scenarios that present themselves.  The first is that investors are caught offsides and off guard.  The panic is so profound that the bottom literally falls out in just a matter of days.  The second scenario posits that the Master Cycle ended last Friday at the low (day 256).  What happens next depends on whether downside support is broken.


SPX futures tested Short-term resistance at 3897.01 in the overnight session, but has pulled back down.  Mid-Cycle support must be broken to resume its bearish pace.  A close beneath the trendline and the 50-day Moving Average at 3806.62 confirms the crash scenario.

ZeroHedge reports, “Once again market sentiment has reversed violently – or rather the opposite – overnight, with yesterday’s late day spoo slump inspired by the short squeeze in Rocket Mortgage – which forced hedge funds to liquidate their best positions – being faded and on Wednesday Emini futures jumped 0.6%, global shares gained with European indexes echoed positive moves in Asia, as a recent retreat in Treasury yields fuelled demand for riskier assets… even though the 10Y has rebounded 5bps to 1.45% overnight as focus again turned back to the stimulus-fueled recovery from the pandemic. The MSCI world equity index gained 0.4% while oil halted its longest losing streak since December.

At 0730 a.m. EST, Dow E-minis were up 202 points, or 0.64% and S&P 500 E-minis were up 21.5 points, or 0.56%. Small caps were sharply higher with Russell 2000 futures up 1.1% while Nasdaq 100 E-minis were up 86.5 points, or 0.65% as a swift global roll out of vaccines and a new round of stimulus bolstered bets on a quick economic rebound, with investors also focusing on private employment and service sector reports.  Bank of America, Goldman Sachs and Morgan Stanley were up between 1.2% and 1.7% in trading before the bell.


VIX futures declined to 22.45 in the overnight session, making a 76% retracement and may have completed its correction pattern.  A breakout above the Cycle Top resistance at 34.62 confirms that Wave (3) is in progress.


USD futures are consolidating after yesterday’s gains.   The next move will be very painful for dollar shorts as it breaks out to a new high.  The Cycles Model suggests unusually high trendline strength today in the USD which may be a result of short covering.


Gold futures are being hit hard as the decline approaches round number support at 1700.00.  Trend strength may grow as the decline may break down even further through the weekend.  The Cycles Model suggests three more weeks of decline, profoundly disappointing the gold bugs.

SchiffGold opines, “Gold and silver continue to struggle with significant selling pressure. Last Friday, gold dropped some $40 as bond yields rose yet again. There continues to be this expectation that rising inflation and economic growth are going to force the Fed’s hand and cause it to pivot to tighter monetary policy sooner than expected. But in his podcast, Peter Schiff reminds us that inflation is not a threat to gold. And he says anybody betting against the yellow metal and on the dollar is going to lose.”


TNX resumed its rally as futures hit a high of 14.74.  The final probe higher may peak between Thursday and Monday in an extended Master Cycle.  No one is expecting this to happen.

Investing comments, “(Bloomberg) — President Joe Biden’s $1.9 trillion relief plan, plus the prospect of more stimulus later this year, is setting the stage for a shift away from historically low Treasury yields that’s likely to lead to a pickup in volatility in currency markets.

U.S. yields have marched higher even before the plan’s arrival — offering an inkling of what may be in store. BlackRock Inc (NYSE:BLK). sees as much as $2.8 trillion in additional fiscal spending this year and the risk of a further rise in long-term rates. BNY Mellon’s John Velis says a 2% 10-year Treasury yield is possible by April as part of a “tantrum without the taper” of Federal Reserve bond purchases. And volatility in currencies is so low that it’s all but certain to go up, says Harley Bassman, creator of a widely watched gauge of Treasury-market movements.”


Posted in Published | Comments Off on March 3, 2021

March 2, 2021

10:51 am

NDX is approaching its 50-day Moving Average at 13106.17.  A cross beneath it would produce a powerful (confirmed) sell signal.  The 1987 crash had both a Head & Shoulders and Cup with Handle formations.  Both were met in 4.3 days.

RealInvestmentAdvice observes, “As I worked through this past weekend’s newsletter, I noticed that multiple markets are starting to exhibit topping patterns. It will be crucial for markets to reverse these patterns in the short-term if the bullish advance continues.

As we discussed with our RIAPRO.NET subscribers yesterday:

“The good news is that the S&P 500 held its 50-dma during its recent selloff. With the market getting back to more oversold levels, we are likely to see a counter-trend rally for a few days that could get us back above the 20-dma. It will be necessary for the rally to set new highs to negate the “head and shoulders” pattern. If the market rallies, fails, and breaks the neckline, we could well see a deeper correction ensue.”

Topping Patterns, Technically Speaking: Topping Patterns Popping Up Everywhere


10:42 am

SPX has loosed itself from Short-term support at 3896.39 ands is heading for mid-Cycle (intermediate-term) support at3857.01.  Options turn bearish  beneath that level.  This is an aggressive sell for those who have covered.  Support at the trendline at 3810.00 and the 50-day Moving Average at 3804.56 may trigger a barrage of selling.  Trend strength is starting to build and may peal on Friday.

ZeroHedge remarks, “Back in mid-December, when stocks were melting up furiously daily amid unprecedented retail euphoria, which would only get crazier and crazier until eventually it forced Citi to use a bigger chart two months later to capture the market’s retail euphoria…

… we reported that Bank of America’s first proprietary sell signal since February 2020 was triggered:

According to BofA., equity “barbell” strategies all the rage while (the few remaining) bears note cash levels fall to 4.0%, triggering an FMS Cash Rule “sell signal”; The last time the sell signal was triggered was in February 2020 – everyone knows what happened next.”


9:42 am

The S&P Ag Index is replacing DBA as there were anomalies in DBA (an ETF) that did not agree with the Index.  The Master Cycle (shown in red) may not be complete, and may terminate at the potential low being made in Wave (C).  GKX has been on a steady rise since last April with the high at 397.74 being a perfect 8.6 months from the April low.  Wave (B) has extended on trending strength, as they are wont in a momentum move.  Wave (C) is targeted for the bottom shown at Wave (A).  The Current Master Cycle is due to end at the low toward the end of next week.

ZeroHedge reports, “Food prices are undeniably soaring faster than inflation and incomes around the world. As everyone’s favorite permabear, SocGen’s Albert Edwards, who, unlike Goldman, has already sounded the alarm on rising food inflation.

As a reminder, the Food and Agriculture Organization’s Food Price Index surged to a seventh consecutive month in December.

With the FAO food index rapidly rising, Edwards noted that “annual inflation in cereals reached 20%, the highest annual rise since mid-2011 when the Arab Spring was in full flow!.”


8:00 am

Good Morning!

As improbable as it seems, what the SPX has demonstrated is a probable expanding Leading Diagonal.  The Cup with Handle formation is the dominant formation with a high probability of a massive decline.  While there are alternate structures to be considered, the Leading Diagonal is the most bearish and corresponds closely with the structure in the NDX>

SPX futures have weakened, testing Short-term support at 3855.69.  Should the Crash scenario be in place, the crash may be starting at the 3:00 pm high.  The strongest part of the decline is expected to be on Friday, according to the Cycles Model.

ZeroHedge reports, “Lately not a session seems to pass without some “exciting”, unexpected event forcing momentum to reverse course, and sure enough following the best day for US stocks since June, overnight futures dropped after China’s top banking regulator said he’s “very worried” about risks emerging from bubbles in global financial markets and the nation’s property sector, sparking fresh concerns about further tightening in the world’s second-biggest economy and slamming risk assets.

Asia stocks immediately tumbled on Guo’s comments, with the MSCI Asia Pacific Index erasing earlier gains of as much as 0.8%. The CSI 300 Index in China fell as much as 1.4% and Hong Kong’s main gauge dropped almost 1%….

… while Chinese government bonds gained from a shift toward haven assets, sending yields on benchmark 10-year notes to a nearly three-week low.

US futures also dropped, reversing some of Monday’s gains…

… before recovering much of the loss. In notable premarket moves, Bank of America, Citigroup, JPMorgan, Wells Fargo and Morgan Stanley all dipped between 0.3% and 1.1%. Zoom Video jumped about 10% after the company forecast current-quarter revenue above estimates, as it expects millions of people to continue using its video-conferencing platform. GameStop and other “meme” stocks AMC Entertainment and Koss shed about 1% and 4.4% after a sharp surge on Monday with no apparent news on the shares.


NDX futures slid toward the 50-day Moving Average at 13098.70, but partially recovered.  It has formed a perfectly structured Primary Wave [1]-[2] that may have terminated near the top of Wave (4), a normal retracement for a Cycle Wave I of Super Cycle Wave (c).


VIX futures appears to be consolidating within yesterday’s trading range.  We look for the VIX to close above its 50-day Moving Average at 23.34 to begin Intermediate Wave (3) of Primary Wave [C].  The probability of matching or exceeding the high of March 2020 is very high.


TNX appears to be steady today, if not slightly higher in the futures.  The Cycles Model implies growing strength of trend through early next week.  This may be the spark to set off the powder keg in equities.

ZeroHedge observes, “The housing boom unleashed by the Federal Reserve during the pandemic was built on historically low mortgage rates (thanks Powell), low inventory, city-dwellers moving to rural areas, and remote-work phenomenon. In all, housing prices in 20 U.S. cities surged in December at the fastest pace since 2014 as mortgage rates fell to record lows. But a new rate regime is in town, one where bond traders are pricing in inflation as they believe the vaccine rollout and stimulus will lead to a sizzling economic recovery, one that could force the Fed to hike rates earlier (and more aggressively) than expected…

…all of which has resulted in the latest treasury and mortgage bond rout.

If you called up your mortgage lender last week for a 30-year fixed loan, the rate was around 2.81% – this week, the rate jumped to 3.06% on Friday, the highest since August. Rates have been increasing since hitting a record low of 2.65% in early January.”

This morning ZeroHedge further comments, “U.S. 30-year mortgage rates have rebounded sharply since two weeks with the 30-year treasury yields spiking above 2.25% on Thursday (highest since January 2020). The recent shock to the Fannie Mae 30-year mortgage — used as a benchmark for U.S. home loans — was meaningful. On a 5-day basis, outside of one time during the Covid crisis last spring, it was the biggest percentage rise in mortgage rates on record.

Despite the latest report from Freddie Mac suggests that 30-year mortgage rates were still at 2.97% (highest since August 2020), it seems that reality is a bit different.”


USD futures hit a new high at 91.39, pushed higher by the specter of rising rates.  Last Thursday’s Master Cycle low at 89.68 now appears to be locked in, with the USD rising through mid-April.  The rising USD has not reached recognition status  yet.  A breakout above the previous high at 91.61 may finally gain the recognition the rising dollar deserves along with the increasing pain leading to short covering.


Gold futures have bounced off the Cycle Bottom support at 1720.00 to 1734.35 in overnight trading.  However, the decline is not due to end until the week following options and futures expiration.  This move is the biggest argument against a new super Cycle bull market in commodities.  The other commodities may soon follow.


Posted in Published | Comments Off on March 2, 2021

March 1, 2021

8:00 am

Good Morning!

SPX futures have challenged the mid-Cycle (Intermediate-term) resistance at 3852.74 this morning.  This bounce may be Minute Wave (c) of Minor Wave 2.  The 50% Fibonacci retracement of Wave 1 is at 3859.09.  The 61.8% Fib retracement is at 3875.51.  Should this bounce meet or exceed Friday’s retracement high at 3861.08, the countdown for the crash scenario starts here.  As mentioned last week, a crash scenario takes at least 4.3 days.  The trigger for that scenario appears to be the Lip of the Cup with Handle formation.

ZeroHedge reports, “After last week’s global bond rout, central banks weren’t taking any chances, and as soon as the overnight session started yields plunged first in Australia and then everywhere else after the RBA doubled the amount of daily QE to enforces its YCC, sending 10Y Australian bond yields plunging by as much as 32bps, the biggest drop since last March. Other joined in verbally, with the ECB saying said it will not tolerate higher yields even though the Fed has for now said it sees little cause for concern in the rapid run up (BofA disagrees and expects Powell to calm markets as soon as this week). Meanwhile, a barrage of sellside reports over the weekend, sought to reassure investors about the risk of a breakout in inflation, with the likes of JPM and Goldman all saying that fears of a rapid increase in consumer prices are overblown (although in case they aren’t, Goldman conveniently provided a list of companies that will be hammered if yields continue to rise).

In any case, S&P500 futures jumped more than 1% on Monday thanks to the stabilization in bond yields and as Johnson & Johnson’s newly approved COVID-19 vaccine and progress in a new $1.9 trillion coronavirus relief package fueled optimism over a swift economic recovery. At 07:30 a.m. ET, Dow E-minis were up 297 points, or 0.954% and S&P 500 E-minis were up 40.00 points, or 1.05%. Nasdaq 100 E-minis were up 167.50 points, or 1.29%

The risk advance was broad, with stocks tied to economic reopenings and faster growth notching some of the biggest gains. Futures on the small-cap Russell 2000 Index outperformed the Nasdaq 100 Index.”


NDX futures are coming off a high of 13132.38 this morning and have fallen beneath the 50-day Moving Average.  Don’t let this bounce fool you.  The only support left is the neckline/Lip of the Cup with Handle formation with dire consequences when the NDX declines beneath them.

ZeroHedge observes, “In today’s equity update we are following up on our analysis of the Tesla-Bitcoin-Ark risk cluster showing an updated positions analysis, cross-correlations in the flagship Ark Innovation ETF, and an drawdown analysis. Yesterday, was another bad session for this risk cluster and Ark Invest had a day with outflows across all their ETFs highlighting that risk sentiment has changed. With the founder’s bold move to increase the position in Tesla during the week the risk has gone up that this risk cluster could turn into an ugly forced selling dynamic causing pain in not only Tesla, Bitcoin, and Ark funds, but also US biotechnology stocks where Ark Invest is a major holder with high ownership in selected names.

A little over a month ago we first flagged the Tesla-Bitcoin-Ark risk cluster as something to take note off as short-term correlation between Tesla and Bitcoin was shooting up. A survey from Charles Schwab also confirmed our suspicion that there is a big overlap as these two instruments are among the top five holdings by millennials. Our analysis quickly led us to Ark Invest with its famous Ark Innovation ETF which had a big position in Tesla and its charismatic founder Cathie Wood is a big believer in the so-called disruptive innovation culture of Silicon Valley. This class of people believe firmly in technology as mainly good for society in all its aspects and that Bitcoin is a protection against future wealth confiscation which is most likely inevitable due to historically high wealth inequality.”


VIX futures made an overnight low of 24.74, making a 58% retracement of its Wave (1) off the Master Cycle low.  his would be expected, as Intermediate Wave (3) of Primary Wave [C] of Cycle Wave III portends a crash may be developing.  Cycle trending strength appears to be highest on Friday, which supports the 4.3-day crash scenario starting today.


TNX is lower this morning, but while today is day 269 in the Master Cycle (suggesting last week’s high may have been the top), the Wave structure may be deficient, leaving room for another probe higher this week.  The outside limits of the Master Cycle is plus or minus 17.2 days (241 to 275).  There are multiple reasons for this:

  • The first is that, contrary to my expectation of a 10-year Treasury auction last week, the next scheduled auction is on March 4.  Remember, last week’s 7-year auction was a disaster, causing the rate spike on Thursday.
  • The FOMC meets this week, leaving a news blackout until Wednesday.
  • CTAs and hedge funds are still liquidating their bonds while foreign investors have been staying away.

ZeroHedge observes, “It was just last Tuesday when he presented our readers with the latest observations from JPM quant Nicholas Panaigrtzoglou, who warned that the rapid rise in bond-equity correlations…

… was bringing memories of previous violent bond tantrum episodes, including Bernanke’s famous Taper Tantrum from May-June 2013, the Bill Gross-inspired Bund tantrum of May-June 2015, the period into the US election Oct-Nov 2016, Feb 2018 and Q4 2018. All of those ended with pain for both bond and equity longs, and certainly risk parity and 60/40 balanced funds who were crushed on both long legs.

Well, just two days later this warning was realized as we saw a surge in bond volatility as global bond prices plunged and yields soared as the latest inflation scare finally came to the fore (catalyzed by the catastrophic 7Y auction which sparked massive liquidation volumes across the curve).”


USD futures have hit a new high from its Master Cycle low at 89.68.  Most investors are apparently ignoring this move and may not recognize a (short-term) change in trend until the USD rises above 91.61.  The Cycles Model suggests the rally may extend until mid-April.  Thus, the normal target at mid-Cycle resistance at 92.94 may be exceeded.  A possibility may be a rally to the Cycle Top resistance, currently at 97.39.


After a brief rebound from Friday’s surprise reversal, WTI futures have turned back down.  The decline should be no surprise, as Friday was day 256 in the Master Cycle.  The Cycles Model indicates that, should the decline get underway, we may see it continue up to six weeks through early April.  After weeks of declarations of a new Super Cycle bull market in oil, the hedgies and CTSs are jumping in with both feet.

ZeroHedge remarks, “Two weeks ago when the world was still transfixed by the rolling squeezes of the most shorted stocks triggered by the WallStreetBets subreddit, we reported that JPMorgan said to ignore the spectacle du jour in the illiquid, left-for-dead smallcaps, and instead focus on what was coming: a coming massive, marketwide squeeze as quant, momentum and other systematic investors soon start covering what is a historic short across the energy sector. Importantly, JPM also gave us the timing of said squeeze: early March.

Fast forward to today when various funds have naturally frontrun what is expected to be a massive market move. Yes, the systematic short squeeze that JPM’s Kolanovic wrote about two weeks ago, has started and as Rabobank’s Ryan Fitzmaurice wrote, “the one-year rolling momentum signal for Brent flipped from bearish to bullish this week, effectively leaving systematic traders “all-in” with respect to their directional oil market bias.”


Posted in Published | Comments Off on March 1, 2021

February 26, 2021

7:30 am

I will be out most of the day, so I have given as comprehensive account as I can for what may transpire.  Be prepared!

Good Morning!

NDX futures are flat this morning after having bounced off the Head & Shoulders neckline.  The probability of a crash scenario is very high, and becomes certain once the NDX declines beneath 12750.00.  So let’s review what the Cycles may offer us.

First, a crash takes a minimum of 4.3 days.  The time would be measured from the top of Wave 2 at 13312.40, so one day has elapsed thus far.  That gives a minimum time to the bottom at Wednesday morning.  However, the decline and correction from the top at 13879.80 took exactly 6.45 days, (1.5 Cycles).  That suggests a possible 6.45 day decline from the top of Wave 2, indicating a possible bottom at mid-day on Friday.  We will have to monitor the situation as it develops.


SPX futures also remain flat.  SPX has not (yet) crossed the 50-day Moving Average at 3798.76.  It also must decline beneath the massive Orthodox Broadening Top trendline.at 3750.00.  Once accomplished, point 6 awaits at 2100.00.  Should the Broadening formation be valid, that target appears to be the minimum for this move.

ZeroHedge reports, “Global bond yields slid on Friday following Thursday’s epic meltdown as markets returned to firmer footing at the end of a week that saw the biggest decline in the Nasdaq 100 since the pandemic meltdown. Meanwhile, the quant who predicted this week’s meltdown in both bonds and stocks, turned bullish overnight (more in a separate post) a further indication the liquidation may be ending.

US futures found support around 3,800 and have since rebounded, as global markets stabilized after central banks from Asia to Europe moved to calm a panic that had sent US government bond yields to their highest level in a year and triggered a loss of almost $900 billion in the value of the tech-heavy Nasdaq, the biggest since March.

Contracts on the Nasdaq 100 and S&P 500 fluctuated before turning modestly higher. Thursday’s rout in yields which sent the 10Y as high as 1.61% after a catastrophic 7Y auction, has reversed with broad-based buying across the curve, especially after central bankers stepped in with the usual jawboning to convince markets of their commitment to Yield Curve Control (as the alternative is simply unthinkable). The scale of the sell-off prompted Australia’s central bank to launch a surprise bond buying operation to try and staunch the bleeding. The ECB is monitoring the recent surge in government bond borrowing costs but will not try to control the yield curve, ECB chief economist Philip Lane told a Spanish newspaper.”


VIX futures are lower, but remained above the mid-Cycle support at 25.98.  There is no formation that gives a target, other than the prior high from last March.  Past experience would suggest the top of Wave (1) may terminate near 85.00.

ZeroHedge observes, “Following a series of warnings that risk parity funds may be on the verge of capitulation and deleveraging into the maelstrom of tumbling stocks and bonds…

… yesterday it was JPMorgan’s turn to join the chorus of warnings that the continued selloff in rates, coupled with the accelerating drop in tech/growth stocks would result in very unpleasant consequences for both risk parity and conventional 60/40 balanced funds.

In his report, JPM quant Nick Panigritzoglou looked that the recent surge in the bond-equity correlation (which is usually negative and “helps to contain the volatility of risk parity funds and balanced mutual funds”)…

… which he wrote was “raising concerns about de-risking by multi-asset investors, such as risk parity funds and balanced mutual funds.”


TNX futures are also flat, giving an eerie sense of calm to the markets.  However, it is not yet time to breathe easy.  I have marked yesterday’s high as the top of the current Master Cycle.  However, today the 10-year treasury auction is being held.  After yesterday’s disastrous 7-year treasury auction, things don’t look good for today’s outcome.

ZeroHedge reports, “This is as close to a failed auction as we have ever come…

Ahead of today’s closely watched 7Y treasury auction, where the bulk of the recent Treasury rout has been concentrated as traders hammered the belly of the curve, we said that “If the 7Y tails a lot, watch out below” as that would only add insult to today’s furious selloff injury. Well, that’s precisely what happened, because with the 7Y pricing at 1.195%, this was a whopping 4.1bps tail to the 1.151% When Issued.

The auction was, in a word, catastrophic. 

Starting at the top, the bid to cover tumbled from 2.305 to 2.045the lowest on record, and far, far below the 2.35 recent average.

But if that was ugly, the internals were even worse, with the Indirects plunging from 64.10% to just 38.06%, the lowest since 2014, as no foreigner suddenly wants to even smell US debt!”


Posted in Published | Comments Off on February 26, 2021

February 25, 2021

12:38 pm

NDX is on a sell signal and declining fast to its Head & Shoulder neckline.  Beneath that is confirmation of a 15% plunge from the top.  The 200-day Moving Average is at 11564.00.  The 2011 trendline lies at 8900.00.  Could they be met or exceeded by the end of April?

ZeroHedge observes, “‘Stonks’ are puking this morning (led by Nasdaq) since the cash markets opened.

And while most of the attention for the plunge has been focused on rate-velocity anxiety, we suspect there is another, even more powerful reason.

Starting at around 1500ET yesterday, the ‘old’ WallStreetBets ‘Short-Squeeze’ stocks exploded higher once again amid a major gamma squeeze in GME…”


12:24 pm

TNX is at a new 1-year high and roundly beat its Head & Shoulders target.  With all the hoopla from ZeroHedge, the reversal cannot be far away.  Base on today’s actions, the 10-year auction tomorrow may be a milestone.

 2:30 pm update  TNX hits a new high at 16.14.

ZeroHedge remarks, “Yesterday, when looking at the latest CTA positioning, we said that “CTAs Are The Most Short Treasurys Since 2018… And Getting Shorter” warning that we could see a massive flush if and when the 10Y broke above 1.50%. Well, one look at the 5Y future today and it looks like we were right.

Making matter worse, the CME today reported that its Ultra 10-Year Note and 30-Year Bond futures broke volume records on Feb. 23, as the U.S. Treasuries rout paused before resuming the next two days, meaning that real money is now also aggressively selling rates.”

2:45 pm

ZeroHedge reports, “This is as close to a failed auction as we have ever come…

Ahead of today’s closely watched 7Y treasury auction, where the bulk of the recent Treasury rout has been concentrated as traders hammered the belly of the curve, we said that “If the 7Y tails a lot, watch out below” as that would only add insult to today’s furious selloff injury. Well, that’s precisely what happened, because with the 7Y pricing at 1.195%, this was a whopping 4.1bps tail to the 1.151% When Issued.

The auction was, in a word, catastrophic. 

Starting at the top, the bid to cover tumbled from 2.305 to 2.045the lowest on record, and far, far below the 2.35 recent average.

But if that was ugly, the internals were even worse, with the Indirects plunging from 64.10% to just 38.06%, the lowest since 2014, as no foreigner suddenly wants to even smell US debt!”


12:08 pm

VIX is now above the 50-day Moving Average at 23.55.  This is considered an aggressive buy for the VIX (Sell the SPX).  Further confirmation lies at the mid-Cycle resistance at 25.95 and a breakout at 27.01.  These are your markers for considering your actions.  The Feb 23 high at 27.01 is a likely candidate for the end of the Master Cycle.  This is the first positive Cycle since October.  If this is the beginning of the uptrend, we may not see the  Master Cycle high until the end of April!


12:01 pm

SPX has just crossed beneath Short-term support at 3891.92.  Aggressive shorts may be considered at this time.  Further confirmation lies at mid-Cycle /Intermediate-term support at 3852.17.  3850 is where puts begin to outnumber calls which forces the dealers to go short to cover the gamma.  The trendline at 3805.59 may be considered the next hurdle to cross.

ZeroHedge remarks, “Did TINA just die?

The 10Y Treasury yield has soared back in line with the S&P 500 dividend yield for the first time since Jan 2020.

And for foreigners, Treasuries haven’t been this attractive since 2015…

So it appears ‘there is an alternative’ to record-expensive US stocks now?”


Good Morning!

I’m back in business after the horrible outage down it Texas.  I found out that it was where my server was.  Apparently the power failure corrupted not only my files but the backup program as well.  My website has been running for 20 years and many of the programs were patched as updates were applied.  The patches finally gave way under the stress.  I have relocated to a new and more powerful server and have restored the month of February.  The prior history may be gone.

SPX futures are down, but not under 3900.00, a critical level.  Since we are so near the end of the current Master Cycle, we may see it end on a high, given that the DJIA has just made a new all-time high.  The Master Cycle is scheduled to end by Monday, which would be day 259.

ZeroHedge reports, “It’s not just the surge in meme stocks that is a case of deja vu all over again: the big action this morning is in another closely watched asset – the 10Y – where yields have soared by almost 10bps, rising from 1.38% to a one-year high of 1.46%, rising just 4bps shy of the closely watched 1.50% level which Nomura predicts will spark an equity selloff.

“Inflationary signals, including a surge in commodity prices, are higher than we have seen in years,” said Geir Lode, head of global equities at the international business of Federated Hermes. “The prospect of a sooner-than-expected economic recovery has led to a surge in the U.S. 10-year yield.”

And amid fears that the stock rout will only get worse, Nasdaq futures fell 1% on Thursday, sliding for seven out of the last eight sessions, as investors rotated out of technology-related stocks…

… and into small cap and reflationary shares that will benefit from an economic rebound later in the year. The Russell 2000 index rallied and S&P500 eminis were modestly in the red. At 715 am ET, Dow e-minis were up 5 points, or 0.01%, S&P 500 e-minis were down 12.35 points, or 0.3%, and Nasdaq 100 e-minis were down 123.5 points, or 1%.”


NDX futures are down after being repelled at mid-Cycle and trendline resistance.

ZeroHedge comments, ”

We bought NASDAQ for the yields down logic…

The Market Ear Picture

…but what do you do when yields are up, and continue higher?

The rate of change in this rates move is violent, catching most by surprise. We are approaching 1.5%, a level that was not in many excel models only a few months ago.

NASDAQ has just woken up to the yields move. NASDAQ futs vs US 10 year inverted chart.”


TNX futures rose to 14.68, while the cash market rallied to 14.66 this morning.  The Price Target has finally been met on day 265 of the current Master Cycle.   Its now time for a reversal that is likely to retest the supports under it.

ZeroHedge observes, “A little over a month ago, on January 7 when looking at the technicals in the Treasury market and when the 10Y was trading at just over 1%, we warned that “it’s about to get ugly”…

… revealing that the key catalyst for further downside in rates would be when trend-following funds such as CTAs liquidated their long positions and flipped from long to short, an event which Nomura’s Masanari Takada said would take place when “10yr UST yields remained above 1.10%”…. which they clearly have in the past few weeks.”


VIX futures are off yesterday’s low, but haven’t broken through the 50-day Moving Average.  We may still see a volmageddon event, as the Wave count appears to be a perfect (1)-(2), 1-2.  This suggests an extended Wave 3 of (3) is due to follow.


USD futures made a new low at 89.69 this morning in day 260 of the current Master Cycle.  Stay tuned for a reversal to the mid-Cycle resistance or higher.


In the past week I had warned that the target for WTIC is 63.15.  This morning WTIC futures hit 63.79 on day 255 of the current Master Cycle.  A reversal may be imminent.  The calls for a new commodities super Cycle may be premature.

ZeroHedge remarks, “Amid all the issues ignited in the Texas turmoil, and as oil prices roar to post-COVID highs, analysts across the energy space appear to be outdoing each other with their bullish forecasts.

Source: Bloomberg

Brent Crude prices could hit $70 a barrel in the second quarter of 2021, while they are set to average $60 this year, Bank of America said this week, raising its average price outlook by $10 a barrel from its previous projection.”


Posted in Published | 1 Comment

February 23, 2021

February 23, 2021

8:00 am

Good Morning!

We should not be surprised to see NDX futures plummet beneath the 50-day Moving Average at 13048.35 this morning.  The NDX closed yesterday at the one-year uptrend line.  The break this morning closes out that chapter and opens a new one.  There are at least four more days left in the current Master Cycle.  A lot of damage may occur in those four more days.

ZeroHedge reports, “Global stocks, US equity futures and cryptocurrencies all tumbled on Tuesday as the recent surge in inflation, bond yields and commodity prices continued to hammer technology shares while investors awaited fresh reassurance from U.S. Federal Reserve Chair Jerome Powell on the path for monetary policy in United States.

The MSCI world equity index fell 0.1% to fresh two-week lows, having earlier risen on gains in commodity-heavy equity indexes in Asia. After rising during the Asian session, S&P 500 futures also fell once Europen came online, and were last down 0.4%.

Nasdaq futures tumbled as much as 2%, and were last down 1.4% a day after the tech-heavy gauge posted its longest losing streak in four months. Heavyweight tech stocks slid premarket, with Apple -2.7%, Amazon -2.4%, Tesla -7.5%, Alphabet -1.6%. Tesla crashed 6% in pre-market trading, sliding below the $695 level at which it entered the S&P500.  Tesla shares were set to plunge into the red for the year, hit by a fall of bitcoin, in which the electric carmaker recently invested $1.5 billion.”


SPX futures gapped down to test the 2-hour mid-Cycle (Intermediate-term) support.  The damage is not yet as severe as the NDX.  However, it may have entered negative gamma territory where the downside momentum is sure to pick up.  The leveraged bullishness is at an extreme, but may soon evaporate as the decline gathers strength.

ZeroHedge reports, “While the S&P has been weaker since Friday’s opex, Nasdaq is the “messiest” due to the index-level price-movement “unclenching” based upon the sheer amount of $Gamma running-off post last Friday’s Op-Ex.

As Nomura’s Charlie McElligott notes, the effect was particularly notable in Nasdaq with QQQ experiencing over 50% drop in aggregate $Gamma, which meant that the prior Dealer hedging barriers have also collapsed and are no-longer providing insulation.”


VIX futures tested mid-Cycle resistance at 26.03 in the overnight market after closing at the 50-day Moving Average at 23.45 yesterday.  VIX may be at the cusp of an explosive move in the next week.  Last week’s options expiration dropped the largest short-vol options and futures volume in recent times.  This may be reminiscent of the volmageddon event that happened in February 2018.


TNX futures hit an overnight high of 13.82.  However, this morning’s open only registers at 13.70 thus far.  Today is day 263 in the Master Cycle, a bit longer than the average but still within the Cycle turn window.  You may often see me discuss time and price.  It is rare when both targets (if known) are not met.

Investing comments, “The reflation and inflation meme tightened their grip on the markets. Interest rates have risen, and curves have steepened. Two events occurred around the same time in early November that sent a similar signal: the US election with prospects for significantly more stimulus and a vaccine’s availability. Since the US election and the announcement of a vaccine in early November, the 10-year US break-even has risen from about 165 bp to over 225 bp, before finished the week near 2.15%. accounting for the nearly 50 bp increase in the nominal 10-year yield.”


USD futures have risen to test the trendline at 90.44 after making a low of 89.99.  Today is day 258 of the current Master Cycle, leaving the probability of a Master Cycle low yesterday.  If so, we may see the USD rally to the Cycle Top resistance by mid-April.  I am monitoring the USD moves to determine if that may be correct.


Crude oil futures hit an overnight high at 62.99, nominally testing the monthly mid-Cycle resistance at 63.14 mentioned yesterday.  Today is day 253 of the current Master Cycle, a bit early, but within the window for a reversal, having met time and price targets.

Investing comments, “WTI crude oil traded higher yesterday and continued marching north today as well, breaking above last Thursday’s high of 62.20, thereby confirming a forthcoming higher high. However, did not move much higher and pulled back to settle near that barrier. Overall, the black liquid trades well above the upside support line drawn from the low of January 4th, and thus, we would consider the near-term outlook to be positive.”

Posted in Published | 1 Comment