March 26, 2021

2:34 pm

VIX appears to be on the rebound after making a new low  at 18.68 on its Trading Cycle.  This was unexpected and caused me to rethink the Cycles structure.  While today’s low may be the basis for a new Master Cycle pattern, the Cycles Model is not so clear.  The high on March 4 was on day 262 of the Master Cycle.  It appears that I will have to stick with it until further evidence tells me otherwise.  In the meantime, the Cycles Model shows strength beginning in early April and continuing through mid-May.


2:18 pm

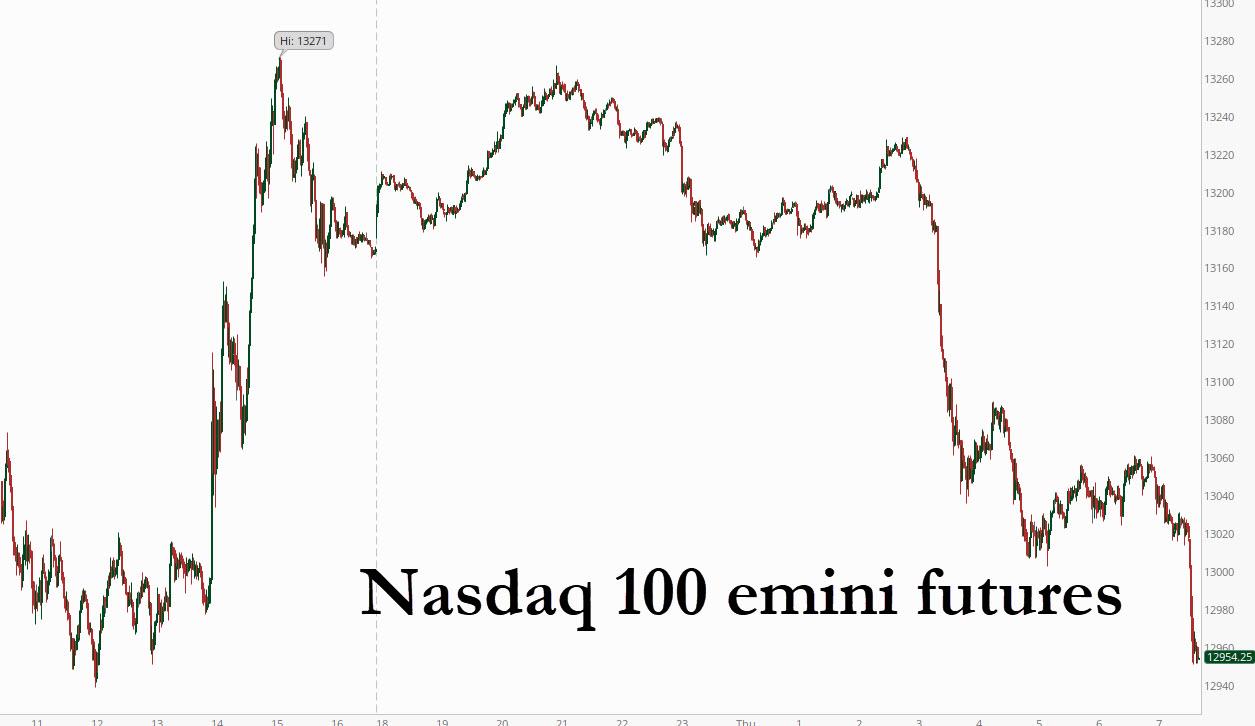
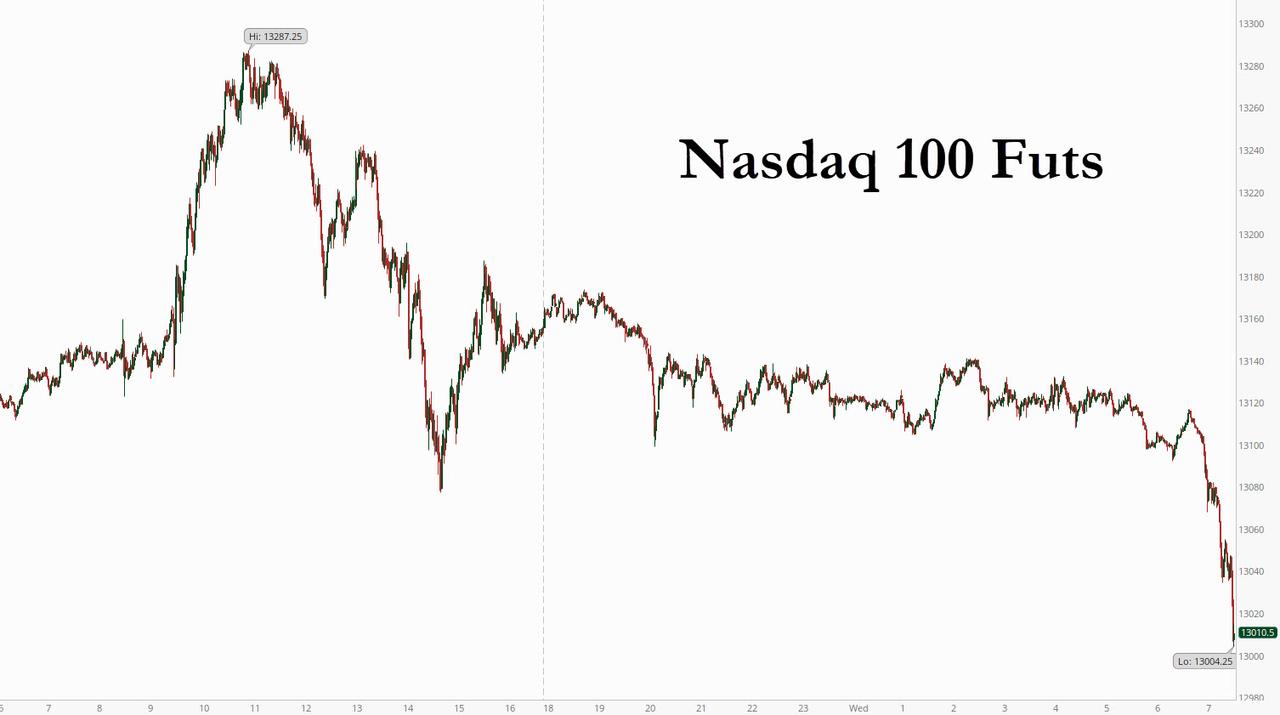
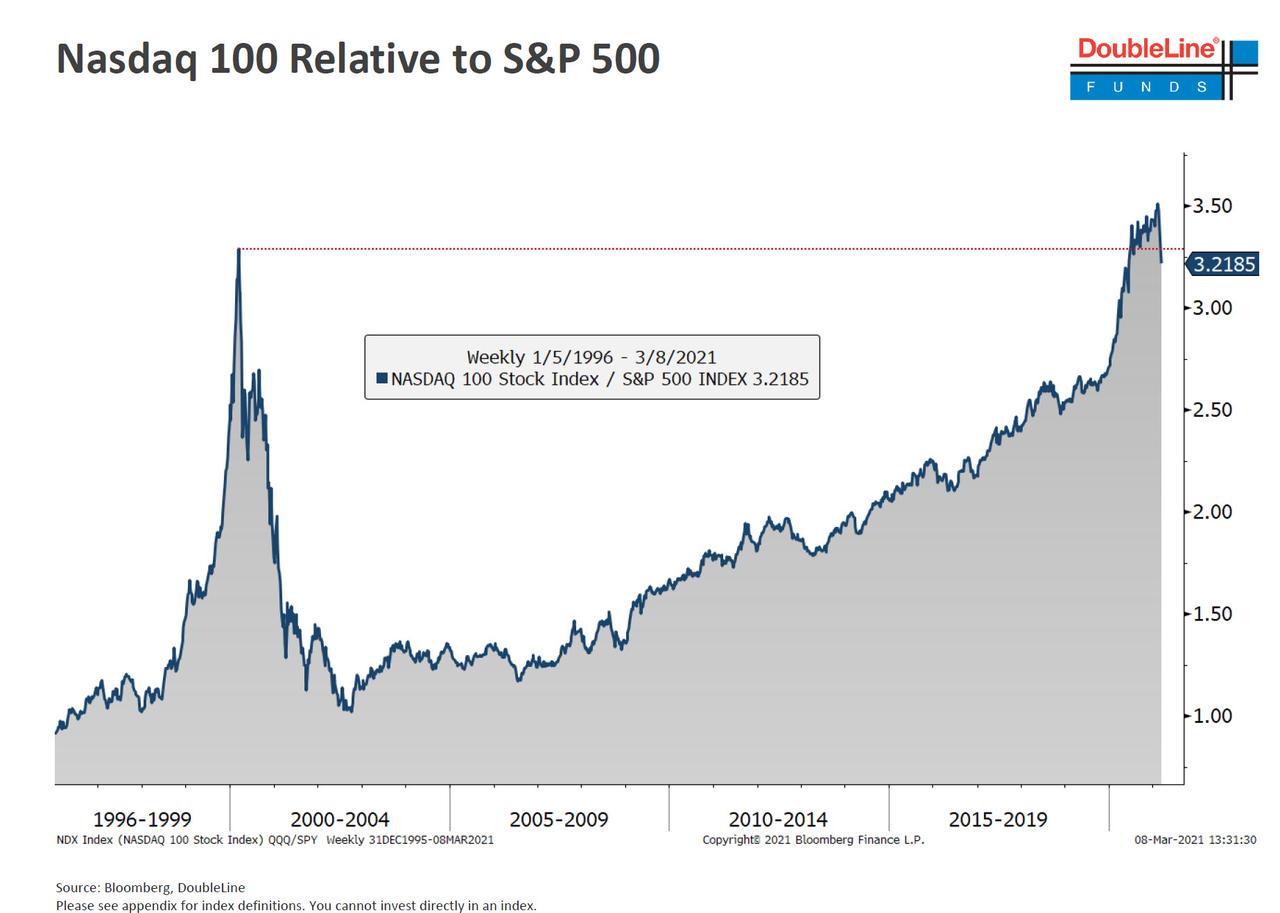
NDX remains on its sell signal after being repulsed at Short-term resistance at 12866.05.  It appears to be read to cross the Lip of its Cup with Handle, setting a course for its long-term trendline just above 7500.00.  Should this take place, the rest of the market will follow.

ZeroHedge observes, “Something odd is going on.

During today’s US session we noticed an unusual number of large block trade headlines.

  • Shopify – SHOP 762k @ $1,000
  • FarFetch – FTCH 26mm @ $45

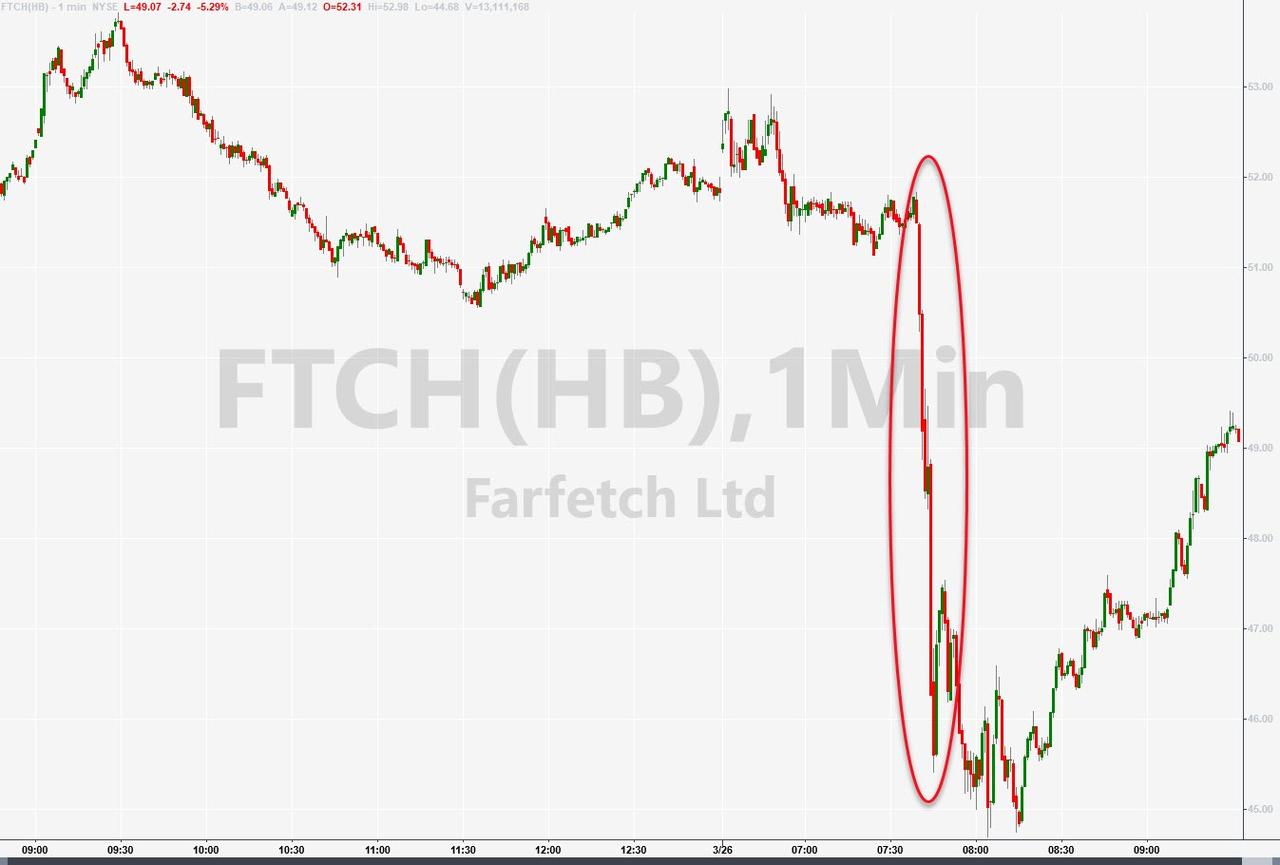
  • Discovery – DISCA 16mm @ $45-50, DISCK 32mm @ $40-44″


8:15 am

Good Morning!

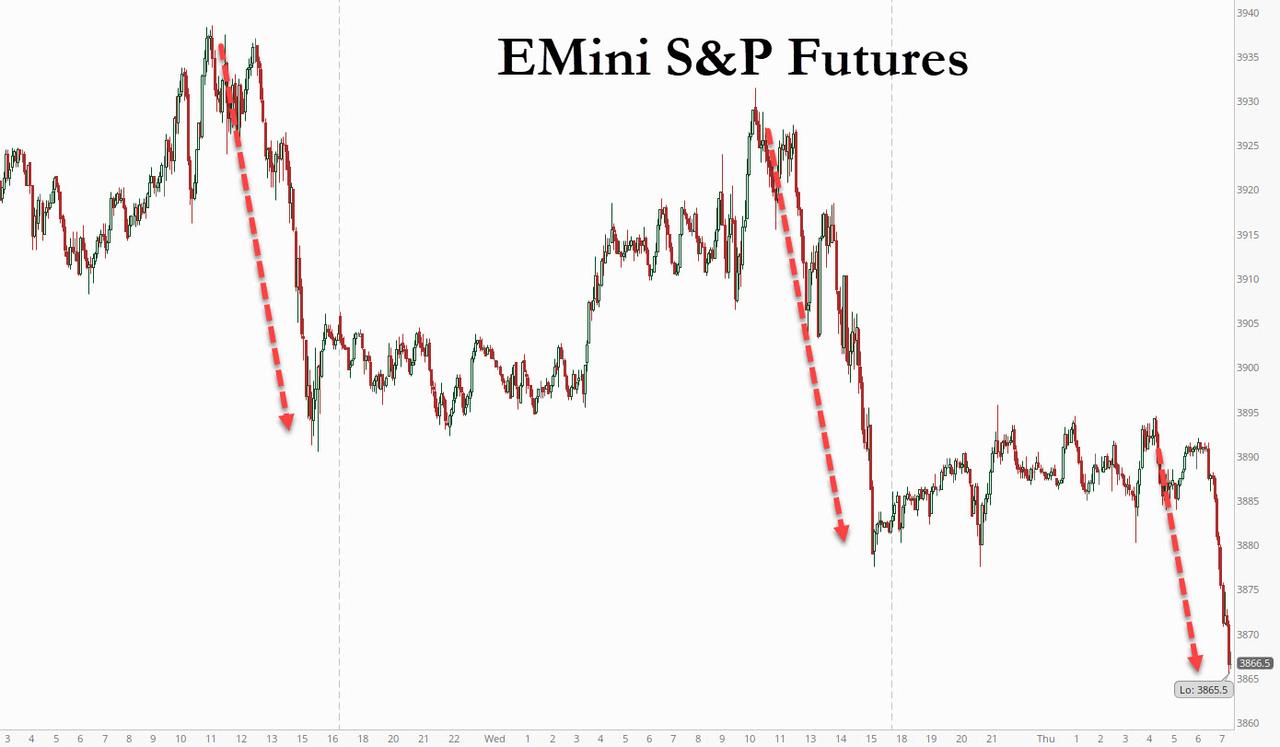
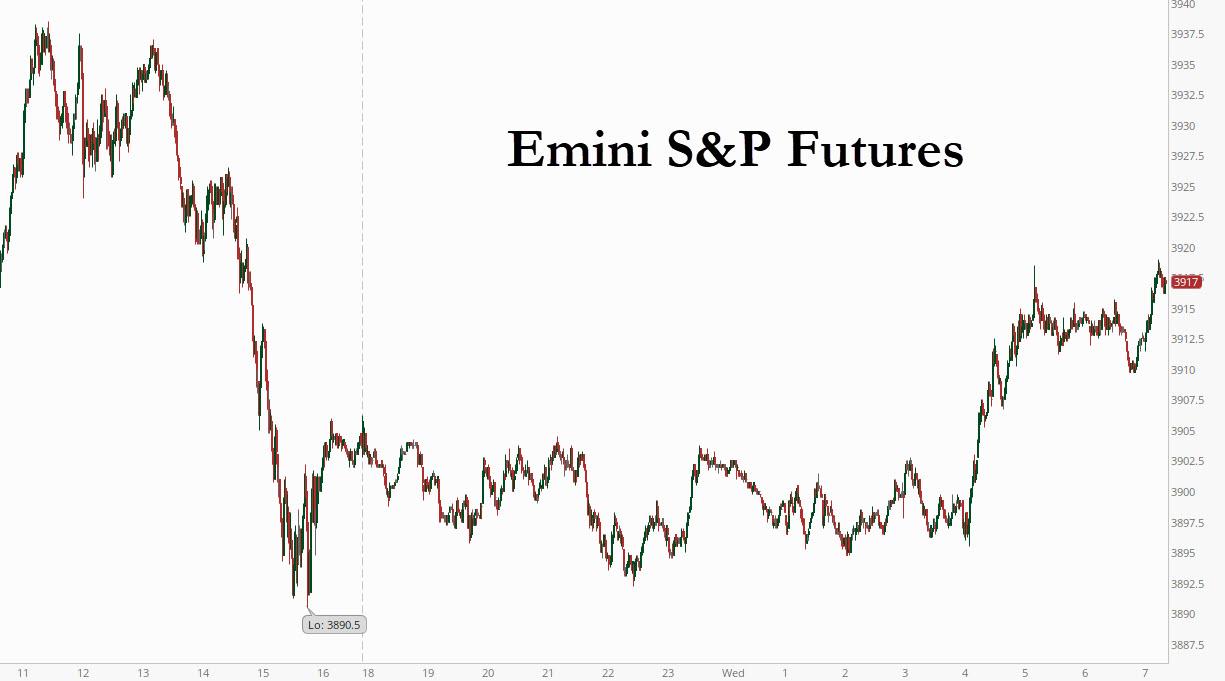
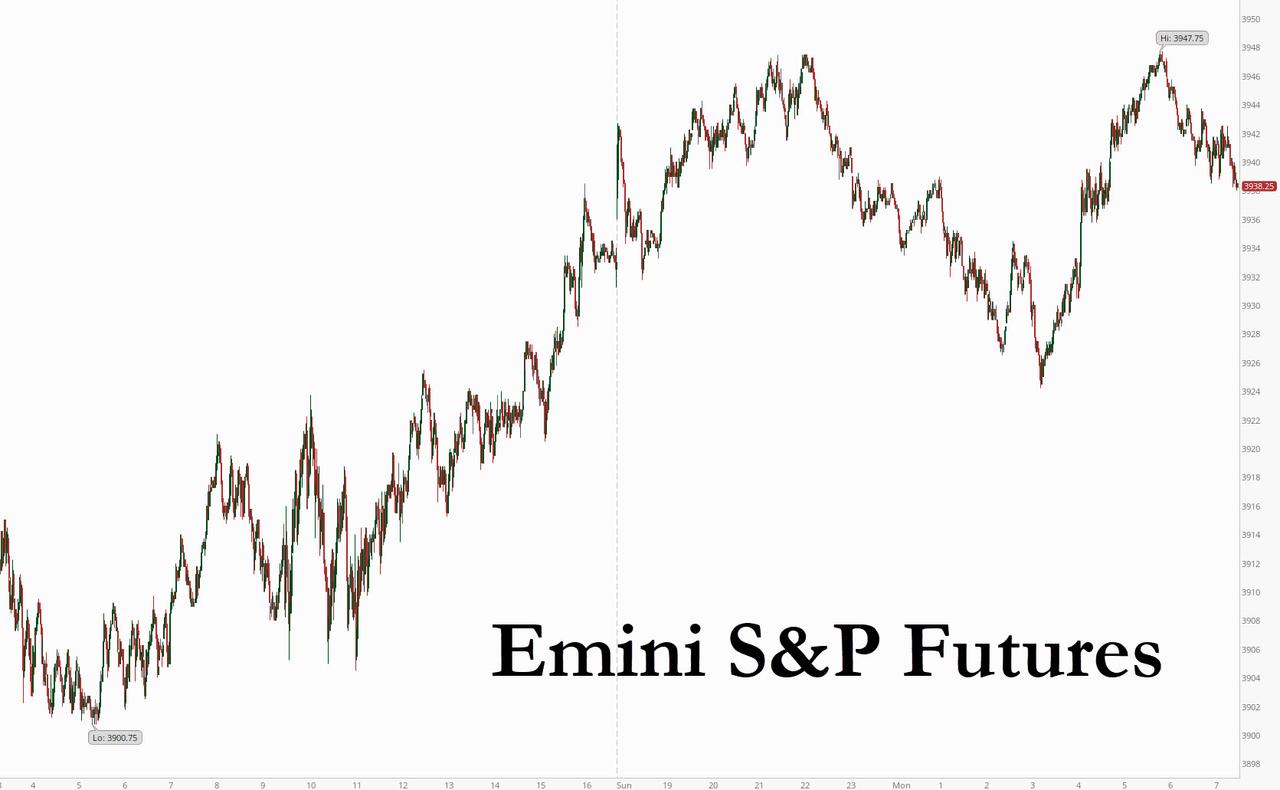
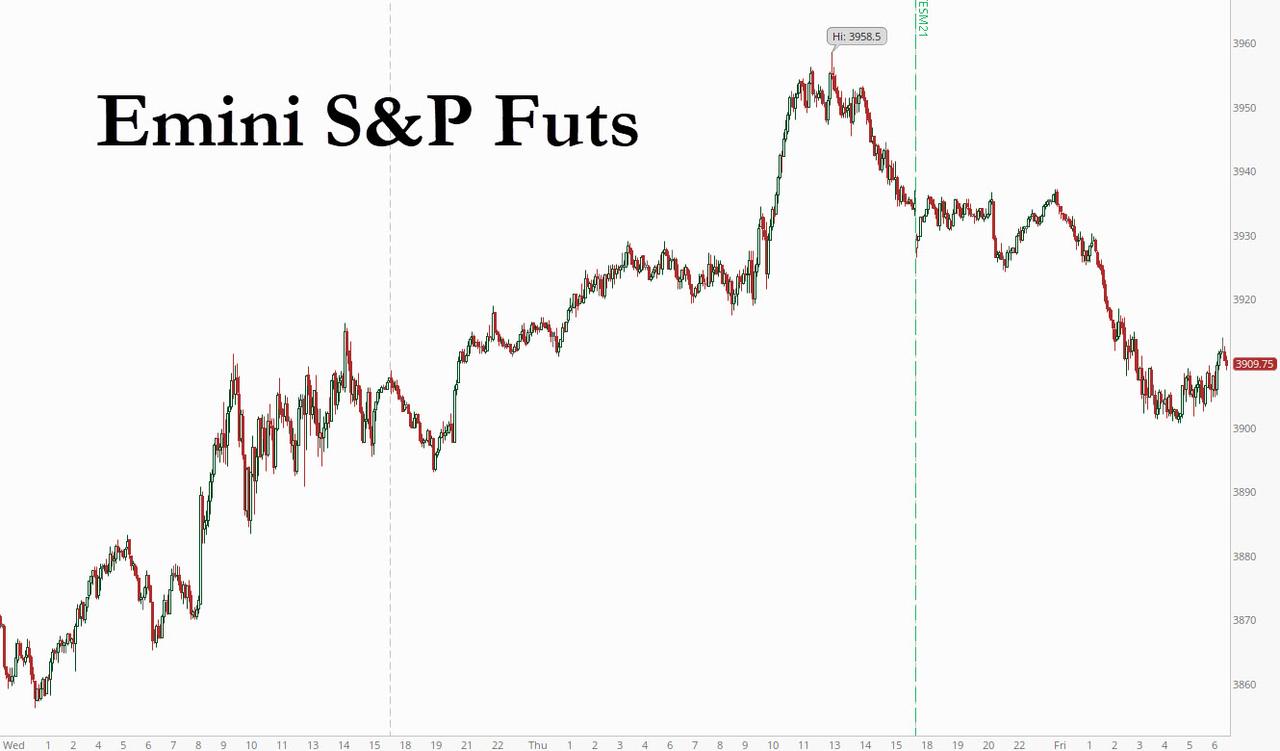
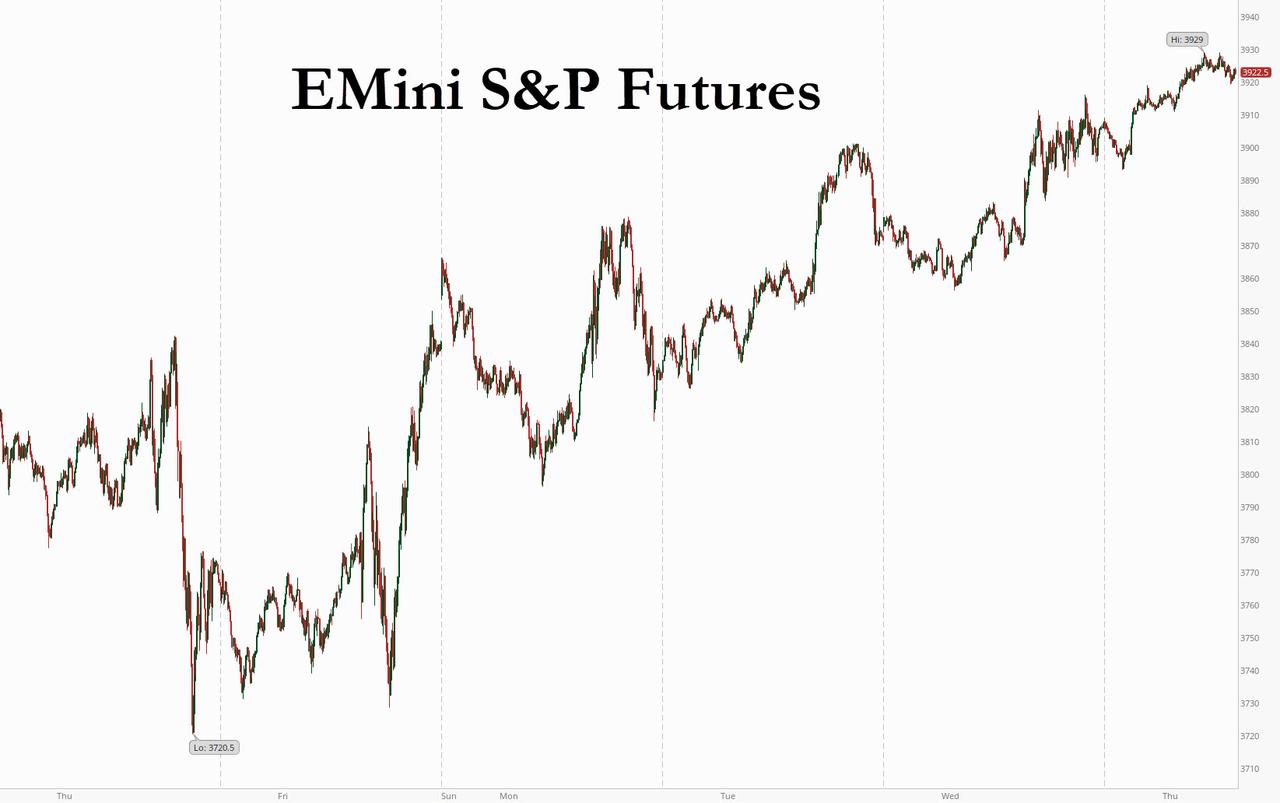
SPX futures were as high as 3921.38 this morning before fading lower.  The Elliott Wave Model suggests a brief surge at the open to 3935.00, if it can achieve it.    The Cycles Model suggests a breakdown may be in order.  The question is how fast the SPX may tumble beneath all the supports that have held it thus far.

ZeroHedge reports, “US equity futures and global markets rose this morning, continuing yesterday’s torrid late day surge, as investors looked past supply chain disruptions and focused on the optimistic targets for vaccinations and economic re-openings, after Joe Biden doubled the goal for his vaccination drive even though Covid-19 cases keep rising, and the Federal Reserve freed banks from pandemic restrictions on dividends. Oil rebounded and pushed Treasury yields higher, prompting investors to buy undervalued energy and bank stocks ahead of what is expected to be the fastest economic growth since 1984. Investors awaited key income, spending and inflation data later in the day.”


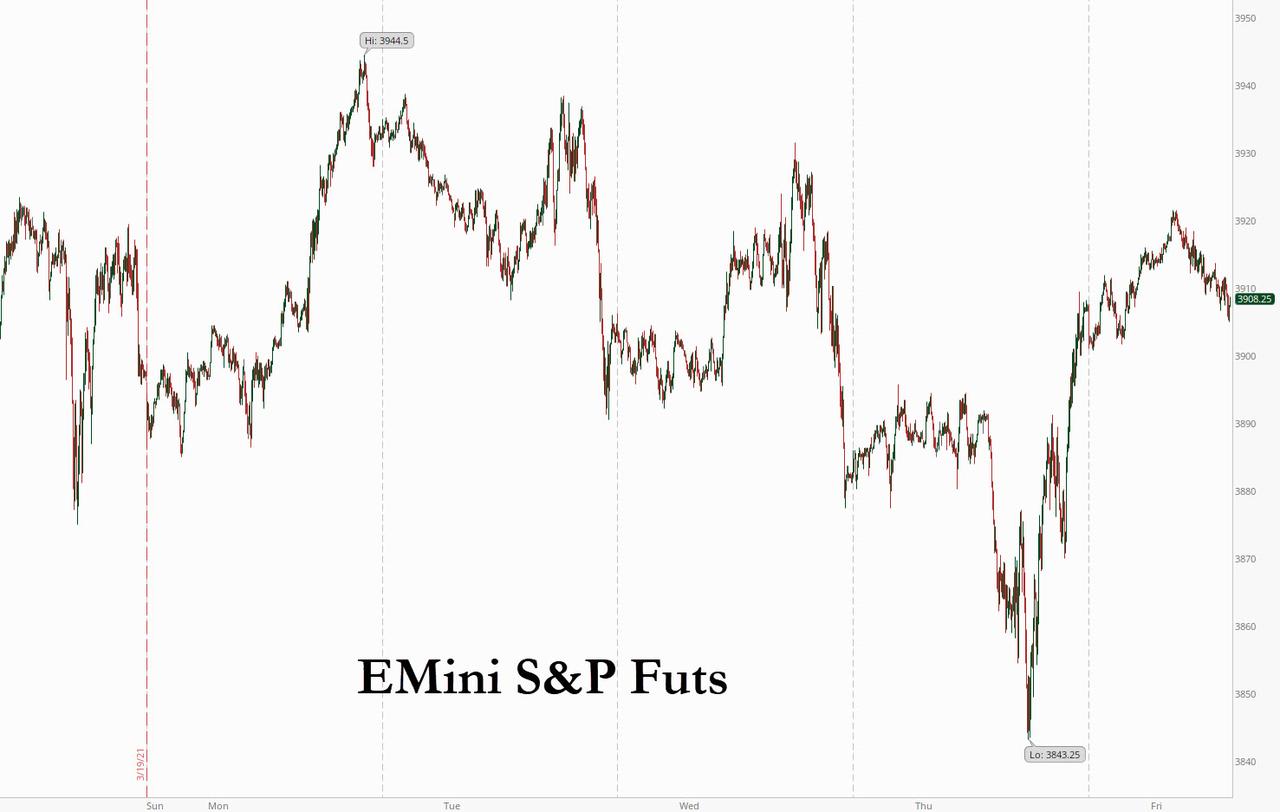
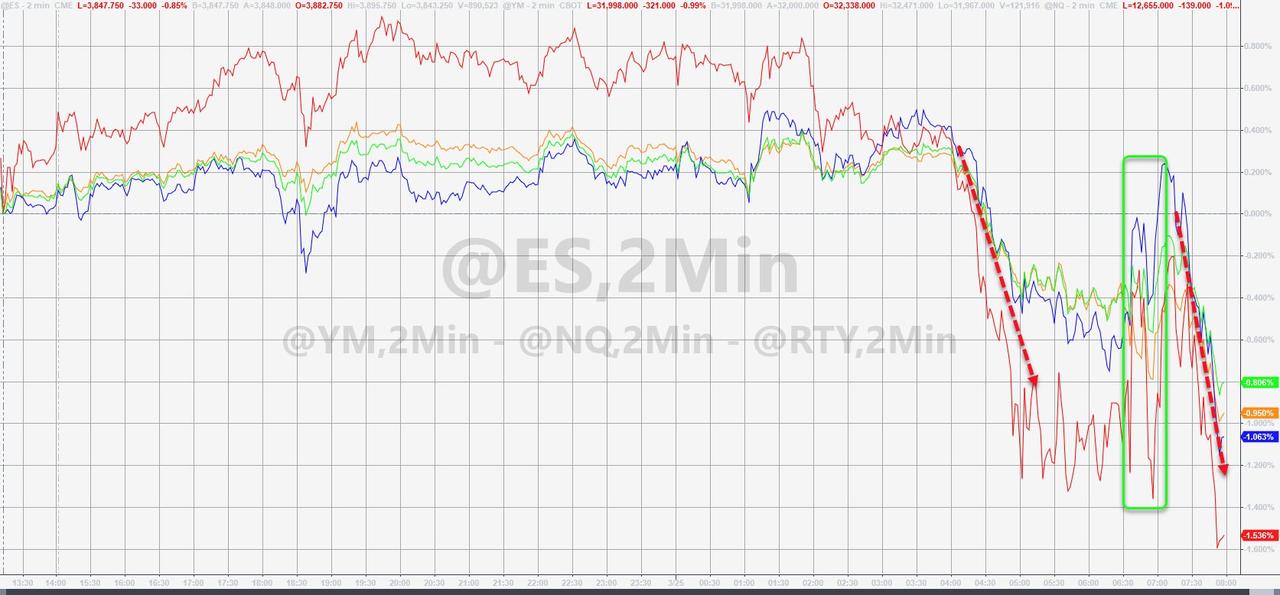
NDX futures rose to 12880.00 in the overnight session before plunging into the red as the morning wore on.  It is currently challenging the Lip of the Cup with Handle formation at 12700.00.

The following may explain why the stimulus checks may not end up in the market. ZeroHedge reports, “After the extreme surge in income and spending in January (as government handouts gushed across the nation), analysts expected February to see some give back (more on the income side than on the spending side) – they were right.

Americans’ income fell 7.1% MoM in February (-7.2% exp) vs the 10.1% (revised up) rise in January.

Americans’ spending fell 1.2% MoM in February (-1.0% exp) vs the 3.0% (big upward revision) jump in January.
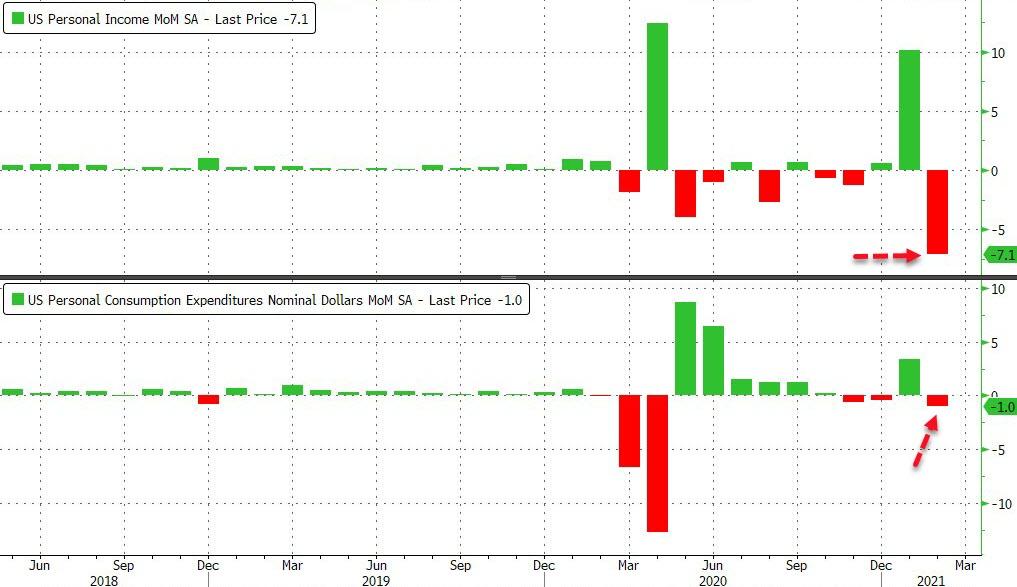
Source: Bloomberg

That is the largest MoM decline in Americans’ income on record.”


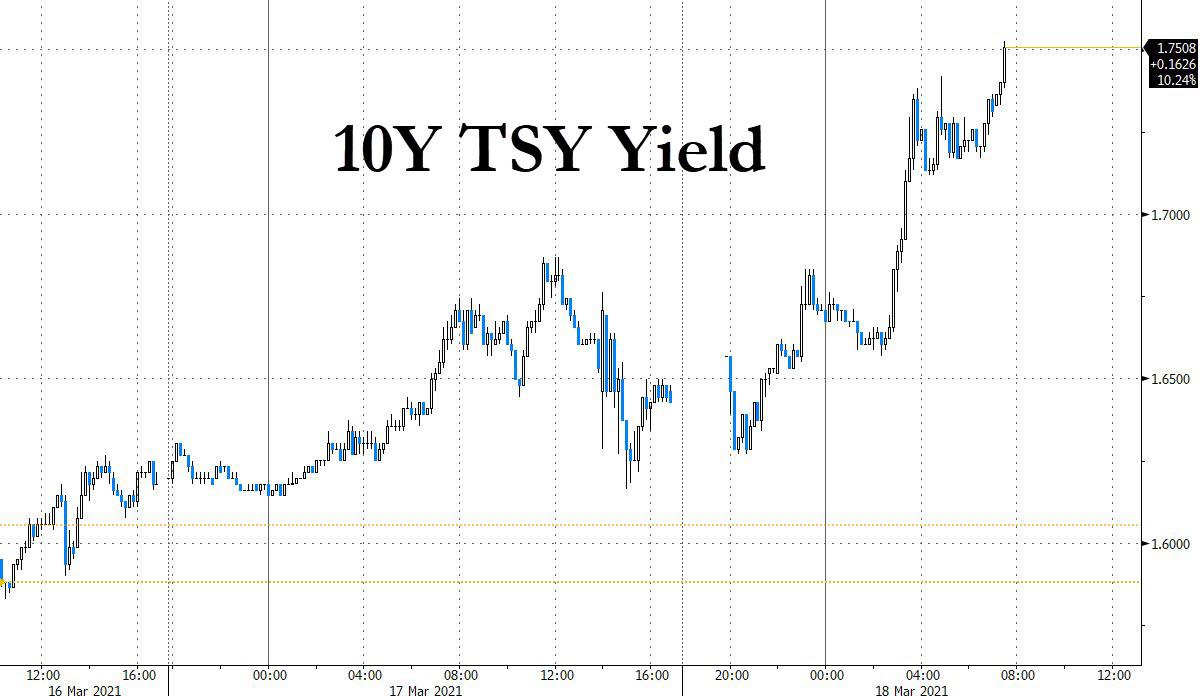
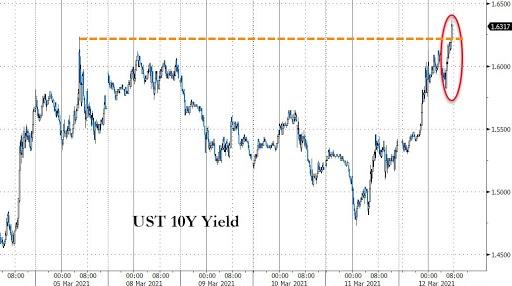
TNX jumped higher this morning, sending yields as high as 16.81 and jitters up the spines of traders.  Yesterday’s 7-year Treasury auction was a bust.  The next 10-year auction is scheduled for April 8.  In the meantime, the Cycles Model suggests a painful month ahead for bond investors.

ZeroHedge reports, “It wasn’t nearly last month’s catastrophic 7Y auction but it wasn’t all that much better either.

Moments ago the Treasury sold $62BN in a closely watched 7Y auction (previewed here), which matched the record size for the tenor.

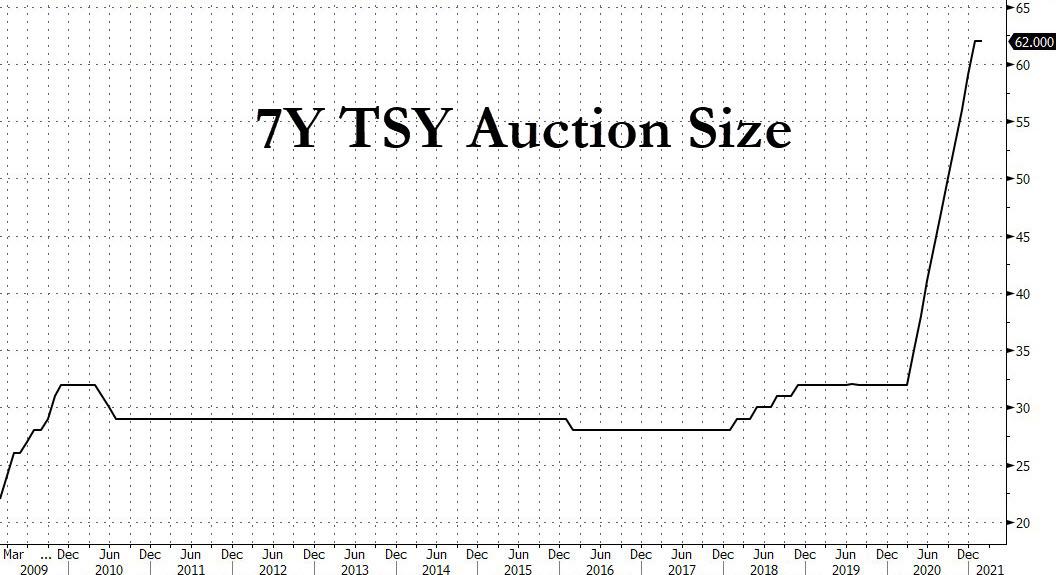
And while sentiment was far more positive heading into the 1pm deadline, traders were surprised to learn that the high yield on the auction was a rather dismal 1.30%, which tailed the When Issued 1.275% by a sizable 2.5bps and was the highest yield since Jan 2020.”


VIX futures drifted lower in the overnight session, hitting a low of 19.24.  Yesterday’s breakout above the 50-day suggests the pullback won’t last.  There appears to be an attempt at a Trading Cycle low, which may match, but not trump the Master Cycle low of Tuesday.


The NYSE Hi-Lo Index closed at a deeper low yesterday after venturing to a high of 71.00 intraday.  This is an unequivocal sell signal, showing the internal deterioration inside the markets.  This is telling us that the decline will not be normal, but an avalanche, taking everything with it.


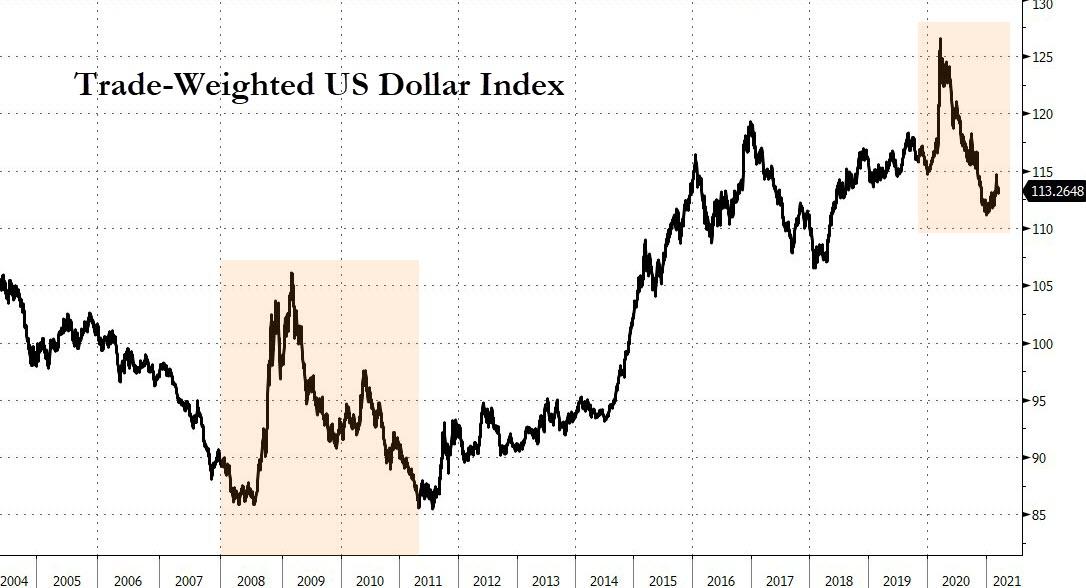
USD futures appear to be consolidating after rising above the 200-day Moving Average at 92.76.  The Cycles Model calls for another three weeks of rally which appear to be targeting the Cycle Top and Broadening wedge trendline at 95.94.  A USD short squeeze may have begun.

Investing observes, “Investors have a voracious appetite for U.S. dollars this month as the Dollar Index climbed to its strongest level in four months. Over the weekend, the Senate passed a $1.9-trillion stimulus bill that is expected to pass the House tomorrow and signed by President Joe Biden before the end of the week. The passage of this bill has been eagerly awaited and now that it is pretty much a done deal, investors are starting to think about how stimulus cheques will be spent. “


Posted in Published | 89 Comments

March 25, 2021

11:21 am

NDX has now declined beneath the Lip of its Cup with Handle formation.  The Cup with Handle formations may target the bottom of Wave [3].  This may happen as early as the end of April, which also corresponds with the end of the current Master Cycle in the VIX!

This first Bearish Cycle from the high on February 16 to the high (Wave [2]) on March 16 lasted 21.5 market days.  The next Cycle (Wave [3]) of 21.5 market days may be a high-to-low Cycle similar to the 2020 decline.


11:12 am

VIX has challenged its 50-day Moving Average at 23.44.  After a brief pullback, it may advance to the next level, the mid-Cycle resistance at 25.03.  The most common buy signal (SPX sell signal) is at 25.00.  The Hi-Lo Index opened at 7.00 and rose to 25.00, well within the sell signal parameters.  What this means is that the SPX now may have a triple confirmed sell signal by the end of the day.

  • SPX beneath the 50-day.
  • VIX above the 50-day.
  • Hi-Lo beneath 50.00.


11:03 am

SPX bounced at the 50-day Moving Average at 3866.58, as expected, and has fallen through that level.  It may now test the two trendlines at 3840.00 and 3850.00.  This level also corresponds with the next tranche of call options.  As these options are wiped out, Dealer gamma becomes more negative and the selling intensifies.  We may see a larger bounce back to the Lip of the Cup with Handle formation at that point.

ZeroHedge remarks, “We warned this morning that ‘if’ we start to sell that selling could be quite material as implied by the trio of vanna charts below (SPX, IWM, QQQ) wherein dealer exposure gets more long as markets drop (and so they need to sell futures), with and we would anticipate a quick visit of the 3800 level in SPX.

And, after a brief attempt to ignite some momentum at the cash open, things have escalated rather quickly…

But this move has sparked breaks of some serious technical levels across the indices.

The S&P is back below its 50DMA…”


8:15 am

Good Morning!

SPX futures are testing the 50-day Moving Average this morning at 3865.71.  The erosion of prices is speeding up as even retail sentiment has changed.  There may be a half-hearted bounce at the 50-day but, once beneath it, selling may intensify.  Call options at 3900.00 and higher are losing value fast, which may change the outlook for those that have been riding the wave higher through options.

ZeroHedge reports, “US equity futures faded a modest overnight rebound on Thursday, ahead of data that is expected to show a small drop in weekly jobless claims after last week’s surprise spike, while the tech-heavy Nasdaq looked set to stabilize after its latest 2% rollercoaster drop in the previous session. The dollar and 10Y yields were unchanged from Thursday’s close, while oil turned lower after a rally spurred by the blockage of the Suez Canal fizzled. It wasn’t clear what was the reason for the persistent late – and as of today, early – selloff, but increasingly many are speculating that the month-end rebalance by pensions is winning the battle, if not the war, against the quant buying we noted in “Month-End Set For Epic Clash Between Forced Pension Selling And Quant Buying.”

At 730 a.m. ET, Dow e-minis were up 27 points, or 0.09%, S&P 500 e-minis were flat, and Nasdaq 100 e-minis were up 24 points, or 0.18%.


VIX futures are surging higher, hitting 22.01 in the morning session.  The technical breakout is at the 50-day Moving Average at 23.41, which should be anticipated very soon.  There appears to be no anticipation of a higher VIX in the media.


The NYSE Hi-Lo Index closed at its lowest point since October 28 and is firmly on a sell signal.  It was positive until 3:00 pm when the usual end-of-day ramp turned into a rout. This is a new phenomenon which has only started in the last two weeks.  Since the Hi-Lo is a lagging indicator, it was not discovered to be this bad until this morning, when final calculations were recorded.

ZeroHedge observes, “Back in 2013, long before anyone had heard of it or plagiarized it, we first defined the term 3:30 pm Ramp Capital to describe the clockwork meltup of stocks in the last half hour of trading.

In the nearly decade that has passed since then, both the term Ramp Capital and the phenomenon which it describes have become household items, so much so that JPMorgan’s clients get upset when the requisite last hour lift is missing.”


NDX futures declined to 12706.00, just short of a technical breakdown at 12704.10.  The NASDAQ Hi-Lo Index closed at -230.00, the lowest since March 24, 2020.

ZeroHedge advises, “With ‘Ramp Capital’ dead, investors are growing anxious that the huge and hotly-anticipated quarter-end rebalancing flows will overwhelm any BTFD enthusiasm (as ‘weaponized gamma’ retail players appear to have jumped ship).

As Nomura’s Charlie McElligott notes this morning, it does indeed look like the much-hyped “pension quarter-end rebalancing” flows are evidencing themselves in the market, effectively VWAP buying TY vs VWAP selling ES over the course of the day the past two sessions, as evidenced by our futures bid-ask “imbalances” monitor across all lot sizes.

Particularly looking at ES (S&P E-Mini) imbalance, we see the last two days (Pink yesterday 3/24, Light Blue 3/23) being two of the four most “sold” of the entire past month window”


TNX is still easing lower, but may be preparing for a double burst of strength early next week.  The current Master Cycle is due to expire after options expiration in April with new highs anticipated.  A decline to the Cycle Top at 15.30 may be in the cards before its next big move higher.

ZeroHedge reports, “After yesterday’s massive 2Y auction went swimmingly, nerves were soothed ahead of tomorrow’s closely watched 7Y “bellybuster” auction because, as a reminder, it was the catastrophic 7Y auction that sparked turmoil in the bond market.

But maybe that was a bit premature because moments ago the US Treasury sold a record $61BN in five year paper…

… in what could best be described as a subpar auction.

The auction stopped at what was once seen as a red-line for 5Y paper, 0.850%, tailing the When Issued 0.847% by a somewhat concerning 0.3bps. Putting the lousy 1pm performance in context, this was the 4th auction in the last 5 when the 5Y has tailed.”


USD futures are now testing the 200-day Moving Average at 92.77.  The current Master Cycle is not due to mature until options expiration in April.  This gives a green light to advance to the combination Broadening Wedge trendline and Cycle Top at 96.04.  The advance, which has been orderly thus far, may become chaotic, as long-time short sellers are forced to cover.

The velocity of money is near its all-time low as fearful investors hoard cash.  Much of the money coming out of stocks and bonds will simply be hoarded in cash.

ArmstrongEconomics observes, “While central banks are hard at work trying to come up with the magic bullet to kill cash and avoid having to bail out bankers again, they are faced with what has been termed the “Paradox of Cash,” whereby the demand rises in the face of declining use of cash in normal transactions. In Europe, studies show that about one-third of all households are hoarding cash. Interestingly, they seem to be just hoarding it rather than spending it. The supply of physical money has doubled over the last 10 years, yet its actual use has been declining. This is no doubt the result of negative interest rates. Why keep money in a bank and be charged a negative interest rate for not spending? If you do not earn interest anymore, then why keep savings in a bank to begin with? This is creating the Paradox of Cash.”


Posted in Published | 2 Comments

March 24, 2021

3:16 pm

NDX continued its decline after an 82% retracement.  It has fallen back beneath its Short-term support at 12 891.92, which has made a bearish cross of the mid-Cycle and 50-day lines.  If this is a short squeeze, it appears that there are no shorts who covered above the 50-day moving average.  In addition, there may be a preference for put options instead of calls.


11:30 am

Are call buyers exhausted?  3950 appears to be the upper limit to this retracement in SPX.

ZeroHedge writes, “A volatile overnight session in the S&P 500 has left in the middle of a range between 3900 and 3950.

If you look at SpotGamma‘s total S&P500 profile you can see the “box” the market is in, and whats curious is that this picture has remained the same for the past several sessions. In other words, its not “filling in”.


10:00 am

The GSCI Ag Index appears to have completed a late Master Cycle low yesterday.  This has been a very shallow correction, but may give a new sell signal above the 50-day Moving Average at 391.11.  The next major resistance may reside at the 2010 high at 570.50.  After a bumper wheat crop in Australia, an infestation of mice may not only damage the new crop, but limit grain exports to stop the infestation from spreading to other countries.

ZeroHedge reports, “New South Wales and Queensland are being overwhelmed by a biblical wave of mice, which have taken over homes, stores, farms, hospitals, and automobiles. These nasty little rodents are eating everything in sight, leaving a path of destruction.

Reuters said, “the Australian state of New South Wales is suffering their worst plague of mice in decades after a bumper grain harvest.”

“At night… the ground is just moving with thousands and thousands of mice just running around,” farmer Ron Mckay told the Australian Broadcasting Corporation.”


8:00 am

Good Morning!

NDX futures nudged up to the 50-day Moving Average at 13163.23, but pulled back.  NDX is on a sell signal, but hasn’t made much progress in the past month.  NDX often leads the other stock indices at major turns, but, in this case, appears to be waiting for the rest of the market to catch up.


SPX futures appear to be testing the combination Short-term support an mid-Cycle support at 3899.51.  However, it has not yet made a clean breakthrough.  There is known to be a significant call option position at 3900.00, which may be giving it support.  One noteworthy item I should mention, the high at 3983.87 on March 17 is exactly 12.9 months from the February 19, 2020 high.  Yesterday happens to be the one-year anniversary from the 2020 low.

ZeroHedge reports, “US stock futures rebounded after Tuesday’s rout as Intel’s shares surged on plans to expand advanced chip making capacity, while investors looked to business surveys for March and another day of testimonies from Yellen and Powell. Futures on the S&P 500 and Dow Jones also pointed to a rebound in the underlying indexes which dropped Tuesday amid a setback for reopening favorites. Stable bond yields and assurances by Powell on inflation risks has helped allay fears that a growth breakout will force tighter central-bank policy.

At 715 a.m. ET, Dow E-minis were up 135 points, or 0.4%, S&P 500 E-minis were up 18 points, or 0.5% and Nasdaq 100 E-minis were up 108.5 points, or 0.83%.”


Despite the positive news this morning, the NYSE Hi-Lo Index closed on an unmistakable sell signal at -46.00.  The internals are crumbling while the surface appears calm.  It appears that today was a good day to return from my brief vacation.  This may be a good sign that quarter-end rebalancing may have started.


Yesterday’s low may be the culmination of this very stretched Master cycle at 281 days.  VIX futures are hovering just beneath 20.00.  This morning’s low at 19.87 happens to be the Fibonacci 61.8% retracement value of the bounce to 21.58.  That suggests a high probability of a breakout above the 50-day Moving Average at 23.43, possibly today.  This would give us a confirmation of the already low NYSE Hi-Lo Index.


TNX may already be recovering from a brief retracement.  The Cycles Model calls for trending strength that may continue through the week after (April) options expiration.

ZeroHedge remarks, “After stocks just saw their best 12-month performance since 1936, it should not be a total surprise that Treasuries have suffered… but the extent of the bond bloodbath is almost unprecedented.

After $17 trillion of liquidity was gushed across the global markets (raising all equity boats), the recent prospect of resurgent inflation has pushed government and corporate bonds around the world to their worst start to a year this century.

Source: Bloomberg

Bloomberg reports that the notes have lost over 3.7% so far in 2021, according a Bloomberg Barclays index of investment-grade securities across currencies going back to 1999. That’s worse than for similar periods in previous years, even after dip-buying in recent days.”

ZeroHedge also reveals, “In recent weeks we have been pointing out the stark divergence between markets in various geographic time zones, most notably the variance in equity “moods” between the Europe and US, where it often appears that there are two regimes: one ending when Europe closes and another starting, with both usually mirror images.

But while we mostly focused on how geography impacts stock markets, a far more interesting observation was made this week by Morgan Stanley’s chief rates strategist Matthew Hornbach, who over the weekend identified the origin, if not quite the identity, of the persistent seller of Treasurys over the past few months, who has sparked such a violent rout across not just the US rates space but also stocks and other core assets.

As the following remarkable chart from Hornbach makes very clear, the cumulative downward price movement in Treasury futures has been concentrated in the Tokyo session. Furthermore, after a brief respite in the first week of March, selling in the Tokyo session accelerated dramatically ahead of the FOMC meeting and it continued afterward.”


USD futures broke through mid-Cycle resistance at 92.45 this morning, reaching a high of 92.61.  The 200-day Moving Average at 92.79 may be next, causing grief among USD short-sellers.  The short squeeze has begun and may run through options expiration on April 16th.  The target appears to be the combination Broadening Wedge trendline and Cycle Top at 96.14.

ZeroHedge remarks, “We’re dedicating today’s entire Data section to the value of the dollar and how this translates to US corporate earnings fundamentals. We use the Federal Reserve’s Trade Weighted Dollar Index rather than the DXY because it includes a broader and more representative basket of currencies. DXY doesn’t even have the Chinese yuan or the Mexican peso.

Three points on this topic:

#1: A long run look at the Trade Weighted Dollar Index (chart below, 2004 – present) shows how global currency markets trade through a cycle.

Global recessions/crises create safe-haven demand for the dollar. This is plainly visible in the 2008 – 2009 recession (dollar peak in March 2009, right as global equity markets troughed) and again in March 2020 (again at a low for global equities).

Now, looking across cycles (2006 – 2021); the dollar has clearly traded like a secular growth vehicle. It has, for example, appreciated 28 percent over the last decade. That is an annual compounded growth rate of 2.5 percent. Across the entire timeframe pictured here, the dollar is up 11.6 percent, for a 0.7 percent CAGR. Over the same timeframes, the euro is exactly flat to the dollar since 2006 and down 15 percent over the last decade, just to call out one major non-dollar global currency.

Takeaway: whenever you hear that the dollar is about to lose its reserve currency status or otherwise implode, remember this chart. No one would call the last 16 years the most stable or predictable in America’s history. But the dollar has done just fine. In short, if there’s a crack forming in the dollar’s secular, long run appeal we just don’t see it in this chart.”


WTI futures bounced this morning back above the 50-day Moving Average at 58.40, reaching an overnight high at 59.76.  WTI has given a sell signal, so the time to go short or sell longs is on the bounce.  It is difficult to determine whether it will be involved in the quarter-end rebalancing, since there appear to be anomalies in the Current Cycle through the first week of April.

ZeroHedge reports, “Crude prices crashed today, extending recent losses with WTI back below $58 at six-week lows amid dimming prospects of a steady recovery in demand from Europe to India.

“The weakness in crude prices isn’t likely to go away in the coming weeks, even as U.S. refinery utilization recovers to pre-storm levels,” said Fernando Valle, a Bloomberg Intelligence analyst.

“There is still the resurgence of Covid-19 in Europe and Asia, and refinery maintenance in China and these are likely to keep international demand weak for U.S. crude.”

Tonight’s API-reported inventory data will give us the next trend direction

API

  • Crude +2.927mm (-900k exp)
  • Cushing -2.282mm
  • Gasoline -3.728mm
  • Distillates +246k

After four straight weeks of builds, analysts expected crude stocks to draw this week, but once again (if API is right) we saw a crude build. Gasoline stocks drew down once again.”


Posted in Published | Comments Off on March 24, 2021

March 18, 2021

8:45 am

I will be away for the next 5 days to visit my eldest son and his family.  I’ll be back for commentary on March 24.

NDX futures declined to a low of 12951.50, on a sell signal beneath the 50-day Moving Average.

ZeroHedge reports, “It started off well enough, with futures initially continuing their post-FOMC ascent and lifting global markets.

However, It all reversed sharply during the Asian session driven by a sharp spike in the 10Y TSY, which initially jumped following a Nikkei report that the BOJ readied to adjust monetary policy and will look at measures that will allow long-term interest rates to move in “a slightly larger range of about 0.25%, versus 0.2% now” in order to make life easier for financial institutions. The news, which came during the Japanese trading break forced local traders to sell US paper instead.

The selloff then accelerated sharply when Europe opened, and pushed the 10Y as high as 1.75%, a level which BofA two weeks ago said was the “tipping point” for bonds

… the highest level since Jan 2020, while the 30-year topped 2.5% a level that hasn’t been seen since August 2019

The algos took one look at the fresh surge in yields and dumped risk assets with a focus on high duration “bathwater” tech names, slamming Nasdaq 100 futures 1.7% lower….

… while Emini S&P futs were set to fade the entire post-FOMC move.”


TNX rallied to a high of 17.47 (17.45 in the futures) this morning.  The Cycles Model suggest a continuation of this rally with growing strength through the end of the month.  A possible trigger for the spike in the 10-year yield may be the Philly Fed Index, which reported a massive increase.

ZeroHedge reports, “The Philly Fed Business Sentiment Indicator exploded higher in March. Against expectations of a rise from 23.1 to 23.3, it jumped by the most ever to 51.8…

Source: Bloomberg

That is the highest level since the Arabian Oil Crisis in 1973.

Under the hood, everything jumped except inventories…

  • New orders rose to 50.9 vs 23.4
  • Employment rose to 30.1 vs 25.3
  • Shipments rose to 30.2 vs 21.5
  • Delivery time rose to 29.5 vs 15.1
  • Inventories fell to 12.1 vs 20.0
  • Prices received rose to 31.8 vs 16.7
  • Unfilled orders rose to 21.8 vs 12.6
  • Average workweek rose to 39.7 vs 30.6
  • Six-month outlook rose to 61.6 vs 39.5

But, the surge is driven by a massive spike in the prices-paid index (which rose to 75.9 vs 54.4).”

Yet another indicator of trouble ahead.  ZeroHedge reports, “While much of the financial commentariat spent Wednesday afternoon focusing on the Fed’s useless dot plot (which focuses on a period that takes place about a year after Powell’s tenure at the Fed is over and he will be replaced by uber-dove Brainard), we pointed out a “huge surprise” (as Curvature’s repo expert Scott Skyrm put it) contained deep inside the statement – the Fed’s decision to hike the Reverse Repo counterparty limit from $30 billion to $80 billion.

Why was this significant? Because as Skyrm explained, “if the Fed wanted overnight rates higher, they would have raised the IOER and/or RRP. Instead, they raised the RRP counterparty limit” which also “implies the Fed is very comfortable with zero percent rates and maybe even negative rates.

In other words, having seen the recent drops of overnight GC repo into the red…

… and 1 month bills trading as low as -0.01% this morning, the Fed decided to do nothing.

However, as that “other” repo guru, Zoltan Pozsar (formerly of the NY Fed and currently at Credit Suisse) pointed out later on Wednesday, there is another possible interpretation, a much more ominous one for those who believe that banks need an SLR exemption now, or else they will be forced to raise capital/delever/dump treasurys – in other words, lead to even more pain for Treasurys.


SPX futures declined to a low of 3932.62, testing its support at yesterday’s low.  As mentioned yesterday, the EW structure is complete, and a decline beneath 3935.00 may eliminate the possibility of a new high.  A decline beneath 3900.00 may turn options gamma negative, as well.  The fly in the ointment is that the DJIA may have made a new (all-time) overnight high.  However the DJ30 futures turned red this morning.

The social mood is shifting.  People have quit wearing masks in droves.  Anthony Fauci is ignored or, even worse, mocked.  We are already tiring of Biden’s ineptitude.  This may be showing up in the markets.  Be prepared for a sudden shift in sentiment that will take many by surprise.  The stimulus checks are coming, but will they be enough?

ZeroHedge observes, “The highly anticipated Fed meeting is now in the rearview mirror, but for weary traders sitting at a fresh all time high in the S&P, the week is not yet over as another major market event is on deck: we are talking about Friday’s quad-witch (quadruple expiration) when once a quarter on the third Friday, we get the simultaneous expiration of stock index options, market index options, individual stock company options and and single-stock futures.

At the 30,000 foot level, two things make Friday’s quad-witch especially notable: the relatively small size of Friday’s event, and the dismal liquidity going into it.

As Goldman writes in its latest Vol Vitals report, when measured in contracts (or percent of SPX market cap), the SPX open interest expiring this Friday is the smallest for at least a decade. The 4.0 million March contracts outstanding are just 60% of the open interest at this point in the volatile week approaching March-2020 expiration. According to Goldman, the reduced SPX open interest reflects volume continuing to spread around the calendar instead of being concentrated in just the quarterly expirations. Meanwhile, the rising SPX index level has left the bulk of March open interest (87% has strikes of 3900 or lower) below the current index level, so expect marketwide gamma to have limited impact on trading dynamics this week.


VIX futures rose to an overnight high of 20.43.  While nowhere near the 50-day, VIX may have become unshackled from the short-vol trade, since futures and options expired yesterday.  The rest of the market is in a fragile state, with liquidity extremely low.  Quad witching may light a spark under the VIX that sends it rocketing higher.


USD futures are moving higher.  Both the Cycles and Elliott Wave structure imply that USD may rally back to the Broadening Wedge trendline at 96.00.  That is entirely possible due to a potential sell-off in stocks, raising the demand for USD and the massive short USD trade that may be forced to cover.  The current Master Cycle ends on options expiation day in April.


Gold futures are sliding again.  Despite all of the calls to buy gold, it appears that it may descend to the bottom trendline at 1500.00 before too long.  The next Master Cycle is due at the end of the month.  Should liquidity remain thin and the USD rally to 96.00, gold may have no other choice than to plummet.

ZeroHedge comments, “Worried about gold sentiment? Don’t be.

The mainstream view of gold right now is an open yawn, and sentiment indicators for this precious metal are now at 3-year lows despite the gold highs of last August.

Is this cause for genuine concern?

Not at all.

In fact, quite the opposite.

Most investors are totally wrong about gold, and below we show rather than argue why they are missing the forest for the trees.

Unlike trend chasers, speculating gamblers and gold bears, sophisticated precious metal professionals and historically (as well as mathematically) conscious investors are not only calm right now, they are biding their time for what is about to become gold’s perfect backdrop and, pardon the pun, golden era.”


Posted in Published | Comments Off on March 18, 2021

March 17, 2021

3:16 pm

SPX made a marginal new all-time high at 3983.87.  It may go even higher, as I mentioned this morning.  However, it has made the requisite number of Waves within the time allotted in the Master Cycle (261 days).  Be on the alert.  Should SPX decline below 3935.00, it would constitute an aggressive sell signal.

VIX made a new low at 19.24 on day 275 of its Master Cycle, making it a very stretched one.  The NYSE Hi-Lo opened at 24.00, the lowest since February 26, and showing weakness.  Tomorrow will give us the official close, as the data generally lags the market.

ZeroHedge remarks, “Neil Dutta at Renaissance Macro sums up today’s nothingburger from The Fed:

“Passive easing continues. GDP has been revised up. Inflation has been revised up. Unemployment revised down. Despite all this, the median dot still at zero through 2023 though a few more see a hike. Chair Powell probably has time to help these folks understand the new policy framework.”

*  *  *

Today’s market chaos is brought to you by the word “SLR” and the number “2023” – whether The Fed will mention its thoughts on the now-politicized Supplemental Liquidty Ratio exemption decision (which will spark turbulence in bank stocks and Treasuries); and whether the Fed’s forward-looking dot-plot of rate expectations is adjusted hawkishly for 2023 (if no adjustment, stonks will soar).

Going into the event, there was no fear.”


6:30 am

Good Morning!

Today the FOMC makes its news release on their outlook and critical decisions going forward (or not).

ZeroHedge observes, “It could be time for Jay Powells “taper tantrum” as SLR-stakes are high ahead of the FOMC meeting on Wednesday. The political pressure is building and the SLR-relief may not be prolonged. We enter the meeting leaning short in EUR/USD and bonds.

“The temporary exclusion to the SLR is a mistake that should not be perpetuated after it expires at the end of this month”

– House Financial Services Committee Chairwoman, Maxine Waters (D)

We have a big central bank week ahead of us, with scheduled monetary policy decisions from the Fed, Norges Bank, BoE and BoJ, and it could prove to be one of the most important weeks in the life of Jay Powell.”

SPX futures are holding steady, awaiting the 2:00 announcement.  While having the appearance of being complete on day 261, the Cycles Model and Elliott Wave guidelines offer some further guidance.  As seen on the daily chart, The Cycle Top is at 4032.24.  Minute Wave [v] equals Minute Wave [i] at 4034.32.  The Wave structure may have a maximum height near 4050.00.


NDX closed just above the 50-day Moving Average at 13146.41 but futures have weakened in the overnight session.  Options gamma in the NDX are negative, but a large block of puts that are soon to expire may neutralize the bearish pressure on the NDX.  A lot will depend on Jay Powell’s outlook.  A simple “status quo” statement may ignite a taper tantrum that may propel stocks lower.

ZeroHedge reports, “S&P futures edged lower, European and Asian markets were mostly lower and Treasury yields climbed sharply ahead of a key Federal Reserve meeting at which officials will deliver their outlook for the economy amid an overheating recovery that risks stoking inflation, and where all eyes will be the median 2023 dot for a potential hawkish signal that sends yields soaring.

At 0715 a.m. ET, S&P 500 E-minis were down 14 points, or 0.34% and Nasdaq 100 E-minis were down 148 points, or 1.13. The FAAMG stocks all slumped while Fuel-cell firm Plug Power Inc. plunged more than 20% in pre-market trading after it disclosed accounting errors.

The 10-year TSY yield ticked up to a new 13-month high of 1.6656% ahead of the policy decision, with market-implied inflation expectations are at 12-year highs even after yesterday’s 20-year bond auction drew stellar demand…

…. hammering demand for high-growth technology stocks, and sending Nasdaq 100 futs tumbling.”


VIX futures have risen steadily in the overnight session to 20.55.  Today is options and futures expiration for the VIX.  The Cycles Model suggests that yesterday may have been the Master Cycle low on day 274, a stretched Cycle.  However, FOMC days have been known to evoke wide swings in volatility in either direction.  We may see a momentary dip (at the FOMC announcement) to fill the open gap at 17.54 – 18.21, should the SPX rise over 4000.00.


USD futures are higher this morning.  The Cycles Model shows trending strength this week and possibly continuing into early April.  The strength of the USD may be dependent on rising yields in the 10-year Treasury note.


TNX is surging higher this morning.  10-year futures made a new high not seen since January 2020.  Should Powell attempt to allow inflation to ” moderately overshoot,” we may see interest rates continue to rise through late April.  Given that probability, I am not sure of the Elliott Wave structure.  I had mentioned earlier that TNX could go as high as 17.00.  That now seems to be a good probability.  Should the rally continue through April, 20.00 may be a realistic target.

RealInvestmentAdvice gives some guidance, “What Interest Rate Triggers The Next Crisis?

  • The Ten-year U.S. Treasury note yields 1.61%.
  • 10-year high-quality corporate bonds yield 2.09%.
  • The rate on a 30-year mortgage is 3.05%.

Despite recent increases, interest rates are hovering near historic lows.  We do not use the word “historic” lightly. By “historic,” we refer to the lowest levels since the nation’s birth in 1776.

The graph below, courtesy of the Visual Capitalist, highlights our point.

interest, What Interest Rate Triggers The Next Crisis?

Despite 300-year lows in interest rates, investors are becoming anxious because they are rising. Recent history shows they should worry. A review of the past 40 years reveals sudden spikes in interest rates and financial problems go hand in hand.

The question for all investors is how big a spike before the proverbial hits the fan again?


Posted in Published | 1 Comment

March 16, 2021

3:25 pm

NDX has challenged the 50-day Moving Average at 13146.49.  Although it has bounced above it, it may close beneath it, creating a sell signal.  Best wishes!

ZeroHedge comments, “With less than 24 hours to go until one of the most closely watch Fed announcements in a long time, the VIX finds itself hanging just below 20, the gamma gravity in the S&P is at 4,000 while dealers remains short Nasdaq/QQQ gamma (which however is shrinking by the day). In short, depending on what Powell says (we previewed how market would respond to a hawkish… and dovish Fed), markets could tumble or surge.

A quick rundown of the key technical factors ahead of tomorrow’s 2pm announcement:

As our friends at SpotGamma note, the 400/4000 Call Wall in SPY/SPX has grown in size to over $5BN from yesterday – 10k 4000 strike calls were added yesterday, along with 100k SPY calls (to 400) – which increases its “pull” and yet total gamma is little changed in the S&P500 (that said, due to the FOMC tomorrow SG does not expect much movement today a forecast which has so far proven accurate).

On the other hand, Nasdaq/QQQ gamma remains negative, but that continues to shrink and SG notes that the upcoming March op-ex should flush out the remainder of that negative gamma position.


7:45 am

Good Morning!

NDX futures challenged the 50-day Moving Average at 13137.42 by rising to an overnight high of 13167.62.  While the bearish structure may have weakened, it is not gone.  The  61.8% Fibonacci retracement level is at 13241.33.   Today is day 260 of the current Master Cycle for the NDX and SPX and day 263 for the DJIA.  The reversal is imminent.

ZeroHedge reports, “Exactly one year ago today, the financial world as we know it was on the verge of collapse, with the Dow Jones plunging to 20,000 after the VIX exploded to a record 82.69.

Fast forward to today, when the market is about 66% higher, and on Tuesday morning futures on both the S&P 500 and the Dow Jones edged higher hitting fresh all time highs – the Dow notched its sixth consecutive all-time high on Monday on optimism over a $1.9 trillion fiscal stimulus package –  for the second day in a row while contracts on the Nasdaq 100 rose about 0.5% by 730 a.m. ET, pointing to an extension of a rebound in technology stocks that were at the heart of February’s selloff. The Nasdaq 100 is still about 5% below its Feb. 12 record closing high. Traders were looking ahead to today’s industrial production and retail sales data (which as a reminder, will be a huge miss), while the Federal Reserve was set to kick off its two-day policy meeting.”


SPX futures made a new all-time high at 3964.38.  Futures are currently 12 points beneath the cash market.  It is possible that it may continue to rise to the Cycle Top at 3985.40.  Another possibility may be the daily Cycle Top at 4037.69.

ZeroHedge remarks, “Last week in his latest Doubleline webcast, Jeff Gundlach presented a remarkable chart, one showing that the ratio of the Nasdaq to the S&P 500 has been pulled lower (due to Nasdaq underperformance coupled with strength in value stocks) and is now right on its dot com bubble peak levels.

Picking up on this chart, over the weekend in his latest Bear Traps Report, Larry McDonald wrote that “we are sitting on an incredibly important turning point” adding that “the world’s first and second most liquid and arguably most important stock indices are sending important rotation signals. In our view, both tech and growth equities outperformance run is over and the rotation to value and commodity exposed equities has begun.”


VIX futures made a new low at 19.81 this morning.  It is possible that the VIX may decline lower than the February low, which may advance the Wave [B] structure.  It would make sense that the Master Cycle would terminate at a lower low (beneath 19.69).  A rally out of that low may be explosive.


TNX eased down to 15.88, then bounced back above 16.00.  The Cycles may allow a retracement to the support levels between 12.38 and 14.22.  From there, TNX may resume its advance through late April.

ZeroHedge observes, “Being dovish is harder than it looks for the FOMC. We expect two hikes in the 2023 dots. The consensus probably is close to expecting a single hike. If we are right, the initial response would probably be to add another half hike to the three already priced in by end-2023, taking the USD higher. But we think the Fed can present its dots as good news — a maximum employment soft landing is approaching quicker than expected. However, continuing the attitude of laissez-faire for long bond pricing would invite investors to take yields higher as economic data improved, even if the FOMC stuck with zero hikes in the dots.

How quick come the reasons for approving what we like

We think the FOMC will have a hard time expressing concern about asset markets with the S&P at an all-time high on 12 March, despite 10Y UST yields at post-February 2020 highs (Figure 1). Focus has been on the FOMC ‘dot plot’ in recent days, but if the FOMC and Fed Chair Powell do not push back against current yield levels, investors are likely to take yields higher as better data arrives.”


Posted in Published | Comments Off on March 16, 2021

March 15, 2021

7:30 am

Good Morning!

Good Morning and welcome to the Ides of March!

The DJ 30 futures made a modest new (all-time) high this morning at 32821.50 on day 262 of its Master Cycle.  It has exceeded its Cycle Top resistance at 32589.40.  A reversal back beneath this support/resistance line may offer an aggressive sell signal, considering the length of its Master Cycle.

ZeroHedge  considers, “As DB’s Jim Reid wrote in his latest Friday Thematic Research recap from the last day of the week, Thursday saw the first all-time high in the S&P 500 for a whole month.

It was nevertheless the 11th ATH in 2021 to date, and if anyone (spuriously) decides to annualize this, it would mean 57 in total for the year which would be the fourth largest behind 1995 (77), 1964 (62) and 2017 (62).

As Reid observes, such clusters of all-time highs are unsurprisingly focused around secular market valuation highs with the late 1920s, mid 1960s, late 1990s and the current period the obvious points. However, there have also been long periods where we’ve been devoid of ATHs, usually after one of these market peaks. The longest was the 6490 business days between September 1929 and September 1955.”


SPX futures rose to 3947.62 before pulling back to breakeven.  The SPX structure allows another probe higher on its day 259 of the Master Cycle.  The FOMC meets this week, which may keep equities near the top of their range.  In addition, there may be a spike of trending strength on Thursday, keeping the SPX pinned higher into options expiration.

ZeroHedge reports, “Global shares rose and US equity futures were flat as U.S. bond yields hovered near a 13-month to start the week as bets economic growth will accelerate kept high duration stocks depressed as investors braced for Federal Reserve and other key central bank meetings in the days ahead. The Dow notched five consecutive record highs last week as approval of one of the largest fiscal stimulus in U.S. history and vaccine rollouts fueled demand for economy-linked stocks such as banks, energy, materials at the cost of tech names with lofty valuations.

At 7:40 a.m. ET, Dow E-minis were up 118 points, or 0.36%, Nasdaq 100 E-minis were up 24.75 points, or 0.19% and S&P 500 E-minis were up 5 points, or 0.1%, fading an earlier gain of 3,948 amid caution how the Fed would respond to the stimulus-fueled snapback in economic activity.”


NDX futures challenged Short-term resistance at 12995.98 before pulling back into negative territory.  Of all the indices, the NDX had the most bearish profile.  It is currently on a sell signal and a continued decline beneath the Lip of its Cup with Handle formation not only certifies the decline, but also may have the capability of turning the other indices negative as well.  Having been rejected at the 50-day Moving Average last Thursday has put the NDX on a slippery slope that may accelerate quarter-end selling for all the indices.


VIX futures rose to a high of 21.55 this morning.  It is beneath the 50-day Moving Average at 23.95, which is the level to watch this week.  Friday was day 270 in the current Master Cycle.  Today we may see both the VIX and SPX rising, as the new Master Cycle in the VIX may establish itself.

The strength of last week’s decline was much higher than the previous rally where I had previously tagged the Cycle end, suggesting the Master Cycle may have ended last Friday instead.  I am more cognizant of measures of strength at the end of the Cycle, since price action, while often indicative, may not be accurate in determining the turns.

ZeroHedge remarks, ”

The Market Ear Picture

Massive central banks week coming up, with obviously Fed stealing the show (we have BoE, BoJ and Norges Bank as well).

The reopening bull is very much alive and manufacturing cycle is gaining momentum. The rollover of the Chinese credit impulse is not the focus this time, but worth keeping in mind (those effects are scheduled for later this year).

Inflation is a huge focus for the upcoming meeting. The “moderate overshooting” of inflation looks to possibly be overshooting more than just “moderately”. Powell simply reiterating the same message will probably not make markets overly calm.”


TNX opened above 16.00, showing continued strength in the Cycle.  There are two possible outcomes this week in the Cycles.   The first is the Completion of Minor Wave 4, which may be due to test one of the support levels beneath it on a Trading Cycle low later this week.  The second is  a continuation of Minor Wave 5, which may extend to the last week of April.  The second outcome is likely to be the final outcome in either event.


Posted in Published | 1 Comment

March 12, 2021

10:40 am

TNX has made a new high at 10.39 this morning, increasing the jitters in equities.  There are two possible patterns hare, both ultimately leading to higher yields.  The first is that the Master Cycle, which corresponds with Primary Wave [3], ended on February 28 at the 16.14 high.  The subsequent rally may be a Wave (B) in the correction, leading to an immediate decline back to one of the underlying supports.  The second (less favored) view is that Intermediate Wave (5) of Primary Wave [3] still has room to run and may hit 17.00 before it is over.   I view this as less favored due to the lack of strength being exhibited in next week’s Cycles Model.

ZeroHedge observes, “Treasuries are under meaningful pressure as the 1.624% yield peak in 10s comes into range. There was no definitive trigger other than the usual suspects of reopening optimism, supply indigestion, and SLR expiration jitters. To this latter concern, the most recent primary dealer holdings data as of March 3rd revealed a record $64.7Bn decline in Treasury holdings to $185.8 bn. It’s worth noting that -$23.5 bn of this was in the bill sector and -$3.7 bn in floating rate notes; that said, notes and bonds were also reduced. However, given the preceding spike in yields and the fact these figures are reported in market value rather than par terms, the drop reflects more than simply dealers aggressively shedding Treasuries as the extension of SLR became less certain. Nonetheless, dealers selling into the downtrade is consistent with the choppy price action seen during the last several weeks and concerns that ballooning net issuance could be problematic for liquidity conditions; particularly in the event the preferential treatment for Treasuries is lost.

It’s with this backdrop that today’s trading session takes on particular relevance in gauging investor sentiment as the weekend approaches. While last week saw a meaningful challenge to the ‘Friday afternoon bears’ pattern which has been evident throughout much of this year, as we ponder the information on offer, there is little to dissuade the drift higher in yields aside from residual price action in other markets. PPI and the University of Michigan’s confidence figures won’t meaningfully influence the outlook for the recovery and as such we anticipate the reports will be largely ignored in favor of anxiously watching the response in risk assets as the path of least resistance appears toward higher yields as the US comes online.”

ZeroHedge advises, “The 10Y just tagged the March 5 high yield of 1.625% – a key stop loss level – and steamrolled higher amid a cascade of short covering, because as noted earlier, once the momentum kicks in nobody knows where and how it stops.

And unfortunately for TSY bulls, the pain could be just starting because as BMO’s Ian Lyngen noted, those hoping for a contrarian buying signal from the banks/dealers will have to wait a long, long time. That’s because the latest weekly data (ending March 3), showed that the primary dealer holdings data revealed a record $64.7Bn decline in Treasury holdings to $185.8 bn!”


7:30 am

Good Morning!

SPX futures declined to a low of 3910.12 this morning.  Whether bullish or bearish, there is likely to be a bounce off 3900.00 going into the weekend.  Today is day 259 of the Master Cycle for the DJIA and 256 for the SPX.  While the high may have been made yesterday in the DJIA and the SPX, more work needs to be done to done to confirm the turn.  It may seem that I am skittish after having had a perfectly bearish pattern blow up with an extension.  True.  But I will point out that the new Master Cycle will not end until options expiration week in MAY.  So there may be plenty of time to position for a bearish outcome.


NDX futures are bearish after being repelled at the 50-day Moving Average at 13128.54.  The low was 12786.38 before a bounce, but the NDX needs yet another probe lower to confirm the possible change in the Elliot Wave structure of the Cycle. I will point out, however, that this is a very bearish structure.  The Cup with Handle gives the potential target for Primary Wave [3].  The average target for Cycle Wave I is 6500.00.

I  recall discussing a very similar situation in March 2000 with Sir John Templeton, who was down $600,000.00 when the NDX bounced against his bearish speculation.  I asked him if he was taking the loss.  He said, “No.  I am adding another $600.000.00 to my short position.”  The NDX then proceeded to decline 65%.  One of his oft-quoted sayings is, “The best time to invest is when there is blood on the streets, especially when it’s your own.”  The shorts have been bloodied in this week’s move.  The lack of shorts at the top of this Cycle practically guarantees a massive decline, since there will be no buyers for a long way down.

ZeroHedge reports, “Nasdaq futures fell as much as 2% on Friday after rebounding more than 6% in the past three sessions, after a new spike in U.S. bond yields restarted inflation fears and sent investors scurrying to the perceived safety of the dollar, while hammering global stocks. A Bloomberg report that Beijing is expanding a crackdown on Tencent Holdings also weighed on the technology sector. S&P 500 futures were also dragged down after ending at record closing highs, and we last trading just above 3,910, down 16 points, or 0.4%, while Dow E-minis were up 12 points.

Friday’s selloff was sparked after the yield on the benchmark 10-year notes rose back above 1.60% on Friday to approach the one-year highs touched last week (more below).”


VIX futures challenged the 50-day Moving Average at 22.98 in the overnight session.  Should equities venture lower, the VIX may respond by going higher.  However, the setup near the close of the day may be most telling.


TNX surged above 16.00 in the futures while making a cash market high of 15.93.  This is raising anxiety about the resurgence of inflation and the concern for the expenditures in the stimulus, which are being fueled by more debt.  However, today is the last day of trending strength.

However, it appears that the 10-year Treasury Note may be bought, at least through March options expiration, causing a test of the supports below.


The Ag Index may be taking a breather, as prices decline into the next trading Cycle low later this month.  The Elliott Wave structure points out a probable Expanded Flat formation, where Intermediate Wave (C) declines to the low of Intermediate Wave (A).  Once accomplished, Primary Wave [3] may get underway with a probable target near 1000.00.

ZeroHedge reports, “US wholesale fertilizer prices have been on a tear since December 2020 due to rising commodity prices, tight supplies, and strong demand.

Last fall, Rabobank forecasted that phosphate and other fertilizer prices would remain elevated in the first half of 2021 because commodity prices were accelerating. Now Rabobank reports phosphate prices have nearly doubled.

“With the increase in commodity prices, there has been an increased demand for fertilizers since last fall. This increased demand, coupled with reduced fertilizer imports is – according to forecasters – predicted to keep fertilizer prices elevated through fall and potentially into next year,” Jamie Patton, senior Outreach Specialist for the UW-Nutrient and Pest Management Program, told Wisconsin State Farmer

DAP Tampa Fertilizer Index has nearly doubled since the start of the year. ”


USD futures bounced to a high of 91.95 in the overnight session.  There is a distinct possibility of a retest of over head resistance at 92.59 to 93.03 in the next few days.  A breakthrough may power the USD toward the Broadening Wedge trendline at 96.00 by mid-April.  This may be a pain trade, as there is still an overwhelming short USD position.


Posted in Published | Comments Off on March 12, 2021

March 11, 2021

12:24 pm

TNX bounced back above 15.00 after a brief foray beneath it.  Today may be the last show of strength as TNX is due for a decline that may take it down to the 50-day Moving Average.  A Trading Cycle low is due during or shortly after March options expiration.

ZeroHedge remarks, “Following yesterday’s impressive 10Y auction, which only tailed as a result of traders realizing just how massive the short overhang in 10Ys remains (first pointed out here) which sparked a furious rally in the 10Y two hours ahead of the auction’s 1pm deadline, the situation in the repo market has stabilized somewhat, but still remains clearly troubled, with Bloomberg writing that the cost to borrow 10-year Treasuries in the repo market has retreated from extremes hit on Thursday after the 10Y auction, though the security still remains special ahead of the March 15 settlement.

According to ICAP, the daily repo rate for 10-year Treasuries was around -1.60%/-1.85%, while Break Capital quoted it at -1.75%/-2% earlier, confirming something we have noted for the past week: funding markets continue to respond to the heavy supply of cash in the front end.

The big question for traders is what this means for today’s 30Y bond auction at 1pm, and whether the $24BN reopening will be met with the same enthusiasm as yesterday’s benchmark sale, especially when considering the massive bond sale from Verizon which is tapping a whopping seven-part offering to help pay for its 5G spectrum commitment. The sale encompasses maturities from three years to 40 years, and the combined size – perhaps up to $25 billion, if not slightly more – is substantial. According to Bloomberg, “it’s potentially one of the five largest corporate deals ever.”


11:55 am

SPX made a new all-time high.  This modified the Wave structure and gave us a new upside target of 4030.00 to 4060.00 in the SPX.  However, keep in mind that Minute Wave [c] equals Minute Wave [a] at 3980.00.  Considering that we may be in the final day or two and that Cycle Top resistance is at 3972.67, we may want to keep our euphoria level moderated.


7:30 am

Good Morning, and welcome to my world!

SPX futures rose to 3929.12 in day 255 of the Master Cycle.  The SPX and the DJIA could both top out today leaving the current structure intact.  Or we could see the SPX make new all-time highs.  I am holding out on my original count, shown here.  But there is a massive rotation between value and growth in equities.  Value is all but played out, but will growth revive?  Regardless of which may make the last gasp, we are on a ledge overlooking a massive precipice.  Don’t kid yourself, the next stimulus is already spent.

ZeroHedge reports, “US equity futures and world stocks jumped to their highest in over a week after the latest CPI report calmed investor nerves about inflation which coupled with a solid 10Y auction and a surprise pledge from the ECB which pledged to ramp up its buying of government debt in coming months in a bid to a contain rising bond yields that threaten to derail the region’s economic recovery. The ECB announcement helped already low yields drop further and pushed the MSCI’s All Country World Index to its highest in just over a week, up 0.7% on the day. Tech stocks got a further boost – led by Chinese semi companies – after China’s main industry association said it will work with its U.S. counterpart to discuss supply-chain safety and trade restrictions

Dow E-minis were up 118 points, or 0.37%, S&P 500 E-minis were up 30.25 points, or 0.77% and Nasdaq 100 E-minis were up 248 points, or 2% At 7:45 a.m. ET”


The DJIA is on day 258 of its Master Cycle today.  It is nearly spent, with overhead (Cycle Top) resistance at 32475.18.  Wave equality may be reached at 32500.00, should it probe higher.   The reversal from the Cycle Top  will begin the great descent.    In other words, the tank is nearly empty.  Investors have been throwing money at the DJIA with both fists.  But this market does not have a money back guarantee.


NDX futures soared to 13013.00 this morning, changing the complexion of the Waves.  This is actually a better fit, due to the Primary Degree being used to illustrate the Wave structure.  The 50% Fibonacci retracement of the decline is at 13043.00, while the 61.8% fib retracement is at 13236.00.  If the Master Cycle ends today, the lesser retracement will do.  Should it extend over the weekend, the higher target may be reached.

So the question is, will growth enter a new dynamic phase?  Chances are not.  What we may be seeing is a short-covering bounce.

ZeroHedge reports, “On Sunday, when looking at the latest prime brokerage data from Goldman we noted that around mid-week the PB desk saw the “largest global short sales since May” with the GS Prime book net sold driven by short sales outpacing long buys 1.7 to 1.”

… and predicted that a “Mega Squeeze” was Coming as “Last Week Saw Biggest Hedge Fund Shorting Since May

“What does all of this mean for markets”. we asked rhetorically and answered that in a week where stocks first spiked then tumbled only to reverse, and where substantial damage was done on HF P&L, immediately after a furious burst of shorting, which has pushed gross short exposure to the highest level since the start of 2020…”

ZeroHedge further observes, “Summary:

The Nasdaq 100 is currently in its 15th largest drawdown since 1 January 2003 down 10.9%. History suggests that the drawdown could last 121 trading days if this is an average drawdown in terms of its recovery profile. This we think would profoundly alter investor psychology as the new group of retail investors arriving at equity markets last year have never experienced slow grinding equity markets for very long. Our thesis is that growth investing and its near term support will hinge on the drawdown length and thus is a key indicator to monitor going forward.

*  *  *

Nasdaq 100 is 15 trading sessions into the current drawdown down 10.9%and our bubble stocks basket is down 27.9% since the peak. Listening to many growth investors, both professional and retail, it has been a violent move, and many has been taken by surprise, or at least, many had underestimated the interest rate sensitivity and given it much thought. While painful for many investors we could see our bubble stocks basket experiencing a 50% drawdown taking the basket’s total return index back to levels from September last year – if this happens it would entail a 32% decline in bubble stocks from current levels. Outsized gains typically come with subsequent volatility and potentially dramatic drawdowns. That is the lesson of history, and this is no different.”


VIX futures made a new low at 22.04 this morning.  It is challenging the open gap left a year ago when the lock down began.  If the Wave Structure is correct, we should see a probable target of 100.00 being met by this Summer and a possible target of 160.00 by year end.


TNX has pulled back even more from the top, as it leaves behind the Master cycle ending on March 5.  today is the last day of strength with a probable small bounce before declining in earnest.  The new Master Cycle may last until after the April options expiration, so there is time and probable gains to be made going long the UST.


USD futures are lower, hitting a new low at 91.51.  The Next Master Cycle low is due at options expiration in April.


Posted in Published | Comments Off on March 11, 2021

March 10, 2021

2:36 pm

The DJIA has made yet another all-time high while the SPX refuses to go down and it remains within 40 points of its high.  Tomorrow is day 258 for the Dow Cycle, only three days earlier than the SPX.  You can see why I had been calling for a crash decline into next week for the SPX, since it would hit within days of its scheduled time.  However, I cannot ignore the Dow, which may just pull the SPX along with it.   Trend strength is especially hot this Friday and again on Thursday, the day before options expiration.  Had the decline begun today, the trend strength would have been negative.  While things may change quickly, I must warn that the prospects of new highs in the SPX are growing.

ZeroHedge reports, “Heading out of the Covid era, it looks as though value investing is officially back. $100 billion has poured back into the investments that were once left for dead, as investors either “broaden the bull market”, to borrow Cathie Wood’s term from several days ago, or just become more risk adverse and head out of risky, speculative, tech plays in favor of value.

In fact, value investing, as a strategy, has now surpassed levels last seen before the pandemic, according to Bloomberg. And with $1.9 trillion more in stimulus about to hit the market, the rotation could continue.

An Evercore note out Monday read: “Value crushed it for the right reasons.”

As part of the shift, value investing ETFs have brought in new money for 10 straight weeks. Assets have jumped $100 billion since the start of November, Bloomberg notes.”


2:01 pm

The 10-year Treasury Note auction went through with flying colors.  However, he yield is still above 15.00 which is considered the danger zone.  In addition, the trend strength may last yet another day and the Elliott wave structure allows yet another probe higher.  At this time it is a relief to see that the auction went well, but patience is required to see if there is more than meets the eye.

ZeroHedge reports, “When we advised readers to brace for a “blockbuster” 10Y auction just before noon, little did we know that the post alone would spark a buying frenzy, that sent the 10Y yield from above 1.54% to just below 1.51% ahead of the 1pm auction, actually pushing the yield to red on the day after blowing out earlier as high as 1.565%

So fast forward to 1pm when moments ago the Treasury sold 10Y paper at a high yield of 1.523%, well below where the 10Y traded when we said to brace for a blockbuster auction, but 1 basis point above the 1.513% When Issued which was crushed lower – eliminating any concessions – thanks to our earlier post.

In other words, what we had expected would take place at the auction, took place just ahead of it.

That doesn’t change the fact that the 10Y auction was indeed very superb, and not even remotely similar to the catastrophic Feb 25 7-Year auction.”


9:56 am

Exuberance has got the best of the market, or possibly the algos attempting to raise prices for the inevitable selling spree that may ensue.  The move may be labelled as an expanded flat correction, where the top of Wave (C) matches the top of Wave (A).  A fake rally based on a fake report by the BLS.  Now we await the 10-year Treasury Note auction.


7:30 am

Good Morning!

SPX futures continue to hover at Short-term support at 3875.44 after making an overnight low of 3857.12.    The Master Cycle offers the probability of a 4-6 day decline from here that could become volatile as it approaches quadruple witching hour during options expiration on March 19.  One possible catalyst for the panic decline is the probability that the 10-year Treasury Note yield may probe well above its prior high.  The 10-year Treasury Note auction is being held today.

(8:35 am)  SPX futures are probing toward the Ending Diagonal trendline at 3890.00.  There now appears a concerted effort to gain altitude in equities and suppress the VIX as we come into a very newsworthy day.

(9:20 am) ZeroHedge writes, “”This Is Nuts!” – Stocks Explode Higher After Fabricated CPI Print”

ZeroHedge reports, “U.S. equity futures and global markets drifted without direction on Wednesday as the rally in tech shares stalled and U.S. bond yields ticked higher ahead of a critical 10Y bond auction while investors nervously awaited a reading on inflation later in the day amid fears that the economy could potentially overheat. As Reuters puts it, “it all seemed a bit subdued” after Tuesday’s roaring 20% surge in electric car doyen Tesla, 4% jump in the Nasdaq and biggest one-day gain for global heavyweights Amazon and Microsoft in well over a month.


NDX futures are lower, having bounced off the neckline/lip trendline in the overnight session.  The NDX is the most bearish of stock indices while the DJIA just made a new all-time high at 32150.32 yesterday on weakening momentum.  The great rotation from growth to value ma be over, bu t will it favor growth again, as some pundits declare?

(8:40 am)  ZeroHedge reports, “All eyes this morning are on consumer prices as we near the precipice of last year’s collapse and the (artificial) explosion in year over year comps that the short-term collapse will create (temporarily, if The Fed is to be believed). February consumer prices rose at 0.4% MoM – the fastest pace since July, lifting the year-over-year price rise to 1.7% – the highest since Feb 2020…

Source: Bloomberg

This is the ninth straight monthly advance in consumer prices.”


VIX futures made a new low at 22.97 this morning, testing the upper boundary of the massive gap left a year ago.  Last year starting on February 24th, the VIX rose from 17.53 to 49.48 in 4.3 days.  Will we see something similar this week?


USD futures are modestly higher as it awaits the news of the CPI and 10-year Treasury auction.  The USD normally would rise to is mid-Cycle resistance at 92.74 or the 200-day Moving Average at 93.11.  However, demand for USD may skyrocket should the 10-year yield approach 1.7%.


TNX futures made a high of 15.66 this morning and appear to be on their way to challenge the previous high.  As mentioned previously, TNX has remained pined near the high and should remain so for another day or so, despite the very long Master Cycle.  Today is day 278 in the current Master Cycle.  Trending strength is set to expire tomorrow.


6:15 am

Good Morning!

I am starting early to highlight where we may be in the Cycles schematic.  One probability shown here (not my highest choice) is that we may have seen the culmination of the Master Cycle on March 4 (day 249).  Three strikes against it are (1) It’s early. (2) It’s shallow, and (3)  It leaves 74 days to the culmination of the next Master cycle in mid-May.

The best alternate view is that the (current) Master Cycle is missing a panic decline that may end at the close of Monday, March 15 (day 259) or early on Thursday March 18 (day 262).

It is likely that if we see the decline extend until next week, we may see a hockey stick save into options expiration and an attempt to restore confidence in the markets through the end of March.  It should be a very active month.


Posted in Published | Comments Off on March 10, 2021