
12:52 pm

SPX may be completing its Head & Shoulders formation imminently. The right shoulder reaches equality with the left shoulder at 3900.12. In this case it may be stopped by Short-term resistance at 3878.64. The last three weeks have been whipsawing investors in both directions. Remember, lower lows and lower highs signify a probable change in trend, regardless of the number of people buying the dip.
One thing overlooked by investors is the declining population. ZeroHedge comments, “Next to language, money is the most important medium through which modern society communicates. The Federal Reserve is responsible for signaling how fast this money should be created or destroyed via its federal funds interest rate. When demand is high and capacity/supply low, the Fed should ideally make rates low to support growth of loans to boost capacity/supply. When demand is low and capacity/supply high…the opposite. Instead, the Fed is doing the inverse…trying to focus on getting consumers to use more credit/debt (think record low mortgage rates) to create more demand and necessitate higher capacity (think homebuilders).
In a ridiculously difficult chart to decipher below (so I’m told), I highlight the year over year change in working age population (yellow shaded area), year over year change in employees among them (grey shaded area), housing permits (blue line), and the 30 year mortgage rate (white line…driven by the Federal Reserve’s federal funds rate and MBS purchasing). The current situation of soaring permits against declining working age population and tanking employees among them…overridden by the speculative fervor created by record low mortgage rates is a case in point.”
12:33 pm
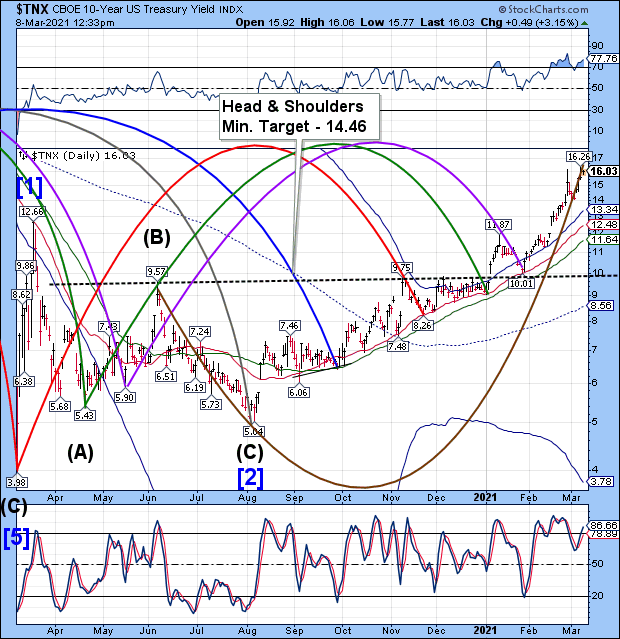
TNX is above 16.00 again. As mentioned earlier, the 10-year rate may stay pinned near the top if not going higher this week. I made an error in announcing the 10-year auction on March 4. That was supposed to be the announcement date. The actual auction is to be held on Wednesday, March 10, according to TreasuryDirect.
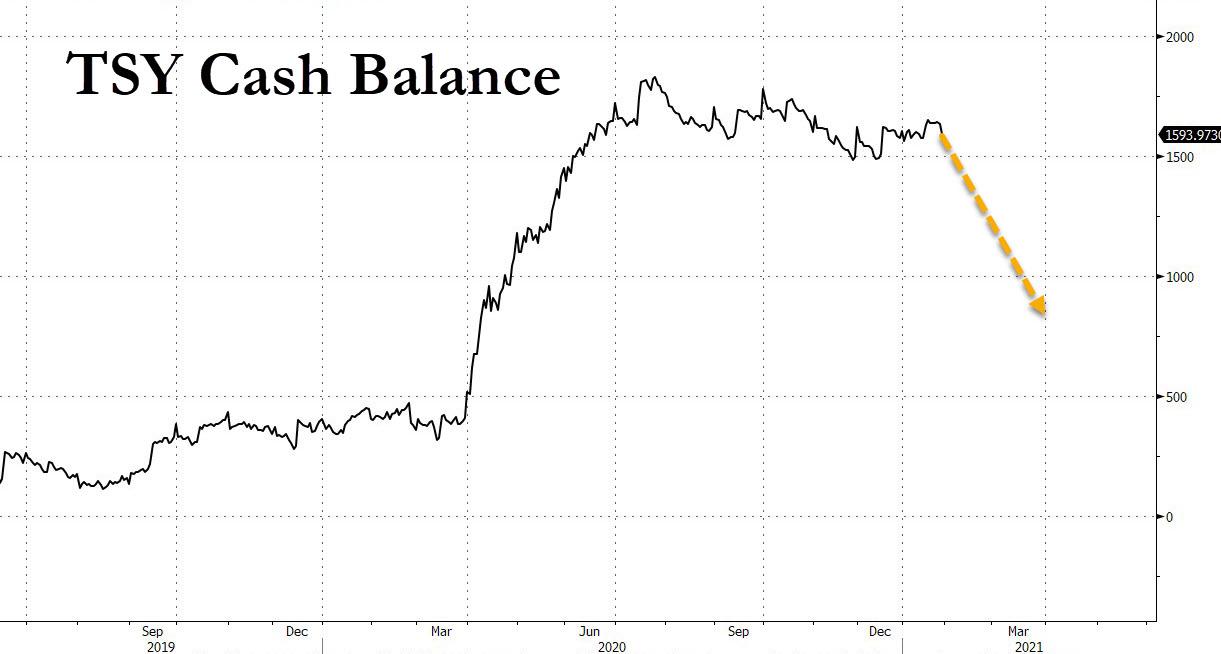
ZeroHedge updates us on the Liquidity Tsunami, “Exactly one month ago we explained that the US economy and capital markets were about to be flooded with a $1.1 trillion liquidity wave as the Treasury drew down the amount of cash held in the Treasury General Account which would plunge to just $800 billion by March 31, down a record $929BN from $1.729 trillion at Dec 31, 2020.
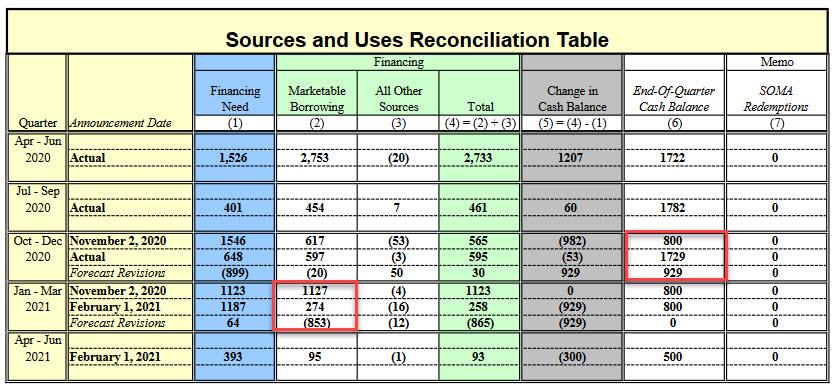
In other words as of early February, the Treasury expected the decline in the cash balance this quarter – which is being spent to fund last December’s fiscal stimulus – to be the main driver of funding needs.
This matters, because as we and repo guru Zoltan Pozsar explained (here and here), this massive flood of liquidity entering the market would trigger a multi-faceted domino effect across assets, potentially pushing funding rates (FRA-OIS, repo, etc) negative, even as the glut of “safe collateral” hit demand for longer-duration, resulting in curve steepening and higher yields in longer-dated paper. And since the market is now extremely sensitive to any yield increases – reflationary or otherwise – a paradox emerged: despite over $1 trillion in liquidity hitting the market, the impact on risk assets would be largely negative.”
12:10 pm

NDX was repulsed at the neckline, a common occurrence for a Head & Shoulders formation. The NDX has turned bearish again, having lost all near-term supports. The next probable support lies at 10957.00, beneath the minimum target for the Head & Shoulders formation and possibly beneath the 200-day Moving Average at 11538.00..
RealInvestmentAdvice observes, “In a “market mania,” retail investors are generally “long confidence” and “short experience” as the bubble inflates. While we often believe each “time” is different, it rarely is. It is only the outcomes that are inevitably the same.
I recently penned an article about Charles Mackay’s book “Extraordinary Popular Delusions And The Madness Of Crowds.” As noted, that book was an early study in crowd psychology. To wit:
“Essential is the understanding of the role psychology plays in the formation and expansion of financial manias. From the 1711 ‘South Sea Bubble’ to the 2000 ‘Dot.com crash,’ all bubbles formed from a similar ‘panic’ by investors to chase ongoing speculation.”
A recent UBS survey revealed some fascinating insights about retail traders and the current speculation level in the market.”
8:00 am

Good Morning!
NDX futures are down this morning after testing the neckline, but not beneath Friday’s low. There is a good probability that the failed test of the neckline is all that is needed to resume the decline.
ZeroHedge reports, “US equity futures and global markets jumped higher at the reopen of Asian trading late on Sunday following news of the Senate’s passage of the Biden $1.9TN stimulus plan and the spike higher in oil following the Houthi drone attack on Aramco facilities in the Gulf, but have since dipped amid renewed reflationary fears which pushed Treasury yields as high as 1.61% overnight hitting tech stocks with lofty valuations even as value stocks and European markets were broadly in the red. After rising above $71, Brent has since faded gains and was last trading near where it closed Friday at $69. Bitcoin soared as HK-based firm the latest institution to convert cash into Ethereum and Bitcoin.
At 7:10 a.m. ET, Dow e-minis were down 16 points, or 0.07%, S&P 500 e-minis were down 16.5 points, or 0.44%, and Nasdaq 100 e-minis were down 154.25 points, or 1.20%.
Futures tracking the Nasdaq 100 index sank as much as 2%…

… as the passage of a $1.9 trillion COVID-19 relief package by the U.S. Senate lifted bond yields, pressuring richly valued technology stocks and sparking inflation concerns. As a reminder, on Saturday the Senate passed the stimulus package – the biggest in U.S. history – and President Joe Biden said he hoped for quick passage of the revised bill by the House of Representatives so he could sign it and send $1,400 direct payments to Americans. According to JPMorgan, every $1 trillion of fiscal stimulus adds around $4-$5 to companies’ earnings per share, implying 6-7% upside for the remainder of the year.”

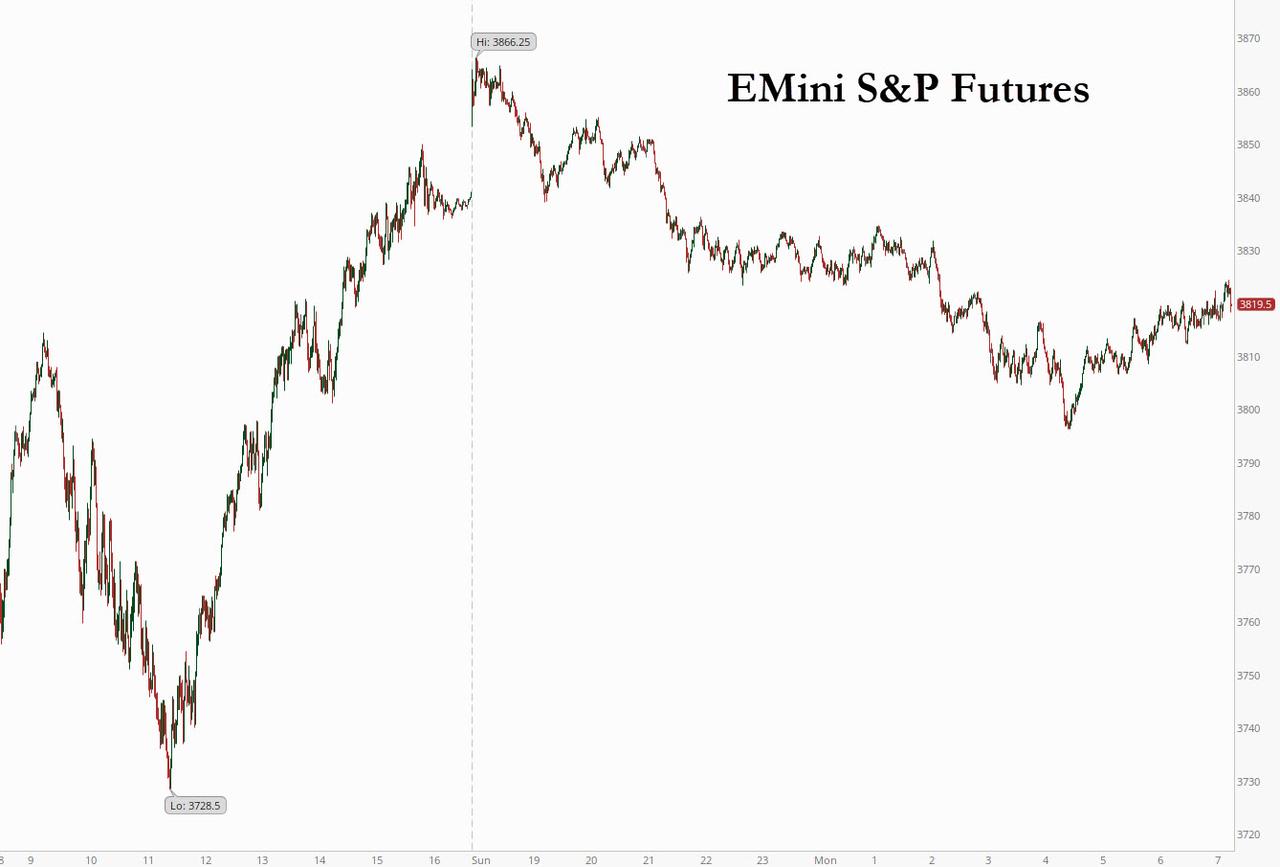
SPX futures are challenging the 50-day Moving Average at 3814.46, having reached a low of 3796.38 earlier this morning. The next support is the 1-year trading channel trendline at 3790.00. The Cycles Model suggests the decline may continue through this week. The loss of near-term supports portends an acceleration of the decline into a panic selling rout.
ZeroHedge comments, “Something bizarre is happening in the stock market: for the past three weeks stocks – and especially tech – has gotten hammered, with the Nasdaq briefly sliding into a 10% correction while the S&P has also been hard hit (although one can’t say the same for reflation stocks such as energy which have soared in recent weeks). Some other notable casualties: Apple has tumbled 15% since late January. Tesla has lost more than a quarter-trillion dollars in market value in three weeks, and more than $1.5 trillion has been wiped off the Nasdaq in less than a month.
And yet, despite this hit to risk assets on the back of the recent in surge in interest rates, accompanied by a parallel spike in both the VIX, and its bond market equivalent, the MOVE index…
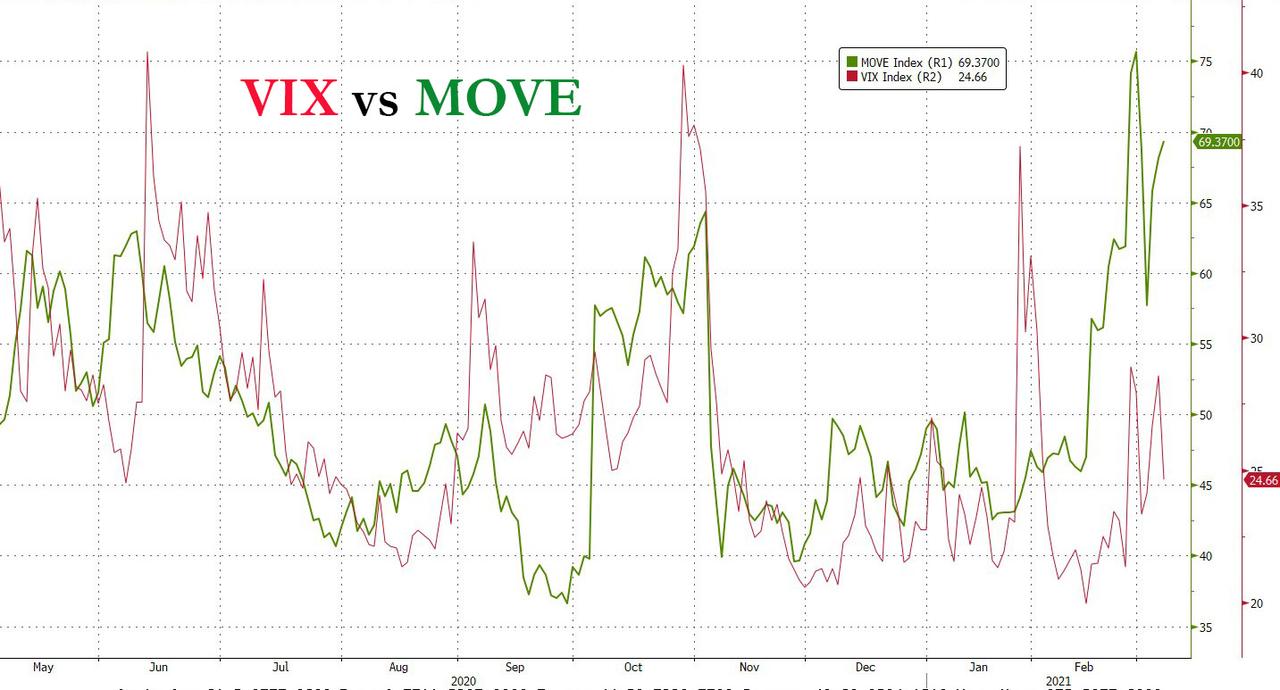
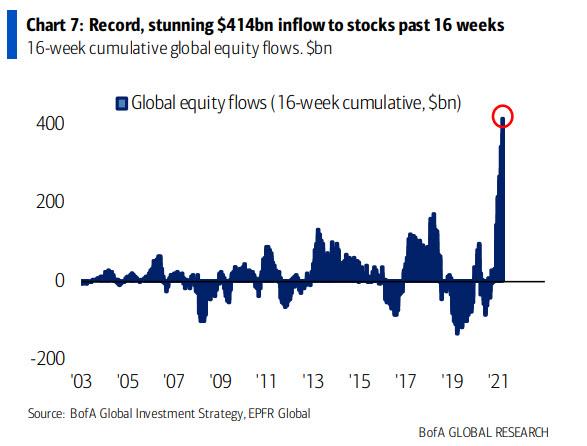
… on Friday we reported that according to the latest EPFR fund flow data, $22.2Bn in new money flowed into equities last week, following the previous week’s massive $46.2Bn inflow which was the 3rd biggest on record, bringing the total 16 week inflow to $436BN, a stunning burst of inflows as shown in the chart below.

The decline in stocks has pushed the VIX back above its mid-Cycle resistance at 25.97, but not to new highs, yet. There is no commentary on the VIX as the assumption is that we have seen al this before…

TNX has hit a morning high of 16.13 thus far. That leaves Friday’s high as the potential high for a very stretched Master Cycle (273 days). Unfortunately, the next four days show an extraordinary trend strength in the Cycle that may extend it even further, or at least keep yields pinned near the high for the rest of the week.
RealInvestmentAdvice explains, “Eric Hickman discusses the recent signal to buy 30-year bonds.
A technical indicator with a reliable history is signaling that 30-year Treasury yields will soon decline.
A relative strength index (RSI) can be measured for any price series and represents how much and frequency gains are occurring versus losses. The index is used as a contrary or turning-point indicator. After periods of strong, persistent selling, buying is expected and vice versa.
It isn’t a complicated calculation. The RSI takes the average price change of days with gains compared to the average price change of days with losses over the last x days. This is converted into an oscillator that can take any position between 0 and 100. When prices (or yields) are rising fast and persistently, the oscillator will approach 100; when selling occurs with lower prices, it will approach 0. The oscillator spends most of its time in the middle, say between 30 and 70. Extreme readings (close to 0 or 100) happen rarely. We can study these extremes historically to see how useful the index is at identifying major turning points in markets.”

USD futures hit a new retracement high at 92.34 this morning. This makes US assets more valuable to foreign investors, especially bonds. The rally in USD may last until mid-April.