February 22, 2021

February 22, 2021

8:00 am

Good Morning!

SPX futures have fallen to test Short-term support at 3866.44 this morning, having made a low of 3861.38 thus far.  This may be a result of the gamma-driving options market that kept SPX above 3900.00 most of the week.  As the call options fall away at expiration, the dealers can now relax now that the options market no longer acts like the tail wagging the dog.  One thing is certain, however.  Investors may have had a change in sentiment, or rather I should say the longer-term puts that remain may now have a greater influence on the SPX going forward.  The options market turns negative below 3850.00.

ZeroHedge reports, “After a week when everyone was focusing on the i) blowout in bond yields and ii) how much worse it could (and would) get, it got worse on Monday, when the 10Y yield jumped from Friday’s close of 1.34% to 1.39%…

…. while the 5s30s (the gap between 5- and 30-year yields) blew out to the highest level in more than six years…

Following a weekend in which the main news was “The Big Short” Michael Burry predicting Weimar-style hyperinflation, there have also been real-life indications of soaring price pressures to back up the market moves. Last week we saw 6-sigma beat in retail sales and PPI, hinting a scorching overheating in the US economy, while PMI surveys indicated record inflationary pressures. Even in Europe, the prospect of inflation is being entertained. It’s so bad that even sworn bond bulls such as HSBC strategist Steven Major abandoned his recommendation to buy U.S. long bonds, saying he “cannot ignore” the reflation trade.”


TNX futures reached a high of 13.59 this morning, not quite blowing out Friday’s high at 13.62.  However, the threat remains that TNX may reach its Head & Shoulder target at 14.46 in the next few days.

ZeroHedge advises, “For many months, traders and strategists have been warning – and dreading – a sharp spike higher in both nominal yields and real rates, and last week they finally got it with Real Yields finally surging the most since March…

… and joining the historic post-covid rally in Breakevens…

… sent 10Y yields to 1.36% the highest level since the pandemic and just 14bps away from the 1.50% level that Nomura predicted would hammer stocks as systematic, quant and CTA funds start actively shorting 10Y futures.”


VIX futures reached a high of 25.09 this morning, crossing above the 50-day Moving Average at 23.41 and creating a buy signal.  We would want to see the SPX decline beneath short-term support at 3866.44 in combination with the VIX above the 50-day for a SPX sell signal.


NDX futures made an overnight low at 13364.75, gapping through both trendlines.  This creates a sell signal for the NDX.  NDX is on the same Master Cycle as the SPX.  This may be a very fast decline ending between February 26 and March 4.

ZeroHedge reports, “ARK Invest’s Cathie Wood joined CNBC’s Scott Wapner last week. She warned of the increasing risk of a stock market correction if rates continue to “sharply” rise.

Around the 3:30 minute mark of the CNBC video, Wood told Wapner, “I do believe if rates were to take a sharp turn up, that we would see a valuation reset and our portfolios would be prime candidates for that valuation reset of course.”


USD futures have eased to 90.21 this morning, above Friday’s low of 90.17.  Today is day 257 in the Master Cycle, so there may be room for a further decline.  There is an alternate view that the February 6 high may have ended the current Master Cycle early.  If so, the USD may go into a deep dive to the Broadening Wedge target as early as mid-April.


I am probably one of the few market commentators that keep the very long view of the markets.  They help inoculate me against those who would call for a new Super Cycle bull market in oil.  What this chart is showing is an unfinished Ending Diagonal in a (still) secular bear market.  I am willing to be wrong should WTIC rise above the monthly mid-Cycle resistance at 63.12.  However, today is day 252 in the current Master Cycle, suggesting that the rally is nearly over.  The next Master Cycle (low) is not due for another 6 weeks.  A lot can happen in that time.

Posted in Published | Comments Off on February 22, 2021

February 21, 2021

February 21, 2021

9:00 pm

Good evening!

When I first started reading about winter storm Uri, I felt sorry for those poor people in Texas who were unprepared for what was about to happen.  Then I found out that my web server is located in Texas!  By Friday there was only partial restoration, which meant that many parts of the country still could not access this website, including my own location.  The world wide web is a lot more intricate than I could have imagined.  Anyway, The Practical Investor is back in business.

One of my thoughts was to create a backup plan for a downed server.  This means that I would have to re-start a subscription plan and use emails as a backup.  No decision has been made yet.  However, if you agree with the idea please email me at tonycherniawski@gmail.com.  My decision to continue with a “Plan B” backup plan would be appreciated.

In the meantime, I have updated my Cycles chart.  The last Master Cycle landed on January 29 at day 260.  The next Master Cycle is due as early as Friday, February 26 (day 256), but may last until March 4 (day 262).  I will be monitoring this for signs of expected completion this week or next.


VIX is hovering just above a one-year old gap between 17.08 and 22.19 that remains unfilled since last February 24.   This gap has been tested but not filled for the past six months and it is my belief that it will hold for two reasons:  First, gaps in a trending market often remain unfilled until the trend changes.  That suggests the trend began in December 18, 2018 at 8.90 with higher lows ever since.  The second reason is that the Master Cycle low was made on February 10 at 19.69 with the next Master Cycle (high) due the same time as the SPX.

Last week ZeroHedge remarked, “Specifically, McElligott explains that “volatility is the exposure toggle” in modern market structure risk management – whether a discretionary / active manager on VaR, a risk-parity fund, a systematic CTA Trend fund with a specific vol target, a variable annuity with downside protection triggers, tactical allocation models from roboadvisors etc..

In other words, this means that the size of a position is set to be inversely proportionate to the instrument’s volatility.

The reason all this could be of concern is the worrisome echoes from Feb 2018, home of the “Volmaggedon” Equities Vol shock, driven by the extinction event for most of the leveraged VIX ETN space on account of their impossible supply or demand needs of VIX futs at end-of-day rebalancing, and eerily triggered by Fed policy-tightening concerns after a series of better than expected inflation / price data over the month of January culminated in a big CPI beat the Friday prior to “Volmageddon” on Monday, which “waterfalled” into crescendoed SPX selling, -6.5% in 2 days.”


TNX is “in the window” for a Master Cycle high, but thus far may not have made it.  TNX futures have reached a weekend high of 13.94, suggesting a higher open on Monday, day 262 of the Master Cycle.  A sudden spike to 15.00 may cause a panic sell-off in equities and a spike in volatility, even with a pullback hat is bound to follow.  Remember my comments that the Head & Shoulders target was due to be met in the current Master Cycle, so we may see the fireworks begin tomorrow at the open.

ZeroHedge observes, “For many months, traders and strategists have been warning – and dreading – a sharp spike higher in both nominal yields and real rates, and last week they finally got it with Real Yields finally surging the most since March…

… and joining the historic post-covid rally in Breakevens…

… sent 10Y yields to 1.36% the highest level since the pandemic and just 14bps away from the 1.50% level that Nomura predicted would hammer stocks as systematic, quant and CTA funds start actively shorting 10Y futures.”

Posted in Published | Comments Off on February 21, 2021

February 12, 2021

February 12, 2021

12:55 pm

The SPX rose to 3924.90 at noon today and has eased away from the high.  The hourly interval for this hourly Cycle appears to be 17 hours (17.2).  The prior Cycle interval was 13 (12.9).  The additional time may allow larger declines which are more likely to violate supports and set off a negative gamma panic.

There is a battle for the hearts and minds of investors that has been evident this week.  Should the market close today beneath 3870.00 (last week’s close), we may see a perfect setup for an opening gap down on Monday.

ZeroHedge observes, “With stonks hitting an all time high earlier this week, we finally have a convergence between flows and stock movement, because according to BofA last week saw the largest equity inflows ever at a whopping $58.1bn, coupled with a “hearty” $13.1bn into bonds, $0.8bn out of gold, $10.6bn out of cash.”


7:00 am

Good Morning!

SPX futures are hovering just above 3900.00 as the battle between the bulls and bears is staged in the options market.  Retail speculators are buying calls and, should the SPX move appreciably higher, the next big strike position may be at 3950.00.  Today’s action may take the SPX as high as the Cycle Top/trendline resistance at 3928.76.

However, the dealers and hedge funds are wary of being hung out to dry should the SPX dive beneath 3900.00, having gamma covered at 3900.00 or even 3950.00.  Put options positions outnumber calls beneath 3850.00, which is gamma negative.  Short-term support is at 3845.03, where the (aggressive) sell signal is likely to be confirmed.  SPX is vulnerable to a deeper correction beneath that support and a crash beneath 3800.00.

ZeroHedge reports, “US futures and European markets rebounded from a slump that dragged the Emini as low as 3,890 just ahead of the European open, to trade near session highs as investors await progress towards more U.S. fiscal stimulus, while the dollar was set for a weekly loss despite snapping a five-day losing streak on Friday; Bitcoin hit another record high overnight when it briefly traded above $49,000. Markets in China and most of Southeast Asia were closed for the Lunar New Year.

At 7:30 a.m. ET, Dow E-minis were down 27 points, or 0.1%, S&P 500 E-minis were down 7.25 points, or 0.2% and Nasdaq 100 E-minis were down 15.25 points, or 0.11%.”


VIX futures rose to a high of 22.45 in the morning session, while the low was 21.51, a positive development.  Using the short volatility trade and equity call options to force the market higher (tail wags the dog) may have reached its limit.  This may be an accident waiting to happen.  Meanwhile, the euphoria and use of leverage is off he charts again, typical “point 5” of a Broadening Top formation in equities.


USD futures rose to test the trendline at 90.66 overnight.  It may resume its decline shortly, causing consternation in the options/futures market.  A sudden decline may put the dealers in a position of having to sell even more to gamma hedge in favor of the short sellers.  The Master Cycle is due to be complete in the week after options/futures expiration.

Posted in Published | 2 Comments

February 11, 2021

February 11, 2021

1:45 pm

TNX has clearly resumed its rally toward the Head & Shoulders target.  This may happen by options expiration, so this rally may be gamma-driven and potentially explosive.  Today’s 30-year auction may be a catalyst.  The Cycles Model cites a triple strength week starting this weekend.

ZeroHedge reports, “After two mediocre coupon auction earlier this week, the Treasury closed off the refunding week with the sale of 30Y paper in an auction which tied the previous record at $27 billion…

… yet which was subpar in virtually every category.

The high yield of 1.933% was the highest since February, up more than 10bps from January’s 1.82% and tailed the When Issued 1.923% by 1bp.

Hinting at a lack of investor demand was the sharp drop in the bid to cover which slumped from 2.472 to 2.176, far below the 2.33 recent average and the lowest since August.”


11:02 am

SPX has been repelled at trendline and Cycle Top resistance at 3926.91 this morning with a high of 3925.99.  We now anticipate the decline may get underway.  The next downside “correction” target appears to be Short-term support at 3841.84…or possibly the trendline at 3800.00.

However, the time for the decline may be 12.9 market days.  Therefore, should the SPX decline beneath 2800.00, it may go much lower.  The minimum structural decline appears to be “Point 6”  of the Orthodox Broadening Top at 3550.00, a 10% decline.  However, this decline has crash potential with a much deeper potential “Point 6” for the 3-year Orthodox Broadening Top near 2100.00, a potential 47% decline.  Does anyone feel lucky?


9:50 am

Introducing the GSCI Agricultural Index, to be replacing DBA, an ETF.  I want to show why The Ag Index may be on Cycle Wave III of Super Cycle Wave (V).  The test of this hypothesis may come very soon.  In an inverse of the CRB (monthly) Index, the GKX may now decline in Wave C of Primary Cycle Wave [4].  The key support is at the top of Primary Wave [1] at 312.94.  Wave C cannot decline beneath that level without changing its structure and making a new low beneath 252.23.  On the other hand, should it remain above that level, it may rally as high as the September 2011 high at 570.20 later this year or early next.  Right now, a significant 50% correction may be in order.

ZeroHedge reports, “Chicago Board of Trade corn futures have faded 7-1/2 year highs after the U.S. Department of Agriculture (USDA) projected supplies of the grain would be well above market expectations.

“Corn led the sell-off as the USDA only minimally trimmed its U.S. end-of-season stocks outlook and raised its export forecast by less than many traders had anticipated following record-large sales to China,” according to Reuters.

“The surprise in the report is that the government only took (U.S. corn) exports up 50 million bushels despite the fact that we had huge Chinese buying,” said Don Roose, president of U.S. Commodities.”


8:00 am

Good Morning!

This is an unusual beginning, but I am posting this as an observation and a probable warning.  An analyst with top credentials is coming out with an announcement that commodities have begun their next supercycle.  If he is reading the Elliott Waves, he may conclude that the CRB index may have completed a Cycle Wave a-b-c correction to 101.48 and a new Cycle Wave may have begun.

He may be right.  There is a simple way to find out if this is true.  Cycle Wave IV is approaching its mid-Cycle resistance at 196.58, which by Cycle standards, should stop this rally cold. If the rally exceeds the mid-Cycle and, more importantly, invades the territory occupied by Cycle Wave I starting at 200.16, he is likely to be correct.  If it falls short, then the Wave structure you see may be correct, suggesting a massive decline to single digits before the new Super Cycle begins.

The icing on the cake is that we may see a reversal of this rally in the next 1-2 weeks, with a target date at options/futures expiration.  The exception to this chart is Ag Products, which appear to have completed Cycle Wave V last July.

ZeroHedge observes, “Having dabbled in the fields of viral epidemiology and presidential polling, JPM quant Marko Kolanovic is set to conquer yet another “cross-asset”: commodities.

Two days after Dylan Grice published an article “The Stage is Set for a Bull Market in Oil“, with various commodities around the world soaring, and the price of oil up a stunning 64% since November, today Marko Kolanovic made a bold prediction – that the world has entered a new commodity supercycle:

It is generally agreed that over the past 100 years, there were 4 Commodity supercycles and that the last one started in 1996 . We  believe that the last supercycle peaked in 2008 (after 12 years of expansion), bottomed in 2020 (after a 12-year contraction) and that we likely entered an upswing phase of a new commodity supercycle.”


Yesterday the SPX touched its daily Cycle Top resistance at 3930.00.  This morning SPX futures topped out at 3918.38, making what appears to be a corrective (partial) retracement.  Today we may find out whether the decline has indeed begun.

ZeroHedge reports, “Global shares rose for a ninth day in a row on Thursday, just off record highs, with much of Asia closed as investors digested recent gains, while bulls received a twofer of food news after a benign U.S. inflation report and a dovish Federal Reserve outlook.  Nasdaq 100 Index futures reversed yesterday’s losses and technology stocks led the advance in Europe. S&P 500 futures were 0.3% higher following Powell’s “sobering” comments on the labor market that should continue to fuel stimulus optimism, reinforce the Fed put, and assuage some inflation concerns. Powell said the true unemployment rate is 10% (when normalizing for covid losses) implying that there are years to go before tightening is needed.”


VIX futures stayed above yesterday’s Master Cycle low, declining to 21.65.  Currently it is hovering beneath yesterday’s close.

10:15 am

ZeroHedge reports, “The past weeks has seen an odd bifurcation in the VIX term structure, with spot tumbling after the reddit short squeeze phenomenon fizzled as hedge funds re-grossed even as the rest of the VIX curve remains surprisingly sticky… and high.

In his latest note, Nomura’s Charlie McElligott discusses the two sets of distinct factors that are behind this divergence, starting with spot, where he says that after we had seen the vol market really only pricing “chop” to outright “crash-down” prior to the past week with action dominated by puts, we are starting to now see investors increasingly grab for “crash-up” in the index too (i.e., VIX moving higher on call buying), where after seeing 0%ile 3m SPX upside call skew just two Fridays ago “we now see to a move higher to ~30%ile SPX upside call skew since as the upside got really cheap.”

This is why he thinks there probably “isn’t a lot lower to go in implied vol from here” anchoring the front VIX at 20-22, and instead we are more likely to reprice higher into a tape breakout higher – as yet another marketwide gamma meltup emerges “and this grab into index upside tails is turning vol-of-vol VVIX higher again too.”


TNX bounced from the Cycle Top support at 11.29 this morning after making a low of 11.31 yesterday.    This suggests the Master Cycle may end at a high in the last week of February.  The Head & Shoulders target is not an unreasonable goal for this Master Cycle.  The 10-Year Treasury auction helped reinforce the trend.

ZeroHedge reports, “While there were some concerns about the demand ahead of today’s 10Y auction, they quickly evaporated after today’s CPI miss which promptly pushed yields to session lows amid a bout of short covering, which eliminated fears about chasing into the auction or unmet concessions. And sure enough, moments ago, as part of the month’s refunding, the Treasury sold a record $41 billion in 10Y notes, matching the all time notional high from November.

The auction priced at a high yield of 1.1550%, stopping through the When Issued 1.157% by 0.2bps, and down slightly from last month’s 1.164% if a far cry from the record low yields hit in early 2020.”


USD futures declined beneath critical support at 90.36, hitting a low of 90.25.  This decline may now pull the plug on foreign investors choosing US stocks.  A look at the SPX denominated in the Euro and the Yen show a decline already in progress, but sitting on Cycle Top support.  Today’s decline in the USD coupled with a weak close in the SPX may break that support just as the weekend begins, opening the door for a weekend sell-off by foreign investors.

Posted in Published | 1 Comment

February 10, 2021

February 10, 2021

10:45 am

VIX has crossed above the 50-day Moving Average, giving us an aggressive buy (SPX sell) signal.  The NYSE Hi-Lo Index is at 491.00, due to the opening probe to the new high in the SPX (after a huge liquidity injection).  I don’t expect it to register a sell signal today after reaching such a lofty peak, but it may close at a much lower level.

ZeroHedge observes a small move higher.

10:33 am

SPX has made a key reversal in the first hour of the cash market, making a new all-time high, then plummeting beneath yesterday’s low at 3902.64.  It has reversed at trendline and Cycle Top resistance at 3921.99.  This is an opportunity for an aggressive sell signal.

VIX has approached its 50-day Moving Average at 23.38, making a high of 23.27 thus far.  We’re sitting on the edge of a powerful decline in the markets.

ZeroHedge opines, “We have seen most things melt up lately and sentiment is getting rather extreme again. The GME VaR shock is gone and risk on is the name of the game again (yes markets surged for a long time after LTCM, but that event was different as they were too big to fail…).

We are not calling an imminent top about to happen right here, but looking at some protection is starting to make sense. One of our mantras is to “not chase protection when you must, but when you can”.

Various readings are showing rather stretched stats. The percentage of NYSE stocks above the 200 day moving average is at extreme levels.

We are upgrading earnings revisions at an extreme pace. There are many other charts to be added showing basically similar levels of stretched sentiment.”


9:00 am

At 8:15 am the SPX futures jumped again, adding approximately 76.5 billion of NAV.  The daily Cycle Top resistance is at 3930.00 this morning, which may put a lid on the rally.

ZeroHedge observes, “If you’re over 40 you’ve lived through at least three epic financial bubbles: junk bonds in the 1980s, tech stocks in the 1990s, and housing in the 2000s. Each was spectacular in its own way, and each threatened to take down the whole financial system when it burst.

But they pale next to what’s happening today. Where those past bubbles were sector-specific, which is to say the mania and resulting carnage occurred mostly within one asset class, today’s bubble is spread across, well, pretty much everything – hence the term “everything bubble.”

When this one pops there won’t be a lot of hiding places.”


7:15 am

Good Morning!

SPX futures are higher this morning, after an all-time futures high at 3924.12.  At 6:00 pm an entity injected enough money into the SPX futures to add approximately $68 billion of value to the index.  At 2:00 am another $42.5 billion was added.  While correlation is not causation, the only entities that can moves such sums are central banks.  In the last 7.5 days, approximately 1.879 trillion has been added to the SPX alone.  This, my friends, is not retail investors spending their stimulus checks.  Nor is it “money on the sidelines” that was waiting to be invested.  Investors were already “all in” with leverage.  In 6 of the last 8 days, most or all of the daily gains were made in the overnight futures.  What we see here is a market that is out of control, although no one recognizes it yet.

As of 12-31 the Velocity of Money is  1.129.  This measures the marginal effect of borrowed money on the economy.  The yield on the 10-year Treasury Note was 1.157 as of yesterday’s close.  Folks, we are sliding backwards!

ZeroHedge reports, “Global shares continued their euphoric ways, rising for the eighth day in a row, reaching record highs as market sentiment was improved by the prospect of U.S. fiscal stimulus and vaccine rollouts. U.S. stock futures also rose to new all time highs, hitting 3,924 before paring some gains, suggesting a resumption of gains after a one-day break as earnings and optimism over improving virus trends helped support sentiment while investors looked to inflation data and a speech by Federal Reserve Chair Jerome Powell for clues on the pace of an economic rebound.”


VIX futures are down after rising to 21.82 in the morning session, then dropping to a new low at 19.69.  What I don’t want to see is the VIX declining to 19.51 or lower. However, the short vol trade is getting very crowded.  Today is day 274 in the Master Cycle.


TNX tumbled toward Cycle Top support at 11.24 this morning.  The Cycles Model suggests another week of decline, possibly toward Intermediate-term support at 10.56.

ZeroHedge reports, “US Consumer Prices were expected to rise for the 8th straight month in January and it did rising 0.3% MoM as expected, leaving year-over-year prices rising at 1.4%…

Source: Bloomberg

However Core CPI missed expectations, unchanged in January compared to an expected 0.2% MoM rise.


USD futures declined beneath Intermediate-term support at 90.35 this morning.  This decline tracks potential money flow out of the US.  The Cycles Model suggests that this trend may continue through late February.

Posted in Published | 1 Comment

February 9, 2021

February 9, 2021

2:40 pm

SPX is bumping along the underside of a double trendline at 3918.00.  A reversal from this resistance may be severe, especially on day 271 of the Master Cycle.  The hourly Cycles have been remarkably precise , with turns at 13-hour intervals.  3:00 pm is hour 78 where, if true to the pattern, is the next reversal.

ZeroHedge notes, “After a brief rally overnight, US futures have pulled back, under what appears to be the mysterious (well, not so mysterious) ‘gamma gravity’ of excess options positioning, back to the 3,900 “Call Wall” level.

Source: Bloomberg

As SpotGamma notes this morning, the positive gamma at 3900 remains quite a bit larger than overhead strikes, indicating it will hold as major resistance for a few days. From from an intraday trading perspective we anticipate another tight trading range today (~80bps), with that large 3909 resistance bar shifting down to 3893 support.”


8:15 am

SPX futures have pulled back to round number support at 3900.00 after dipping beneath the Cycle Top at 3906.27.  This may be considered an aggressive sell signal, but further confirmation is advised.  Yesterday’s high is at day 270 in the Master Cycle.  The smaller Orthodox Broadening Top has a target near 2800.00.  The next Master Cycle ends during the first week of March.

ZeroHedge reports, “The roaring stock rally of the past six days week took a breather on Tuesday, with futures dipping from a record high of 3,913 as investors sifted through earnings and weighed the impact of soaring inflation expectations which saw 10Y Breakeven rates hit 7 year highs amid signs the Biden administration is committed to passing a sizable aid bill..

The MSCI All-Country World Index edged up 0.1% to its own record high, although early moves in Europe’s top indexes suggested further gains may be tougher to find, with Britain’s FTSE 100 flat on the day even as a record high close for Wall Street overnight gave Asian stocks the confidence to push on further, with MSCI’s broadest index of Asia-Pacific shares outside Japan up 0.3%, led by Chinese blue chips, up 2.2%.

European equities turned red after a choppy start even as bitcoin powered on, rising above $48,000 overnight following widespread speculation that more companies will follow Tesla in purchasing the cryptocurrency outright. Oil reversed its recent rally while the dollar slide accelerated.  Futures for the S&P 500 were modestly in the red, suggesting a quiet start to the U.S. trading day.”


VIX futures made a morning high of 22.10 and climbing.  The 50-day Moving Average is at 23.37.  A move above that level gives us our buy signal in the VIX.  The next Master Cycle is due to extend to the first week of March.


TNX appears to be in consolidation, possibly seeking support at the Cycle Top support line at 11.17.  The current Master Cycle has 1-2 weeks left before a significant pause in the rally.

ZeroHedge reports, “Between global central bank money-printing, government fiscal support out the wazoo, and hopes for vaccine-related developments, the world and his pet rabbit is betting on inflation (and just as confidently, central planners are sure they can tame the beast should it ever get out of hand).

“It’s hard to resist this reflation trade at the moment,” said Christoph Rieger, head of fixed-rate strategy at Commerzbank AG.

“With policy all one-way and U.S. refunding coming up this week, we may require some more concessions.”

‘Inflationary’ signals are evident everywhere :

The Treasury curve is at its steepest since 2015…

Source: Bloomberg

Commodity prices are exploding…

Posted in Published | 2 Comments

February 8, 2021

February 8, 2021

10:45 am

DBA broke through neckline resistance at 16.65.  This suggests a major push to the H&S target at 20.17 by the middle of March.


8:00 am

Good Morning!

SPX futures were repelled at round number resistance at 3900.00 at 2200 hours yesterday and have pulled back.  There seems to be no impulse to go higher at this time.  Today is day 270 in the current Master Cycle and it is stretched.  A possible move would be Key Reversal in which SPX opens at a new high, then closes beneath Friday’s low at 3874.93.

ZeroHedge reports, “World stock hit a record high as did Emini S&P equity futures, which topped 3,900 on Monday, while the 30Y TSY hit 2.00% and Brent surpassed $60 a barrel for the first time since January amid a wholesale rush in reflation trades on hopes that a $1.9 trillion COVID-19 aid package will be passed by U.S. lawmakers as soon as this month after Janet Yellen pushed for rapid stimulus and coronavirus infections slowed across the globe. Gold, bitcoin and dollar all rose as well amid a “buy everything” wave.”


ZeroHedge further observes, “What goes up (under reverse gamma-gravity) must come down (under gamma-gravity).

Last week we described the likely ‘crash-up’ as the “huge gamma strike” at 3800 was blown away and the big Call Wall at 3900 enabling a ‘reverse gamma gravity’ meltup.

This morning the S&P is set to open at the 3900 Call Wall resistance point.

Source: Bloomberg However, as SpotGamma warns, we do not see markets holding higher prices until this level shifts higher. 

The dealer hedging force is mean reverting back into 3900 with any materially move above/below being pulled back into the Call Wall Strike.

With notional gamma levels holding from Friday we see a ~80bps range on the day, and note a very large Combo bar at 3909. This all leads to us calling for a “pin” today of the 3886-3909 SPX level.

This Call Wall level does not appear poised to roll higher, either.

Note the chart below of gamma levels, and you can see how much larger the positive gamma is at 3900.”


VIX futures stayed above their Friday low, possibly bringing the Master Cycle in at 20.86.  In the process of doing so, it “broke” the Triangle formation.  This may be the classic case of “the tail wags the dog” in which the VIX is pounded lower to spark a momentum drive to new highs in the SPX.  That move may be over, or nearly so as toda would be day 272 in the Master Cycle.


TNX staged a more convincing breakout this morning as it rises toward its Head & Shoulders target.  Today is day 248 in the Master Cycle.  It may have permission to rise, after a  brief pullback, to options expiration day, February 19.


USD futures appear to have bounced from the trendline at 91.00 over the weekend, reaching a high of 91.23.  The Cycles Model shows no particular strength at this time and the current Master Cycle is due to end shortly after Options expiration.   We may see the USD fall back under the trendline to new lows.

Posted in Published | Comments Off on February 8, 2021

February 5, 2021

February 5, 2021

2:13 pm

What has been missed today is that TNX  has broken out, albeit by a tick.  Since this has been overlooked while the SPX is making new all-time highs, it will surely be a topic of speculation next week.


2:05 pm

VIX was pounded by t the short vol crowd into a new low, pulling forward the Master Cycle from January 21 to a new low on day 269.  This stretched Cycle is ready to “snap back” on those speculators.  Today’s action had nullified the Triangle formation.  I have seen several usually accurate chart patterns getting blown up by this mad crowd.  It may end in tears.


1:50 pm

At 1:00pm SPX peaked at 2894.58, challenging its Cycle Top at 3892.29.  It has since reversed from that high and fell beneath Cycle Top resistance.  The significance of this is that it occurred exactly 8.6 market days from the last high at 3870.90.  Today is day 267 in the  extended Master Cycle, 8.6 days from the normal calendar high.  This is why I have been warning since yesterday that, had it reversed yesterday afternoon, the January 26 high would be the top.  As it happened,  higher top was made today.  I have noticed that reversals have been made with precise timing, even on an hourly basis.  That suggests a rather large reversal is in the making.  For most, it will be without warning…

Most analysts are looking for a crash up.

ZeroHedge remarks, “Now that the “huge gamma strike” at 3800 has been blown away, the next big Call Wall for the S&P500 is at 3900 with SpotGamma noting that “a very large Combo resistance bar at 3905.” However, now that momentum is again solidly higher and markets have pushed into the 3850-3900 range, positive gamma has increased in the S&P complex to a fairly robust $1.5BN, meaning that the higher stocks ramp, the more buying interest there will be as dealers rush to delta hedge.

As SpotGamma further notes, such a high gamma reading is a rare high for the post-Covid era as indicated below (orange dots last 30 days).”


7:15 am

I have an 8:15 appointment and a fairly heavy snowfall last night that needs removal.  I may not return for analysis until early afternoon.

SPX futures rose to 3886.12 in the overnight session after breaking above the previous high in the last half hour of the cash market.  Yesterday I warned that a 4.3-day Cycle would be complete in the final hour of the day.  That warning remains this morning.  Cycles may expand or contract to a lesser degree due to external events.  This morning’s jobs report may be one of them.

ZeroHedge notes, “After last month’s dismal payrolls report, according to which the US labor market contract by a whopping 140K workers in December (primary as a result of 372K restaurant workers losing their jobs amid the latest round of covid shutdowns), renewed optimism has emerged that the worst is over for the US market and that tomorrow when the BLS reports the January payrolls, the surprise will be solidly to the upside.

Or maybe not all that solidly: as Newsquawk reports, the expectation is for headline nonfarm payrolls to rebound in January from the negative reading in December, but analysts do not seem convinced that January’s data will fully pare back the December downside, despite increasingly constructive labor market signals. While initial jobless claims data had worsened (until today when it unexpectedly smashed expectations), continuing claims data has improved; the ADP’s gauge of payrolls surprised to the upside in January, raising hopes that similar can be seen in the BLS report; within the ISM business surveys, the employment subcomponents improved in both the services and manufacturing sectors, the former rising back into growth territory.


February 4, 2021

2:45 pm

A warning that the SPX will have completed a 4.3 day rally from the low at 3694.12 at 3:00 pm.  That may be the end of the Cycle.  At this point, the SPX may also have completed yet another Orthodox Broadening Top.  Point 5 does not have to exceed the top of Point 3 at 3870.90.  In fact, not exceeding Point 3 is even more bearish than if SPX rose to the Cycle Top at 3885.48 or round number resistance at 3900.00.    Cycle Wave c is exactly 1.39 times the length of Cycle Wave b at this point.  A decline beneath the trendline at 3850.00 may infer anaggressive sell signal.


7:30 am

Good Morning!

SPX futures have wavered between Short-term support at 3810.47 and the trendline at 3847.50 in the overnight market.  The attempts to ramp it above 3850.00 to boost momentum may be failing.  Lower supports are at 3780.00 and the Ending Diagonal trendline is at 3765.00.  A very large call option position lies at 3800.00, but a growing number of puts lie at 3750.00.

Yesterday’s high at 3847.50 is reminiscent of the 1987 Wave (B) high on October 3, 400 months ago.  The market had crashed in only 17 days from the top.  Day 17 falls on February 26, the end of the current Master Cycle.

ZeroHedge reports, “Global markets were flat, and European stocks and US equity futures unchanged, struggling to eek out a fourth day of gains on Thursday as a rising USD and rising bond yields refocused attention on inflation and normalising economies. At 7:30 a.m. ET, Dow e-minis were up 4 points, S&P 500 e-minis were up 3.75points, or 0.1%, and Nasdaq 100 e-minis were up 40.5 points, or 0.29%.”


NDX futures rallied, but remained beneath the Ending Diagonal trendline resistance at 13500.00.  NDX did not make a new high and chart watchers are monitoring tis closely.

Investing.com — U.S. regulators may huddle to discuss the retail stock frenzy of recent days, a deluge of earnings starts with Merck and BMS and ends with Peloton (NASDAQ:PTON) and Ford, weekly jobless claims are due and the dollar hits a two-month high on brighter prospects for the U.S. economy. Here’s what you need to know in financial markets on Thursday, February 4th.

1. Yellen to meet with regulators on trading frenzy

Treasury Secretary Janet Yellen may meet with U.S. financial regulators to discuss the implications of the frenzied trading in a handful of heavily-shorted stocks over the last couple of weeks.

The meeting, called on Tuesday, will be attended by the heads of the Securities and Exchange Commission, the Federal Reserve, the Federal Reserve Bank of New York and the Commodity Futures Trading Commission, according to Reuters. It still isn’t clear exactly when the meeting will start.”


VIX futures have ventured up to the 50-day Moving Average at 23.50, but thus far have been repelled.  Since then it has declined to the lower Triangle trendline at 22.84.  We shouldn’t be surprised to see this as an attempt to spark buying interest in the stock indices.

USD futures appear to have made a final attempt at challenging the trendline at 91.50 before easing back down.  The Cyclical period of strength appears to have passed and USD has nearly three weeks to a potential Master Cycle low.


BKX appears to be completing its retracement to the Cycle Top at 104.55.  That would be a reasonable target, since it lies just above a 50% Fib retracement.  There may be a period of strength lasting through Tuesday.


TNX continues to rise and may be poised for a breakout.  At that point, we may see punters piling on through the options market.  The reason I say this is because the next Master Cycle (high) ends at options expiration.


Supply and demand is keeping DBA pinned just beneath its Cycle Top at 16.53.  However, liquidity constraints may push DBA down to 14.50 over the next month.  This is a portent of food shortages over the next two years or longer.  Instead of bottom fishing in the SPX, one may find it more attractive to buy the low in DBA near the end of the month.

ZeroHedge reports, “China’s pig herd is on alert again as disease outbreaks ramp up this winter. Reuters reports the new outbreak of diseases could hamper the hog recovery after the African swine fever contagion a few years ago wiped out about half of the country’s herd.

Government data shows China’s pig herd expanded by 31% in 2020. But with new outbreaks of swine fever in the northeast and northern provinces and rising Porcine epidemic diarrhea (PED), the widespread increase in diseases this winter has been very concerning to farmers.

“The disease challenge right now is bad,” said one farmer, who declined to give his name to Reuters because the Chinese Communist Party (CCP) has banned him to speak with the media.”

Posted in Published | Comments Off on February 5, 2021

February 3, 2021

February 3, 2021

11:08 am

TNX continues its march higher.  You will notice that, after the Fed nearly lost its control of Treasury rates in June and ramped purchases you can see the effect with each of five Cycles ending at a low since August.  However, the Fed’s influence has become weaker until January, when the Fed lost control with the last Cycle low at 10.01.  After begging Congress multiple times to curb their spending, the deficits continue.  Soon it will become evident to everyone that the deficits are out of control as the Head & Shoulders formation implies a 45% increase in the TNX by the end of February.  Possibly more.

ZeroHedge comments, “One of the less discussed, but perhaps most ominous developments in recent months, has been the surge in US Treasury auction sizes which have hit all time highs as a result of the (just as surging) US budget deficit and the need to fund it somehow (well, not somehow, but rather by selling debt)…

… which is why bond traders were eagerly anticipating today’s Treasury refunding announcement which discloses the projected auction sizes for the given quarter, as well as gives further insight into the Treasury’s funding strategy.

And as we also await the outcome of the Biden stimulus deal, which may need as much as $1.9 trillion in new funding, the Treasury held steady its planned issuance of longer-dated securities at a quarterly debt auction next week as the department also awaits the result of the latest covid package.”


10:26 am

SPX has slipped beneath its consolidation support at 3825.00 after failing to breach the upper Ending Diagonal trendline.  This may be considered an aggressive sell signal with further confirmation beneath Short-term support at 3809.43 and the Broadening Top trendline at 3780.00.  Ultimate confirmation lies beneath the lower Ending Diagonal trendline at 3760.00.  The options market turns negative beneath 3750.00.

ZeroHedge reports, “The S&P 500 exploded higher after breaching the 3800 level yesterday and is holding on to those gains this morning, as the vol-trigger area shifted up to that key level, implying much of what we have seen in the last two days of exuberance in the broad market was indeed short-covering.

More specifically, as SpotGamma explains, the risk reversal chart below indicates the level at which put demand surged last week (more that Nov elections), and then violently reverted.

Part of the reason for the bounce higher in equities, is puts quickly became expensive relative to calls last week. The level of ‘expensiveness’ was the largest since late April 2020.”


10:10 am

The NDX morning ramp had a close call but missed the top by 2.2 points.  It has crossed beneath the Cycle Top at 13522.00 and has just crossed beneath the trendline at 13480.00.  This would be considered an aggressive sell spot.


8:00 am

Good Morning!

SPX futures are coming off an overnight high at 3843.12, just three ticks above yesterday’s high.  The trendline appears to offer resistance against a run above 3850.00, where option gamma turns positive.  Large institutions and dealers often attempt a momentum run during the first hour of trading in the cash market.  Should it fail in the next couple of hours, selling may set in with a vengeance.  The demarcation of support is at 3800.00, with a glut of calls placed there.  Beneath that level is a neutral zone which turns negative below 3760.00.

ZeroHedge reports, “World shares and US equity futures rose on Wednesday as volatility caused by a retail trading frenzy on Wall Street subsided on expectations of tougher regulation, while optimism about U.S. fiscal stimulus and the appointment of former ECB-head as Italy’s PM – i.e., Prime Mario – also supported sentiment.

At 7:30 a.m. ET, Dow E-minis were down 16 points, or 0.1% S&P 500 E-minis were up 12.25 points, or 0.32%. Nasdaq 100 E-minis were up 73 points, or 0.55%. The MSCI world equity index was up 0.3% by 1119 GMT, inching closer to its record peak following gains in Asia overnight and a positive open in Europe. Shares are back in rally mode as the speculative short squeeze trades popular with Reddit crowds crumble, easing fears that they could lead to destabilizing swings in the stock market as funds are forced to deleverage.


NDX futures made a new all-time high at 13583.62 at 2:45 am after AMZN and GOOGL  blockbuster earnings were announced last night.  Futures have since eased lower, prompting comments that this may mark the top for the tech darlings.  Maximum Cyclical resistance lies at 13502.99.  NDX may be considered on an aggressive sell signal beneath that level.  The NDX Hi-Lo has been weakening, but must break beneath chart support at 20.00-36.00 for a sell signal.

ZeroHedge reports, “Earlier today we reported that traders were “on edge” ahead of today’s earnings reports by giga-cap tech giants Google and Amazon, because in a “perverse” market such as this one, where even solid beats are punished, a disappointment by either of the two companies could have led to a broader market selloff. We now know, of course, that both companies reported blowout results and the real highlights wasn’t the two FAAMG giants’ Q4 earnings but rather the departure of the world’s 2nd richest man, Jeff Bezos, from the helm of his company.”


VIX futures briefly challenged the 50-day Moving Average at 23.49 before moving higher.Vix remains on a buy signal and offers an opportunity for accumulation at this level.

This commentary from ZeroHedge is worth repeating, “One week ago, the Reddit crowd – then numbering 2 million users- sparked a historic squeeze among the most shorted Russell 3000 stocks (led by Gamestop) which inflicted hundreds of billions of losses on some hedge funds (while making other hedge funds that much richer), and launched a deleveraging VaR shockwave which forced even non-shorting hedge funds to unwind some of their biggest (and most popular) positions.

Then, this Monday, the same Reddit crowd – now having tripled to 7.5 million users – managed to spark the biggest surge in silver prices since the collapse of Lehman, and even though there were not nearly as many shorts here, the move was sizable enough to unleash another major VaR shockwave across markets, and forcing even unlinked assets to selloff amid another degrossing wave.”


TNX continues to rise without much notice from Wall Street.  Five of the six Cyclical indicators show strength over the next two weeks.  This indicates the high probability of an explosive rise in rates during that time.  There is virtually no commentary on rates for the past two weeks.


USD futures made an overnight high of 91.30, challenging the trendline at 91.20.  The Cycles Model suggests today may be the final day of strength before ending the Master Cycle at a much lower level towards the end of the month.  This may be the strongest decline yet in this series.

Investing reports, “2. Dollar rises as stimulus talks, Eurozone GDP underline growth differentials

President Joe Biden said he will press on with his $1.9 trillion spending plan after an inconclusive but “constructive” meeting with Republican Senators who want to trim the package.  The talks raised hopes that a bigger bill could pass with bipartisan support, easing fears that the package will be badly delayed or watered down due to GOP resistance.

The Congressional Budget Office had said on Monday it expects U.S. gross domestic product to return to its pre-pandemic peak by the middle of this year, after it updated its forecasts to reflect the new administration’s spending package.

The dollar index, meanwhile, hit a seven-week high as investors reassessed the relative near-term growth outlook for the U.S. vis-à-vis Europe and other developed markets after a very dovish Australian central bank statement. Eurozone GDP fell 0.7% in the fourth quarter as lockdowns returned to haunt the region. In year-on-year terms, GDP fell 5.1%, more than the 4.3% expected.”


Silver futures are rising after hitting a retracement low of 26.25.  In my prior analysis I failed to mention that the 50% Fib retracement level is at 30.73.  Monday’s high appears to have met that criterion.  However, it was done so on day 241 of the Master Cycle, giving it a possible two more weeks to complete the rally at a much higher level.  Should silver ramp higher, there will be a lot of disruption and pain due to the lack of physical bullion.  The Reddit ramp may still have more to go.

ZeroHedge reports, “With The Fed printing money ‘out the wazoo’, monetizing COVID relief package debt as fast as Congress can pass the bills, demand for bullion was already surging. However, the last week or so, on the heels of the Reddit-Raiders taking aim at Silver, demand for silver (and gold coins) has exploded…

Sales of U.S. gold bullion coins rose 258% in 2020 while silver coin demand was up 28%, the U.S. Mint said Tuesday.”


Posted in Published | Comments Off on February 3, 2021

February 2, 2021

February 2, 2021

3:33 pm

NDX tested its Cycle Top at 13504.04 with a high of 13501.22 today.  While NDX outperformed the SPX, it has not made a new all-time high.  The correction may be over.

ZeroHedge reports, “Last week, shortly after the start of Q4 earnings season, we presented an analysis from Bank of America according to which stocks were doing something they haven’t done since  the froth of the dot com bubble: despite a preponderance of companies beating earnings expectations, their stock price was punished with a record 1.6% underperformance relative to the broader market on the next trading day, to wit:

companies which beat on both sales and EPS underperformed the S&P 500 by 1.6% the following day, representing the worst reactions in BofA data history going back to the dot com bubble days of 2000!”


2:10 pm

On January 12, I wrote,”I have been saying there may be one more surge to the all-time high in equities.  Here is the one stock that outweighs all the others in market cap.  I have constructed the Wave pattern and I have concluded that TSLA may go as high as 1000.000 before rolling over.  The precise target is closer to 974.00.  But what the heck, once it gets that high, what’s to stop it from hitting 1000.00 for just a moment of time before it crashes?”

My timing was off, but my expectation of 1000.00 may not be far off the mark.  Should it exceed its prior high at 900.40, the RobinHood clan may pick up on it and push it over the top.  Elon Musk has been cheering these folks on and there appears to be a strong following that may pick up the baton.


1:36 pm

VIX lingers near its low, beneath mid-Cycle support/resistance at 26.61 with a 73.2% retracement.  This is a bit more than I figured, but positions vol buyers to enter at a low cost.  Should this be a Cycle Wave III, I would anticipate a move well beyond the March high at 85.47.  A VIX Cycle Wave III that is 1.5X the size of Cycle Wave I would have a target of 130.51.  At 1.618X the size of Cycle Wave I, Cycle Wave III would have a target of 139.24.  The monthly VIX chart sports a gargantuan Orthodox Broadening Top with the upper trendline above 140.00.  There is still a significant amount of short interest in the VIX in options and futures that may fuel a massive rally in the event of a short squeeze.

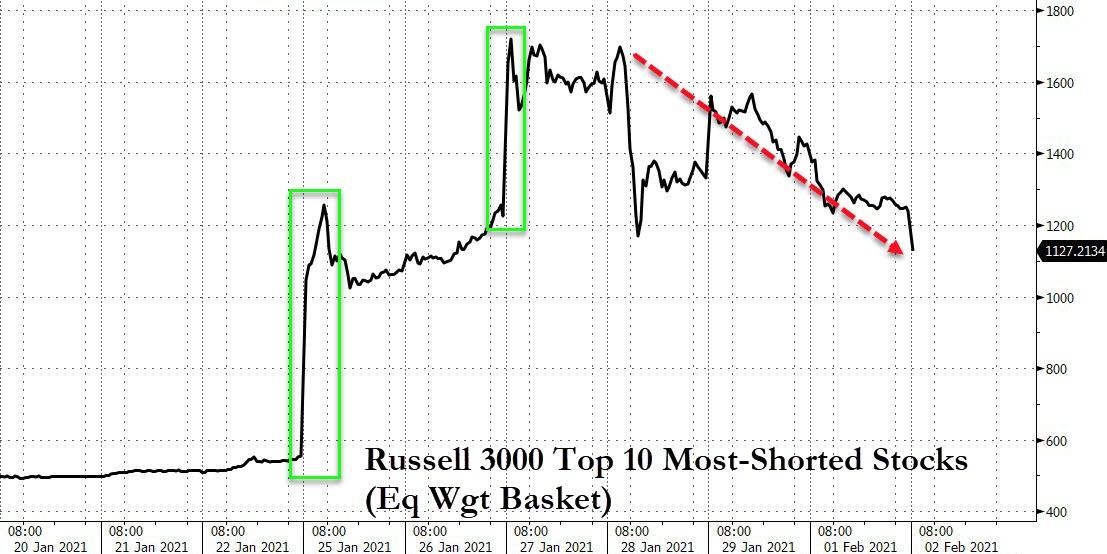
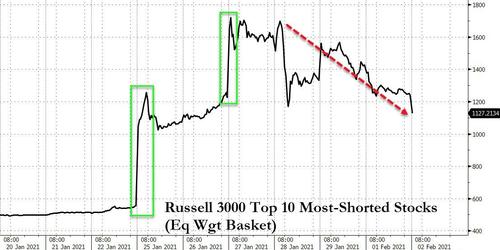
ZeroHedge speculates, “One week ago, the Reddit crowd – then numbering 2 million users- sparked a historic squeeze among the most shorted Russell 3000 stocks (led by Gamestop) which inflicted hundreds of billions of losses on some hedge funds (while making other hedge funds that much richer), and launched a deleveraging VaR shockwave which forced even non-shorting hedge funds to unwind some of their biggest (and most popular) positions.

Then, this Monday, the same Reddit crowd – now having tripled to 7.5 million users – managed to spark the biggest surge in silver prices since the collapse of Lehman, and even though there were not nearly as many shorts here, the move was sizable enough to unleash another major VaR shockwave across markets, and forcing even unlinked assets to selloff amid another degrossing wave.

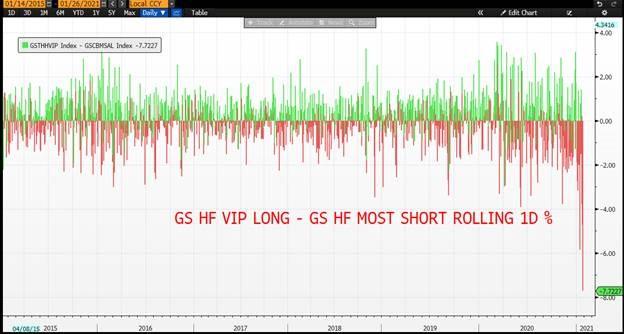
What the two episodes had in common is that any outlier event – and last week’s “most shorted vs most popular” slamdown was a 7 sigma event, which nobody had anticipated, with Goldman writing that Tuesday “was the worst day for GS HF VIP longs vs GS Most Short in our records (-7.7%)”…

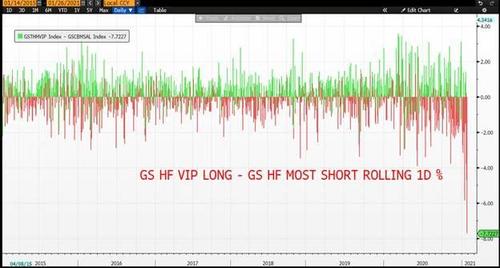
… stood to unleash a cascading sequence of adverse events due to just one thing: leverage.”

RealInvestmentAdvice asks, “Is A Larger Correction Coming?”


11:00 am

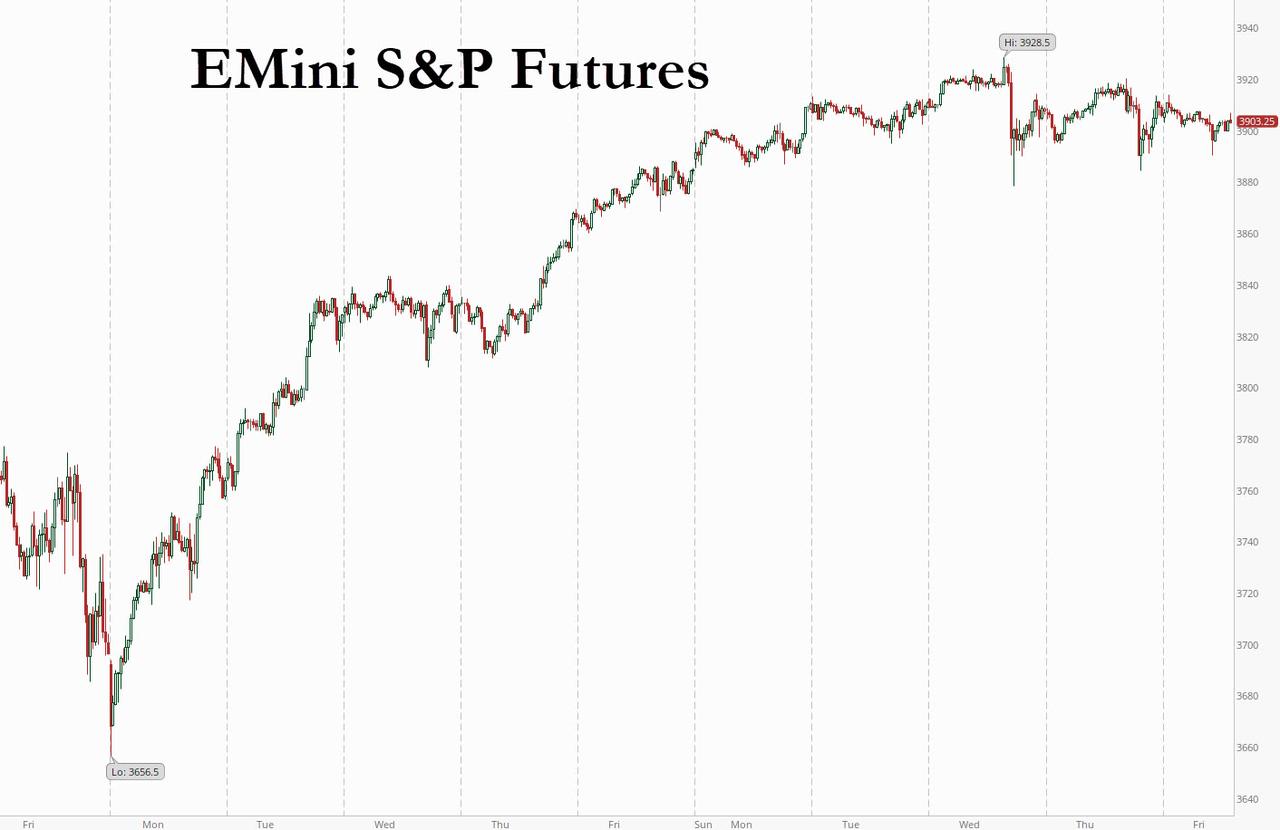
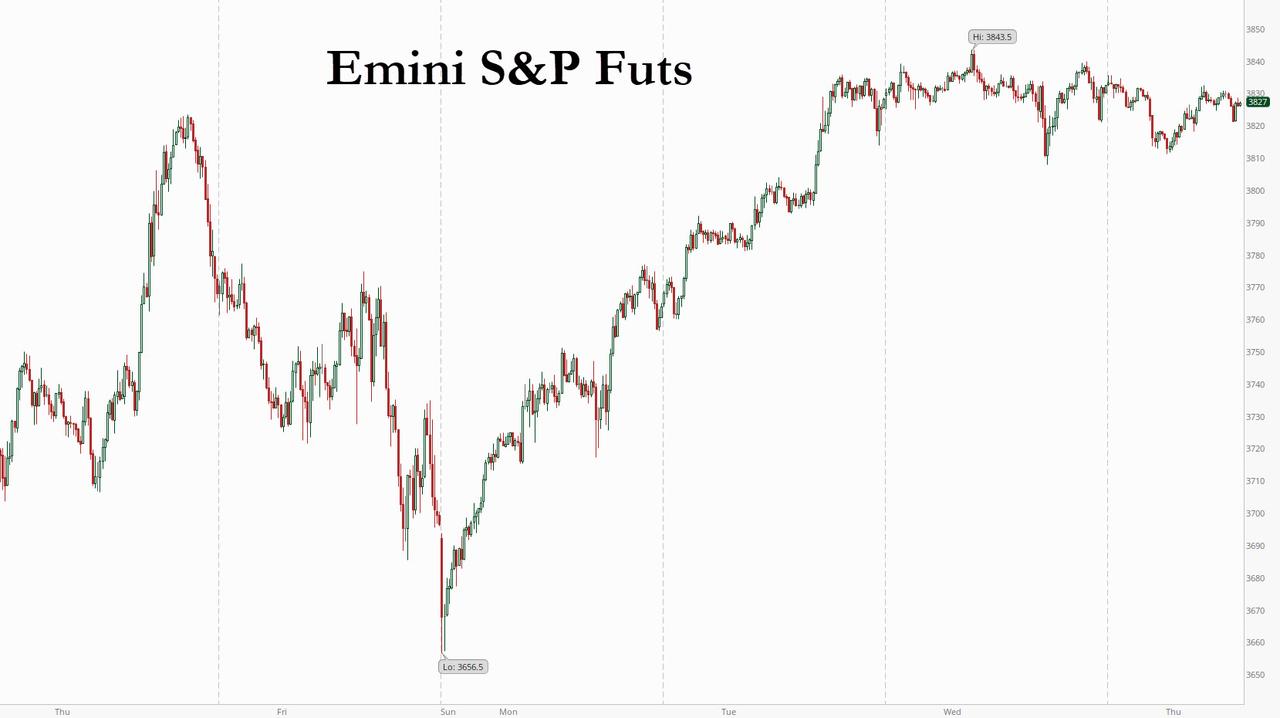
SPX appears to have completed an expanded flat correction, were Wave [b] declines below Wave 1 and Wave [c] rises to the top of Wave [a] at 3830.50 and the Ending Diagonal trendline.  Most investors view this as a resumption of the bull market.  However, there may only be a few hours of lingering at the top of this correction before the decline resumes.

12:20 pm

Leaving the existing chart up…I had the trendline tagged near 3843.50 and it appears that SPX has turned back almost precisely at that level.  In addition, SPX seems to be Cycling in 13-hour segments and it has reached hour 39 off the top of this 5.6-day Cycle at 3843.09.  I expect to see more of these types of impulses as this decline progresses. Short-term support is at 3807.99.  There is a large call position at 3800.00.  Selling may pick up beneath that level .

SH is an example of an ETF that would benefit from the oncoming decline.  Note:  I do not own SH nor do I have plans to accumulate shares in SH at this time.

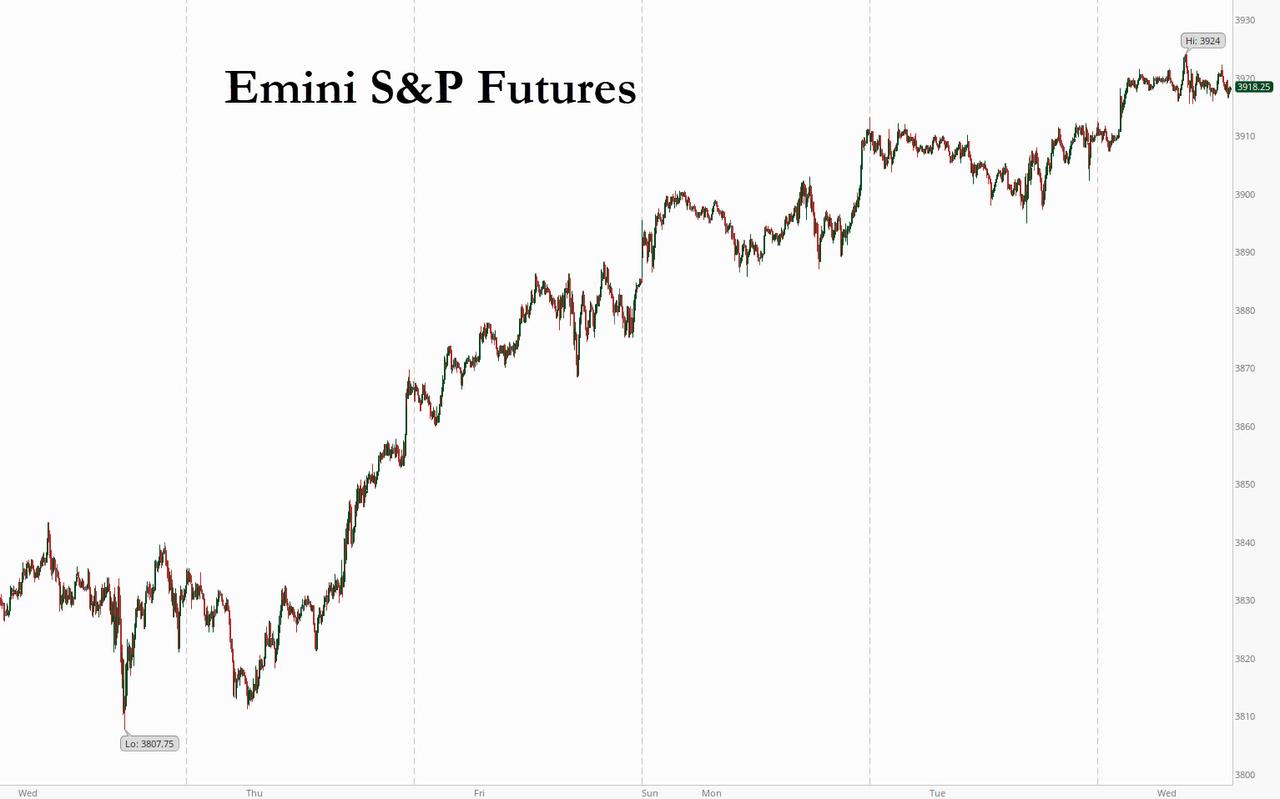
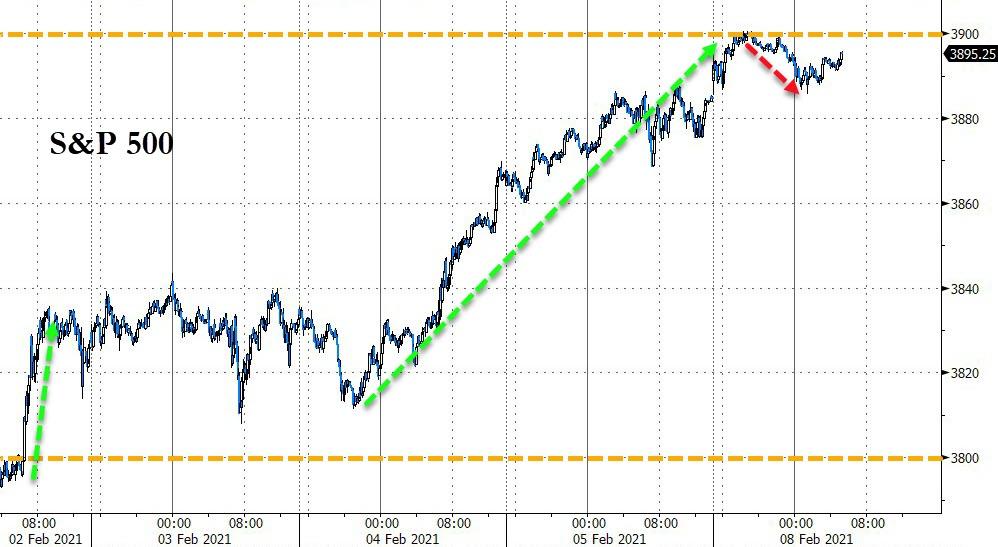
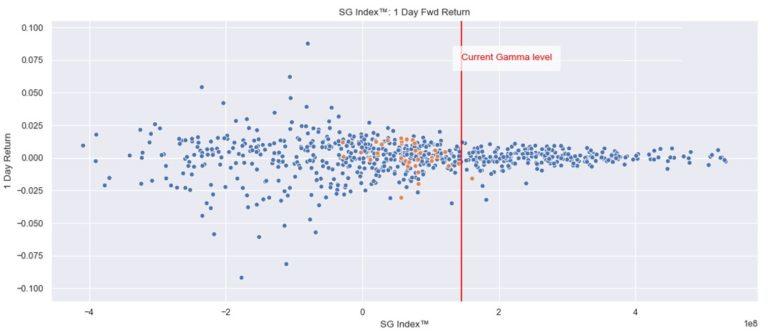
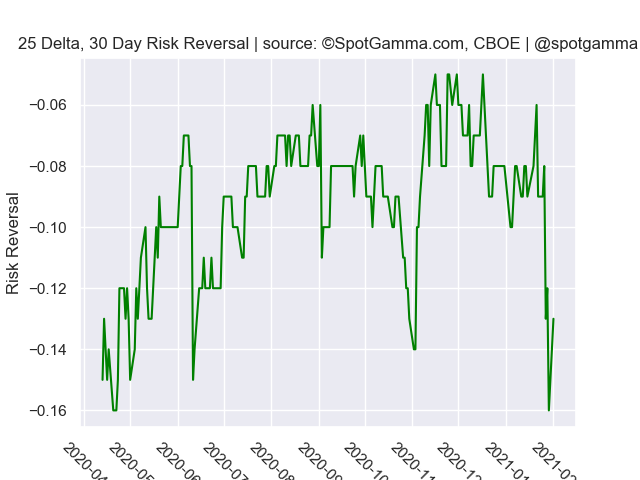
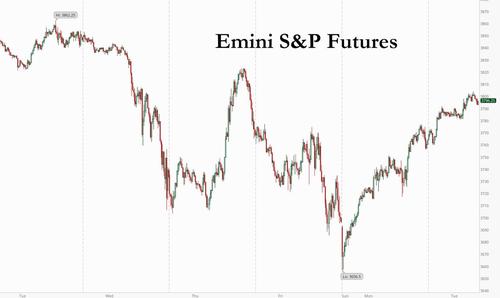
ZeroHedge comments, “Emini futures are pushing higher above 3800, rising above the large gamma strike at this level, with the VIX sliding 4 pts to 26 which has added to the equity tailwind. According to our friends at SpotGamma, call open interest has increased 15k at 3800, and the first resistance level is showing up at 3812 and then 3838 (on the downside, there is little support until 3750).

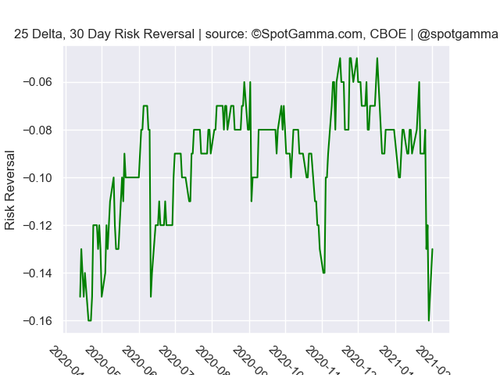
While there is a sense of tone change in positioning, there does remain an ominous gamma “void” down from 3800 to 3750, with SpotGamma warning that notional gamma levels remain low “which infers higher volatility” while put prices have ticked up vs calls as you can see below.


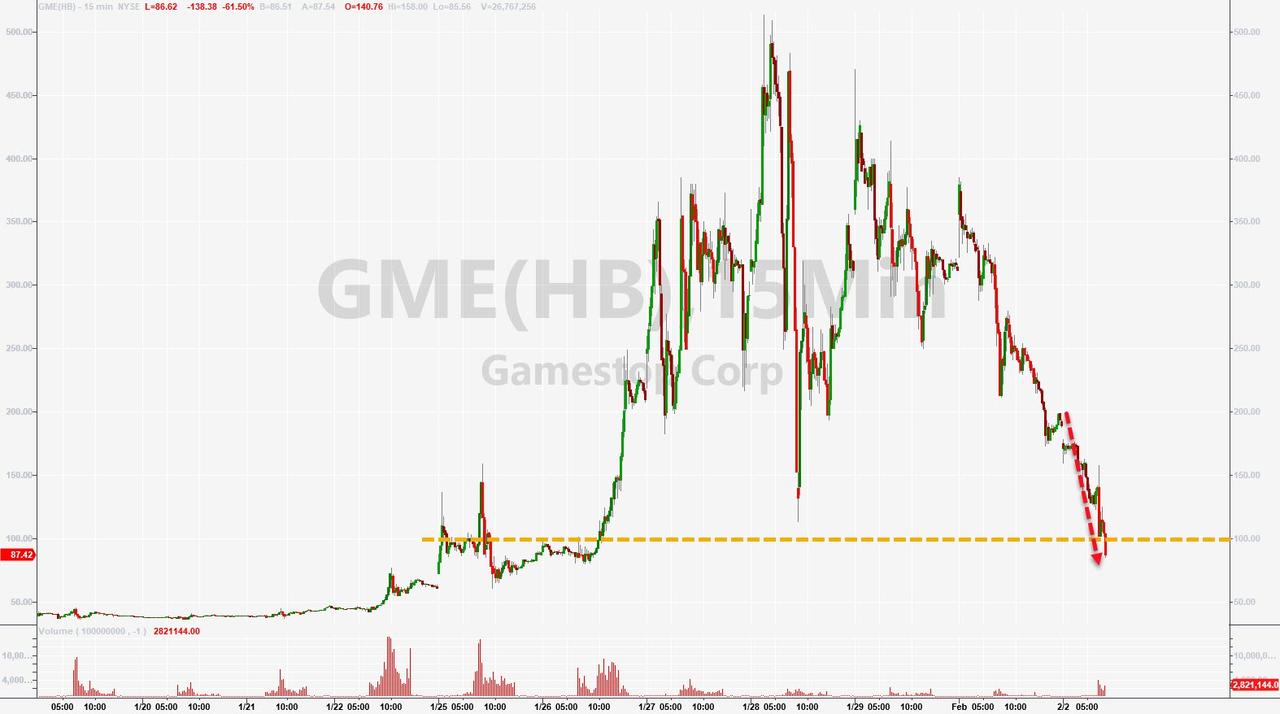
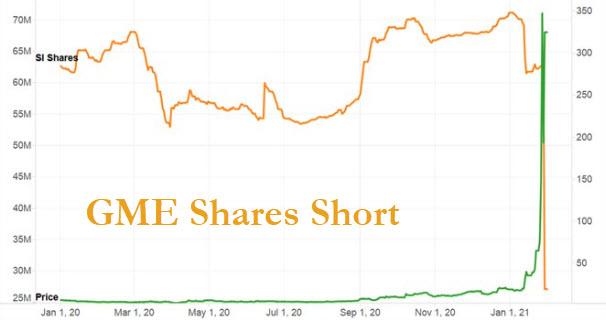
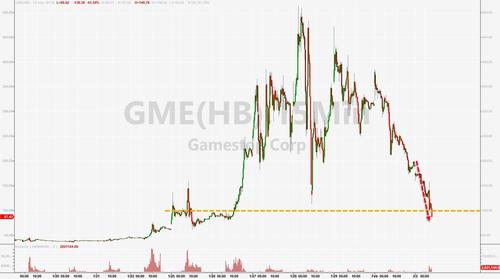
ZeroHedge observes, “Update (0955ET): The pre-market carnage in the heavily-shorted WSB squeeze-trades has worsened as the cash market opens with GME crashing back below $100 for the first time in a week…

The most-shorted basket is rapidly erasing all its gains…


8:00 am

Good Morning!

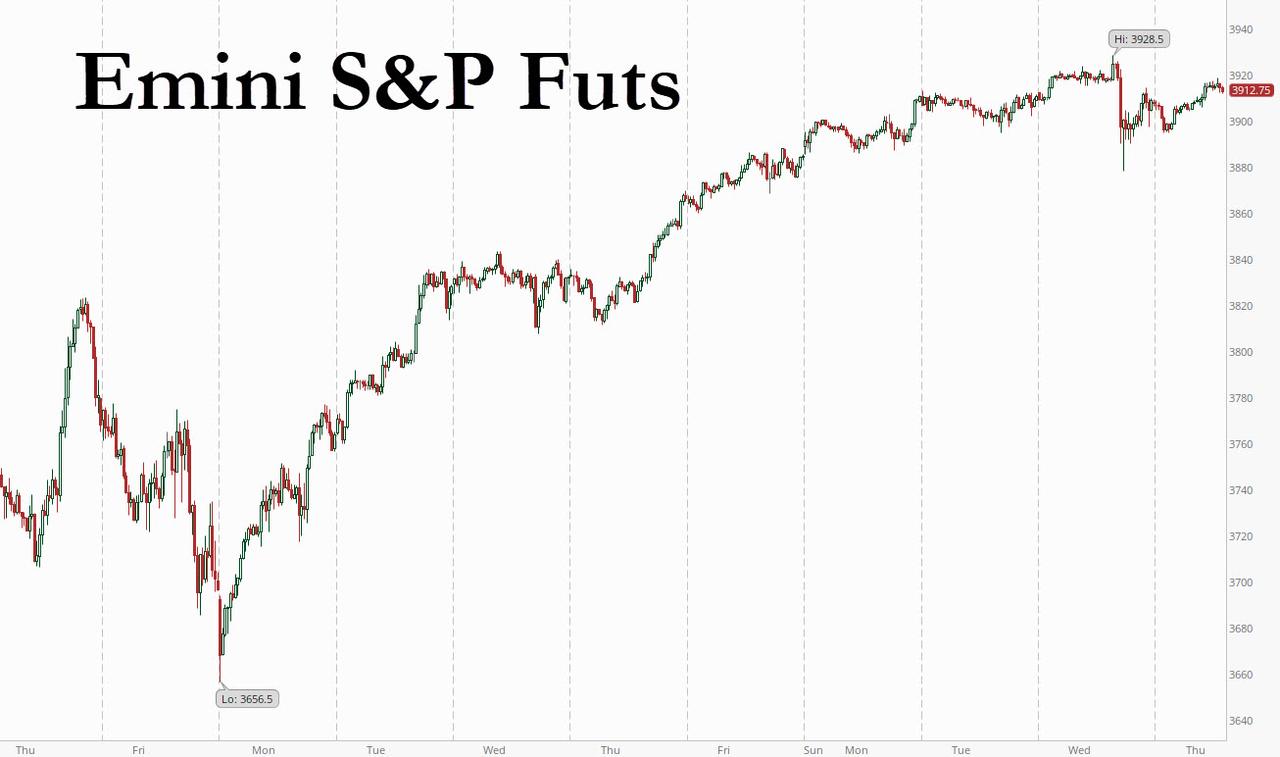
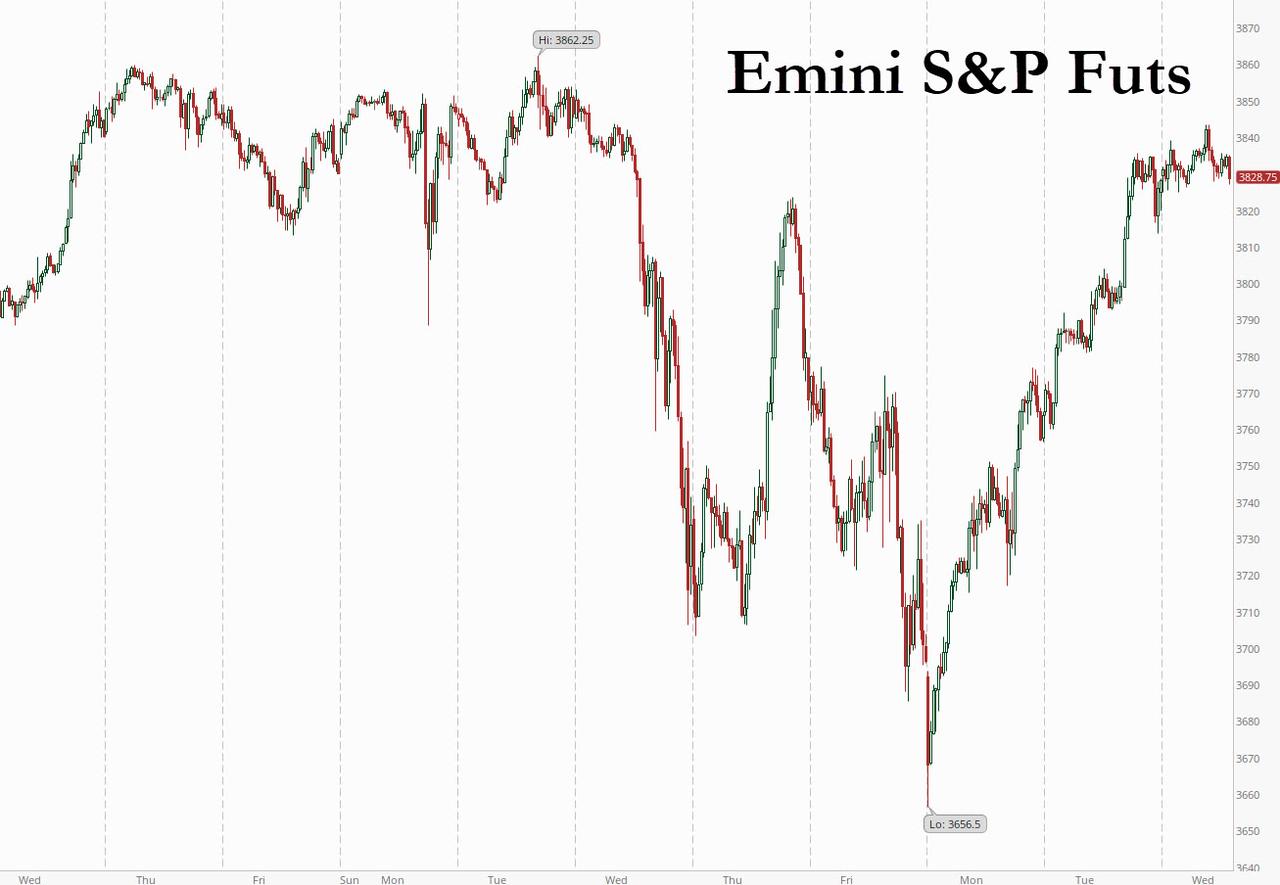
SPX futures briefly tested Short-term resistance at 3807.10, rising to an overnight high at 3803.88.  There appears to have been a concerted effort to rally SPX over 3800.00 to neutralize the negative gamma lying beneath mid-Cycle support at 3757.18 and the lower trendline of the Ending Diagonal formation, just beneath it at 3750.00.  Thus far the move hasn’t succeeded and selling may be ramping at this level.  An open beneath the Orthodox Broadening Top trendline at 3775.00 may indicate selling pressure out of the gate.

ZeroHedge reports, “US equity futures have continued their Monday rally, rising above 3,800 as the collapse in most shorted stocks continued, with European indices firmer following the positive Asian session…

… while silver slid from an eight-year high as the latest short squeeze reversed.”


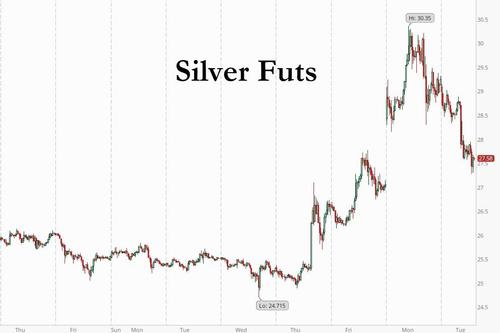
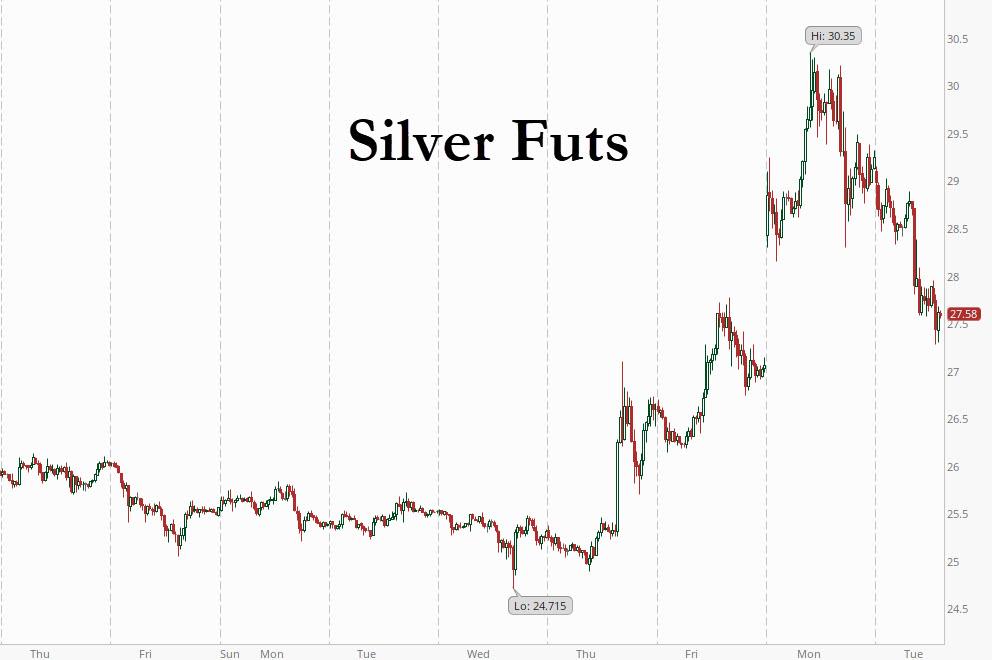
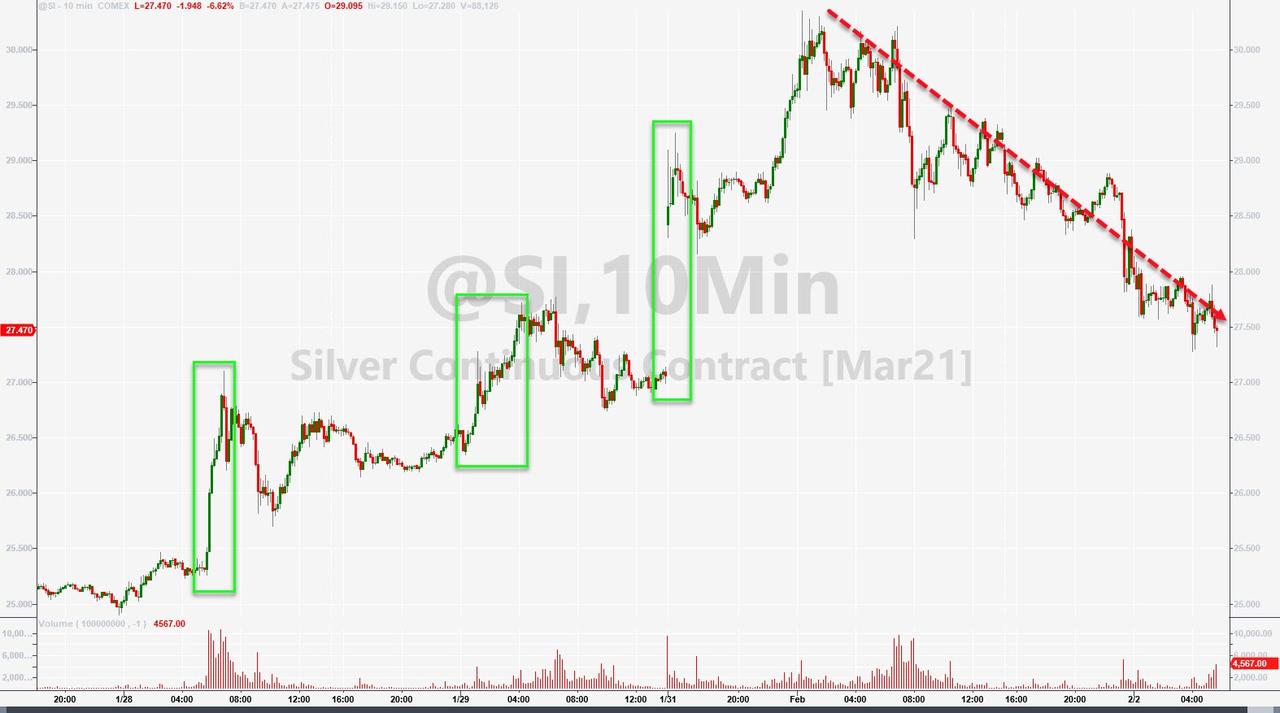
Silver futures made a low of 27.32and may be poised to move higher.  The current Master Cycle has about three more weeks to run.  It appears that the short squeeze may continue through the last week of February.  The alternate view is that, should the short squeeze accelerate here, it may be complete in about a week.

ZeroHedge reports, “After getting a lot of attention over the last few days thanks to the so-called Reddit Raiders, topping $30 during yesterday’s trading, (paper) silver prices are fading fast this morning – following CME’s margin hike overnight – erasing almost all of the Monday’s gains.

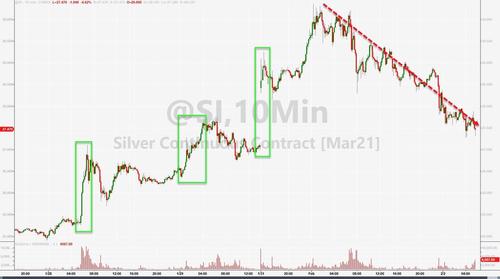
Monday saw another massive inflow of funds into the SLV (Silver ETF), but we note that the value of the ETF is significantly discounted to its NAV…”


NDX futures made an overnight run to 13377.88.  The Wave structure has become much clearer.  We may expect NDX to complete its rally near 13400.00.  The most likely structure is called an expanded flat.

ZeroHedge observes, “Yesterday, when GME was still trading at $300, we warned traders that the squeeze was almost over because as calculated by S3 Partners, the short interest had collapsed from over 110% to 53%…

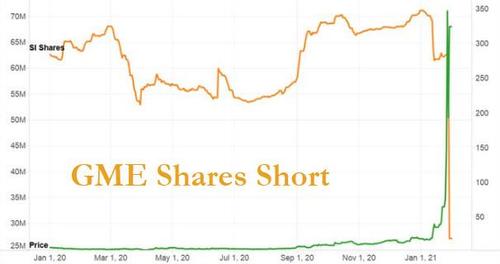
… and warned subs in our private twitter feed to take cover.

For some reason, we got a lot of grief from the “diamond hands” crew for simply reporting the facts (and as we explained for those wondering, the most desperate shorts went so far as raiding the XRT ETF to obtain GME shares), which are manifesting themselves vividly this morning, with GME crashing by more than half from when we warned yesterday, and was last trading at just $142…”


VIX futures decline to a low of 26.98, testing the mid-Cycle support this morning, making a Fibonacci 62% retracement.  Commentators are still looking for ways to short the VIX.


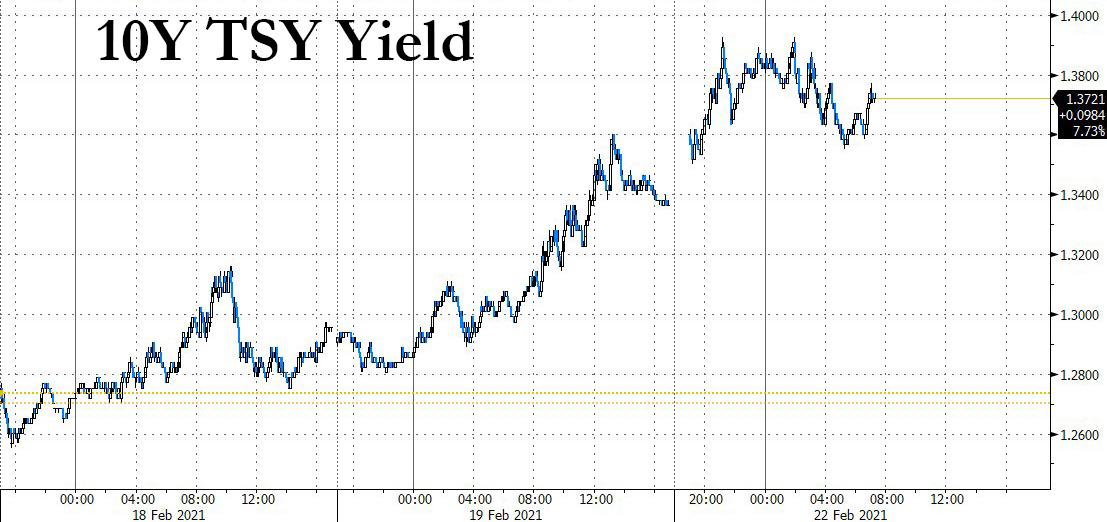
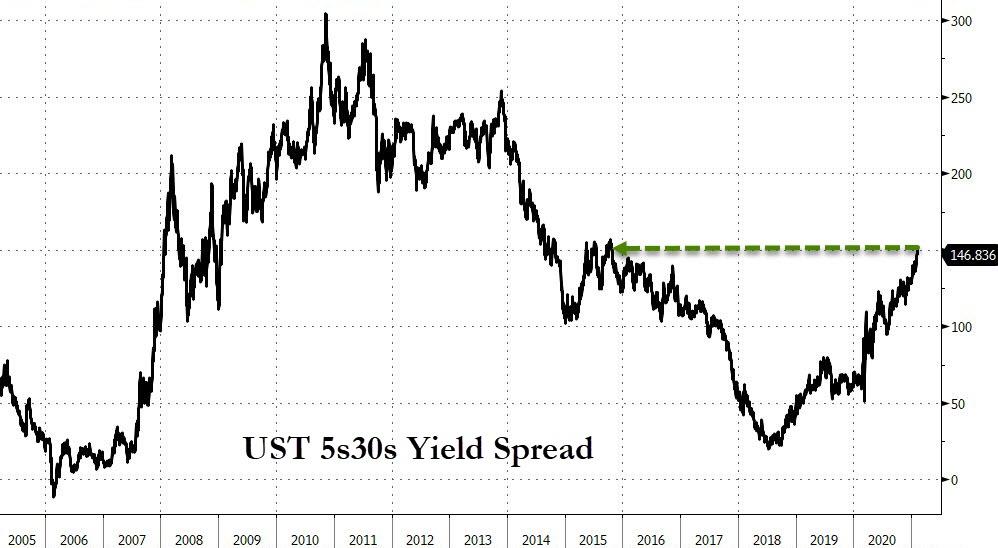
TNX is notably higher this morning.  The Cycles Model projects a Master Cycle high in about 2 weeks.  This rally may be one for the books.


USD futures made an overnight high of 91.17, testing the trading channel trendline.  The Cycles Model suggests today may be the last day of strength, making this a half Trading Cycle high.  The Model now proposes a three week decline to either the Cycle Bottom at 88.24 or possibly lower.


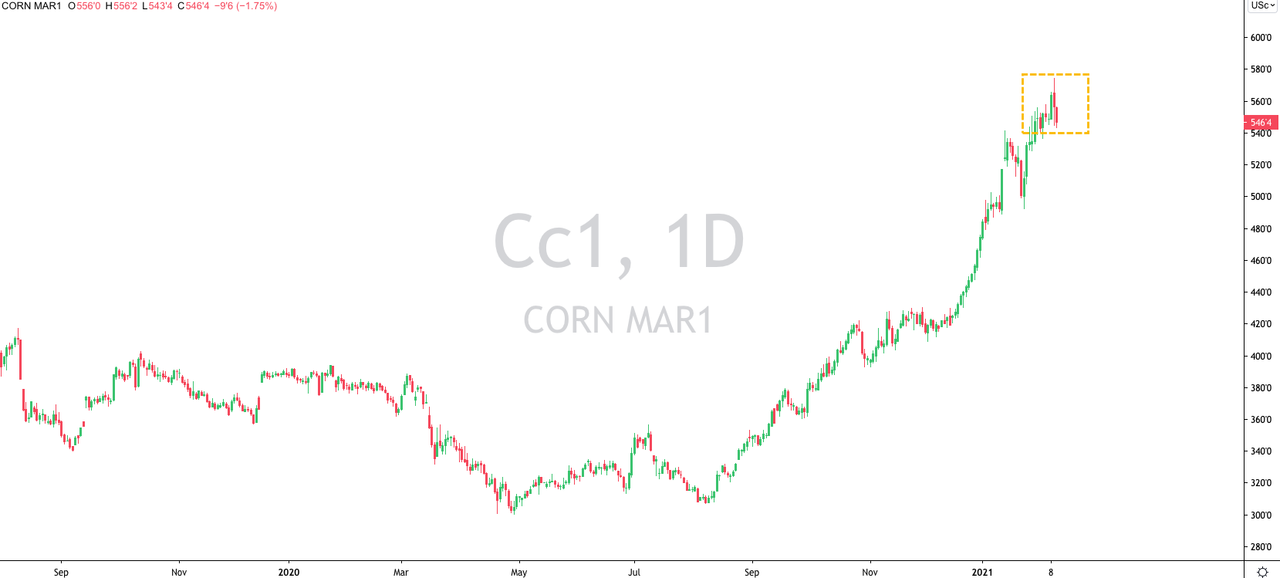
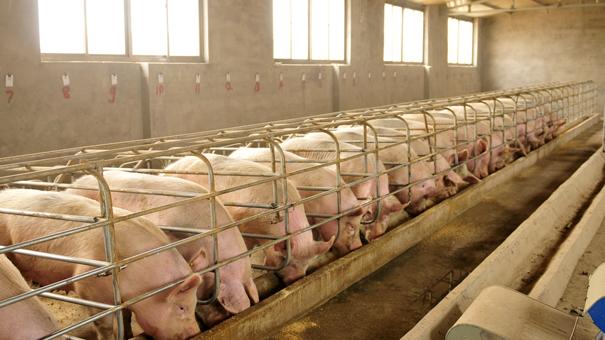
DBA appears to be hovering near its Master Cycle high at 16.65.  However, it has slipped beneath its Cycle Top resistance at 16.50 and structurally must continue its correction.  There are two dynamics clashing in this ETF.  The first is a growing food shortage with China now being our biggest customer.  The second is the absence of liquidity in the markets.  It appears that liquidity (or lack of) may govern DBA for the next month or so.  However, this may be one of the best opportunities to own coming out of the next Cycle bottom.

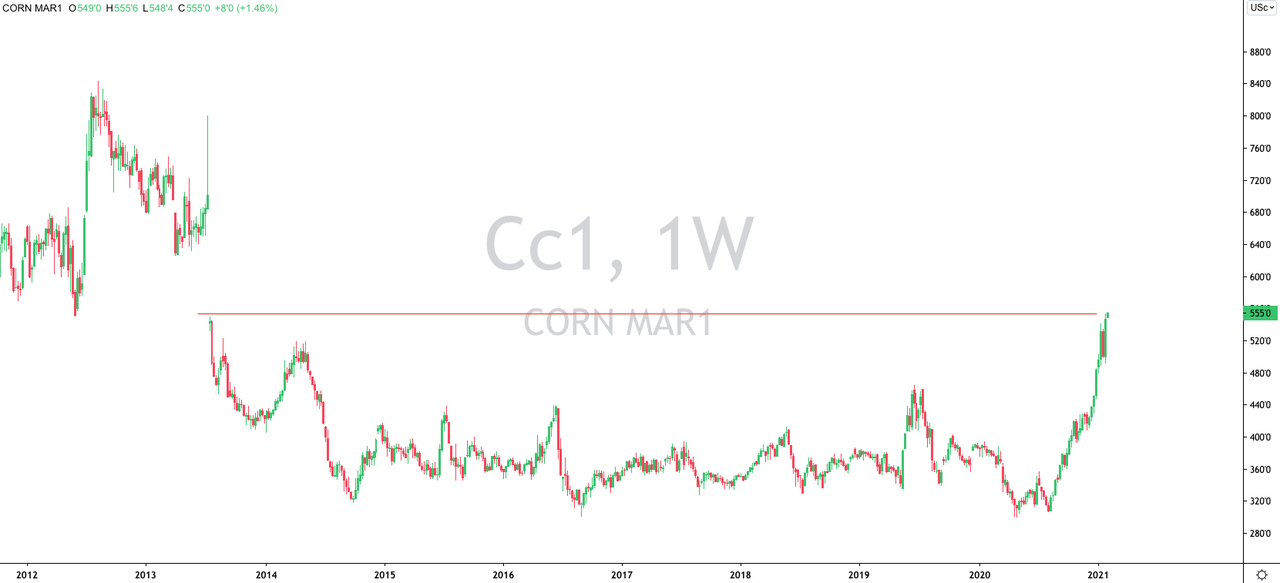
ZeroHedge remarks, “US corn futures are continuing to soar, hitting a 7-1/2 year high Monday. The bullish continuation in price is the result of “massive US corn sales to China last week,” according to Reuters.

Chicago Board of Trade March contracts are up 1.23% to $5.53 per bushel, to levels not seen since 2013.

Germany’s Commerzbank commented on the latest price action in corn, saying “Chinese demand for corn remains robust and unfavorable weather in South America” are some of the bullish catalysts lifting prices.

Posted in Published | 1 Comment