August 26, 2021

11:03  am

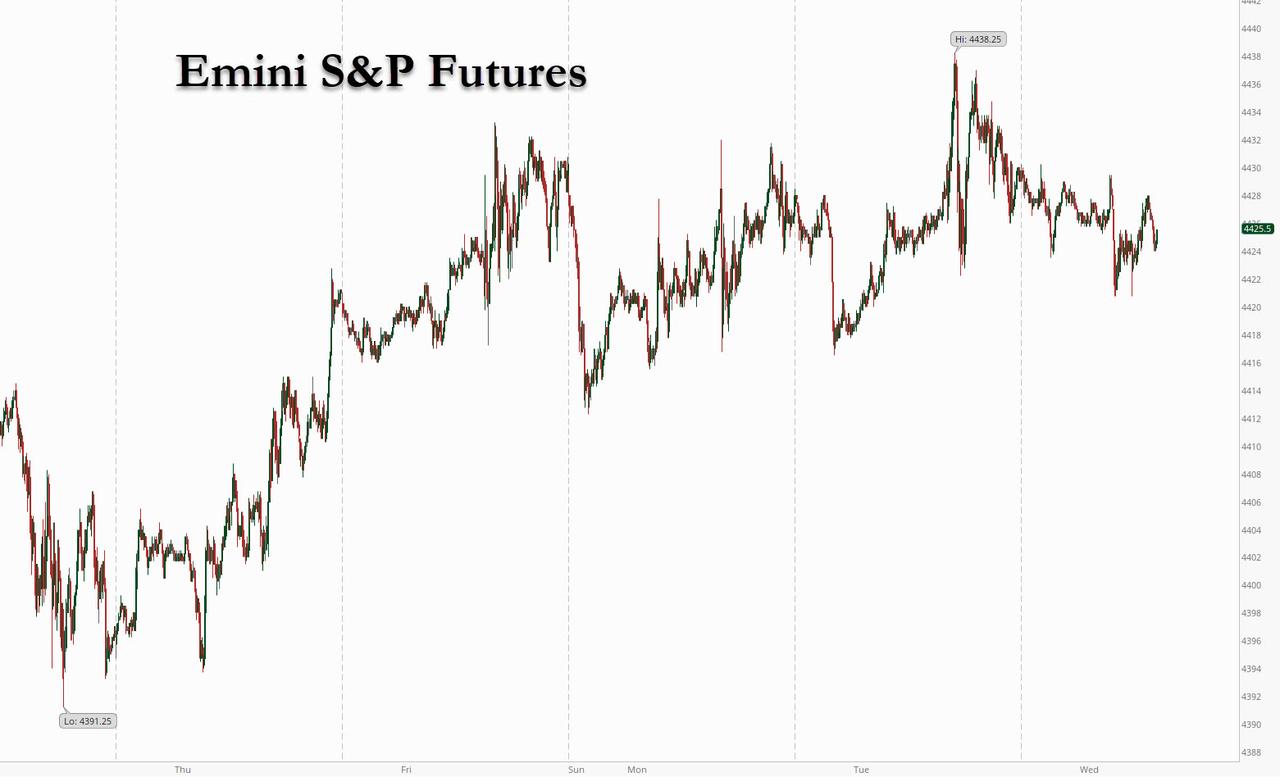
SPX is heading for Short-term support, where there may be a bounce.  Should it decline through it, the next support is at the mid-Cycle and trendline at 4411.14.  This jolt to the market may be stronger than originally expected.  The confirmed sell signal, in the absence of the dual VIX and Hi-Lo signal is beneath the trendline.  We are in aggressive sell territory, but the big picture suggests the uptrend is over.


10:38 am

VIX has clearly risen above the 50-day, confirming its buy (SPX sell) signal.   The NYSE Hi-Lo i still rising to 53.00, not confirming.  We may not see a reduction in the Hi-Lo until (after) the market close.  There may be a bounce, but the uptrend is broken.  This may be a good time to sell longs/buy short positions.

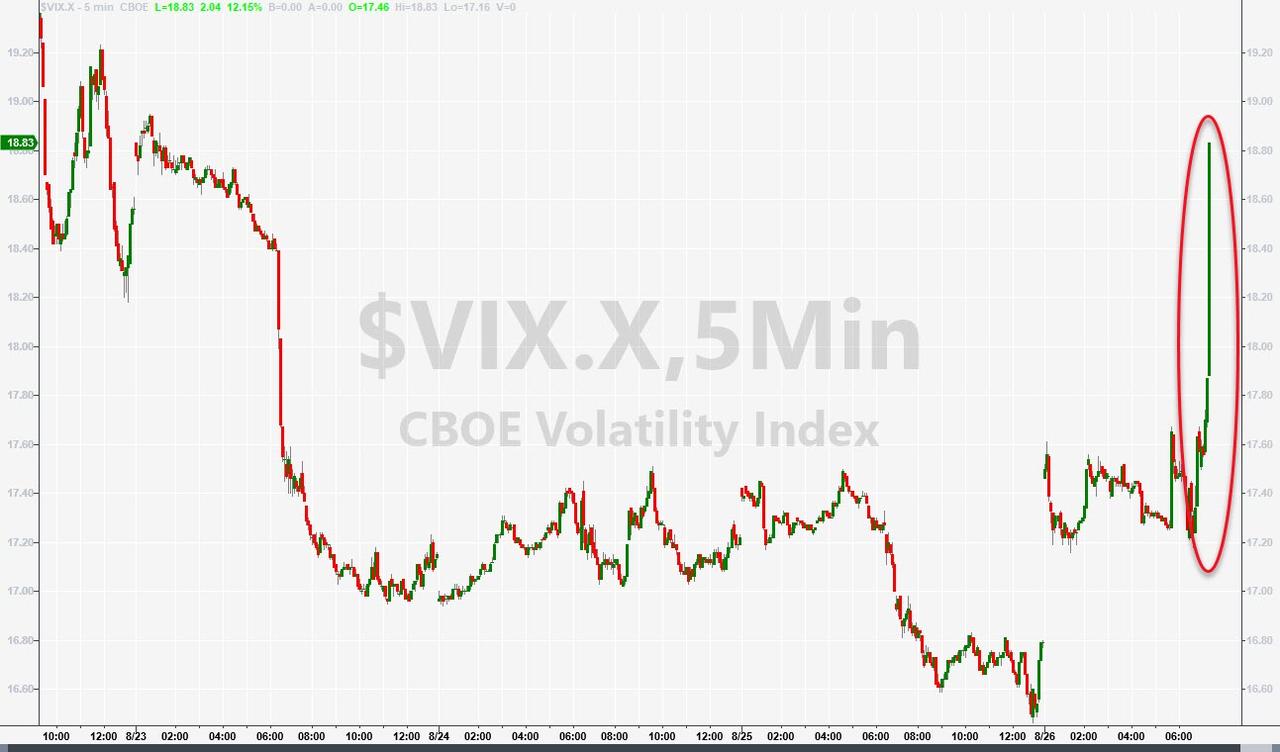
ZeroHedge reports, “Just as everyone was settling on for the long sleep through tomorrow’s J-Hole speech from J-Powell, a blast at Kabul’s airport has catalysed some fear and sent VIX exploding higher…
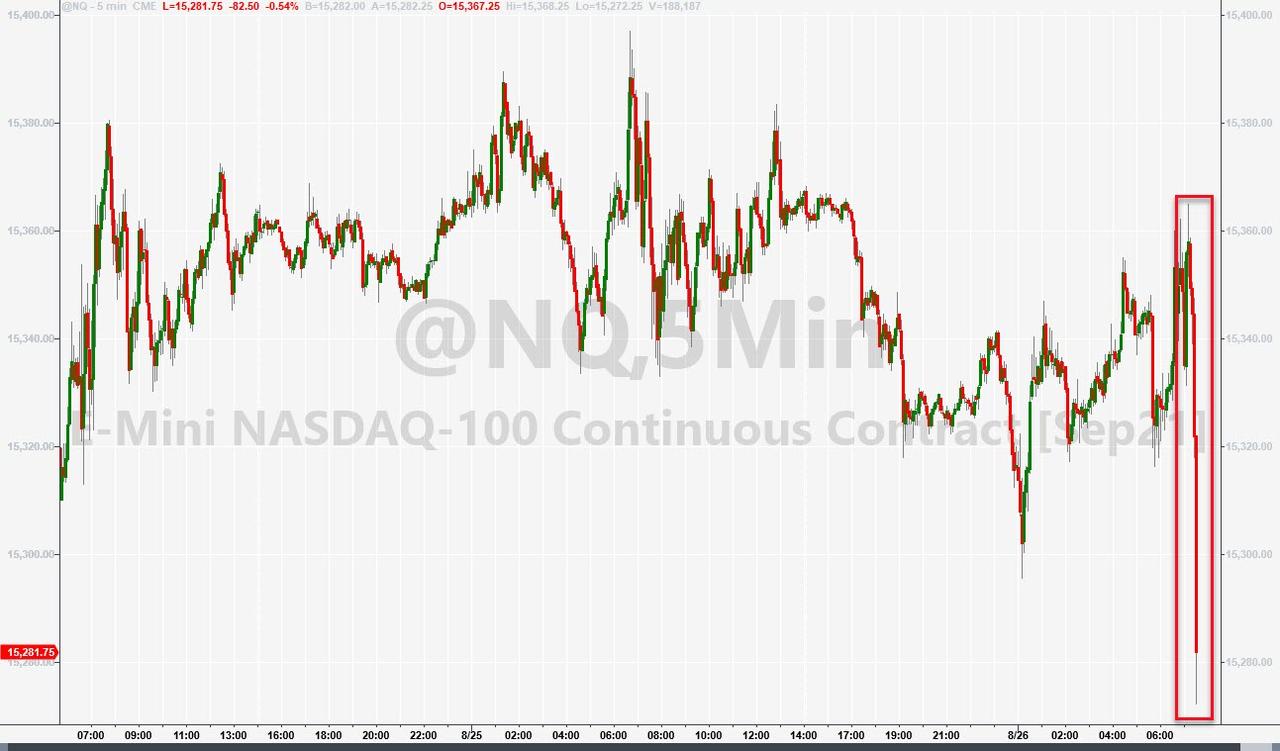
And that has sent stocks tumbling…
 

10:17 am

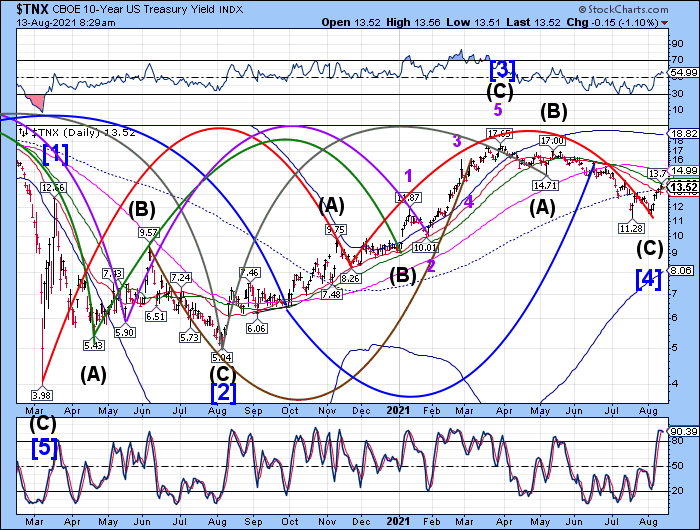
TNX rose above the 50-day Moving Average at 13.39 this morning, confirming the buy signal given yesterday.  The Cycles Model suggests strength will dominate this Cycle starting after Labor Day and lasting through options expiration, a good indicator of a Wave 3.

Mish comments, “Let’s discuss the relationship between tapering, Janet Yellen, Jerome Powell, and president Biden.

Fed's Balance Sheet 2021-07-18

Tapering

At long last the world presumes the Fed will finally taper.’


7:40 am

Good MOrning!

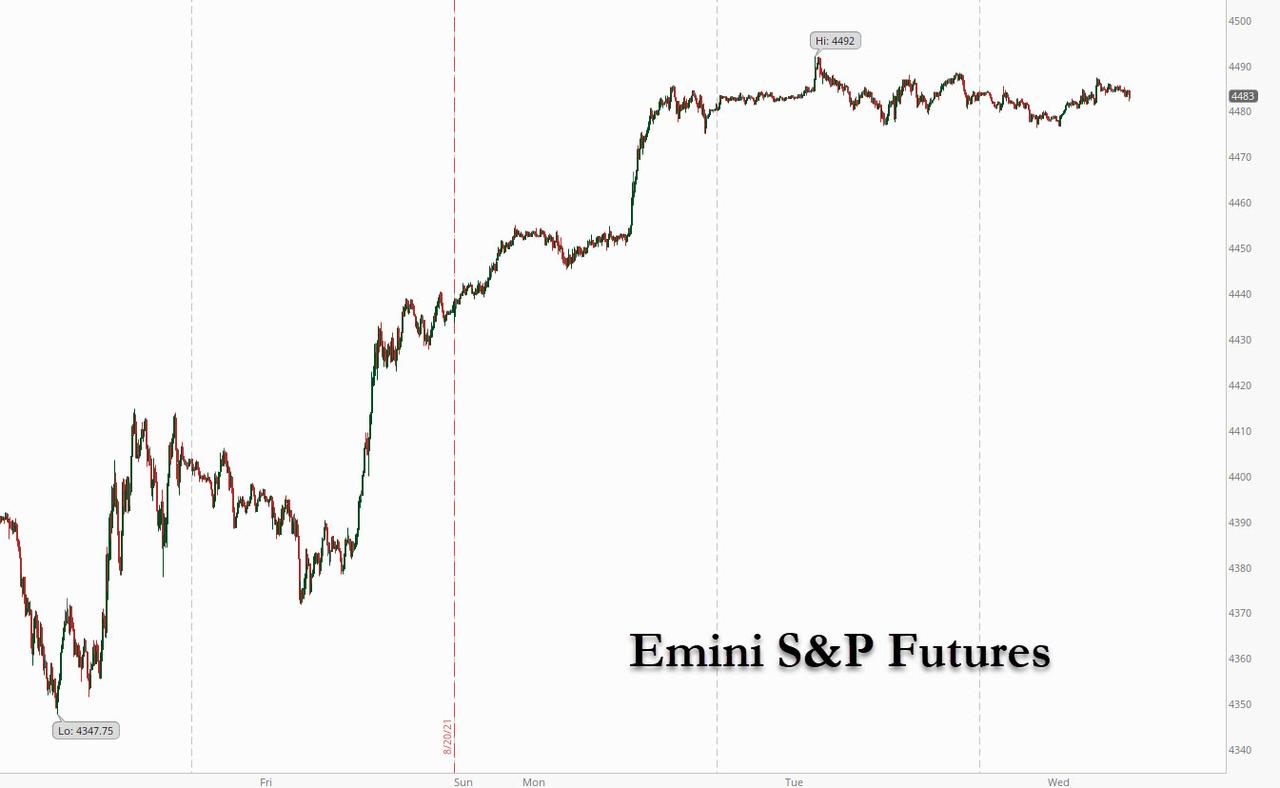
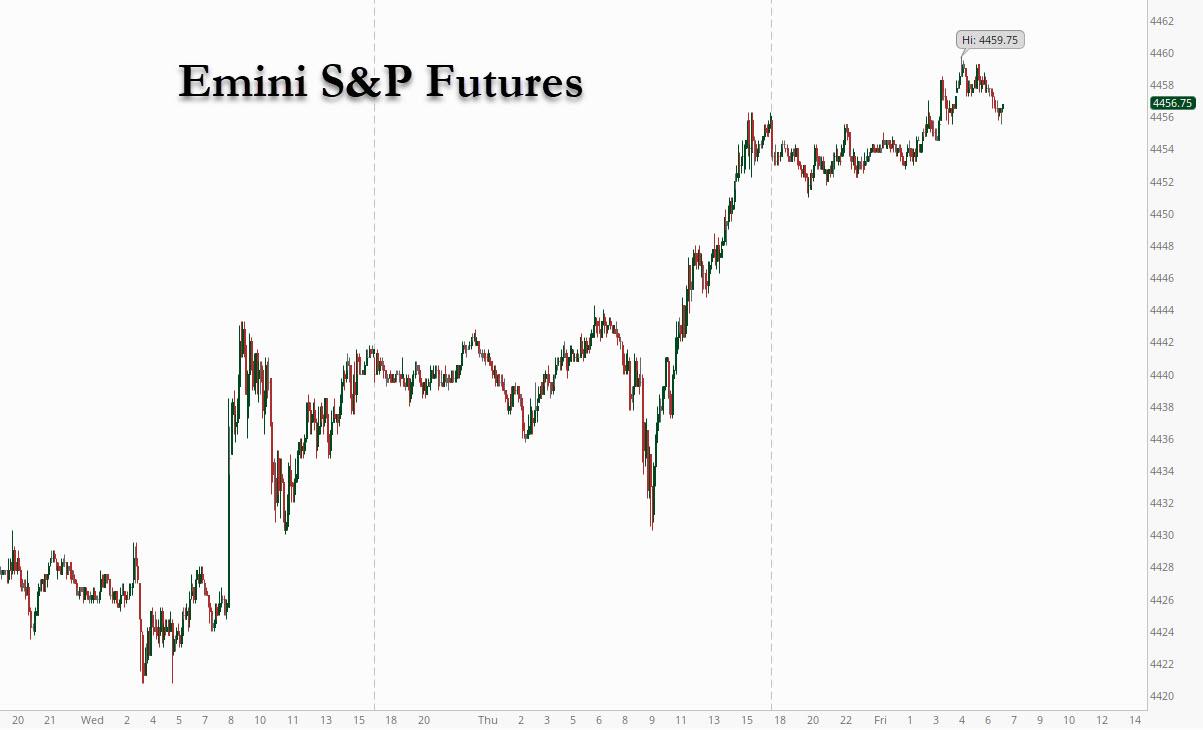
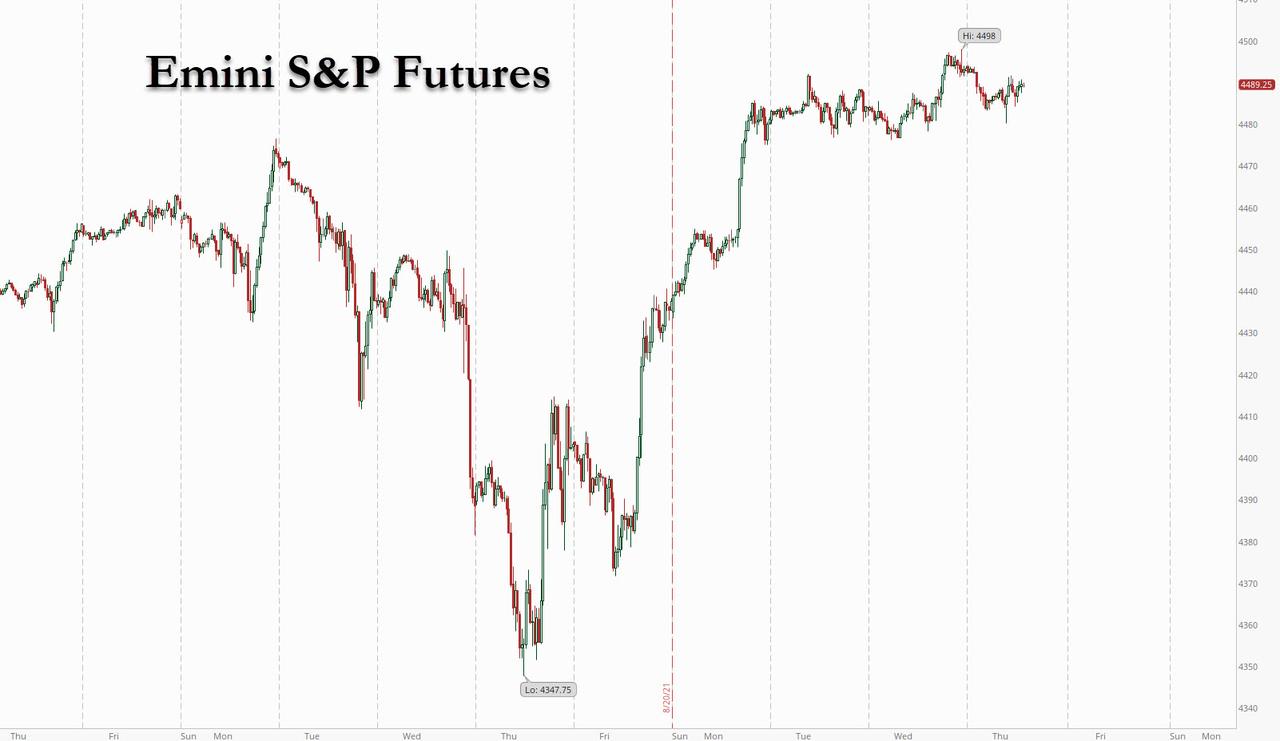
SPX futures declined to 4484.10 before coming back to breakeven with the close.  The requisit number of Waves are evident, as is the target for the target for this Cycle, on day 260.  The average Master Cycle is 258 days (8.6 months).  Since Cycles are organic, not mechanical, the variance may be up to 17.2 days on either side.  The prior 4 Master Cycles were 248 to 252 days, putting me on high alert for the past week.  While this Cycle may extend until after Jackson Hole, it is just as likely that the influence of J-Hole may simply keep the SPX in a tight trading range until Monday.  We must watch for deterioration in the other indicators, as well.

ZeroHedge reports, “S&P futures continue to trade as if paralyzed in a tight 20-point range on dismal volumes just below 4,500 for the 3rd day in a row, and overnight they are fractionally in the red although off session lows, with the Nasdaq 100 down 0.2% and S&P 500 -0.1% amid a retreat in tech shares and commodities as markets remained on edge ahead of Friday’s Jackson Hole virtual gathering where Chairman Jay Powell is expected to speak at 10am and give clues on the upcoming taper. The dollar rose, yields were unchanged at 1.34%, oil dipped and bitcoin slumped.


VIX futures challenged the 50-day Moving Average at 17.43, rising to 17.61 in the overnight session.   It is back under the 50-day, but that challenge indicates a rising potential to move above it.  We’re on a tightrope, but the VIX is only two feet off the ground.  This may be a low-risk entry for a trade in VIX options and ETFs. The ne;xt Master Cycle (high) may not be until late October.

The NYSE Hi-Lo Index closed at 105.00, just above its 50-day Moving Average at 104.00.  Nonetheless, we await for the Hi-Lo to fall beneath 0.00 to affect a change to a sell signal.

CharlesHughSmith opines, “The post-bubble-crash phase is already being prepared: ‘no one could have seen this coming’–except anyone who paid attention to anything other than self-interested shills.

It’s really pretty simple to identify a speculative bubble of epic proportions in stocks: if Wall Street says it’s not a bubble, it’s a bubble. As I explained in The Smart Money Has Already Sold, from the long view the entire game of “investing” (wink-wink) boils down to one dynamic:

Wall Street and the Federal Reserve inflate an unprecedented debt-funded speculative bubble and then lure retail “investors” (i.e. gamblers) in with the promise that the enormous gains are just starting, there’s so much more easy money ahead, etc. Then Wall Street distributes (sells over time so as not to alert the complacent herd of retail punters) its shares of overpriced rubbish (“investments”, heh) to bagholders, and then to everyone’s surprise (or not), the market suddenly crashes as the unsustainable bubble pops.”


Posted in Published | 2 Comments

August 25, 2021

2:30 pm

4501.08…That’s all it needs, folks!


11:50 am

SPX has now exceeded its EW target of 4495.00.  It is very likely that it may rise to 4500.00 or higher.  We are very close to a reversal.  It’s time – day 259.

ZeroHedge comments, “Research analysts publish dozens of complex charts that illustrate the bubble of everything continues to inflate away as central banks expand their balance sheets at record paces. These monetary wonks have distorted traditional indicators and made fundamentals obsolete, leading markets into a dangerous melt-up on a post-COVID basis. In our minds, and what we want to convey to readers: simple is better, and that’s why we’re focusing on margin debt.

Margin debt – the amount that individuals and institutions borrow against their stock holdings as tracked by Financial Industry Regulatory Authority (FINRA) – has soared to record levels since the COVID lows of 2020. It’s a simple indicator of stock market leverage. Turning points in markets develop when leverage is unwound, and Bank of America’s Stephen Suttmeier has spotted “potentially a bearish peak for margin debt in June 2021.” 

“Rising leverage tends to confirm US equity rallies. It is not new record highs for margin debt that we worry about. We get concerned when margin debt stops rising to suggest that investors have begun to reduce leverage,” Suttmeier said. “


7:35 am

Good Morning!

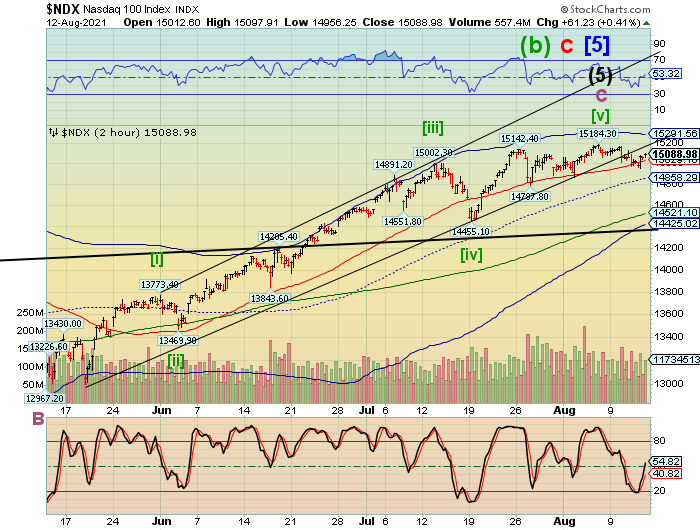
NDX futures appear to have made another all-time high at 15393.40 in the early hours of the day, but appears to have sold off to 15338.40 at this time.  Today is day 259 in the current Master Cycle, so we may be seeing NDX lead a probable bearish reversal after Monday’s panic rally.  Make no mistake, this is topping action at its best.  The market must have investors’ maximum exposure on the wrong side before taking them down.

ZeroHedge observes,  “In his latest note on markets, Goldman’s head of hedge fund sales, Tony Pasquariello, muses on the dog days of summer where “market volumes have receded to their lowest levels of the year and 1-month realized volatility on S&P has leaked into single digits.” And given the lack of tactical action – i.e., the Goldman flow desk is dry as a bone –  Pasquariello,  takes a “step back to think bigger picture on where the markets are headed.”

To do that, the Goldman trader writes that “at the risk of severe over-reduction, here’s one of the most bullish scenarios that I can sketch out for the next year or so … and, one of the most bearish…”


SPX futures are clenched in one of the most narrow trading ranges between 4480.40 and 4491.40.  The break may be sudden and dramatic.  However, in the absence of another catalyst, we may see the markets creep along at these levels until after the Jackson Hole Symposium.

ZeroHedge reports, “US equity futures traded flat near all-time highs in a muted session as traders prepared for the Fed’s annual Jackson Hole symposium with little action across markets. The dollar was steady, while Treasurys and bitcoin fell and oil reversed losses. Contracts on the Nasdaq 100 and S&P 500 were fractionally lower after trading in the green for much of the session. Their underlying indexes closed at a record as strong corporate earnings and a rally in commodity prices outweighed lingering concerns about the threat of Covid-19 to the global economy.”


VIX futures rose to 17.49, challenging the 50-day Moving Average at 17.41 before falling back beneath it.  The stage may be set for a lift-off which may begin in anticipation of the Jackson Hole outcome.


USD futures appear to be consolidating within yesterday’s trading range.  The Cycles indicate no directional movementuntil next week, where trending strength may return.


TNX is on the rise again, having risen above Intermediate-term resistance at 12.77.  This puts TNX  on a buy signal with confirmation above the double resistance at 13.41 to 13.61.  This sets the stage for a 3-4 week rally that may approach 20.00.

ZeroHedge notes, “Three weeks ago, moments after the Treasury released its latest Treasury issuance Sources and Uses report which virtually nobody on Wall Street pays attention to, we confirmed  something we first observed months earlier: stealth QE – which as we explained early this year is how the Treasury injected $1.5 trillion of liquidity into the market in the past 12 months bypassing the Fed entirely – was not only over but was about to go into reverse as the US Treasury was set to unleash several hundred billion of quantitative tightening.

The reason: after dropping to a post-covid low of $450 billion, the Treasury’s cash balance would first drop to $300 billion, and then continue declining for the duration of the debt ceiling negotiations (which will conclude successfully at some point in the next 2 months despite days of theatrical posturing as the US will not default) before surging to $800 billion by year end.”


Posted in Published | Comments Off on August 25, 2021

August 24, 2021

2:32 pm

It appears that we are now counting “wriggles” in the pattern.  This is a small extension with a probable target near 4495.00.    All trends end in a 5-Wave impulse, down to the last degree.  I am observing at least 8 degrees of trend, some of which aren’t illustrated for lack of space.    Odd as it seems, there is  a pattern that emerges out of this chaos that may surprise even the best of analysts.

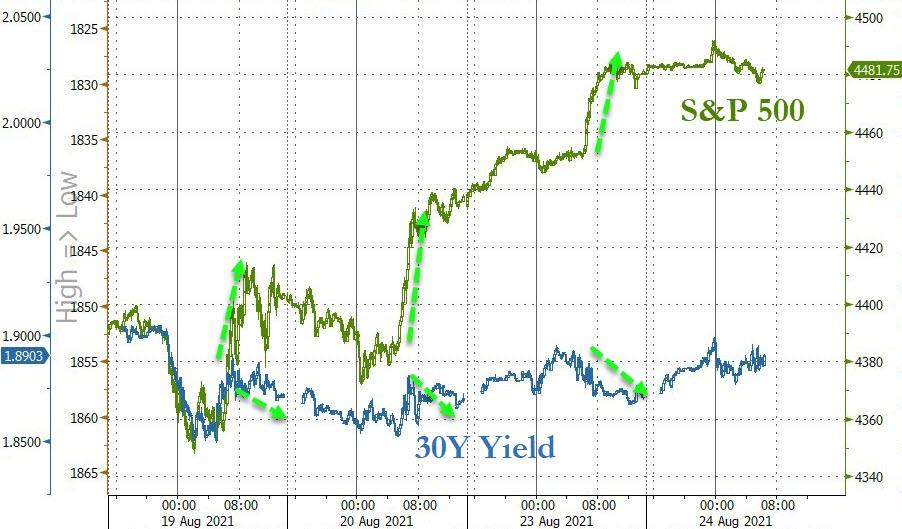
ZeroHedge comments, “The last three days in stock-market-land have been somewhat farcical as stocks have exploded higher (dominated by action at the cash market open) while bonds have refused to follow suit…

Source: Bloomberg

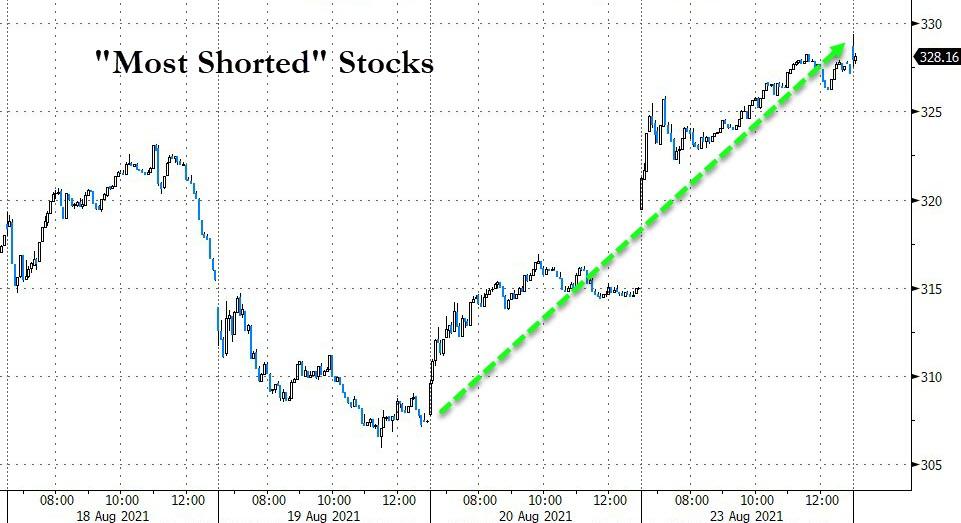
What drove this crazy? Simple – as Nomura’s Charlie McElligott notes – A good ol’ fashion short-squeeze:

Source: Bloomberg

The cross-asset-class strategist noted that yesterday our futures imbalance monitor showed the largest 1d “buy pressure” in S&P futures that we’ve seen over the past month across all lot sizes and the 2nd largest “buy pressure” in NQ futures over the past 1m.”


8:00 am

Good Morning!

SPX futures made a new all-time high in the overnight session, but have pulled back beneath yesterday’s cash high.  Today is day 258 of the Master Cycle, so I would expect some resolution in the next 24 hours.  Wave [v] equals Wave [i] at 4495.00, which is also the location of the Cycle Top.  The point is, anything may happen and the catalyst for the reversal may be a complete surprise.

There are five discernible Waves is Wave [v], which usually means the pattern may be complete.  However, there are ways that it can be stretched to reach , for example, 4500.00.  The point is, we are also at reatest risk of a reversal.

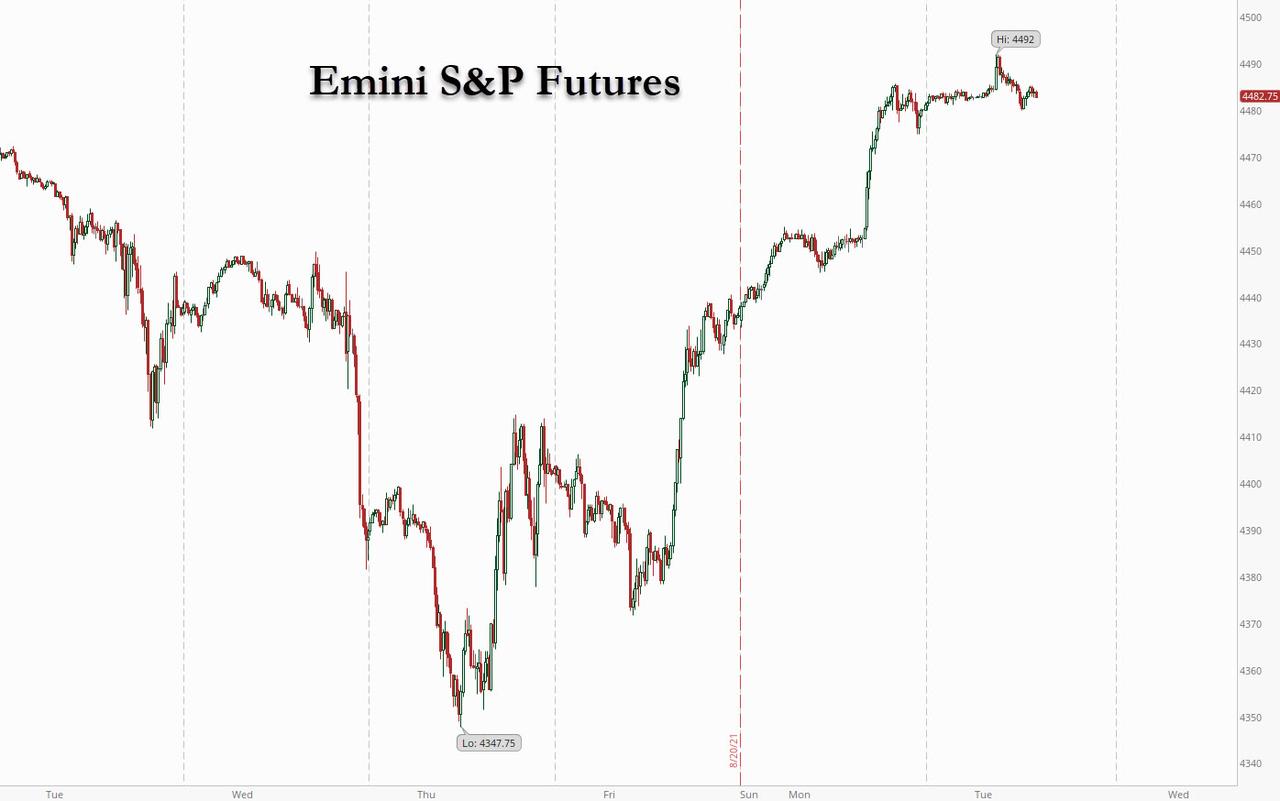
ZeroHedge reports, “Another day, another record high in US equity futures as spoos hit a new record high of 4492 just before the European open, with Nasdaq 100 futs also hitting a record as positive news around U.S. vaccination boosted shares of energy and travel-related companies while expectations of a dovish Jackson Hole boosted overall market sentiment. At 7:30 a.m. ET, Dow e-minis were up 57 points, or 0.16%, S&P 500 e-minis were up 7.5 points, or 0.17%, and Nasdaq 100 e-minis were up 39points, or 0.25%.”


VIX futures have risen off the bottom, but not above the 50-day Moving Average at 17.38.  That is a very low bar to hurdle, so today would be a good day to stay alert for that event.

The NYSE Hi-Lo-Index rose to an intraday high yesterday at 150.00, but closed at a more reasonable 42.00.  Again, confirmation of a sell signal lies below 0.00.


TNX rmains steady beneath Intermediate-term resistance at 12.76.  A buy signal remains above that level with a possible target near 20.00.


Posted in Published | Comments Off on August 24, 2021

August 23, 2021

3:39

On day 257 we may see a reversal within 24 hours.  Draw your own conclusion.

A very frustrated NorthmanTrader reiterates, “Following all time highs last week markets actually also got to within an inch of a complete breakdown. Again. And again they were saved in the nick of time with the predictable Fed cave on tapering to unfold this week during Jackson Hole and looking to make new highs again this week. 10 weeks in a row. 10 months in a row. If markets seem to have a programmed consistency about them it is because they do. The rally has gotten to persistent and steep that failure is not an option. Indeed markets MUST make new highs every week or risk the break of the trend.

Failure is not an option.”


7:33 am

Good Morning!

SPX futures rose over the weekenf to a high of 4458.50, testing the short-term trading channel trendline near 4460.00.  The retracement had already reached a 61.8% retracement by mid-afternoon when a panic bid hit the tape in the final hour.  Of course, being monthly options expiration, it took on a life of its own as gamma pressure is self-reinforcing.   This may have caused the dealers to buy in the weekend futures to pay for options that settled on Saturday morning.  Today is payoff time (T+2).  We may see the panic bid reverse after the open as a possible top-to-top 4.3-day Cycle completes in hour 2 of the cash market.

The NYSE Hi-Lo Index closed at -17.00 on Friday, clearly on a sell signal.  It would take a lot to reverse that signal.

ZeroHedge reports, ” US stock-index futures gained along with global equities as concerns about China’s crackdown faded and as investors sought to take advantage of last week’s market weakness after Dallas Federal Reserve President Robert Kaplan said on Friday he’s open to adjusting his view that the central bank should start tapering its asset-purchase program sooner rather than later if the delta variant persists and hurts economic progress. Bond yields rose as demand for havens eased. Commodities also rallied after China announced no new cases suggesting the Delta scare is ending; The dollar was weaker and Bitcoin surged above $50,000, the highest level since mid-May. At 7am ET, Emini S&P futs were up 15 points or 0.34% to 4,452; Dow futures rose 158 points or 0.45% and Nasdaq futures were 40 points higher or 0.27%.


NDX futures hit a weekend high of 15155.40, less than 30 points away from its all-time high.  Should it go higher, it may reach its Cycle Top at 15253.92 sometime today.  Today would be day 257 of the current Master Cycle, so my comment about a possible Cycle Top early this week may have been prescient.  This fits the Cycles Model calrendar for a Master Cycle low in late October.

The NDX Hi-Lo Index closed at -195 on Friday.  neverthless, the  NDX itself may still rise due to a handful of mega-tech companies.

ZeroHedge warns, “US firms and Wall Street understand that today’s market conditions of easy money, low bond yields, and euphoric Wall Street Bets traders buying anything under the sun is the perfect time to ramp up equity issuance. In fact, stock issuance has just surpassed Dot-Com levels to record-highs.

Country western star Kenny Rogers, famous for singing the “The Gambler,” one said:

You’ve got to know when to hold ’em

Know when to fold ’em

Know when to walk away

And know when to run

A new client note from Grantham Mayo Van Otterloo & Co. LLC (GMO) investment advisors outlines that US main equity indexes are screaming to new highs, and an inconvenient truth has just emerged for bulls:

“Stock issuance in 2021 is also setting a new record, blowing away the last high set in the run-up to the Tech Bubble. This is a dubious item to celebrate if history is any guide.” 


VIX futures have held steady with a low of 18.51 over the weekend.  The 61.8% Fibonacci retracement value is at 18.34.

ZeroHedge remarks, “Back in late 2017, Bank of America’s derivatives strategists made a remarkable, if hardly original, observation – the bank said what everyone knew but was afraid to voice namely, that “In Every Market Shock Since 2013 Central Banks Have Stepped In To Protect Markets.”

Since then, the market’s Pavlovian response to unconditional central bank intervention has gotten so embedded in the collective trader psyche that neither fundamentals, nor adverse news matter any more as everyone is convinced that central banks will step in the moment there is another dip in risk assets. In fact, on Friday another BofA strategist, Michael Hartnett, wrote that in the past 18 months “the Fed has bought $4 trillion bonds, twice the amount the US spent on War in Afghanistan past 20 years as it, and other global central banks, have spent $834 million every hour buying bonds since COVID.” Add to this that the US government has spent $875 million every hour in ’21 and one gets a staggering number of $1.7 billion spent between central banks and the US government to prevent even a modest market correction.

As Hartnett put it, “little wonder everyone believes in TINA & BTD.”


TNX is holding steady beneath Intermediate-term resistance at 12.78.  The Cycles Model suggests strength returning tomorrow and possibly lasting for the next week or so.  This may be one of the leading indicators of a falling stock market.


USD futures are in a pullback from its new breakout high.  USD is due for a short-term low this week before regaining its strength in September.


Posted in Published | 2 Comments

August 20, 2021

10:25 am

I appears that the retracement may attempt a retest of the shoprt-term trading channel trendline near 4460.00, although Short-term resistance at 4436.00 may be tough with the 61.8% Fibonacci retracemennt at 4437.19.  What happens after that is a likely decline back to 4400.00 and below.   Final nsupport is at 4495.81 along with the one-year tDiagonal trendline.   This may be a good place to add short positions.


7:10 am

Good Morning!

SPX futures have ventured down to 4376.10 before a small rebound.  As in the past months, options expiration appears to be dictating the markets.  The AM settlement (at the open) shows the calls dominate by a net open interest of 4000 calls at 4400.00 while somewhat neutral territory goes down to 4375.00 (MAX PAIN), where there is an open interest of 18,243 calls and 18,631 put contracts.  As you well know, virtually 99% of all options contracts expire worthless.  The market makers (dealers and hedge funds) try to make sure that the least amount is paid out at expiration.  It’s a virtual money machine for them until an event that drives the market out of those parameters.

The PM settlement is more bearish with open interest in 5046 calls and 7180 put contracts at 4400.00.  This is where it gets interesting, since the SPX must open beneath 4400.00 but close above 4400.00 for maximum pain to both sets of option holders and the smallest payout by the market makers.  You can almost read their (collective) minds.  Keep in mind that trenndline support at 4400.00 may now be lost, giving a downward cast to market sentiment.

ZeroHedge reports, “Another ugly day for risk assets with US equity-index futures dropping alongside global stocks, as faltering growth and China’s regulatory curbs compounded risks before the Federal Reserve’s Jackson Hole symposium next week. Fears about economy-linked sectors put the Dow and the S&P 500 on course for their worst week since mid-June. The dollar extended its rally to a fresh 10 month high, oil slumped and bitcoin surged after Coinbase announced it bought $500 million in crypto would reinvest some of its profits in digital currencies. At 745 a.m. ET, Dow e-minis were down 125 points, or 0.36%, S&P 500 e-minis were down 15 points, or 0.34%, and Nasdaq 100 e-minis were down 19 points, or 0.13%.”


VIX futures remained between 22.64 and 23.90 during the overnight session.  The top trendline of the Ending Diagonal may now be support going forward.  The neckline at 24.74 may now be the immediate target, especially should the SPX fail to hold above 2375.00.  VIX is on a confirmed buy (SPX sell) signal.


The NYSE Hi-Lo Index closed at -71.00, adding further confirmation to the sell signal.  The market internals stink, but the market makers still have a (temporary) hold on things.  We may wish to check this at mid-day to see if there is further erosion.  This may indicate whether the SPX may close above 4400.00.


USD futures rose to 93.68, ending a strong week of gains.  It has broken out above the two previous highs and may be due for a modest pullback next week.


The Shanghai Composite Index took a nosedive to 3394.97, a new low, before a modest bounce in the overnight session.  It appears that the Shanghai may be gaining downward momentum next week as it approached the Head & Shoulders neckline.  This Master Cycle may last to mid-October and it may exert a heavy influence on the NDX.

ZeroHedge remarks, “Hong Kong stocks tumbled into a bear market, with the Hang Seng index sliding more than 20% from it February high on Friday after Beijing approved a new privacy law to prevent data collection by domestic technology companies.

China’s most powerful legislative body, the Standing Committee of the National People’s Congress, passed the Personal Information Protection Law that will go into effect on Nov.1, according to FT.  The move sent tech stocks plunging and leaving investors bewildered over the intensity of Beijing’s regulatory crackdown that has slammed countless sectors.


NDX futures consolidated within yesterday’s range while waiting out options expiration.  However, the internals stink of avoidance with the NDX Hi-Lo closing at -246.00.  The dealers may have a hard time keeping the NDX in a tight range.  NDX option are sparse, but Open Interest turns bearish beneath 366.00 (closing price: 363.96) in QQQ.  It may be a struggle to keep the NDX above the 50-day Moving Average at 14684.67.


TNX is sinking, showing a flow of liquidity toward treasuries.  Today may be the last day of weakness in TNX as next week ushers in two weeks of strength.  The Fibonacci calculations show the 61.8% retracement at 12.25.


Posted in Published | Comments Off on August 20, 2021

August 19, 2021

10:55 am

The NYSE Hi-Lo Index opened at -23.00 in a decline, but has bounced, though in the negative.  The sell signal remains intact.   The NDX Hi-Lo Index declined to -97.00 and may be triggering another sel signal.


10:45 am

The SPX bounce stopped near its daily Ending Diagonal trendline at 4400.00 and is declining again.  It is hard to say whether the correction may  be prolonged or not.  Howeer, once finished, Wave (v) of [i] equals Wave (i) of [i], a common relationship) at the 50-day Moving Average.   Should the decline stop there we may see another retest of the trendline near 4400.00.  As mentioned earlier, negative gamma progressively worsens beneath 4400.00 and may accelerate beneath the 50-day.

ZeroHedge remarks, “Well that de-escalated quickly…

US equity markets have got back to ‘even’ after ramping violently at the cash market open on what smells like more of a gamma spike than any real buying…

It appears the bounce is off some critical technical levels (Nasdaq at 50DMA and Russell 2000 at 200DMA).”


7:30 am

Good Morning!

SPX futures are  gapping down through the Ending Diagonal trendline as they approach the 50-day Moving Average at 4340.48.  There may be a bounce as it reached the 50-day, but the rebound may be limited by the trendline at 4400.00.  The 50-day has marked the lows since March, so that may be considered the “Maginot Line” for a larger decline.

However, the new Master cycle is not due to find a bottom until mid-October with a possible bounce to “save” options expiration in mid-September.  Therefore, support may crumble, especially as gamma hedging may now turn negative.  Tomorrow’s options are bearish beneath 4400.00, progressively more so at 4325.00, with a net open interest of nearly 4000 net put contracts.  Should the SPX slip beneath the 50-day, dealers may be forced to sell longs and go short as the decline becomes self-reinforcing.

Investors should be net short at this time, with a bouncy ride until the 50-day breaks.

ZeroHedge reports, “In a perfect storm of adverse developments suddenly sweeping the complacent and calm sea of manipulated global markets, overnight futures plunged, global stocks slumped, commodities tumbled, as investors rushed to the safety of Treasurys, sending yields sharply lower and pushing the dollar to the highest level since November,  amid concern the Federal Reserve may start tapering stimulus this year even as the delta virus variant undermines global growth. At 730 a.m. ET, Dow e-minis were down 0.92%, S&P 500 e-minis lower by 0.80% and Nasdaq 100 e-minis off 0.63%.”


VIX futures have surged to an overnight high of 24.74, testing the Head & Shoulders neckline at 25.00.   It launched above the 50-day Moving Average on Tuesday and overcame mid-Cycle resistance at 20.23 on Wednesday, clearly a Model buy signal.  Once above 25.00, VIX options and futures may likely be at a premium as sentiment dramatically changes.

ZeroHedge warns, “In the new normal world of ‘Correlation 1’ risk-on, risk-off trading, the only thing that matters is the rise and fall of the Equity vol flows.

This is why, as Nomura’s Charlie McElligott explains, with all the pre-warning warnings and expectations management, the current sudden slide in stocks is “not a taper tantrum”, adding that “yesterday’s minutes were a non-event, where the market has already price Q4 official announcement anyhow.”

Instead, the Nomura MD notes that US Equities Realized Vol is finally trueing-up to the incessant CRASH -signals from Implied Vol / Skew / Term-Structure / “Vol of Vol” signal extremes we’ve been hammering-on the past few weeks… and it’s causing a risk management / “crash” slide / stress issue around the Street now which is being traded around, ahead of the ever-critical monhtly options expiration cycle as an “accelerant” risk.”


The NYSE Hi-Lo Index gave a sell signal on Tuesday, closing at -13.00.  Yesterday’s close was sufficient to keep it on the sell signal, which appears justified this morning.  The Cycles Model suggests the next Master Cycle low (not confirmed by the SPX nor the VIX) may come in mid-September, but the final (c0nfirmed) low appears due in mid-October.  So, it appears that the Hi-Lo is a bit more nuanced during this bear market.


The Shanghai Composite Index made an overnight low at 3446.01 before a bounce.  China’s heavy handedness appears to be driving sentiment down.  The spill-over is now reaching European stocks as well as the NDX.

ZeroHedge reports, “European luxury stocks slumped, and were among the worst performers in Europe’s Stoxx 600, after Chinese state media this week said President Xi Jinping offered an outline for “common prosperity” via “wealth redistribution” – who know that China was communist after all – that includes income regulation and redistribution, putting China’s wealthiest citizens on notice. Among the biggest losers were Richemont -5.6%, Kering -5.3%, LVMH -4.2%, Swatch -3.6%, Burberry -2.7%, Hermes -2.2%. Hong Kong-listed Prada plunges 10%.”


NDX futures made a new low at 14714.90 this morning, nearing its 50-day Moving Average at 14621.67.  Investors who took last week’s sell signal had to wait through choppiness until yesterday, when it finally paid off.  There is likely to be a bounce at the 50-day, or possibley lower, at the Cycle Bottom support at 14577.75.  However, the bounce may be tied to options expiration and may dissolve by early next week.

The NDX Hi-Lo Index bounced to -1.00 in early trading yesterday, but tailed off to -96.00 at the close.  The sell signal remains confirmed.


TNX futures slid to 12.20  this morning, but may have found support and may be on the mend, with the cahs market opening at 12.32.  Dynamic strength may return early next week after being in the doldrums this week.  This may be viewed as another selling opportunity for treasuries.  The Fed ma be “led” by arket forces to begin tapering much sooner than anticipated.

ZeroHedge observes, “Dovish Fed minutes note ‘substantial further progress’ not yet been made, but most see conditions being met later this year

  • The FOMC July meeting minutes provided dovish offset from some of the hawkish Fedspeak that has been heard recently.
  • The minutes suggested that participants generally judge that the standard of “substantial further progress” had not yet been met, particularly with respect to labor market conditions, and that risks to the economic outlook remained, although most judged that it could be appropriate to start reducing the pace of asset purchases this year because they saw the Committee’s “substantial further progress” criterion as satisfied with respect to the price-stability goal and as close to being satisfied with respect to the maximum-employment goal — all dependent on progress towards the Fed’s goals.”


The BKX, our liquidity proxy, is showing signs of stress again.  It has declined very near the 50-day Moving Average at 124.72, where a sell signal lies.  Crossing the lip of the Cup with Handle at 115.00may be the “kiss of death” for market liquidity.  The next Master Cycle low may be accomplished by the end of August.   All it takes is one bank failure to set off a firestorm in the markets.

ZeroHedge observes, “With the Fed’s reverse repo facility hitting a new all time high today, rising to a record $1.116 trillion among 82 counterparties…

… the manager of the Federal Reserve’s open market operations, Lorie Logan, was quoted in the FOMC minutes as saying that “market participants were beginning to focus on the potential effects of changes in the Treasury General Account at the Federal Reserve and Treasury bill issuance over coming months in connection with the debt ceiling.” She then said that “if a number of counterparties reached the per-counterparty limit on their ON RRP investments and downward  pressure on overnight rates emerged, it may become appropriate to lift the limit.”


Posted in Published | 1 Comment

August 16, 2021

3:00 pm

With a new all-time high in the making, it’s time to reassess the Cycles.  The last Master Cycle bottomed on July 19 (day 252).  Today is day 250 of the current Master Cycle.  The amazing thing is that 17 months from the 2020 low will have elapsed on day 257, next Monday.

I have been invited to spend a couple days with one of my sons, so I may not return until Thursday.


7:30 am

Good Morning!

SPX futures challenged the August trading channel trendline at 4450.00 this morning, declining to 4446.80.  This puts us on the alert for an aggressive sell signal with further chart confirmation at Short-term support at 4425.00.  Ultimately, the uptrend isn’t broken until the SPX declines beneath the two-month trendline at 4300.00.  However, the VIX and Hi-Lo Indx may give us an earlier confirmationof the decline.

Today’s options exiration in the SPX is at Max Pain at 4455.00 where there are 1933 net open interest favoring puts contracts.  The dealers will start feeling pain at 4435.00 where they will need to gamma hedge by shorting the SPX.

ZeroHedge reports, “US equity index futures fell and the dollar rose after the latest Chinese data missed expectations and confirmed a sharp slowdown in the 2nd largest economy, while the spread of the coronavirus delta variant sparked worries the global economic rebound is faltering. Investors also awaited a town hall by Federal Reserve chair Jerome Powell on Tuesday for clues on policy following a report from the WSJ that the Fed was weighing ending taper by mid-2022. As of 730am S&P eminis were down 12.50 or 0.28% to 4,450 after hitting an all time high on Friday; Dow Jones futures were down 101 points or 0.28% and Nasdaq futures were 42.75 lower. Commodities declined after Chinese retail sales and industrial output data showed activity slowed. Alibaba slid in premarket trading again after China’s state media criticized the online-game industry.”


VIX futures challenged the 50-day Moving Average at 17.20 by rising to 17.54 in the morning session.  This puts us on high alert for a buy signal in today’s cash market session.  Friday was day 259 in the VIX Master Cycle, which may be labelled “on time” for the low  The new uptrend may last until late October.


USD futures have risen off Intermediate-term support at 92.52 this morning.  It may very quickly show signs of strength as the day goes on, building up during the entire week.


TNX declined beneath Intemediate-term support at 13.05.  It may find support at the 61.8 Fibonacci retracement at 12.25.  The Master Cycle shows rally strength returning after options expiration on Friday.  Apparently some big investors are long in treasuries.


Posted in Published | Comments Off on August 16, 2021

August 13, 2021

8:50 am

The GSCI Ag Index broke out above its previous high at 427.51 yesterday, indicating the rally is in full swing.  The Cycles Model suggests it may continue to the week of August 23.  The next resistance is at the Wave [1] high at 474.12 with additional resistance at the Cycle Top at 478.04.  Shortage-driven inflation reigns in the Ag sector.

ZeroHedge reports, “The U.S. Department of Agriculture’s World Agricultural Supply and Demand Estimates (WASDE) report was released Thursday afternoon and pointed to declining grain supplies that sent grain futures prices higher and will keep food inflation in focus.

The closely watched supply and demand report slashed estimates for corn yields and stockpiles. World inventories for wheat were reported near a five-year low.

Grain and oilseed futures soared to a near-decade high earlier this year but have been in a holding pattern for the last month, awaiting new reports on the outlook for upcoming U.S. harvests. A megadrought and back-to-back heat waves have plagued the corn belt and the U.S. West for much of the summer. 

December corn futures were up more than 2% to $5.7150 a bushel on the Chicago Board of Trade, soybean futures popped on the report and are now flat at the end of the U.S. cash session, wheat futures rose more than 3%, hitting a fresh eight-year high.”


7:40 am

Good Morning!

SPX futures rose to a new all-time high 4465.30, then eased back to the flat line.  The open interest in calls is a net 3600 at 4450.00, a net 3758 at 4460.00 and a net 2400 at 4465.00.  MAX PAIN is at the trendline near 4440.00, beneath which the puts rule.  The objective for options expiration is to close at MAX PAIN.

ZeroHedge reports, “S&P 500 futures celebrated Friday the 13th with a brand new record highs on Friday boosted by Walt Disney’s forecast-beating results, while signs of cooling inflation and a strong recovery in corporate earnings kept the indexes on track for a second straight week of gains. But the real party today was in Europe, where stocks headed for the 10th consecutive record high, the longest winning streak since 1999, as bullishness swept across markets after a blowout earnings season and economic recovery out of lockdowns. Asian markets, Treasury yields and the dollar dipped while cryptos surged with both bitcoin and ethereum up around 5%. At 730 a.m. ET, Dow e-minis were up 46 points, or 0.13%, S&P 500 e-minis were up 1.5 points, or 0.06%, and Nasdaq 100 e-minis were down 3 points, or 0.01%.”


VIX futures remained flat during the overnight session with a low of 15.53.  It is currently positive but not near the 50-day Moving Average at 17.25.  The Master Cycle appears to be complete at day 258.

ZeroHedge comments, “We live in fascinating times. Today, we have a unique opportunity to observe one of the biggest speculative bubbles ever, and to understand how financial markets evolve towards critical points.

While Western central banks have lost control in March 2020, flooding the system with absurd amounts of liquidity, a scary number of participants are now convinced that monetary illusion will make them rich.

Unfortunately, historical analysis of capital markets shows us that the exact opposite is likely to happen. But no one really cares about empirical evidence. People are even becoming more aggressive – especially on social media –, whenever someone tries to warn of an incoming tail risk event.

The question is, why? If people are so comfortable with their “stock only go up” scenario, then why worry?”


NDX futures topped out at 15096.50, then resumed their decline.  Short-term support lies at 15029.10, beneath which lies a confirmed sell signal.  The NDX Hi-Lo Index closed at -23.00 yesterday, giving condirmation of the decline while the VXN/VIX both hover beneath their respective 50-day Moving Averages.  Breaking support is likely to punch volatility over resistance.

ZeroHedge cautions, “Back in early February of 2020, I noted that, even as the major stock market indexes had pushed to new highs, a number of Hindenburg Omens had been triggering on the NYSE and the Nasdaq pointing to a significant deterioration in breadth:

“While an individual signal has very little value in forecasting a stock market crash… a cluster of signals can be valuable in that it signals a pattern of dispersion that is not compatible with a healthy uptrend.”


The Shanghai Composite fell through Intermediate-term suport at 3513.20 to 3500.50 before bouncing.  This is confirmation of the sell signal and may offer a heads-up to developments in the NDX in the coming weeks.  SSEC also put in a Master Cycle high on Wednesday, indicating a potentio decline that may last through mid-October.

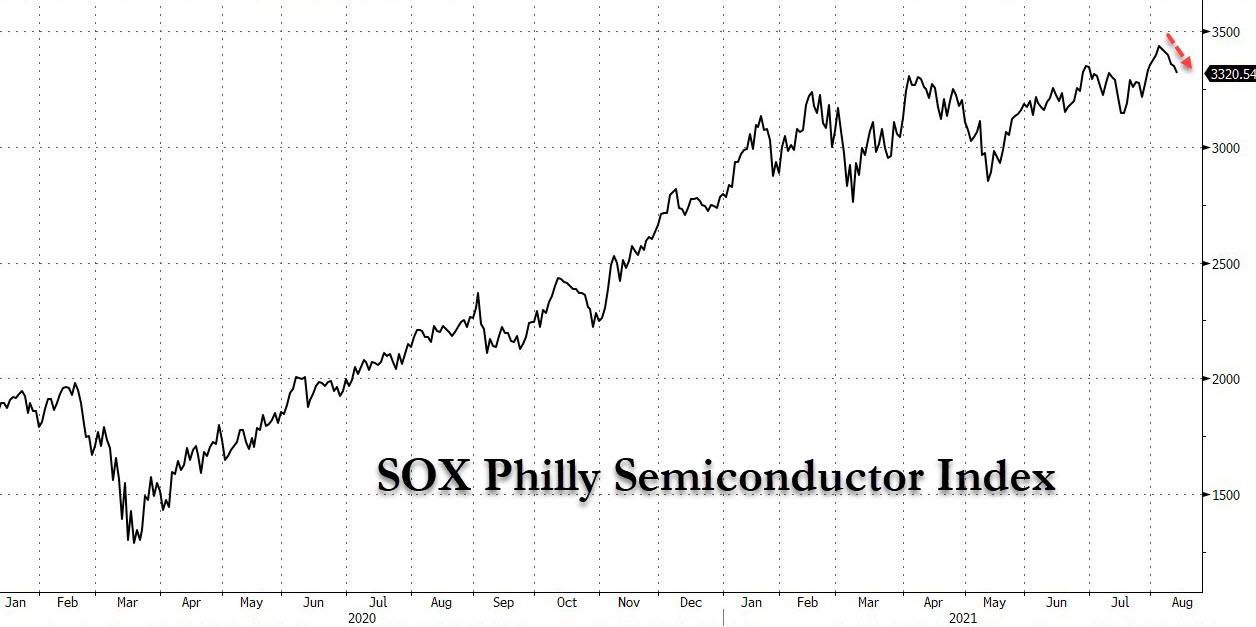
ZeroHedge observes, “The semiconductor space has long been viewed as one of the best leading indicators of the modern technological economy (and capital markets), and with good reason: it was the first sector to bottom in March 2020 when it became apparent that China and various western central banks would inject trillions into the global economy, and had enjoyed a nearly relentless upward climb since then peaking just over a week ago on August 4, but then something snapped…

… and as shown in the next chart, the Semi Index is broadly lower again, having dropped for six consecutive sessions – the longest such streak since the October 2018 Fed “policy error” when stocks cracked after Powell threatened to tighten far more than markets expected, only to end his hiking cycle prematurely just two months later, resulting in the first bear market in a decade.”


USD futures have pulled back this morningand may test support at 92.50.  It may regain its strength next week as it resumes its rally.


TNX pulled back from the 50-day Moving Average at 13.82.  It did not find support at mid-Cycle support at 13.44, so the decline may continue no lower than Intermediate-term support at 13.13.  Any pullback may be used as an accumulation phase for the next surge higher in about two weeks.

ZeroHedge reports, “After yesterday’s blockbuster, record-setting 10Y auction which saw many buyside metrics print at the strongest levels on record (nearly 4bps stop through, record high indirects), traders expected today’s last refunding auction – when the Treasury sells $27BN in 30Y paper – to be a more muted affair. According to Bloomberg, investors should go for the $27 billion bonds auction with yields above the round threshold of 2% and there is likely to be a smattering of short covering at the 1 p.m. NYT deadline with 30Y paper trading special in repo.

“The 30-year auction will not have a bid from central banks, in our view,” wrote Padhraic Garvey, head of global debt and rates strategy at ING Groep NV, noting that yields on the long bond are about 2% and broadly in the same area as last month’s sale. “It’s in a similar boat this time around.”


Posted in Published | 13 Comments

August 12, 2021

12:17 pm

In the meantime, the NDX has made a partial retracement of its decline and appears poised for the next (most powerful) phase of its decline.  Because its peaked on August 5, its decline may take 12.9 days.  NDX has a tentative target at 6503.00, a potential 67% decline.  Short-term support is at 15024.00 for a confirmed sell signal.

2:30 pm

The NDX Hi-Lo Index fell to -7.00 this afternoon.  A close beneath 0.00 is a sell signal.  The VXN is still beneath its 50-day Moving Average.


12:05 pm

It appears that I got what I wished for.  SPX rose to 4450.21 thus far and appears to be making the final (finally!) probe to as high as 4455.00.    Today is day 276 of the Master Cycle.  It appears that, due to the spill-over of this Cycle, the next Master Cycle may only last until August 24-25 (8.6 market days).  That may be one of the shortest Master Cycles on record, but don’t let that fool you.  It could be a monster.  Sell below 4435.00.


10:26 am

SPX appears to be constrained by tomorrow’s options expiration.  4450.00 and below are skewed toward puts, while 4455.00 and above are skewed toward calls.  There appears to be a reluctance to push higher.  SPX futures, which track closely with the cash market, topped out this morning at 4449.80, just above yesterday’s high.   But the cash market gapped down at the open and is only now back in the MAX PAIN zone.   No technical damage was done by the decline, but the chances of a new high are diminishing by the hour.   Honestly, I would rather see a quick run above 4450.00, then the revesal will be more obvious.  Neither the VIX nor the Hi-Lo are supporting a sell signal yet.

There may be an aggressive selling opportunity beneath 4435.00.


8:00 am

Good Morning!

The Shanghai Composite Index was rejected at the 50-day Moving Average, declining to Intermediate-term support at 3510.24 before a bounce.  This tech-heavy index exerts a lot of influence on the NDX.  We may consider a further decline beneath the Intermediate-term support as a confirmed sell signal.

ZeroHedge reports, “One month ago we observed that after tumbling for much of 2020 and even turning negative early Q2, China’s credit impulse had finally troughed with significant consequences for global reflation. But with China’s economy rapidly slowing and Beijing considering what is the best way to stimulate the economy without leading to another overheating, the latest Chinese credit data released overnight which missed every consensus expectation, confirmed that Beijing’s latest attempt to reflate the local (and global) economy will not be a walk in the park.”


NDX futures remain anchored near 15000.00, where it has bounced.  Short-term support is at 15008.00, where a confirmation of the trendline sell signal lies.  NDX internals are weaking.  The NDX Hi-Lo closed at 7.00 yesterday, just above absolute zero, which confirms the sell signal.  I will keep you posted.


SPX futures hugged the flat line during the overnight session.  If my observations are correct, there may be a final push to 4455.00, or somewhat higher.  It would not surprise me to see this move in the first hour of trading in the cash market.

ZeroHedge reports, “Another day, another all time high in US equity futures with spoos trading at the nice, round 4,444 on Thursday morning, while Dow futures also hit a record high on Thursday ahead of earnings reports from companies including Walt Disney and data expected to show a jobs market recovery was on track.

Yet while nothing can stop the relentless juggernaut in US stocks, global equity markets fluctuated on Thursday, with European shares taking a pause after an eight-day rally of record highs on a mixed batch of earnings as Asian shares failed to follow a strong close on Wall Street with fears about the spread of the Delta variant of the coronavirus weighing on sentiment even as tame U.S. inflation eased fears the Federal Reserve would rush to reduce its economic support. As of 715am S&P futures were up 4 points to 4,444, Dow futures traded up 43 points or 0.12% and Nasdaq futures were 4.75 higher or 0.03% to 15,024. Treasury 10Y yields rose as high as 1.36%, reversing the drop after yesterday’s stellar 10Y auction as a 30Y auction looms; the dollar nudged higher while copper prices jumped after workers at a mine in Chile threatened to strike. Bitcoin dropped to $45,000.


VIX futures rose above yesterday’s low at 15.87, which appears to be the Master Cycle low.  This morning’s low was 16.04.  It doesn’t have far to go to the 50-day Moving Average at 17.27 to make a buy (SPX sell) signal.


TNX appears to be approaching the 50-day Moving Average at 13.88, where it may be due for a test today.  A pullback is due where long TNX (short UST) positions may be taken.


Posted in Published | Comments Off on August 12, 2021

August 11, 2021

10:25 am

Now that SPX has risen to a new high, it appears to be aimed directly at the Cycle Top resistance at 4468.30.  The triangle formation tells us that this is the final move to the peak.

The VIX made a new (Master Cycle) low this morning at 16.08 in an all-out effort to keep equity momentum high.  Unfortunately, at day 275 in the SPX, the Cycle may be totally exhausted.


7:30 am

Good Morning!

SPX futures challenged yesterday’s low at 4430.00 by declining to 4427.60 this morning.  The (cash) low may act as a trigger point for a short position.  Yesteray’s high at 4445.21 did not even achieve the minimum move out of a triangle at 4446.82.  Time has run out on the 274 day-old Cycle.   The Cycles Model suggests the new Master Cycle (low) may occur on August 26 after 12.9 days of decline.

ZeroHedge reports, “Another day, another extremely tight range of overnight futures trading – with spoos stuck in a 1% range for the past two weeks, it feels as if nothing can push the index away from its massive gamma gravity around 4,400, although today’s CPI – if it shocks either higher or lower relative to expectations – may be just the trigger that breaks this boring rangebound market. 10Y Yield rose as high as 1.375% as the dollar tracked the move higher.

Amid muted trading volumes, S&P futures dipped slightly lower from a fresh record ahead of data out today showing U.S. consumer prices probably jumped again in July; Nasdaq futures fell on Wednesday, while Dow indicators rose slightly as investors swapped heavyweight technology stocks with economically sensitive sectors following the approval of a U.S. infrastructure bill. At 745am ET, Dow e-minis were up 2 points, or 0.1%, S&P 500 e-minis were down -5 points, or 0.11%, and Nasdaq 100 e-minis were down 31points, or 0.2%.”


NDX futures are still attracted to round number support at 15000.00.  However, it has broken the Ending Diagonal trendline leaving Short-term support at 14976.24 as the final confirmation of the uptrend.


VIX futures rose to the 2000 gap trendline at 17.08 in the overnight session.  The 50-day Moving Average at 17.39 gives us the buy signal for the VIX after last Friday’s Master Cycle low.


USD futures made a new high at 93.19 before pulling back, still in positive territory.  The Cycles Model offers a triple dose of strength next week, so we may see a further pullback in anticipation of that robust momentum.


Gold Futures probed above the Broadening Wedge trendline at 1730.00 today.  Monday’s low at the Head & Shoulders neckline may not be the final low.  We will know further in the next week.  Unfortunately, “buy the dip” will be heard all the way to the bottom, where there will be silence.

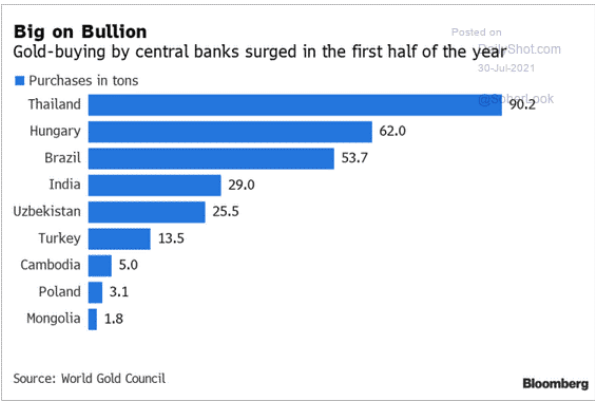
ZeroHedge observes, “Below we unpack the implications behind central bank gold purchases (rising), negative real yields (falling) and Stanley Fischer’s Fed-speak (cringing).

What Bankers Do, Rather Than Say

By now, the open farce as to “central bank transparency” has been made abundantly clear; looking for plain-speak honesty in such circles is akin to looking for an honest man in parliament.

Thus, rather than just follow what central bankers say, it’s often far wiser to watch what they do.

Central Bank Gold Purchases

Toward this end, it’s worth noting that central banks have been buying gold lately, and at significant levels.”


TNX futures rose to a new high at 13.78, suggesting the cash market has further to run.  The next resistance is the 50-day Moving Average at 13.93.  The next Master Cycle (high) may terminate during the week after the September options expiration.

ZeroHedge observes, “While nerves may be rising ahead of tomorrow’s CPI print which – if it comes in hotter than expected – could ensure a taper announcement is coming as soon as this month, that was not on exhibit during today’s first of the week refunding coupon auction, in which the Treasury sold $58 billion in 3Y notes to surprisingly strong demand.

The high yield of 0.465% stopped through the 0.468% When Issued by 0.3bps, the biggest stop through since March and followed last month’s 0.2bps tail. The yield was modestly higher than last month’s 0.426%.

The bid to cover of 2.541 also came in strong, rising from last month’s 2.411 and also above the six-auction average of 2.450. In fact it was the highest since March 2021.

The internals were quite solid too with Inidrects awarded 55.4%, well above both July’s 53.2% and the six-auction average of 2.450. And with Directs taking down 18.4%, a number in line with recent auction and the highest since Dec 2019, meant that Dealers were left with just 26.2% which was the lowest since August 2017.

Altogether a very strong start to the week’s coupon issuance however it appears to have been priced in as 10Y barely shrugged in response. Tomorrow’s $41 billion 10Y auction will be another story, however the solid demand for the front-end today suggests that worries over tomorrow’s CPI print may be exaggerated.”


The GSCI Ag Index has another week or more to break out above the Wave (B) high and re-esablish the uptrend.  It is above the 50-day Moving Average at 410.41 and on a buy signal. but the trend is still uncertain.  With the drought, heat and wildfires in the US, processing plants in Canada on strike, drought and cold in South America and floods in China and Europe, the fundamentals indicate food demand may outstrip supply very soon.

ZeroHedge advises, “Brazil’s top producing regions for coffee, oranges, and sugar have been devastated by the worst weather in decades and could leave a lasting impact on prices, according to Bloomberg.

The South American country is one of the world’s leading coffee, sugar, and orange producers experienced a cold snap and drought this growing season in the Center-South area that has significantly damaged crops.

We have focused on coffee and orange markets and how prices are sloping higher after harvest output will likely come in well below average.

Now we’re setting our eyes on the sugar market, where losses in production, exacerbated by an already tight global supply, is fueling higher prices that may be sticking around for the next 18 months. ”


Posted in Published | Comments Off on August 11, 2021