August 5, 2021

1:03 pm

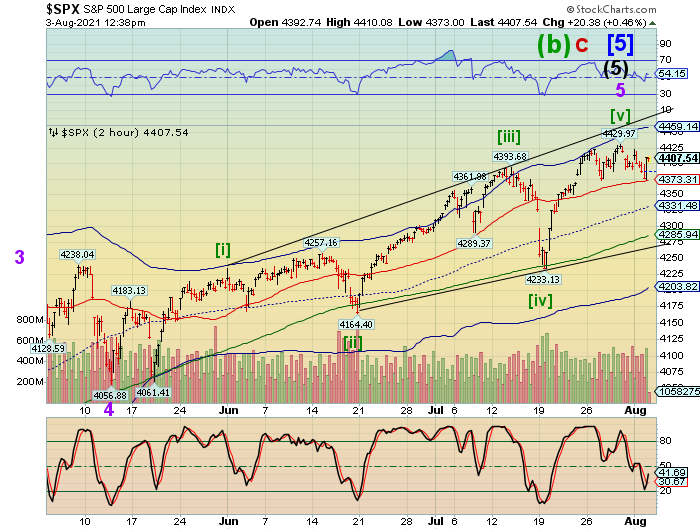
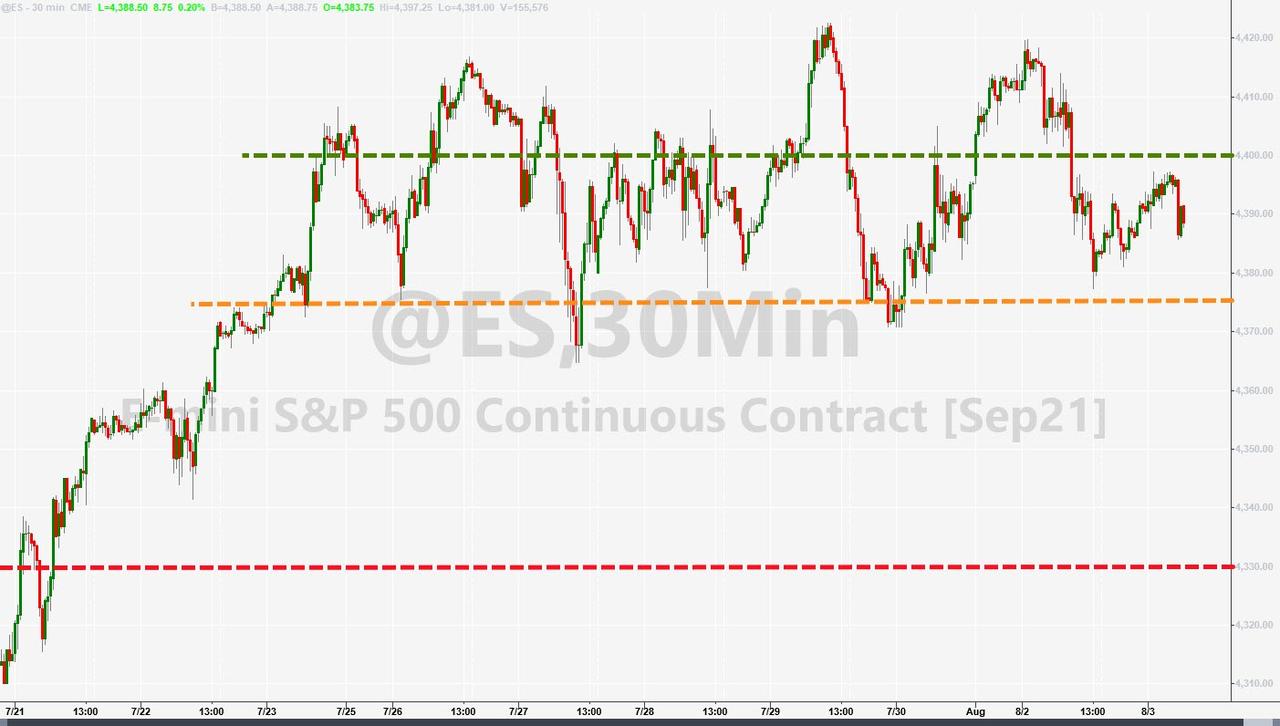
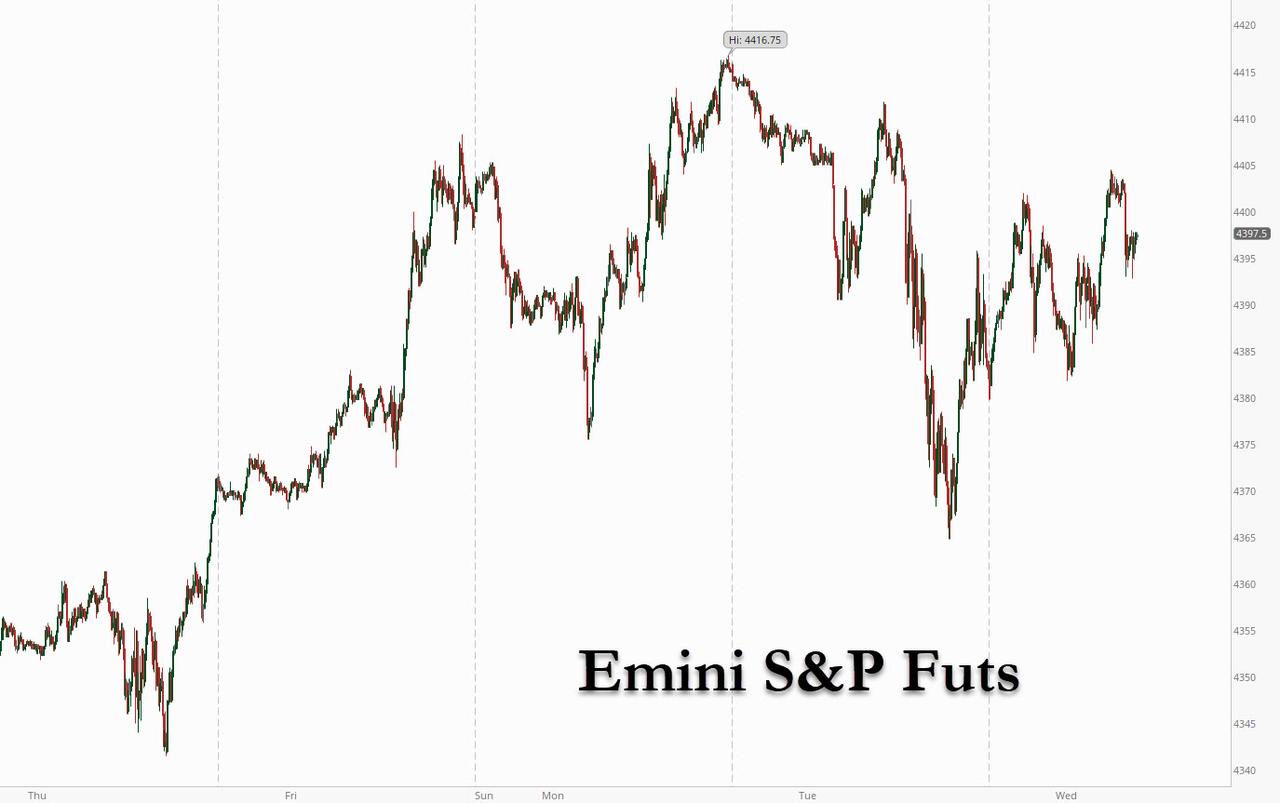
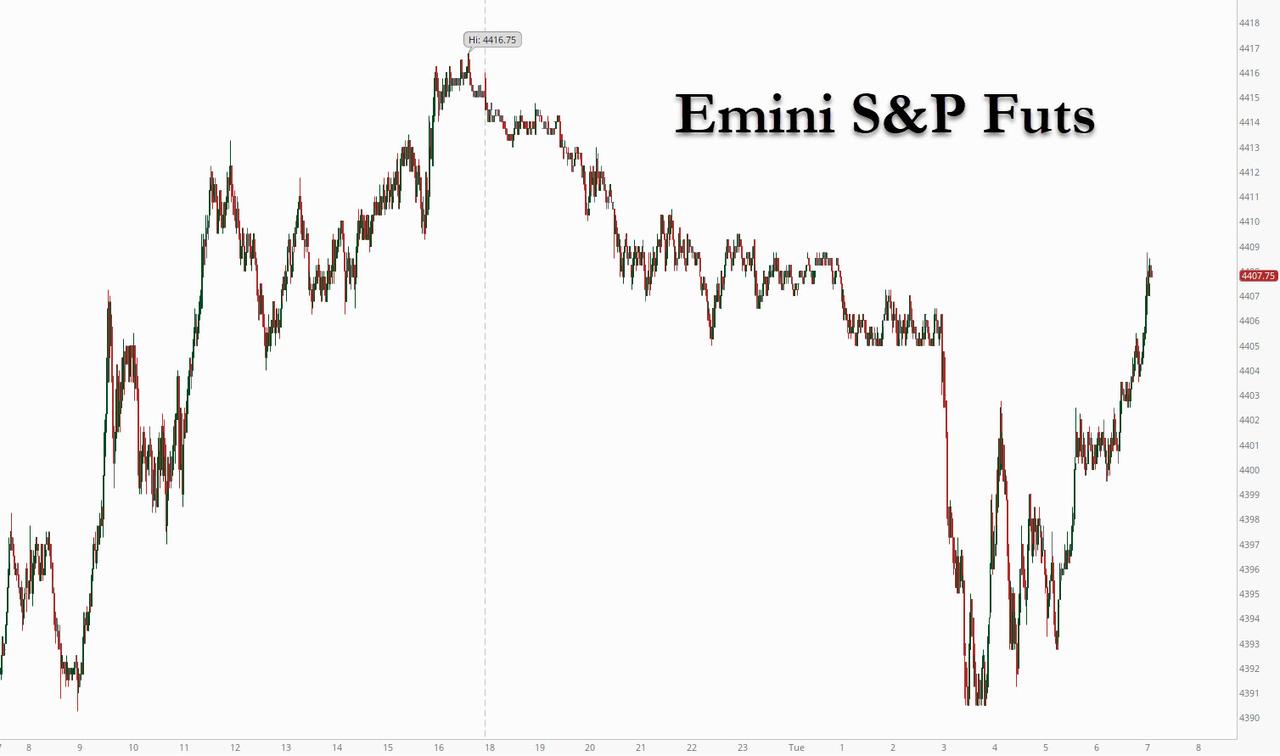
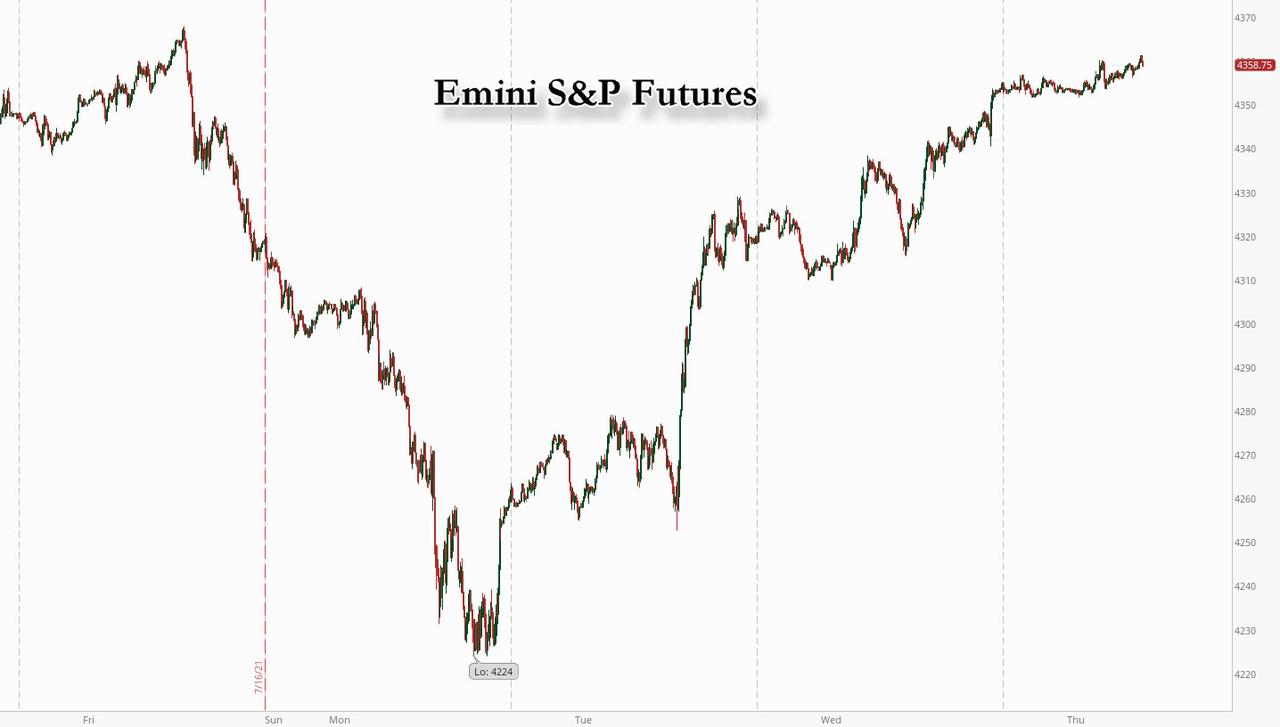
This market may get crazy here.  The venue is bifurcating with the primary outlook is a rally to the Cycle Top at 4457.76 as the primary target.  (NDX has made a new all-time high today.  The DJIA has not.)  But at day 269, we are running out of time.  A lesser, but growing outlook may be a potential failure at this level.  Short-term support has risen to 4389.96.  Net open interest in calls is is 3994 at 4400.00, but drops off a cliff beneath that level.  Net open interest in puts is at 4571 at 4375.00.  A slip hare may cause the dealers to shift to the short side in a real hurry.

ZeroHedge remarks, “Earlier today we discussed the “incredible anchor” that has emerged around the 4,400 level in spoos and as more traders inquire what is behind this strange attractor, Nomura’s Charlie McElligott has followed up on this writing that the 4,400 strike continues to choke markets and dealers on “long gamma” at the money with $7.1B accumulated there (although in a sign that market will likely keep grinding higher, 4450  $5.7BN has been built up at 4,450 and another $4.6BN at 4500 and growing)…

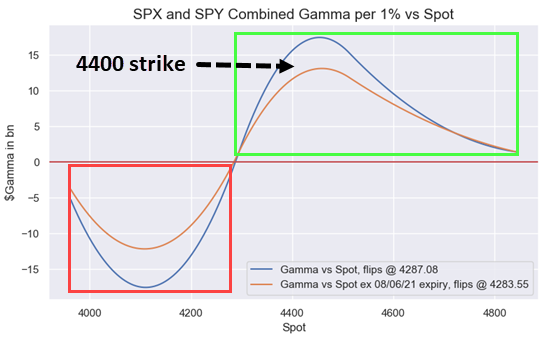
… and as McElligott notes, “we simply cannot break the tractor-beam, as the “strangle seller” laughs his way to the bank…for now”… but in an ominous observations, the Nomura strategist notes that the US equity vol complex remains to “incoherent” or even “broken,” as SPX realized remains cratered (10 day @ 9.2), versus implied vols staying really firm / effectively the entire VIX futs strip ref mid- / low- 20s.”


12:53 pm

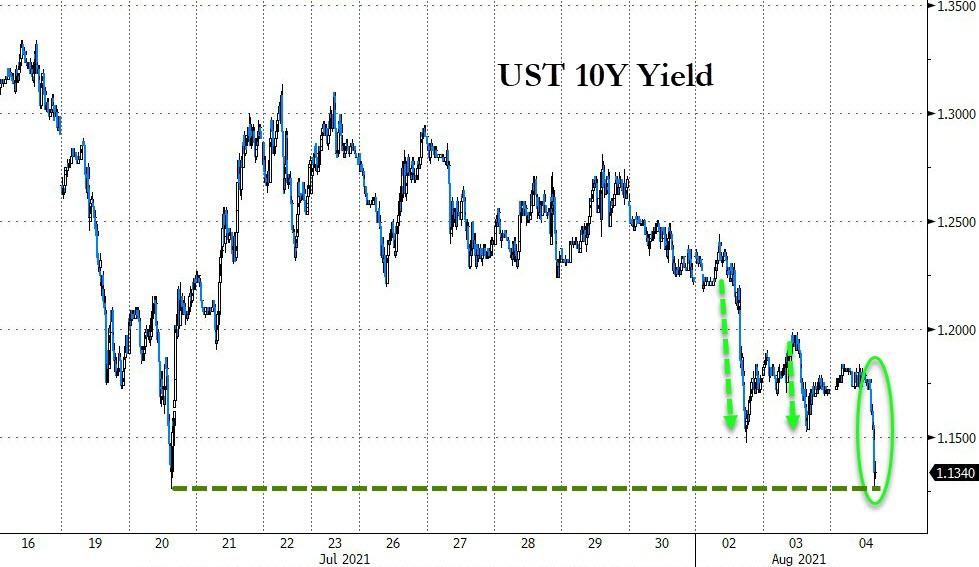
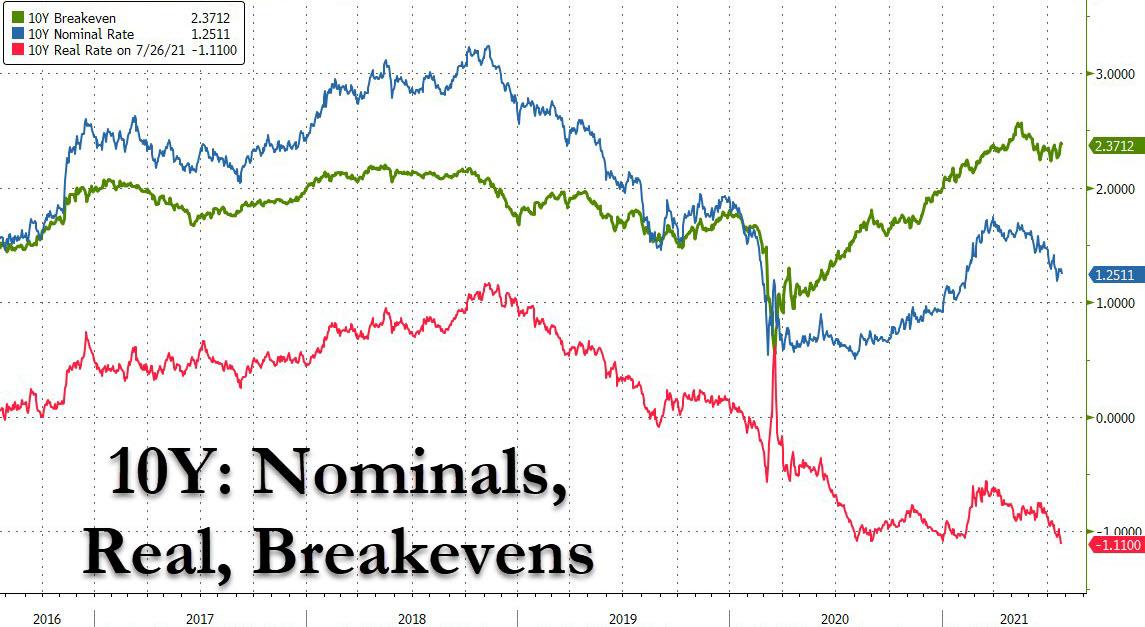
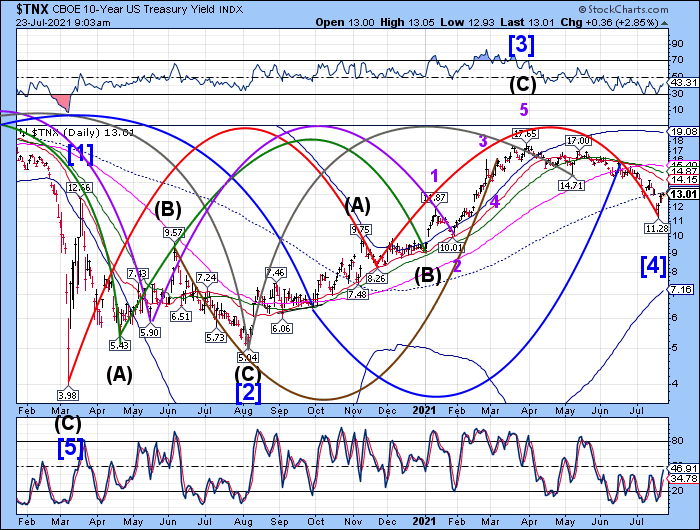
TNX is about to make its final plunge to 11.24 where Wave (v) equals Wave (i) of Wave 5 of (C).  This may happen in the next day or so.  Stay alert.  TNX may be jammed lower to boost the SPX.  Investors are beginning to think this is a new trend.  The reversal may be dramatic.

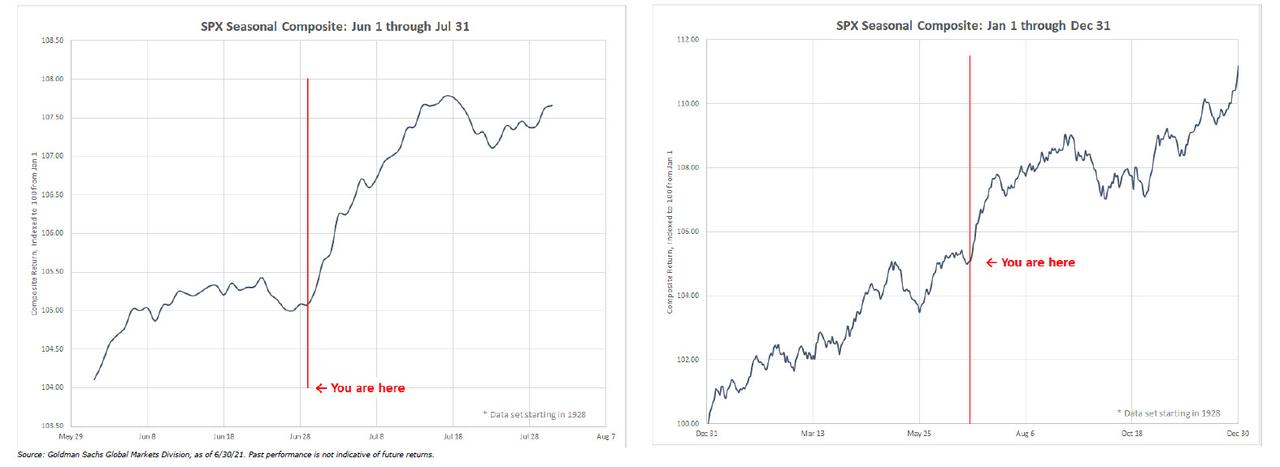
ZeroHedge observes, “Back in June, when the S&P was still trading in the mid 4200’s, Goldman’s chief equity strategist David Kostin published a cautionary note asking “what if we are wrong” in his assumptions, which was meant to provide cover in case stocks tumbled and/or rates spiked but which also had a prudent outlier loophole in case the meltup in markets accelerated and took out the bank’s year-end price target 4300. Specifically, falling back on the old faithful Fed model, Kostin – who was expecting yields to rise to 1.9% by year end, said that if – all else equal – interest rates remain roughly flat at around 1.3% (or lower) through the end of this year, “Goldman’s S&P 500 dividend discount model (DDM) would suggest a fair value of 4700, or 9% above the bank’s current baseline price target of 4300.


7:46 am

Good Morning!

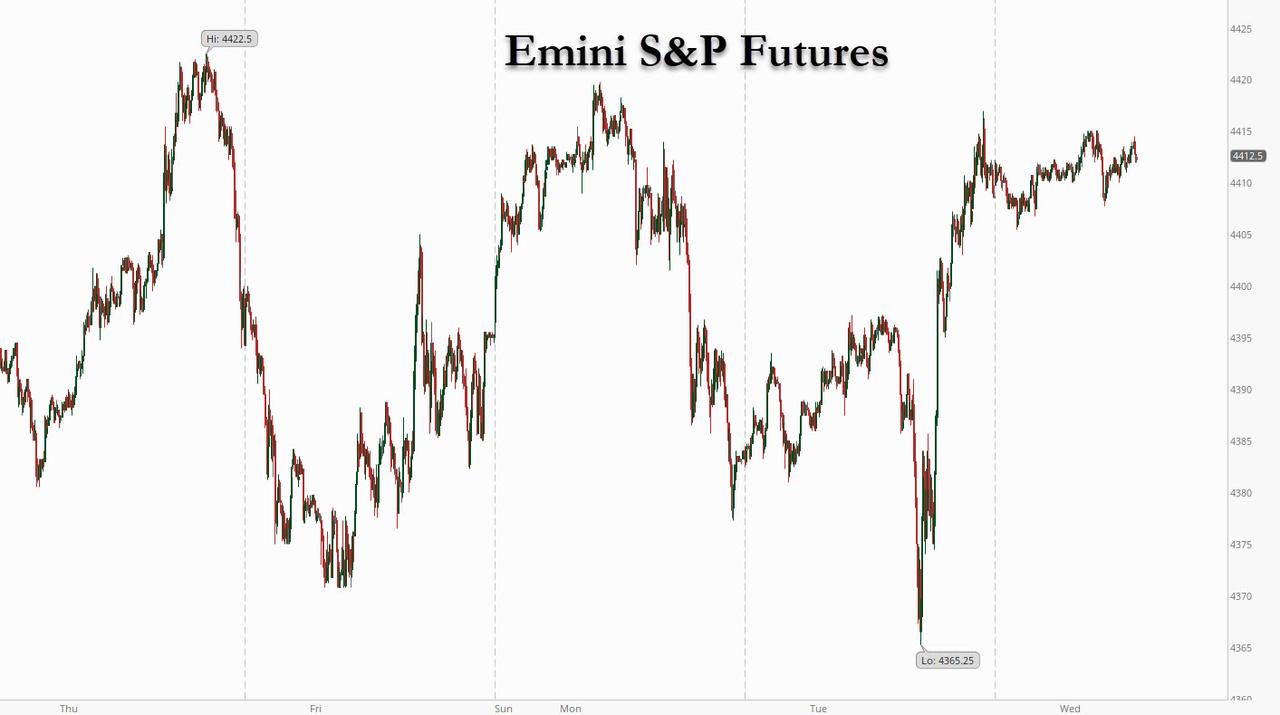
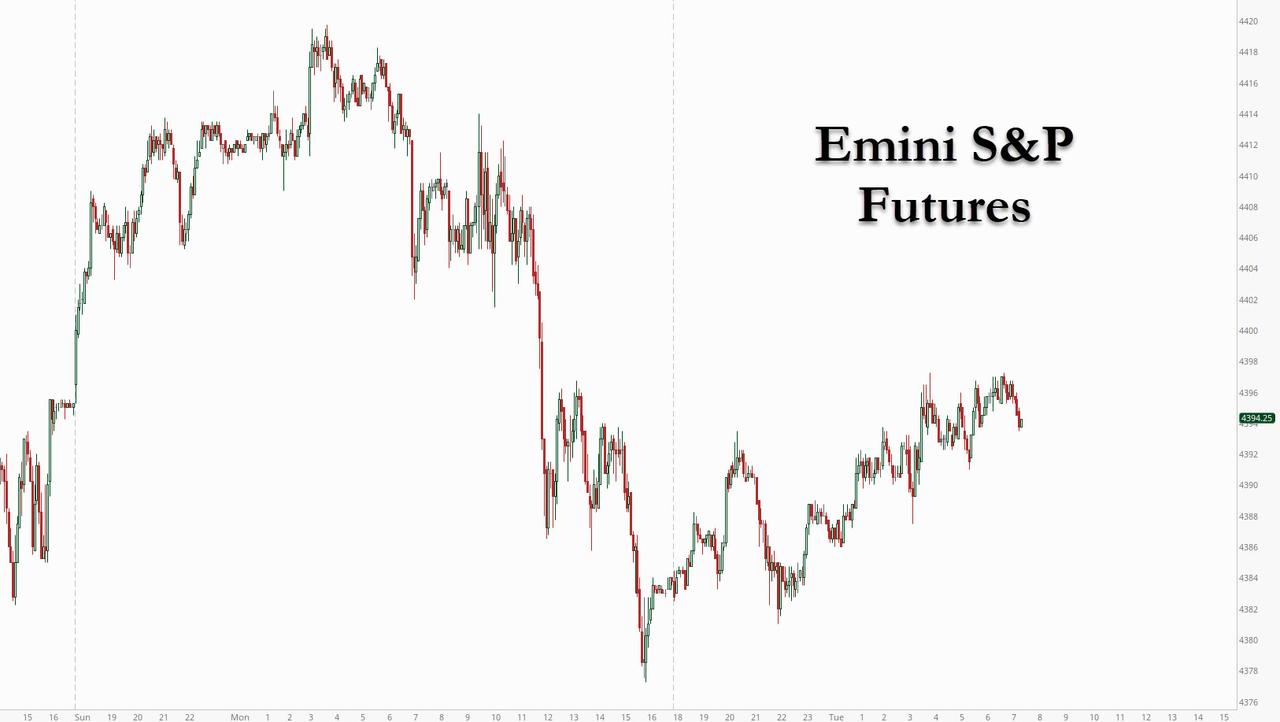
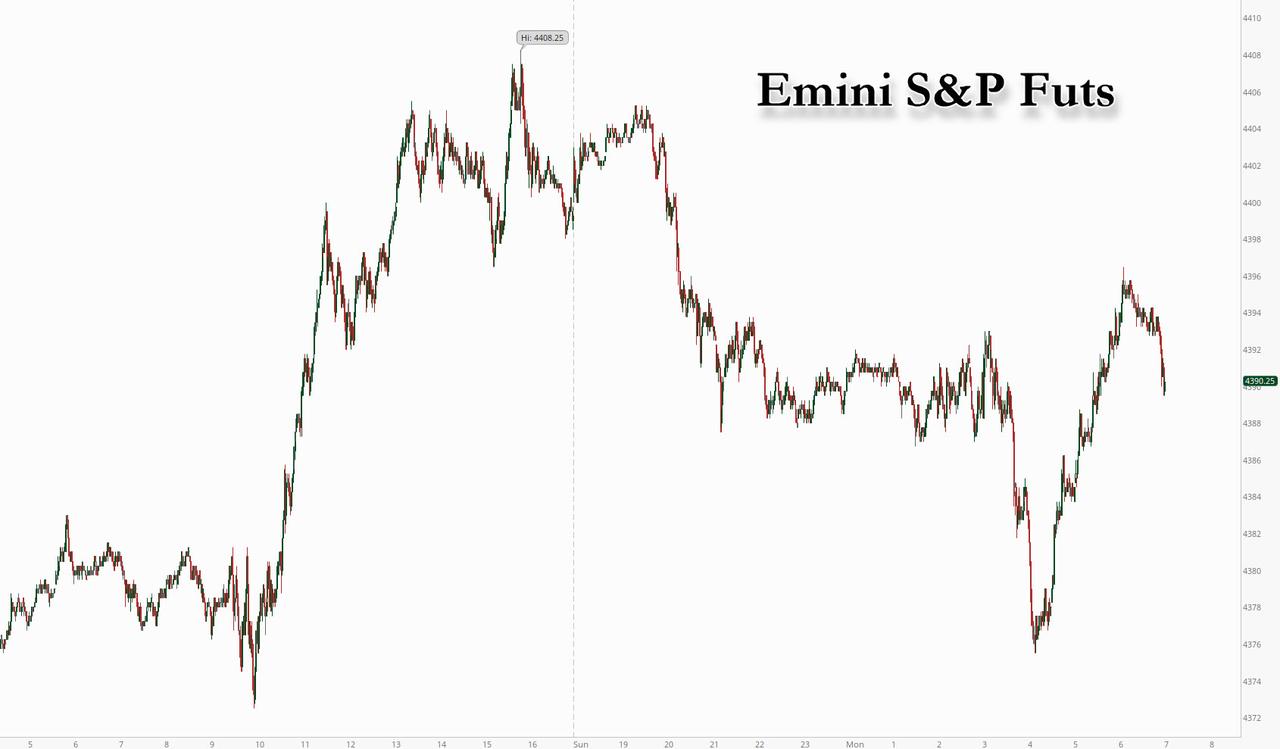
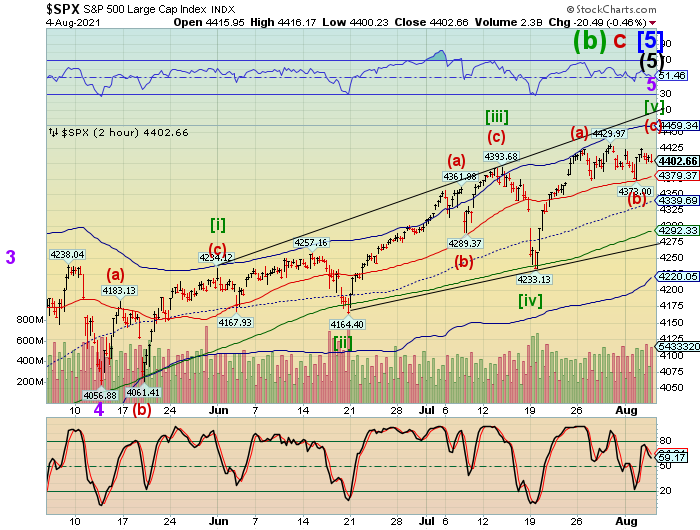
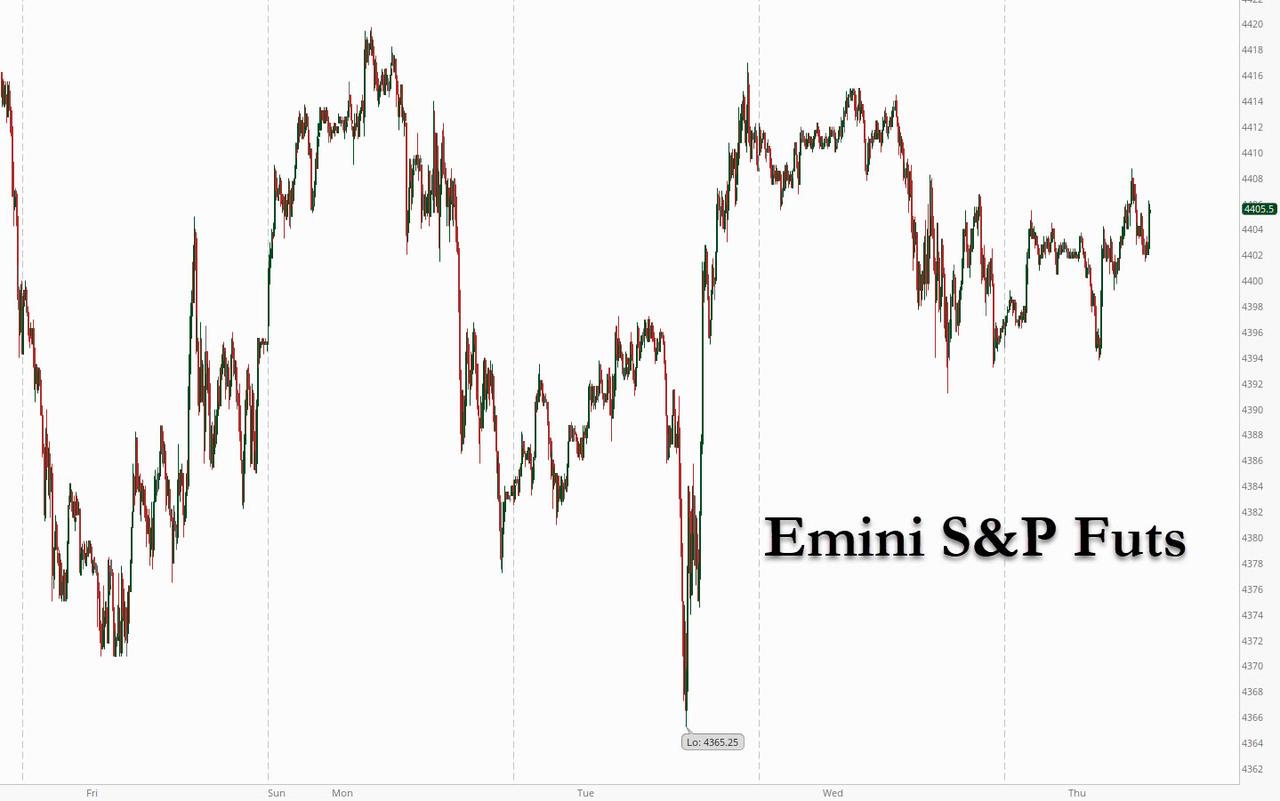
SPX futures rose to 4416.30 earlier this morning after closing at the MAX PAIN level of 4400.00 for options yesterday (day 268).  The Max Pain level dropped to 4395.00, but there are 9100 net calls at 4450.00 and 4571 net put contracts at 4375.00 for Friday’s expiration.  You can see that Short-term support lies at 4379.37 where our aggressive sell signal starts.  The Wave structure allows another probe higher, possibly as high as the Cycle Top resistance at 4459.34.  Note that resistance is beginning to decline.  The Cycles Model implies a Master Cycle low the week after August monthly options expiration.

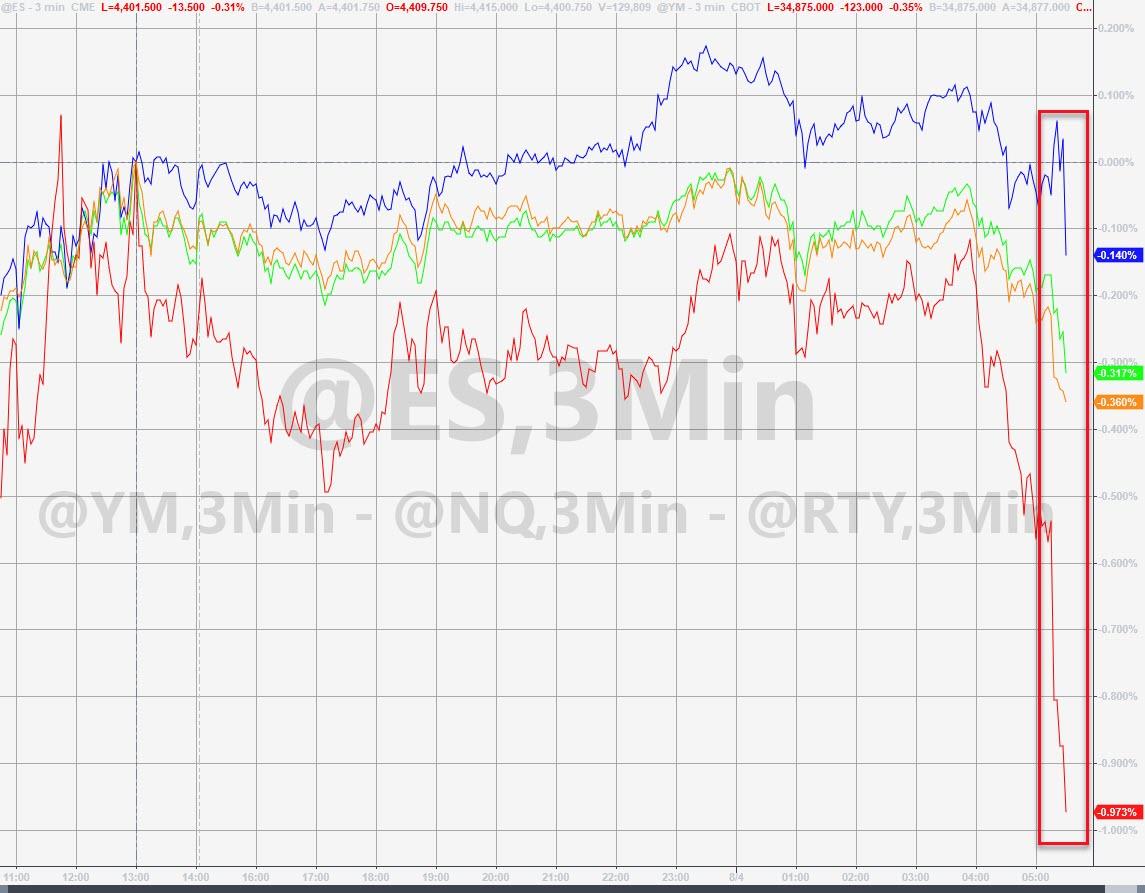
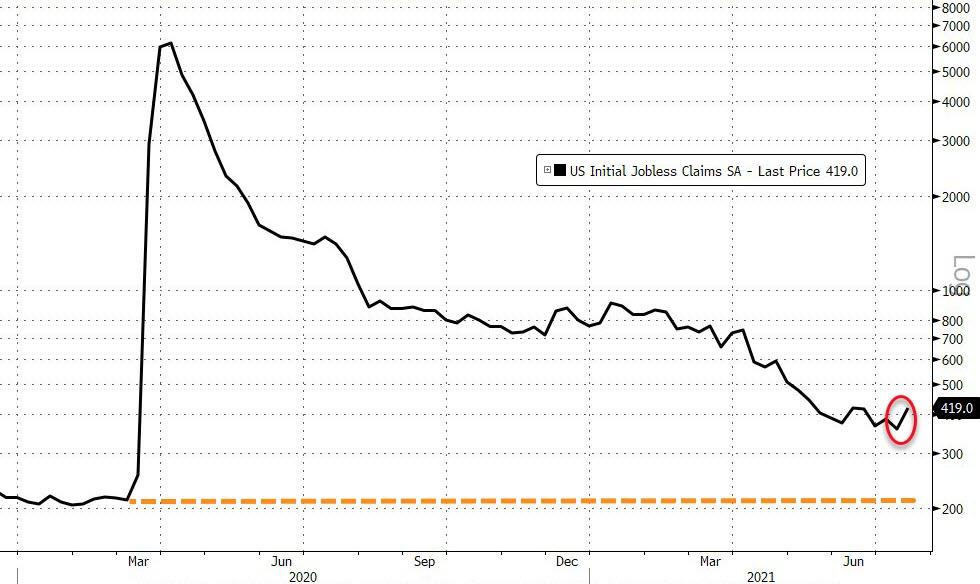
ZeroHedge reports, “U.S. stock index futures rose on Thursday ahead of data expected to show fewer Americans filed for unemployment benefits, while investors looked to another busy day of corporate earnings reports. European stocks hit another all time high despite paring earlier gains on mixed corporate results. At 7:30 a.m. ET, Dow e-minis were up 94 points, or 0.13%, S&P 500 e-minis were up 10.25 points, or 0.23%, and Nasdaq 100 e-minis were up 30 points, or 0.20%. The Treasury 10-year yield eased back to 1.17% and the dollar slipped against a basket of major peers.”


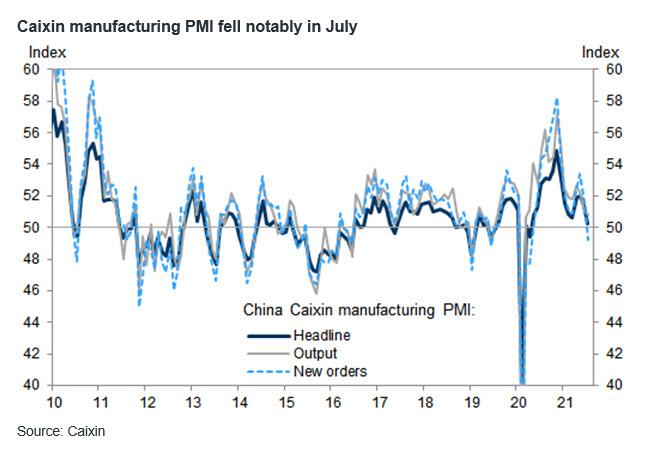
The Shanghai Composite Index made a final probe to 3486.16, touching the Head & Shoulders neckline at 3486.00 before closing in the red this morning.   Mid-Cycle support/resistance is at 3483.62,, confirming the sell signal beneath it.  The Cycles Model infers a probable Master Cyclelow in mid-August.


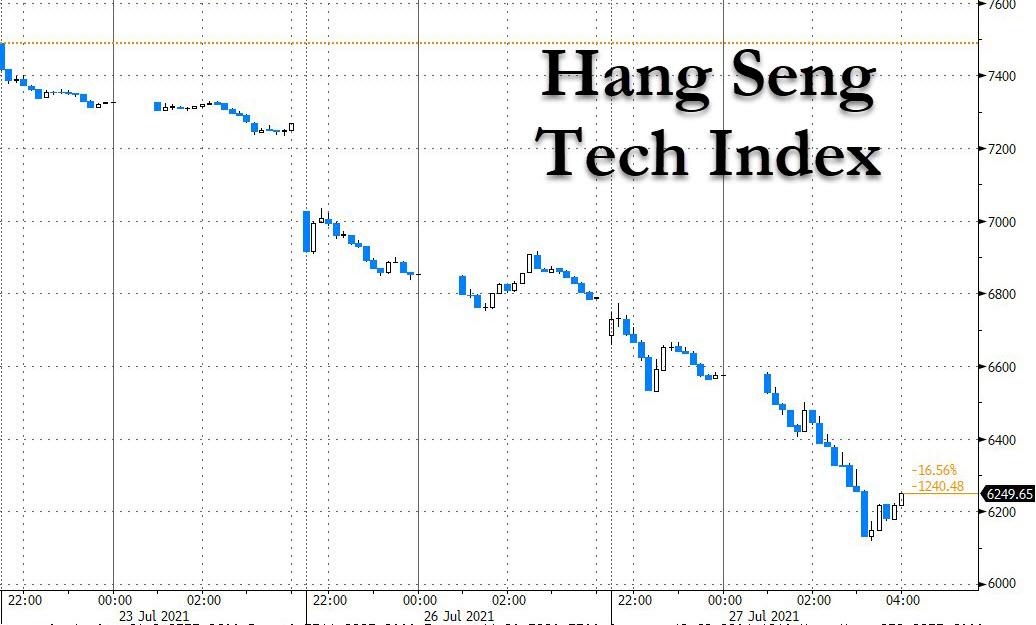
NDX futures are rising above 15000.00 this morning with a probable challenge of the prior high.  Minor Wave C may top out as high as 15381.00 in a final momentum burst that may bring in the last dollars to the bull rally.


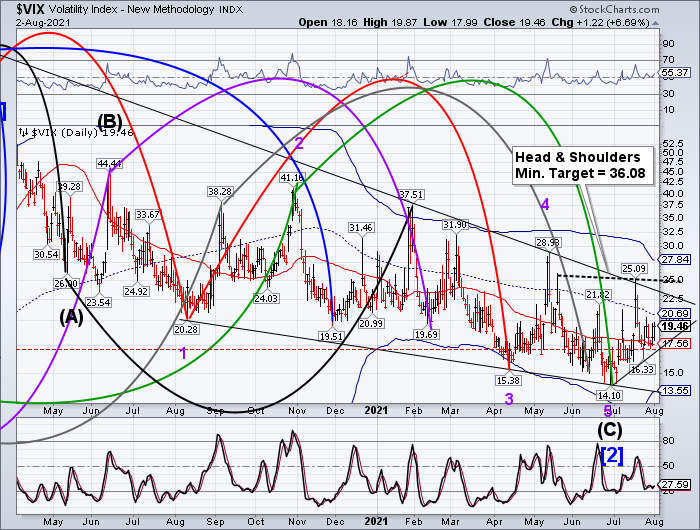
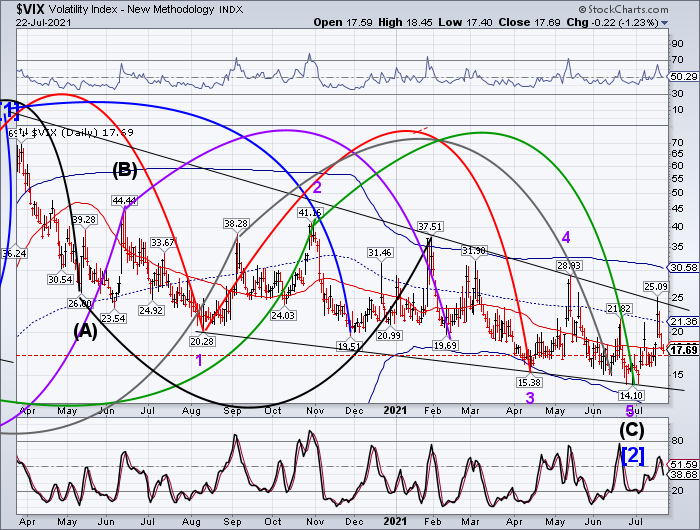
VIX futures are testing the lower trendline by declining to 17.43 this morning touching the 50-day Moving Average.  Critical support lies near 17.10.

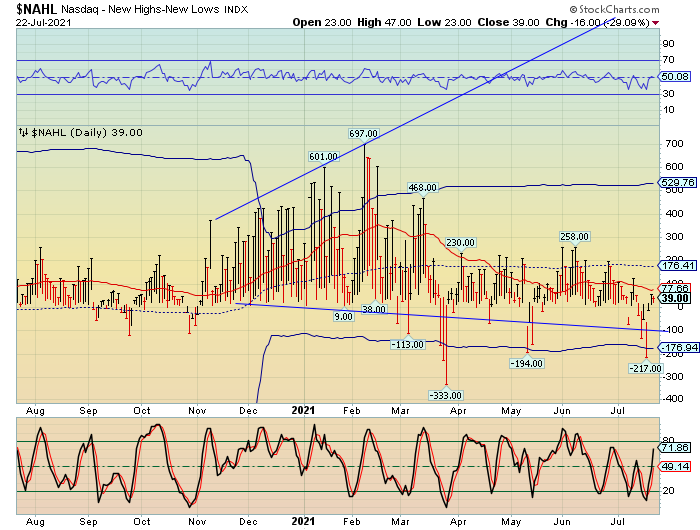
The NYSE Hi-Lo Index closed at 122.00 yesterday, enough to keep the market rising for now.


TNX has risen from a possible Master Cycle low yesterday at 11.29 on day 257.  However, there is the possibility of going lower in the next two days that cannot be ignored.


USD futuresChallenged Intermediate-term resistance at 92.33, then pulled back.  It appears that the Master Cycle low was put in last Friday and a new Cycle may be  emerging.


Posted in Published | Comments Off on August 5, 2021

August 4, 2021

8:00 am

Good Morning!

SPX futures have backed down to 4413.10 in a brief pullback.  The Wave pattern is much clearer and indicates a potential rally to the Cycle Top at 4460.44.  It may come in two more pushes higher and potentially may end on Friday, day 270.  The structure carries the shape of an Expanding Diagonal.

ZeroHedge reports, “US equity-index futures were little changed near all-time highs, as global shares rode earnings to a fresh record high boosted by easing concerns over China’s crackdown on gaming and technology industries, but worries about Covid-19 variants lingered. S&P futures were steady, trading 5 points lower or -0.11%, in the wake of a record S&P 500 close on robust earnings. Tech shares led a broad-based advance as the Stoxx Europe 600 index climbed for a third day to a fresh record. The 10-year U.S. Treasury yield held its retreat, and the dollar was steady against a basket of major peers in the wait for ADP employment data to provide clues to the pace of monetary tightening in the world’s biggest economy.. WTI crude oil hovered around $70 a barrel.”


The Shanghai Composite Index rallied just a few points beyond Monday’s high, testing the Head & Shoulders neckline.  This may signal the end of a period of strength allowing the retracement.  While the Lip of the Cup with Handle formation is somewhat permeable, the neckline of the Head & Shoulders is rarely recrossed.  We may see the resumption of the decline by the end of the week.


NDX futures are hovering just above 15000.00, unable to go higher, but not having crossed the trendline/Short-term support at 14900.00.  Should the structure be an Ending Diagonal as is the SPX, it may rise to the Cycle Top resistance near 15300.00 by the end of the week.  Friday calls dominate the options expiration above 15000.00 for the rest of the week.


VIX futures have been rising in the overnight session.  This is a typical pattern as stocks enter their final push to the top.  Note the rising trendline from the last Master Cycle low.  While this may not be the final trendline for the coming rally, it is likely to provide a “floor” for the VIX going forward.


TNX appears to be consolidating prior to making the last push to its Master Cycle low, due tomorrow.  While the decline in yields support rising stocks, the reversal from the Master Cycle low removes that support.  The timing of the low in TNX may explain the extension of the high in the SPX.

ZeroHedge reports, “All major US equity indices have dropped into the red after the massive miss in ADP’s employment report with Small Caps the hardest hit…

Extending the short-squeeze, bond yields plunged on the print to a 1.12% handle, testing the spike lows from July 20th…


USD futures made new lows this session as it appears to be declining toward the 50-day Moving Average at 91.53.  It may complete the decline by the end of the week and may enter a period of strength next week.


Posted in Published | Comments Off on August 4, 2021

August 3, 2021

12:38 pm

While SPX remains above 4400.00, things could go south quickly.  This morning’s low at 4373.00 is testing Short-term support.  Tomorrow’s options lean towarde puts beneath 4400.00 with a critical mass being reached below 4375.00.  We are looking for a beakdown beneath 4373.31 to place short positions.  Open Interest indicates over 500 net puts at 4400.00 and the number grows at every strike lower with 1659 net puts at 4375.00 and 3651 net puts at 4350.00.  Beneath that, thing get really ugly.   Our confirmed sell signal lies at 4331.49.  It is amazing how the options market lines up with the Cycles Model.

ZeroHedge observes, “A choppy overnight session saw S&P futures test back up towards the key 4,400 level, which as SpotGamma notes is the major gamma strike on the board.

SpotGamma also notes that ‘The Call Wall’ has consolidated to the 4450 strike which is now the top end of our range on a larger time frame, with 4375 as intermediate support.”


8:30 am

Good Morning!

SPX futures rose to 4404.80 n th eovernight session, but have declined back beneath 4400.00.  Thursday’s high at day 262 is still holding, closing the door to new highs and making the decline more imminent.  Options players are getting more aggressive, with puts outnumbering calls beginning at 4415.00 for tomorrow’s expiration.  Friday’s expiration becomes bearish at 4375.00.  You can see Short–term support at 4370.93 which is our breakpoint to go short.

ZeroHedge reports, “US equity futures rebounded from the latest China regulatory scare which saw shares of Tencent plunge as much as 11% after Chinese state media criticized online gaming as “opium for the mind,” fueling investor concerns that the companies’ popular games could be swept up into a broader regulatory crackdown. As China watcher Victor Shih noted, this showed that “even when you comply with every party dictate, you can be labeled an ‘opium’ or ‘poison‘.” But even though Eminis dipped briefly below 4380 when the Tencent news hit overnight, they have since rebounded and were trading up 15.50 or 0.35%, rising to 4,395. Dow futures were up 160 points or 0.461% and Nasdaq futs added 0.08% or 11 points.”


The Shanghai Composite Index topped out at the Head & Shoulders neckline at 3470.66, then declined, closing in the negative.The demonization of certain tech companies has led to mixed reactions from investors.

ZeroHedge reports, “Update (0745ET): As CNBC’s Eunice Yoon reports, Beijing has now republished the original Economic Information Daily article with a much softer tone, including removing the phrase “spiritual opium”. Did Beijing perhaps underestimate how these new restrictions impacted the market?

* * *

China’s broad-based crackdown on perceived anti-social tendencies of its biggest corporations continued on Tuesday with a new industry being targeted: video games.

Beijing’s latest attempt to rein in the excesses of capitalistic development – and reassert the “primacy of socialism”, as Reuters described it – came Tuesday in the form of an article published by the Xinhua-affiliated “Economic Information Daily” which offered up a scathing critique of China’s video-game industry and its impact on minors. The article asserted (citing anecdotal reports from teenagers) are spending up to 8 hours a day playing the country’s most popular game: “Honor of Kings”.


NDX futures have been weakening, only briefly emerging above round number support/resistance at 15000.00, then declining beneath it.  Short-term support is at 14887.40 and just beneath it is the Diagonal trendline that gives us a sell signal.

ZeroHedge observes, “With asset prices so frothy, it is understandable that central banks would be wary of beginning to taper monthly bond purchases before it is clear that inflation has taken off. But they would do well to recognize that prolonging quantitative easing implies significant risks, too.

Inflation readings in the United States have shot up in recent months. Labor markets are extremely tight. In one recent survey, 46% of small-business owners said they could not find workers to fill open jobs, and a net 39% reported having increased their employees’ compensation. Yet, at the time of this writing, the yield on ten-year Treasury bonds is 1.24%, well below the ten-year breakeven inflation rate of 2.4%. At the same time, stock markets are flirting with all-time highs.


VIX futures dipped to 18.63 before rising back toward yesterday’s close.   While it appears hesitant to resume new highs, it has made successively higher lows, indicating a probable change in trend.  There appears to be a potential Head & Shoulders formation that gives a target well above the Ending Diagonal formation.  There is a good probability of meeting that target by the end of next week.

The NYSE Hi-Lo closed at 182.00 yesterday, well above the sell signal levels.


TNX appears to be consolidating inside yesterday’s range.   The Cycles Model suggests a Master Cycle low may be made by the end of the week, possibly in time to upset Friday’s options expiration in the SPX.

ZeroHedge observes, “Job growth at pre-pandemic levels is the key to the start of tapering, according to Fed Chair Powell. The good news for fixed income traders worried about higher rates and bond bulls is we’re not there yet.

A good gauge for when we do get there, take a look at the spread between the labor participation rate and job openings (JOLTS). It’s nowhere near pre-pandemic levels. Looking back at where labor and job openings were when the Fed announced tapering in December 2013 serves as a decent indication of what this relationship needs to look like before tapering is a more convincing option for the central bank.


Posted in Published | Comments Off on August 3, 2021

August 2, 2021

7:40 am

Good morning!

SPX futures are higher this morning, but not making new highs.  Thursday’s high at 4429.97 remains the peak of this Cycle at day 262 but the breakdown has not occurred.  In the options market, the calls prevail at 4400.00 and higher, while the puts open interest dominate bneath that with 4350.00 as a breakpoint that may induce forced selling.  Today is day 266 of the old Master Cycle, should it revive.  The Wave pattern apears incomplete.

ZeroHedge reports, “Any other day, especially with traders so on edge over anything to do with China, futures would be deep in the red after Beijing reported another sharp drop in the Caixin manufacturing PMI, which slumped from 51.3 in June to 50.3, missing expectations of 51.0 and on the verge of contraction while the new orders sub-index did contract, sliding to 49.2 from 51.6, the first time below 50 since last May….

… but not today, and instead Chinese stocks surged by the most in ten weeks as traders rushed to buy everything from baijiu producers to construction firms on expectations of increased support for the economy after Beijing signaled it would intensify policy support in the second half of the year to bolster the country’s economic growth amid deceleration, China Daily says in a report on Monday and confirming what we reported two weeks ago in “China’s Credit Impulse Just Bottomed With Profound Implications For Global Economies And Markets“.


The Shanghai Composite Index rose back to its Head & Shoulders neckline after plunging to Cycle Bottom support at 3304.40 on Wednesday.  This constitutes a 50% retracement of the decline thus far.  There may be a further move to 3480.82 to meet the neckline and mid-Cycle resistance.   However, the retracement may be over or nearly so.   Wall Street makes up chatter to explain the moves in a cause-and-effect pattern.  The fact is that the social mood has changed and no amount of jawboning or stimulus will change the Cycle.

ZeroHedge reports, “We noted last week that the delta variant has finally arrived in China, causing one of the country’s worst outbreaks since the original wave of COVID that spread from Wuhan across China (and world). Well, despite authorities’ best efforts, the outbreak appears to have worsened over the weekend, and now officials are reimposing COVID-related restrictions in Beijing for the first time in months as questions about the efficacy of Chinese COVID vaccines multiply.

According to Bloomberg, the outbreak is now the broadest since the original outbreak in late 2019 as cases are being found in 14 of 32 provinces. The fact that delta has spread so widely across China – even if the case numbers, which are likely under-reporting (perhaps dramatically) the true levels of delta penetration, are still relatively low – is alarming government officials.”


NDX futures are back above 15000.00, but no new high here, either.  The Wave pattern also appears incomplete, but time is running out for a Master Cycle extension.  The trendline is at 14800.00 for a chart sell signal.  The NDX Hi-Lo Index closed at 33.00 on Friday so there is not much gas left in this tank.


VIX futures are on the  rise, but haven’t broken above Friday’s high at 19.72.  The trend is solidly higher, but VIX must break the trendline just above 22.50 or the prior high at 25.09 to convince traders that it’s time to panic.


TNX is entering its final week of the current Master Cycle.  Today is day 255 so the probability of an imminent new low and reversal is high.

ZeroHedge observes, “Citius, Altius,Fortius – the Olympic motto – which translates to Faster, Higher, Stronger, might as well be our current motto for Treasury yields. We think that the Treasury market will price in a faster pace of rate hikes, resulting in higher US 10-year yields, consistent with a stronger economy.

We think that 10-year yields are too low versus our fair value estimate at ~1.60%, in large part due to positioning unwinds in recent weeks that have magnified the impact of negative COVID-19 headlines. In our view, yields do not appropriately reflect the strong US economy, or the Fed’s stance. With cleaner market positioning, our economists’ expectations for strong labor market and inflation data, and our base case for a deficit-funded infrastructure package, we see yields rising in the coming weeks.”


Posted in Published | Comments Off on August 2, 2021

July 28, 2021 – Will The Fed Stumble?

2:00 pm

I have been invited by my  son to visit him and three grandsons at the lake.  I may be gone until the end of the week.  Short term suport is at 4350.00.  Stay alert.

9:00 am

Good Morning!

The Shanghai Composite Index fulfilled its Head & Shoulders target by declining to 3312.72 before the bounce back to close at 3361.59.  Investors heaved a sigh of relief that the Chinese “National Team” arrived to bail out the markets.  However, there is a potential new formation that suggests a further decline after the bounce.  More on that when the chart information becomes available.

ZeroHedge reports, “Earlier today we said that with Chinese stocks suffering historic losses, HK’s tech sector imploding..

… and liquidation fears spreading to other, more serious products such as bonds and FX, it was only a matter of time before China’s “National Team”, i.e., the local plunge protection team, came out in full force to preserve confidence in centrally planned markets.

Well, just a few hours later, we learned that sure enough, the local Chinese bat signal summoning the plunge protectors has been activated with local press Securities Daily reporting that “the plunge is unsustainable” and will gradually stabilize. And since the media is merely a propaganda outlet to local state and central planners, it is telegraphing what will come next: a massive ramp in Chinese stocks.”


SPX futures flattened out after reaching the 61.8% Fibonacci retracement vale at 4403.66.  While there is an oportunity to go higher, the SPX remains flat pending the Fed announcement this afternoon.

ZeroHedge reports, “With the rout in Chinese markets stabilizing after three days of mayhem following speculation that the Chinese “National Team” is set to start propping up the domestic market, on Wednesday stock-index futures rose along with European shares as investors digested a barrage of tech earnings earnings which saw Apple, Microsoft and Apple post $57 billion in combined profit, while Treasuries fell and the dollar was steady with traders reluctant to place large bets ahead of the outcome of the Federal Reserve meeting and Powell’s subsequent press conference at 2 p.m. EDT.

At 730 a.m. ET, S&P 500 e-minis were up 2.25 points, or 0.05% after falling as much as 0.3%, while Dow e-minis were down 54 points, or 0.18%. Contracts on the Nasdaq 100 led gains, rising 39.75 points, or 0.26%, as technology shares jumped in Europe, though Asian equities were weaker amid the market turbulence triggered by China’s regulatory clampdown.”


VIX futures pulled back to 18.56 this morning, remaining above the 50-day Moving Average at 17.74.

Investing observes, “Some investors appeared increasingly nervous in recent weeks, reflecting the market’s fragility, even as major U.S. stock benchmarks rose to fresh new peaks in recent weeks, according to BofA Global Research.

The Cboe Volatility Index, known as the VIX, has been rising despite the S&P 500 index posting new highs, BofA analysts said in an equity derivatives report Tuesday. The S&P 500 SPX, -0.47%, Dow Jones Industrial Average DJIA, -0.24% and Nasdaq Composite COMP, -1.21% each posted record highs Monday, though they were trading down Tuesday afternoon.”


TNX has bounced this morning after yesterday’s pullback.  The Cycles suggest the pullback may be over with another week or more of rally until the new Master Cycle is complete.   The Model suggests a very strong move higher starting today/tomorrow and going into the first week of July.

ZeroHedge observes, “There’s an asymmetric risk of U.S rates rising in response to Wednesday’s Fed meeting, given the extremely low current bond yields.

A baseline assumption would be for modest curve steepening if Powell remains dovish. However, it’s hard to identify sources of surprise, given Powell’s clear guidance from his Congressional testimony.”


USD futures are rising again after a brief 1 week pullback.  Normally pullbacks last up to 3 weeks, but the pattern may allow a breakout based on higher TNX rates causing the USD to strengthen.  This pattern is called a “running correction” as the pullbacks may not break the rising trading zone.


Posted in Published | 1 Comment

July 27, 2021 – The Trap Door Opens

10:43 am

SPX has broken beneath 4400.00 where this Friday’s puts edge out the calls by 400 contracts.  A subsequent decline from here may tip the scales even further to the puts.  Beneath 4350 the options market likely tips the scales toward the bears and could become a aelf-reinforcing mechanism.

The NYSE Hi-Lo is at 61.00 after opening at 10.00.  Thus, it hasn’t given our sell signal confirmation.  My observation is that the Hi-Lo may turn negative beneath 4350.00, which is also Short-term support.

Today is day 260 of the old Master Cycle.  With that knowledge, we may begin taking aggressive positions with lower risk than usual.  I will attempt to keep you informed of confirmations.


7:20 am

Good Morning!

The Shanghai Composite Index fell to 3380.28 in the overnight session, leaving investors with a 5% loss in two days.  Today comes the realization that this may not be a one-off stumble.  It is likely that this decline may go further to the Cycle Bottom support at 3290.62 before bouncing, clearing the deck of all gains since the December low.  This action may have serious consequences for the tech-heavy NASDAQ.

ZeroHedge observes, “Right Out of the Red

It’s all about China again today in markets – and what we are seeing in some corners is just a reflection of what we could potentially see in many others ahead.

Chinese and Hong Kong stocks tumbled yesterday, while the Nasdaq Golden Dragon sub-sector trading Chinese tech did too, now down 15% since Thursday, the most since 2008. CNY hardly moved, however. After all, why should a currency and the structure of its economy have any relationship? (Which says so much about said structure.) US 10-year yields dipped as low as 1.22% on the general red before remembering “This is ‘Murica!” and adding white and blue to close back at the merely depressing 1.28% level.”


NDX futures dipped to 15062.30 in the overnight session before returning to the flat line, as I write.  It is clear that the decline was a knock-on reaction to the Shanghai decline, but it was quickly bought.  Is this the action of buy-the-dippers or the PPT?


The Nasdaq Hi-Lo Index shows a singular lack of new highs.  The NAHL is on a sell signal, waiting confirmation from the VIX/VXN.


SPX futures also took a dip to 4398.60 in the overnight markets, but have returned to green as I write.  Its as if the PPT is saying, “Nothing to see here.  We got you covered.”  While retail investors may not be aware of what is going on in China, it is probable that the powers-that-be want to keep it that way.

Nevertheless, today is day 260 in the Master Cycle.    The 21.5-year Super Cycle is complete.  Now for the recognition.

ZeroHedge reports, “Futures swung from all time highs to losses during the European session and then rebounded again as Asian stocks hit their lowest this year on a third straight session of selling in Chinese internet giants, while real bond yields hit another record low ahead of earnings from the most valuable companies on Wall Street and in the run-up to the two-day Federal Reserve meeting. S&P 500 E-minis were down 5 points, or 0.11%, at 07:15 am ET. Dow E-minis were down 77 points, or 0.22%, while Nasdaq 100 E-minis were up 3 points, or 0.02%.”


VIX futures rose to a high of  19.40, above the 50-day Moving Average at 17.98.  This puts VIX on a buy  (SPX sell) signal.  The NYSE Hi-Lo Index closed at 56.00 yesterday.  At this point, we await the NYSE Hi-Lo to decline below zero.


USD futures continue to consolidate in a tight range this morning.  There is good cause to believe that the rally in the US Dollar may be over.  The Cycles Model now posits a probable decline through late September.  Primary Wave [2] may be a flat correction.


TNX appears to be in correction mode.  It may decline to round number support at 12.00.  The Cycles Model suggests another week of correcting before the uptrend resumes.


Posted in Published | 1 Comment

July 26, 2021 – It Is Time

7:45 am

Good Morning!

Please read yesterday’s blog to get a feel for what is about to take place.

SPX futures declined to 4383.70 this morning, but ave nearly recovered by this writing.   The urge to buy the dip is still strong, but the air is getting thiner, here.  While the NYSE Hi-Lo Index made an intraday high at 196.00 onFriday, it closed at 97.00, a 2.9% participation in new 52-week highs.  Today is day 259 of the Master Ccle, although I marked the high on Friday thus far.

ZeroHedge reports, “Futures started off the week on the wrong foot, sliding overnight from Friday’s record high before recovering some losses as Chinese stocks crashed on multiple parallel crackdowns by Beijing (more on this shortly), souring global bullish sentiment while cryptos exploded higher further kicking Keynesian apes in the groin. All of this is happening ahead of the busiest week of Q2 earnings season and Thursday’s FOMC meeting, while a majority of traders are rushing to catch some rays ahead of the next round of covid lockdowns/vote-purchasing stimmies. S&P 500 E-minis were down 11.00 points, or 0.25%, at 715 a.m. ET. Dow E-minis were down 131 points, or 0.37%, while Nasdaq 100 E-minis were down 21.75 points, or 0.14%. Treasuries pushed higher, with the 10-year real yield hitting a record-low -1.127%. The dollar fluctuated and oil declined below $72 a barrel.”


NDX futures declined to a low of 15049.70 before a partial recovery.  It is simply too early to tell whether Friday’s high marks the top.  Friday’s NDX Hi-Lo Index closed at 12.00, a mere .375% participation in new 52-week highs.  It is hard to imagine that Friday’s high was made by so few stocks.


The Shanghai Composite Index declined to 3424.74, violating all the trendlines before closing just beneath the Head & Shoulders neckline at 3485.05.  This massive “dump” in the tech heavy SSEC is likely to be the catalyst to the behavior in the NDX and US equities today.   The Cycles Model suggests a possible three-week decline from here.

ZeroHedge observes, “The crash in China continues. It all started with the cancellation of the ANT IPO a few months ago. Since then we have gotten used to new regulatory crackdown news on a weekly basis, mainly in tech, but lately even in areas like “edtech” which has been brutally punished.

It’s just a Chinese local issue?

Yes, this is a Chinese tech issue, but the contagion is starting to spread to other parts of the Chinese market. We saw this accelerate overnight.

Limiting the power of the big Chinese tech firms is potentially a good thing, but the value lost since mid February is huge.

The stress we are seeing in Chinese tech is now spreading to other sectors. Sure, for now this is a local problem, but it could potentially become a global problem, and we are referring to risks in terms of P&L. The value loss is significant, and the pain is felt globally.”


VIX futures rose as high as 19.39 this morning before pulling back.   The markets are now entering the most negative months of the year.  The current Master Cycle may end up as a high in mid-August, according to the Cycles Model.


TNX futures pulled back to 12.26 before the cash open this morning.  This is a normal retracement to absorbe the recent gains from th eMaster Cycle low.  We may expect TNX to decline to 12.00 or possible a bit lower.   This is a good time to accumulate shares in TNX or short UST.


USD futures appear to be sonsolidating within Friday’s trading range after Wednesday’s Master Cycle high  There is likely to be a short correction back down to the support areas between 91.30 and 91.89.


Posted in Published | 2 Comments

July 25, 2021 – Special Report

Good Afternoon!

Most of us that remember the 2000 peak remember the date – March 23, 2000.  However, there is another peak that is not often recognized.  The Industrials peaked on January 14, 2000 at 11750.20.  21.5 years ago last week.  SPX also peaked on January 14, 2000 at 1473.00.  The SPX subsequently peaked on March 23, 2000 as a one-day wonder at 1532.13, which the DJIA did not match at 11234.70.  We are seeing interesting parallels here, with the DJIA first peaking on May 10, but making lower highs since then…until the final hour on Friday.   21.5 years is an important Cyclical juncture (4.3 X 5).  The peak on July 16 at 35090.01 comes eerily close to a parallel match to the January-March 2000 peaks in the Industrials.  That is why I have been banging the drum that a “slingshot move” may be imminent.  The parallel got washed out in the final hour on Friday, but the turn is still imminent.

Two other points that may be mentioned.  (1) The DJIA nearly tripled over that period of time (21.5 years).  The compound annual rate of return was just a little under 5.25% during that period.   (2) The 1987 trendline has given maximum resistance to the DJIA uptrend since 2018.

RealInvestmentAdvice comments, “Bulls Buy The Dip

Last week, we discussed that as the market hit new highs and the index returned to more extended and overbought conditions, a correction was likely. To wit:

“Analysts have set a very high bar for the markets to hurdle, given already lofty valuations. With indices already well-stretched above their historical means, there is much room for disappointment. With the currently very overbought short-term market, a 3% to 10% correction this summer remains likely.”

Bulls Buy Dip 07-23-21, Bulls “Buy The Dip” But Is The Risk Really Over? 07-23-21

Well, between Friday and Monday, the market did sell-off by 3% to touch the 50-dma. However, at that point, “dip buyers” emerged to chase the market back to new highs. While this does indeed negate any short-term bearish action, it is worth noting two things (shown below):

  • The volume of the rally was extremely light; and,
  • The sell-off was too shallow to reverse the underlying technical concerns.”
Posted in Published | Comments Off on July 25, 2021 – Special Report

July 23, 2021 – At The Precipice

2:55 pm

SPX ran up to test the Cycle Top resistance at 4415.00 before pulling back.  From a Cyclical point of view, the decline took 25.8 hours and the rally will have taken 25.8 hours should it stop now.  Today  is an appropriate day for a Master Cycle high.

The DJIA made a triple top at 35087.52 today after reaching 35090.01 on July 16 and 35091.56 on May 10. This may be the major reason that those in the know are selling.  The new Master Cycle doesn’t end until August 25, which allows plenty of time for a major decline.


11:15 am

The last time I showed this chart was near July 10.  It is simply unbelievable how this market has been stretched.  This may be a good place for this rally to end.

ZeroHedge remarks, “One can’t say that Goldman’s clients have too much faith in Goldman’s trade recos.

As Goldman’s flow trader John Flood was urging clients on Monday “not to buy this dip“, they did just that and on Monday Goldman’s Prime Brokerage service observed a surge in hedge fund dip buying as the S&P tumbled as low as 4,220. Those same hedge funds, however, clearly unsure what happens next, then proceeded to dump the rally and on Tuesday the GS Prime book saw the largest 1-day net selling since June 17 (-2.2 SDs vs. the average daily net flow of the past year) and the biggest net selling in single names since Nov 2019, driven by long-and-short sales (1.6 to 1), as all regions were net sold led in $ terms by North America and DM Asia, and driven by long-and-short sales (2.5 to 1). This defensive positioning has continued through much of the post-Monday rally.


7:50 am

Good Morning!

SPX futures topped out at 4380.88, but have backed down.  The all-time high was 4382.62 on July 14.  Should the decline continue, the slingshot move  mentioned yesterday may still prevail.  The alternate would be a new all-time high in the cash market, as well as the futures.  The Cycles Model in futures runs paralell to, but not identical with  the cash market.

The July 14 top marked on the chart occurred on day 247 of the Master Cycle.  Today is day 256.  Either the top is made in the next two days or a six-day selloff may begin to complete the Master Cycle.

ZeroHedge reports, “The V-shaped recovery has officially concluded, with eminis hitting 4,383 this morning, touching reaching their all time high from the second week of July (technically that was 4,384) as markets propel higher on earnings optimism despite mixed economic data and worries over Covid variant. At 7:30 a.m. ET, Dow e-minis were up 170 points, or 0.49% and S&P 500 e-minis were up 21.5 points, or 0.49%.

Nasdaq 100 e-minis were up 72 points, or 0.48%, trading above 15,000 points for the first time. Nasdaq futures hit a record high on Friday, helped by megacap technology stocks and strong earnings from social media companies Twitter and Snap, with investors eyeing business activity data later in the day.”


NDX futures reached an all-time high at 15015.50 before coming back beneath the prior futures high.  The thought occurred to me that the dealers may be harvesting some gains in the futures this morning before pulling the plug in the cash market.  We are that close to the drop-off.  The cash high to overcome is 15002.20.


The NDX Hi-Lo Index closed at 39 yyesterday.  While not below zero, this closing value shows extremely poor breadth while the NDX is attempting new all-time highs.

ZeroHedge reports, “Two weeks ago, when stocks suffered a modest airpocket, we pointed to something ominous: market breadth has been collapsing similar to what we observed last summer when a handful of market “generals” did all the heavy lifting. And as the following Bloomberg chart showed, market breadth had recently gone from bad to abysmal, with the number of S&P stocks above their 50DMA at just about 50%, a very tiny increase from the 47% on June 29 when the S&P hit its first of many consecutive all time highs.”


VIX futures hit a low at 16.92 this morning.  Since VIX options have already expired on Wednesday it may be reasonable to assume that the VIX is being pressured to ignite a short squeeze in the SPX.


TNX appears to be testing the mid-Cycle resistance at 13.12.  A breakout may send TNX to new highs over the next two weeks while UST tumbles.


Posted in Published | Comments Off on July 23, 2021 – At The Precipice

July 22, 2021 – Maximum Danger, But Who Is Looking?

3:00 pm

SPX may be ready for a sudden reversal as 47.3 hours have elapsed from the beginning of the downdraft on July 14.  A 12.9 day crash scenario consists of a total of 90.3 market hours, leaving 43 hours to go, should this scenario play out.  It will be totally unexpected.  Tomorrow’s options expiration shows a mixed bag above 4300, but there are over 9000 net SPX puts at 4300.00.  This may provide the power for a slingshot decline below point 6.

ZeroHedge informs us about how option gamma may provide this result.  Watch the video .

“Gamma Squeeze” has been the word of the year so far for many freshly-minted equity-trading gurus (as they watched their AMC, GME, and other meme stocks momentum ignited “to the moon” time and again in the first half of 2021), but there is lot more to comprehending and using “Gamma” than simply understanding the chance for a squeeze (higher or lower).

Last June, long before anyone had heard of SoftBank’s public stock trading group, had seen the unbelievable and perhaps illegal gamma meltup in Tesla, and before even retail traders became experts in sparking gamma squeezes across illiquid names, we published what was arguably the best primers on gamma, op-ex and option-driven equity flows, straight from Goldman’s derivatives strategy team. Those who missed it can read it here, although there is certainly a bit of a learning curve.

Still since the topic of Greeks, Gamma, and option-driven flows will become increasingly important, we urge everyone to at least watch the following brief video, courtesy of our friends at SpotGamma, which provides an introductory overview of using Gamma to forecast market movements intraday.”


8:00 am

Good Morning!

US 30 futures rose to 34789.00 in the overnight session before trailing off. The retracement may be complete, or nearly so as the DJIA approaches resistance for a third time.  On May 10 the DJIA made its all-time intraday high at 35091.56, with a closing high the Friday before at 34777.76.  On July 16, the Dow 30 made a secondary intraday high at 35090.01, with a closing high at 34987.02 the day prior.  Do we go with closing or intraday?

The Elliott Wave structure claims the move since May 10 was Waves 1 and 2 and points to the near-miss on July 16 as confirmation.  The Cycles Model observes that the July 16 high was too early to be a Master Cycle high.  In fact, the end of the current Master Cycle may be still ahead, possibly in the next two weeks.  Today is day 255 of the current Master Cycle.  Should the turn occur today without making a new high, the SPX may be due for a very sharp, if short, decline.


SPX futures topped out at 4361.38 this morning before it rolled over.  It is currently in the red, but no one seems to notice.  This Cycle pattern has consumed 43 hours (6.14 days) as of 10:00 am.  The standard time for a crash is 12.9 market days, so we may be at the half-way point (time-wise) of that potential Cycle.  The minimum decline is targeted to point 6.  This is known as a slingshot move.

ZeroHedge reports, “US futures, European bourses and Asian markets extended on recent sharp gains on Thursday, the 10Y yields rose above 1.30% after hitting 1.13% just two days earlier and oil held onto sharp gains as investors seemed to set aside virus jitters for now and looked ahead to the European Central Bank for reassurance that policy support will continue; the dollar was steady. Japanese markets were closed for a holiday. At 7:15 a.m. ET, Dow e-minis were up 71 points, or 0.20%, S&P 500 e-minis were up 8 points, or 0.19%, and Nasdaq 100 e-minis were up 24.50 points, or 0.16%. Futures traded less than 1% from their record highs, completing a definitive V-shaped recovery from the recent slide.

The turnaround from the Monday selloff shows “corporations have been very resilient through all this,” David Mazza, Direxion head of product, said on Bloomberg Television. “Earnings estimates are quite remarkable, probably some of the best on record. Even through all this, we have central-bank liquidity remaining very abundant, economic growth being robust.”


VIX futures have come off their overnight low at 17.52 and are approaching the50-day Moving Average at 17.91.  The NYSE Hi-Lo Index is cautionary this morning, closing at 95.00 yesterday.

ZeroHedge observes, “In a stark reversal to its bullish sentiment at the start of the month, when the bank first noted – correctly – that the S&P was entering its best 2-week seasonal period of the year which it did between July 1 and 15 when it posted a series of new all time highs (before dumping on the 16th and the 19th)…

… followed by a lengthy rationalization why “the shorts will have to cover“, Goldman has been turning surprisingly bearish in recent days, and two days after Goldman flow trader John Flood urged Goldman clients “not to buy this dip” on Monday (spoiler alert: they did) his trading desk colleague Scott Rubner has published a report previewing why he anticipates a correction in the coming days and continuing through the Jackson Hole symposium at the end of August.”


TNX continues challenging the mid-Cycle resistance at 13.09 as futures reached 13.17 overnight.  While I have tagged Tuesday’s low as the end of the Master Cycle, it may not be over, yet.  We may see a very fast rally to 20.00 in the next two weeks in what is known as a “slingshot” move.

ZeroHedge reports, “Initial jobless claims jumped significantly last week as 419,000 Americans filed for jobless benefits for the first time (well above the prior week’s 368k and expectations of a 350k print)…

Source: Bloomberg

Michigan and Texas saw the biggest jump in claims while New York and Oklahoma saw the best improvement…”


USD futures appear to be consolidating in the overnight market.  It appears to be terminating its current Master Cycle in the next week or two with the highest probability of a low at the cluster of supports between 91.10 and 91.74.  However, there is the possibility of a runaway dollar as TNX blasts higher.


Posted in Published | 1 Comment