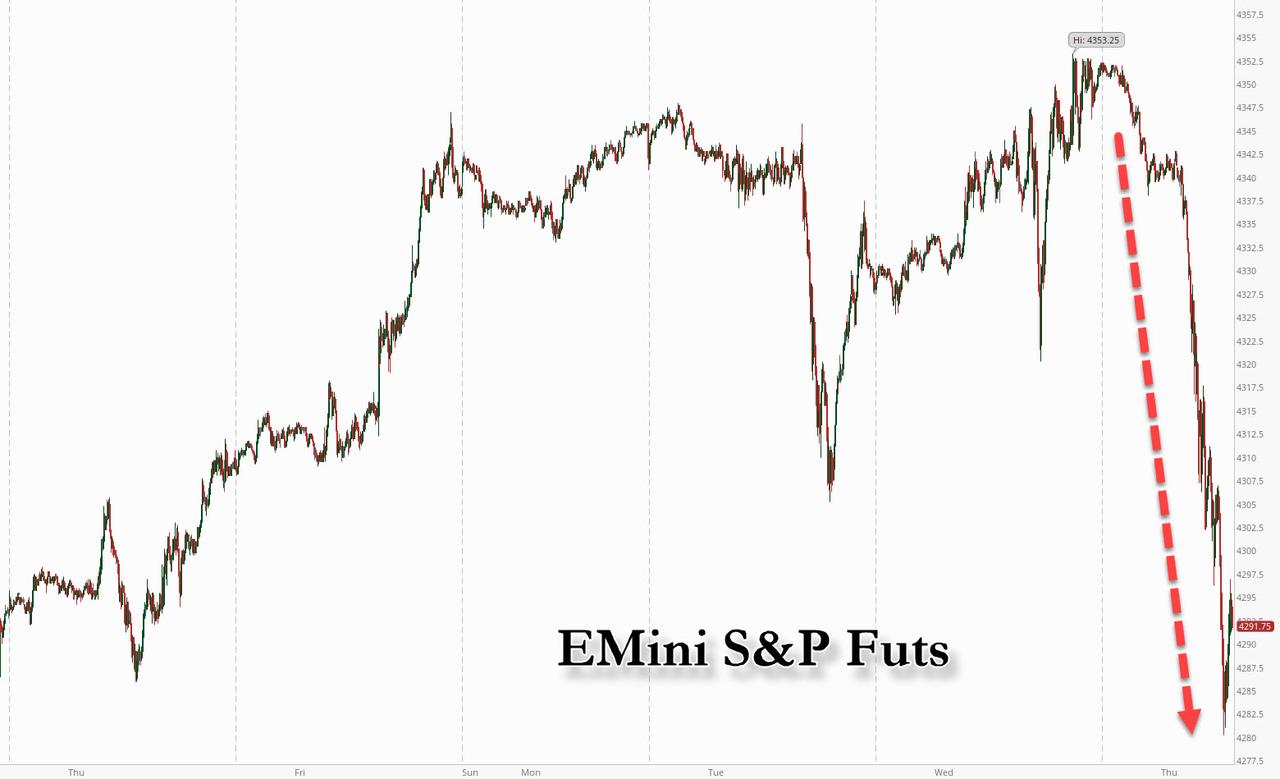
July 21, 2021 – Let The Selling Begin

10:52 am

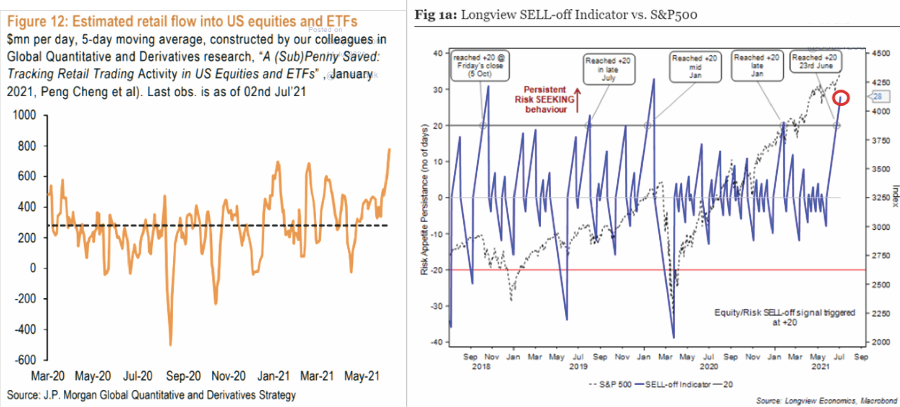
The SKEW Index remains near all-time highs.

ZeroHedge informs, “At the end of June, when the S&P was making new all time highs day after day, and when the VIX was touching fresh 2021 lows, we cautioned that the skew index just hit a new all time high – meaning that put options have been unusually expensive relative to at-the-money options, helping support the put-heavy VIX index. As we further added, high skew, which compares put option prices with at-the-money option prices, has reached new all-time high, and reflected investor perception that high volatility would return should markets sell off.

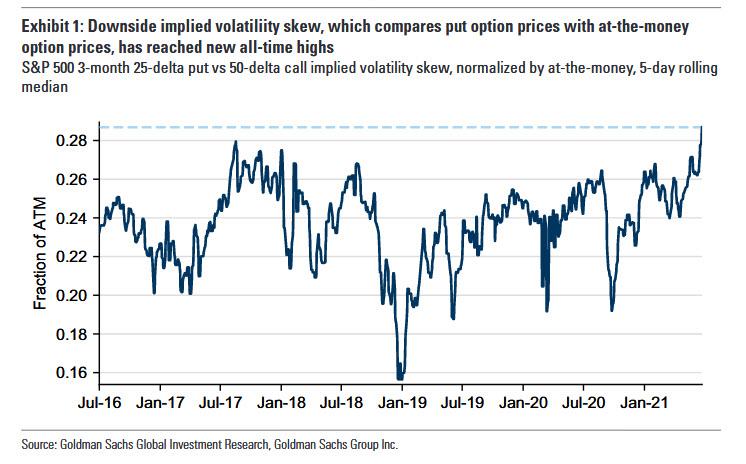
Commenting on this unusual move, we said that it shows that while on one hand traders seem complacent, they have never been more nervous that even a modest wobble in the market could start a crash. By extension, they have also never been more protected against a full-blown market crash.”


10:48 am

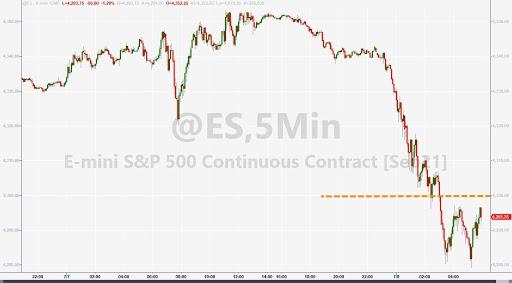
SPX has hit the 69% retracement level and the correction stands at 10 hours.  While some institutions may have bought this dip, the institutional trading desks are relatively quiet.  Many professional traders use this place to establish their short positions.
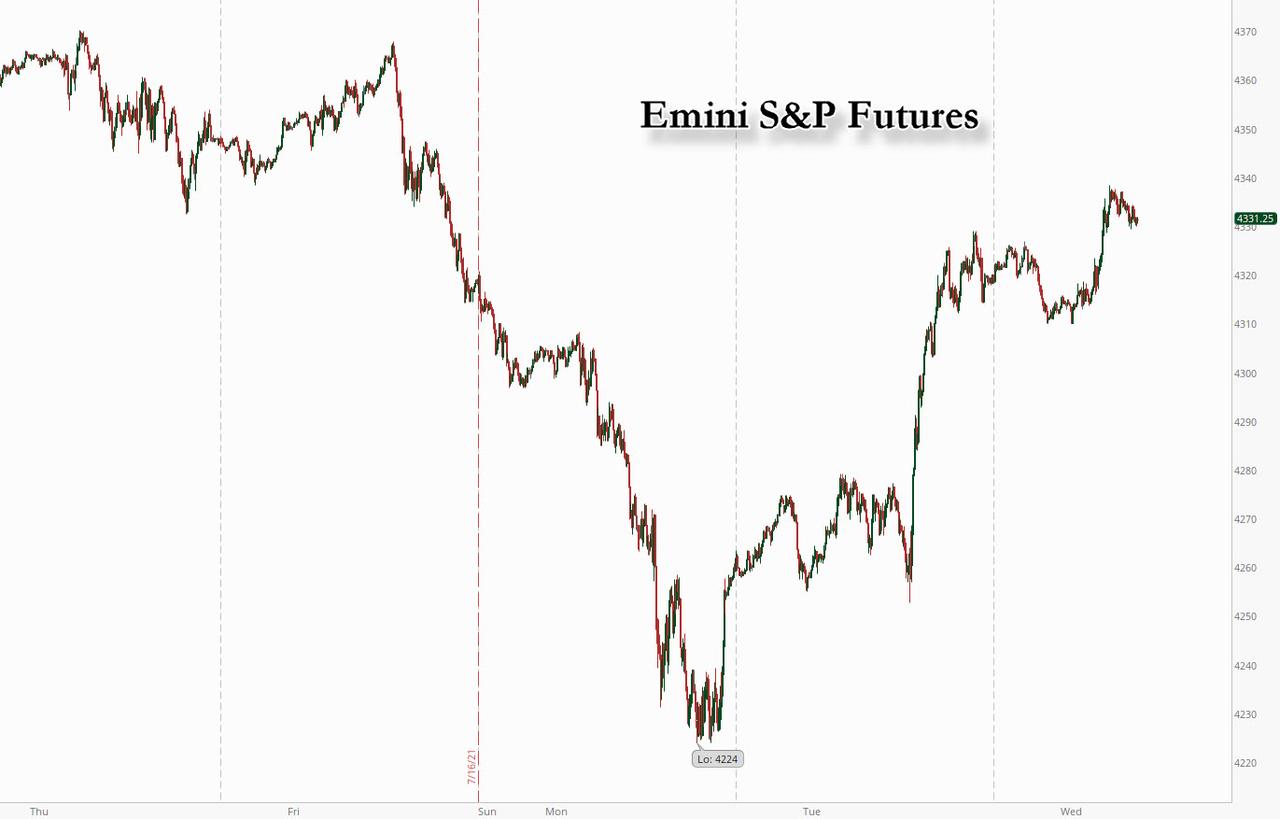
 

7:30 am

Good Morning!

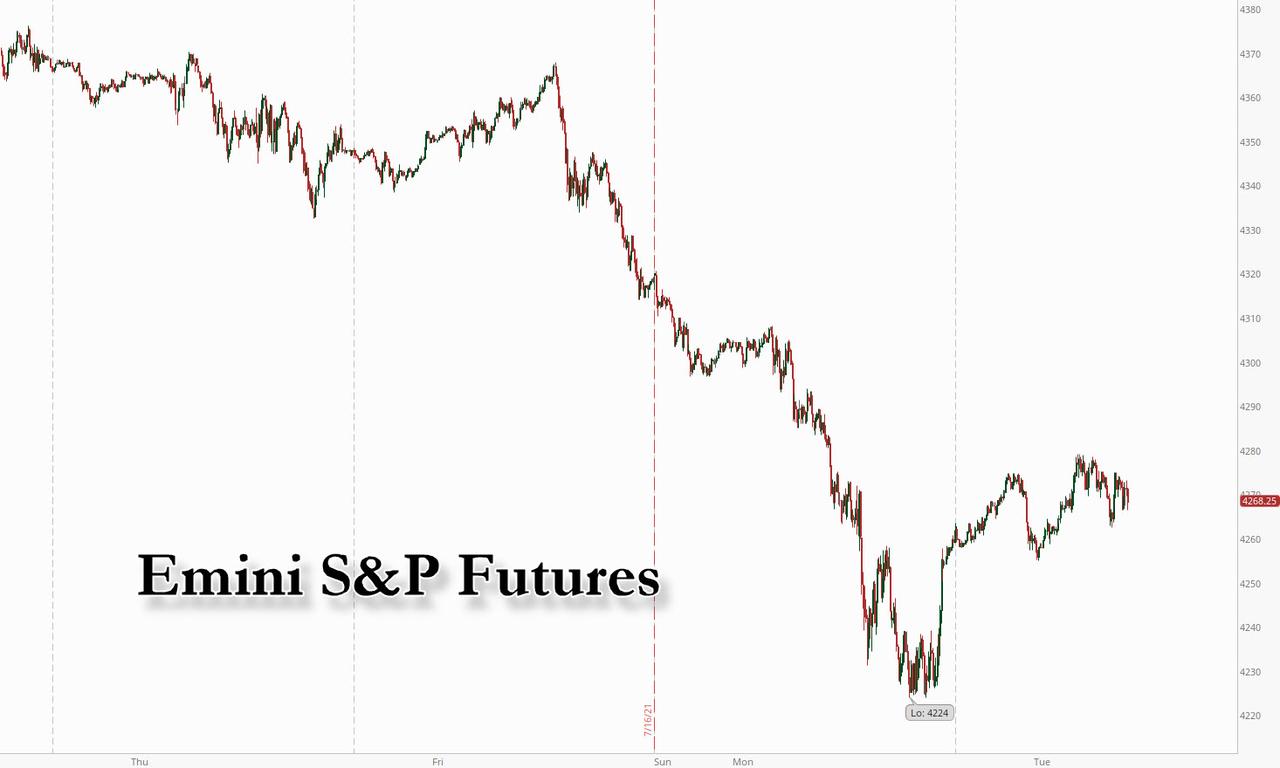
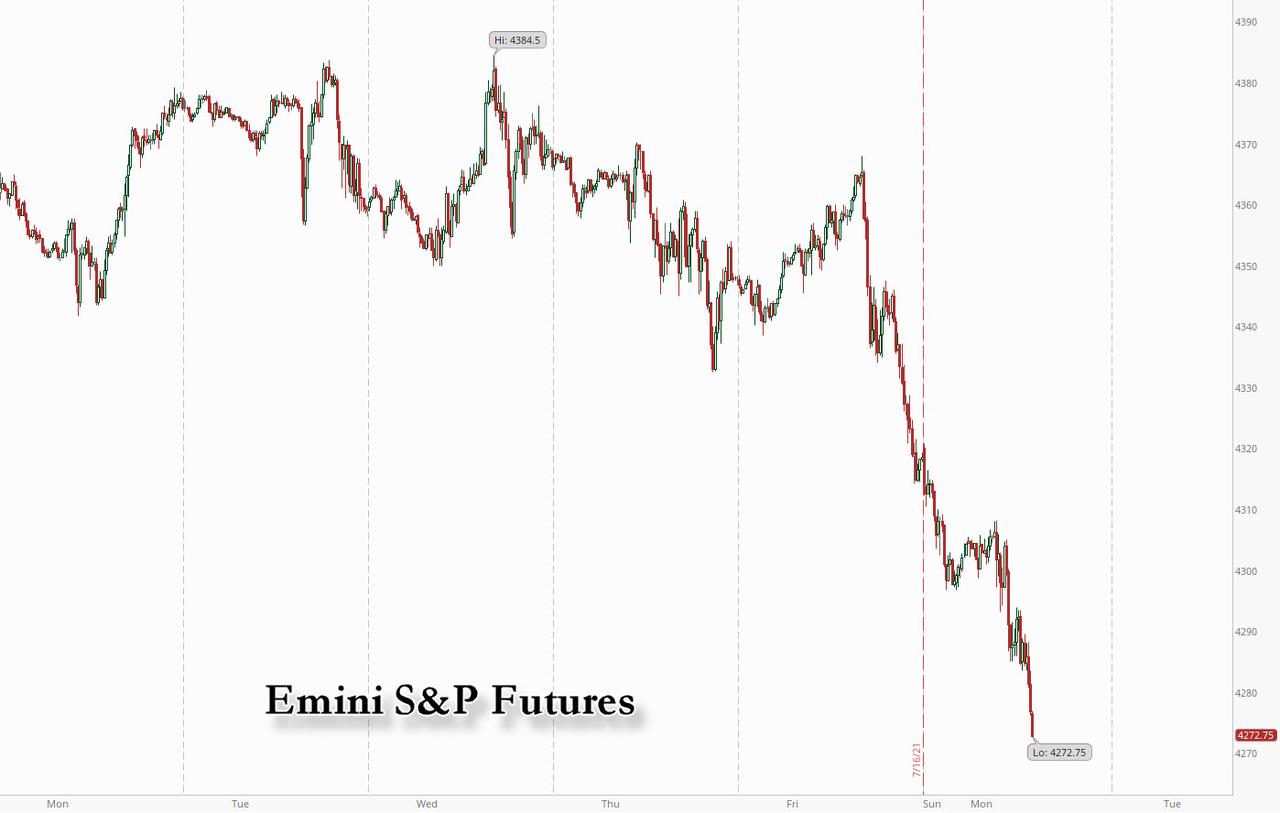
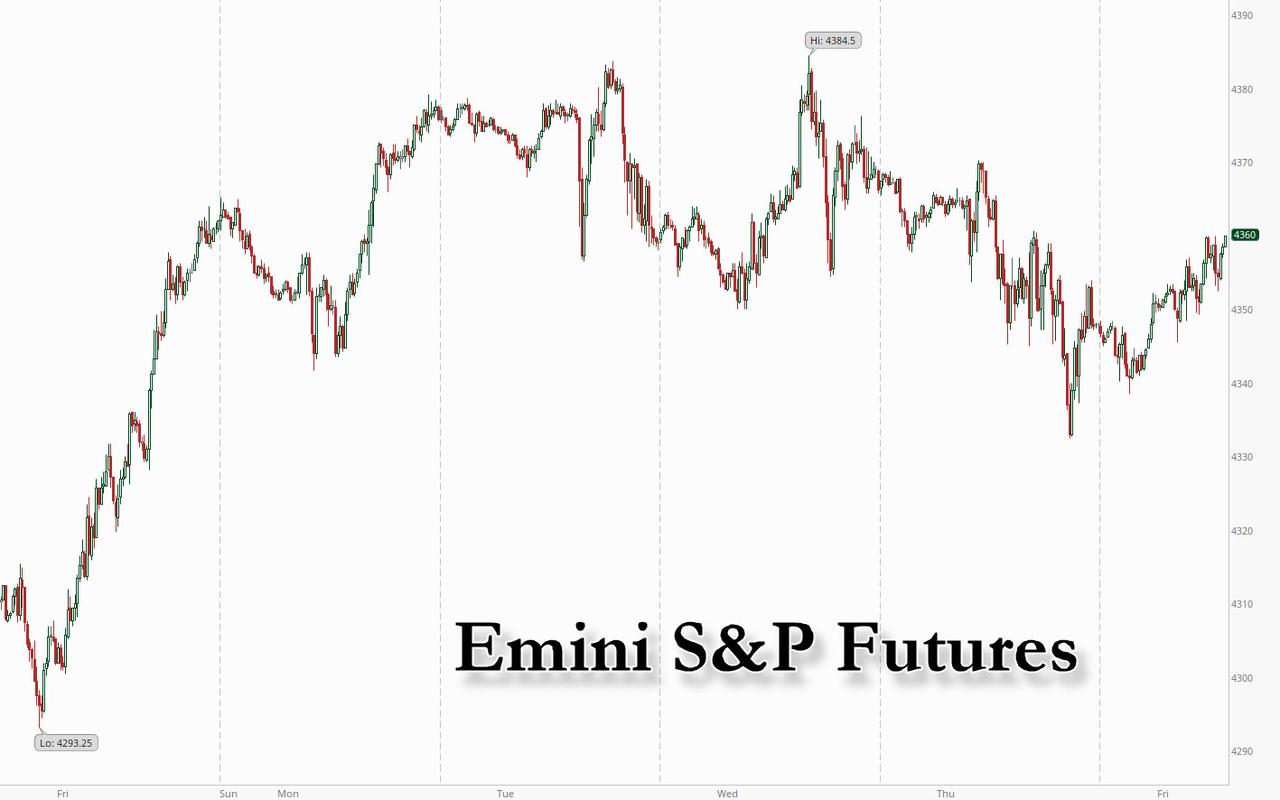
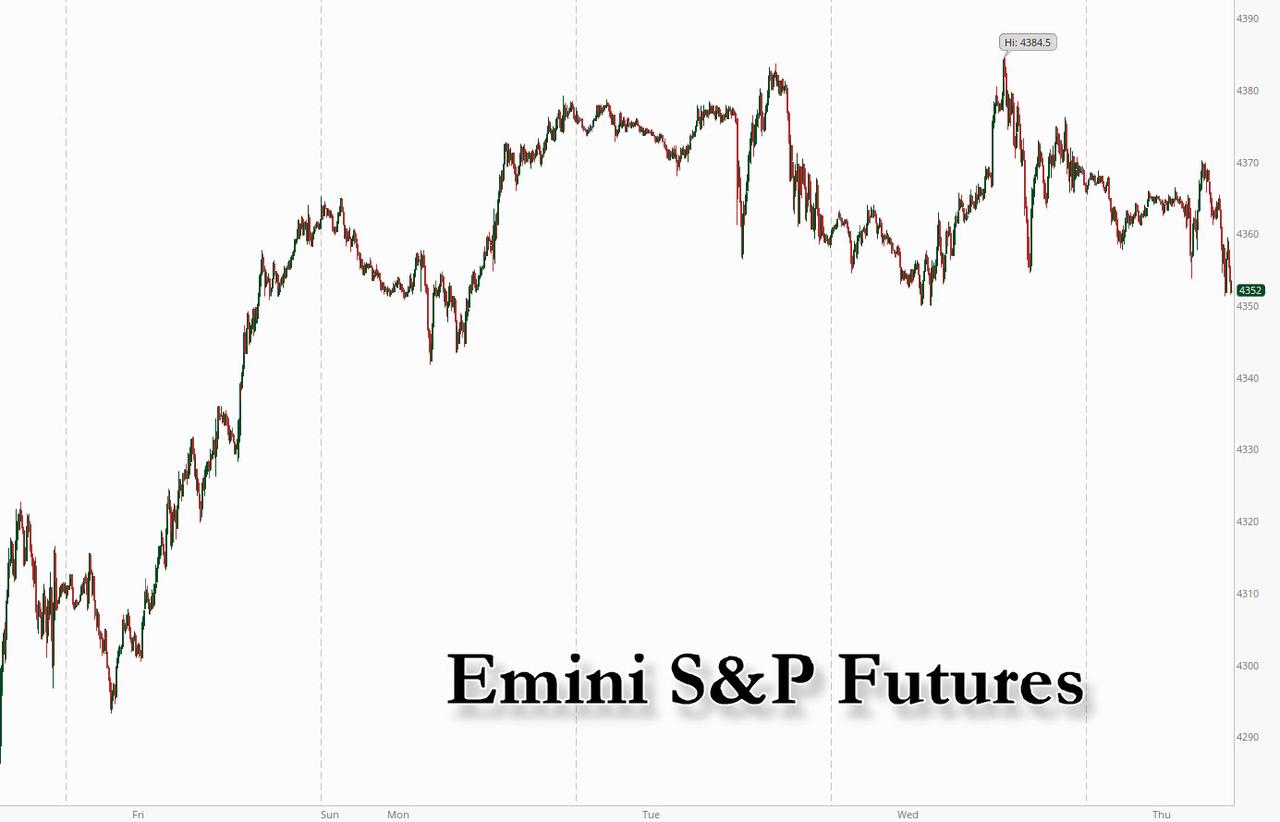
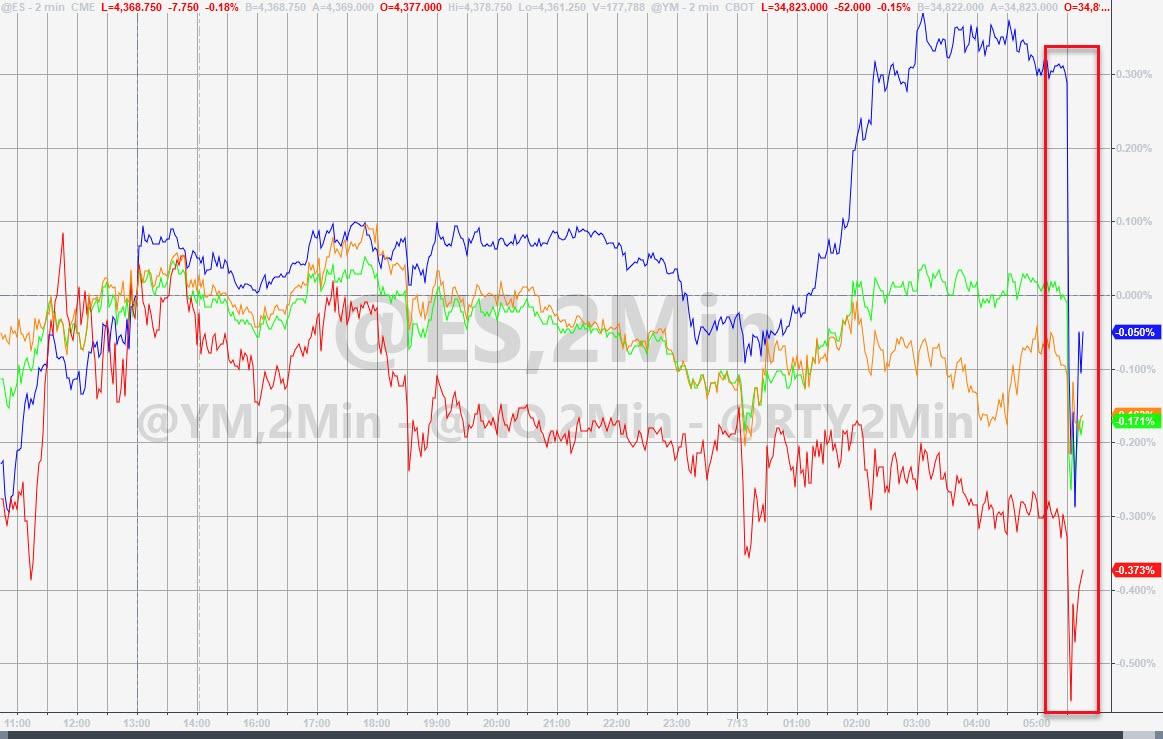
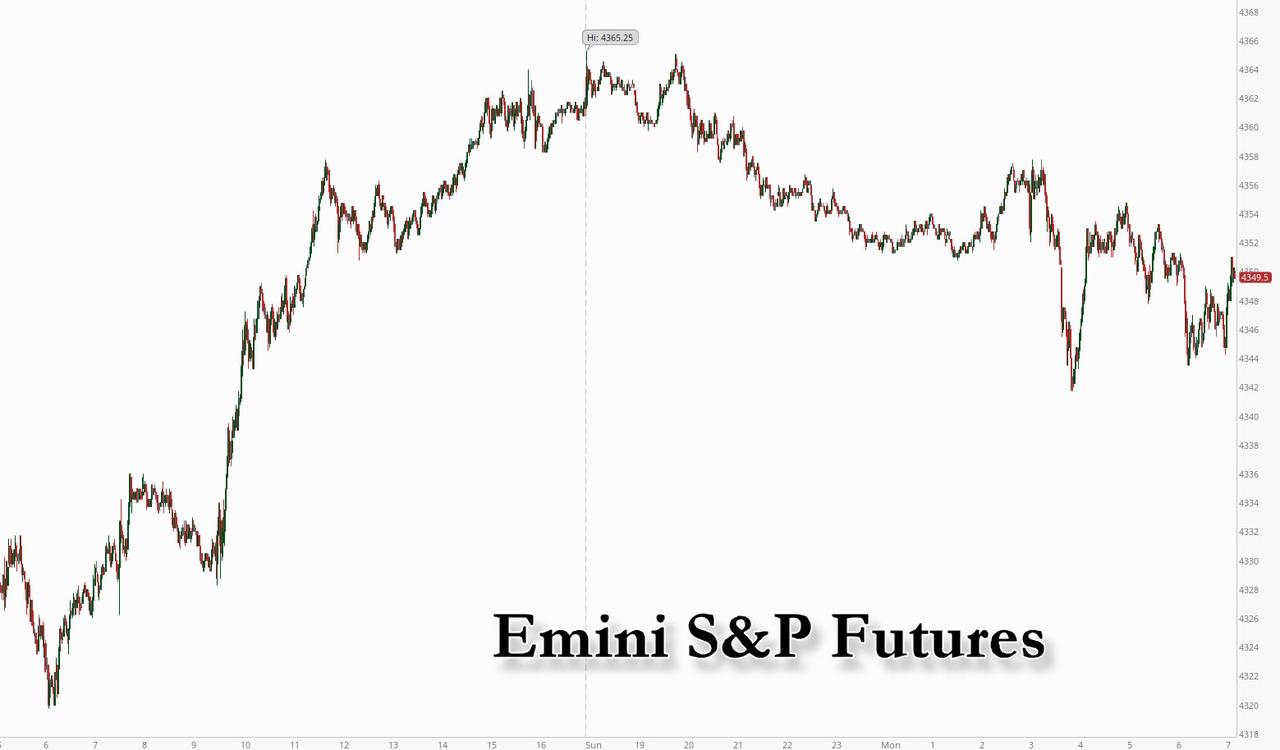
SPX futures were up in the overnight market, but have since come down near closing levels.  They are not in the red as I write, but have lost a considerable elevation from the overnight high. Yesterday’s rally took the SPX just above the 61.8 Fibonacci retracement level at 4330.36.

I was a little optimistic with my observation that the rally might be over by noon yesterday, not knowing exactly how the Cycle would play out.  4.3 days was a good guess, but now we have a more accurate picture.  The final measure of the Cycle was 25.8 hours of decline followed by 8.6 hours of rally into the final hour yesterday.  This gives me some confidence moving forward, since the the Cycle followed a precise pattern.  This happens in impulsive Waves, while the Cycles are often distorted in corrective Waves.

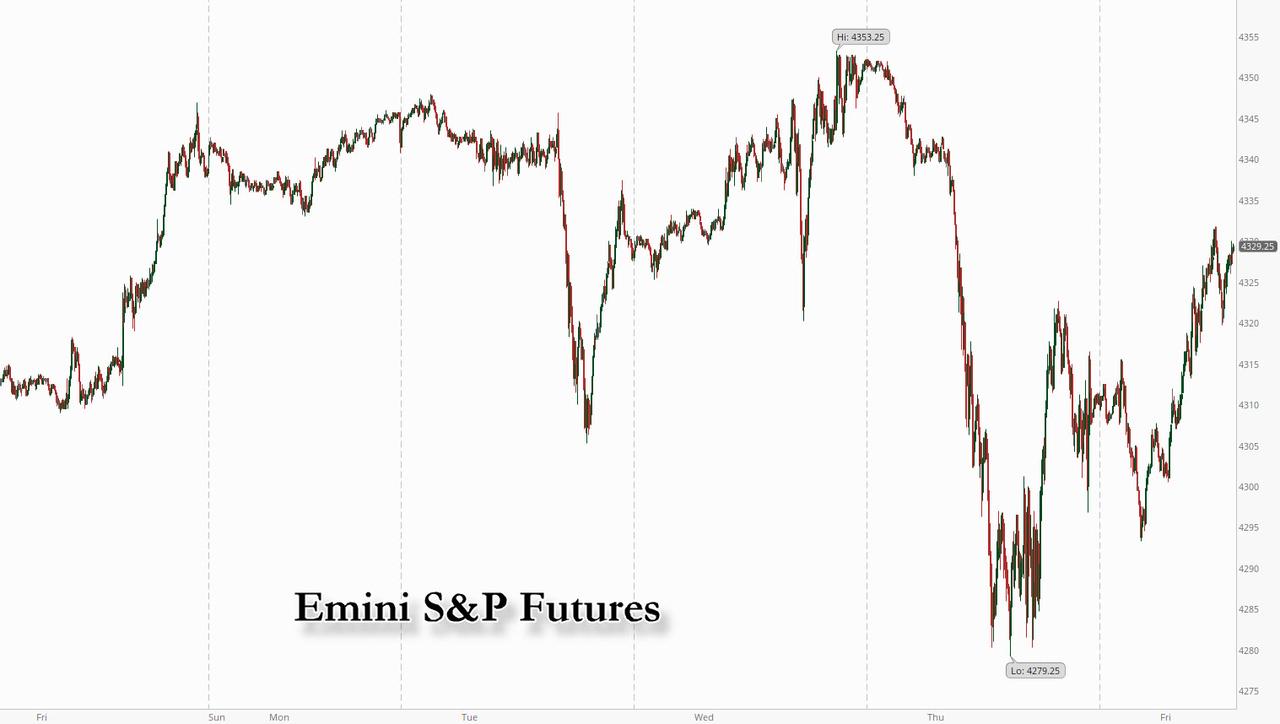
ZeroHedge reports, “US equity futures, European bourses and Treasury yields rose for a second day clawing back much of the week’s losses that were sparked by fears over spiking COVID-19 cases, as well as the “peak growth” and “peak inflation” narratives, as bargain hunters helped the S&P 500 to all but erase Monday’s slide in a rally led by cyclicals such as industrial stocks even though the dollar notched further gains on concerns over the impact of a fast-spreading coronavirus variant.

“The correction we had is healthy to clear some of the excess out of the market and to get better balancing between growth and value,” Katie Koch, Goldman Sachs Asset Management’s co-head of fundamental equity, said on Bloomberg Television. “From a long-term perspective we are really still very constructive on equity markets, so we’d encourage clients to be overweight risk assets.”

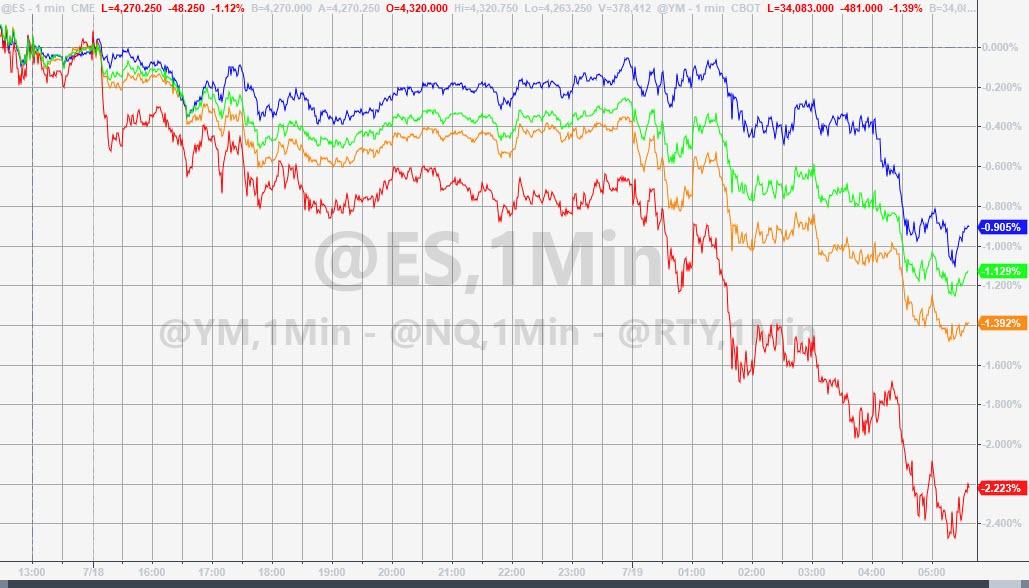
At 7:00am, emini S&P futures were up 11.50 points or 0.26% to 4,326; Dow Jones futures rose 176 or 0.51% and Nasdaq futures were up 4.5% or 0.03%. Bitcoin recovered from its drop below 30,000 jumping back over $31,000 ahead of a conference that sees Elon Musk, Jack Dorsey and Cathie Wood speak on cryptos.”

A word of warning, however.  ZeroHedge observes, “Overnight, Goldman trader John Flood had some advice for its institutional clients: “don’t buy this dip.”

I am a consistent buyer of dips but this wobble feels different and I am bracing for a weaker tape this week. Negative Covid headlines are picking up in velocity. Issuance spigots are fully turned on and this paper is getting harder to place from my seat (after some choppy px action related to issuance last week).

Well, judging by today’s furious bounce in the market which was the biggest one-day gain in the S&P following three days of losses, few followed his advice. Or maybe not – according to Goldman’s flow desk, despite all the sound and fury of today’s gain, virtually no institutions took part. Here is Flood again after the close:

I was surprised by the velocity of today’s rebound but dont think we can scream all clear just yet (i am still bracing for choppiness over the next week or so due to various positioning dynamics I flagged pre mkt yesterday).

Our desk during the drawdown yesterday was active but today eerily quiet and not seeing institutions add to risk on our desk…feels like short hedge band aids being ripped off at the moment…ETFs represent 32% of total tape (down from 35% yesterday but up from 24% ytd avg) Consumer Discretionary shorts a focal point of pain today….(GSCBMSDS INDEX) +437bps.

Earlier today we showed that the biggest highlight of today’s move was the face-ripping short squeeze that started yesterday and ended almost where it started one week ago.”


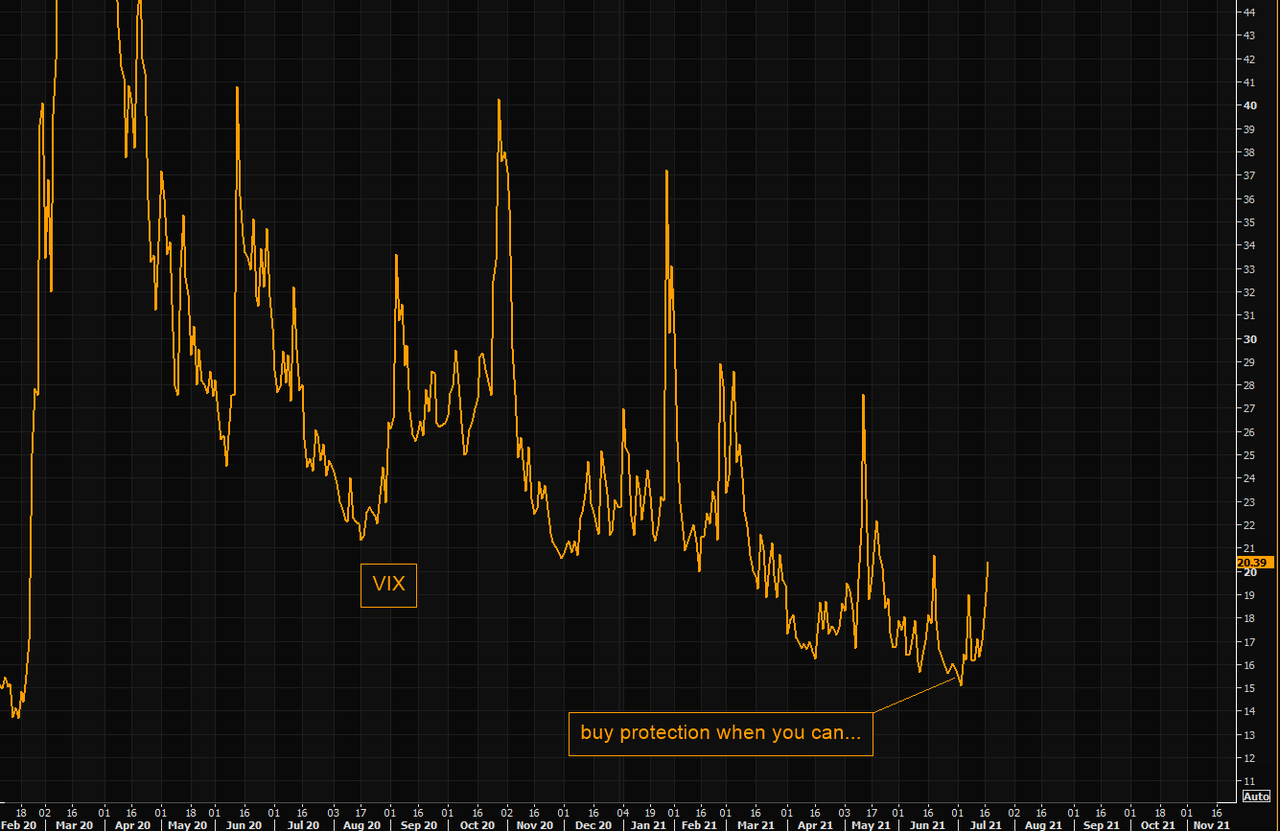
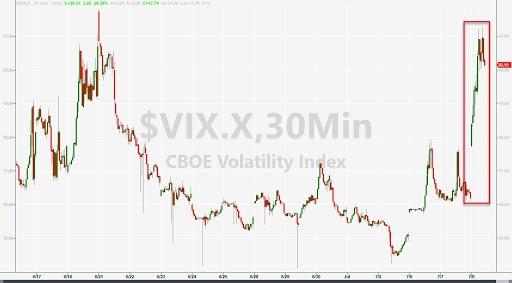
VIX futures bottomed out at 18.52 in the overnight session, but have bounced back near closing value.  VIX is still in the accumulation phase of the Cycle, but a breakout above the trendline near 24.00 will make buying the VIX more difficult.

The NYSE Hi-Lo Index closed at 66.00 yesterday.  It bears watching near the close of the day.


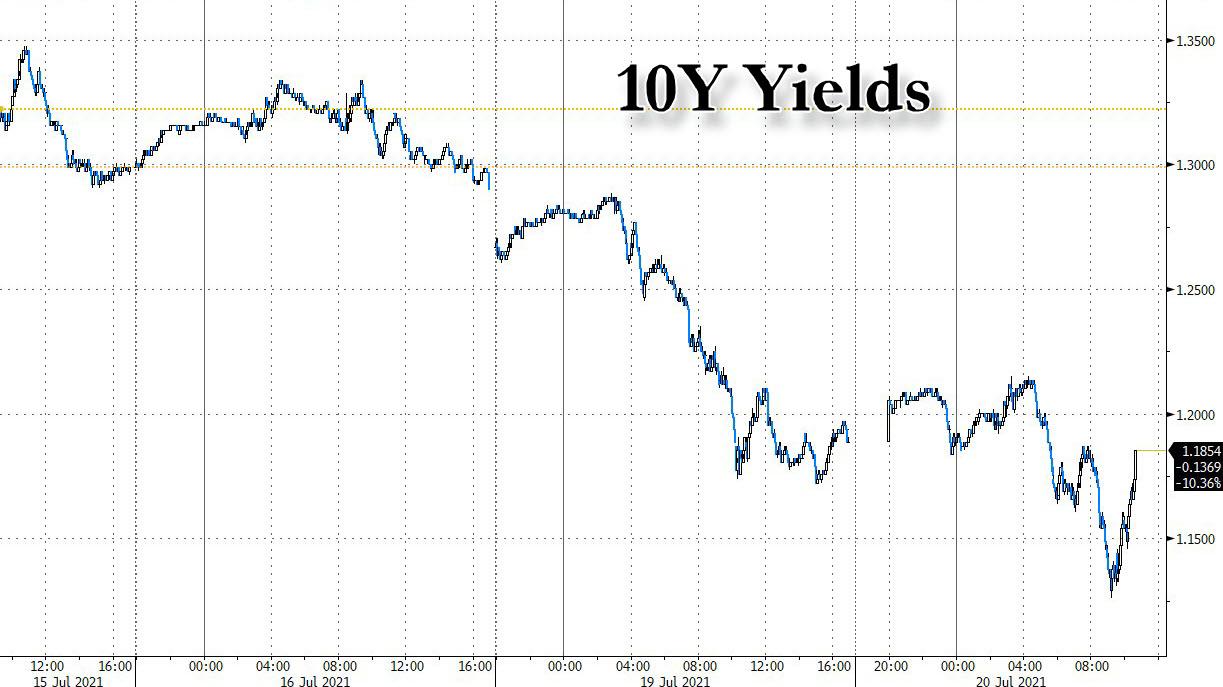
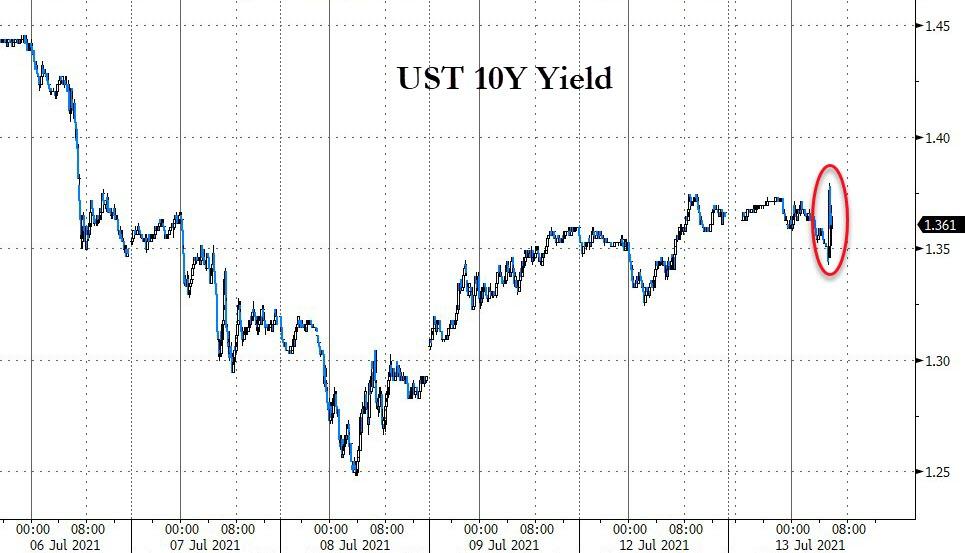
TNX continues to gain elevation.  The Cycles Model infers that strength will continue with maximum energy during the week of August 2.  I have put the Master Cycle at yesterday’s low (day 242).  However, the Cycles Model suggests a slingshot move that may peak out on or near August 6 for the actual end-of-Cycle.


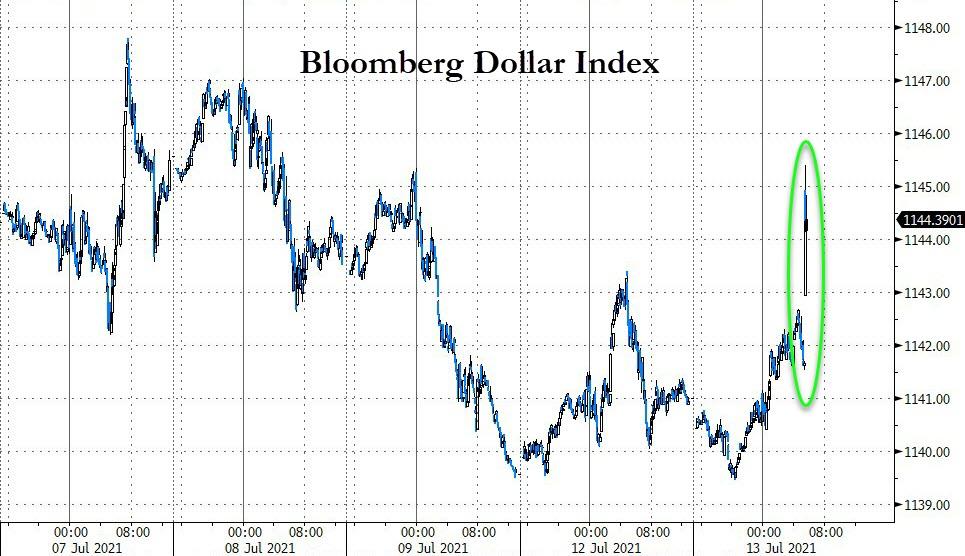
USD futures rose to 93.19, a tick above yesterday’s high, as it continues probing for the Cycle Top at 93.50.  The Cycles Model implies an end to the current Master Cycle early next week.  Should we see a reversal later this week, it implies a Master Cycle low may be arriving next week.


West Texas Intermediate Crude is on a bounce to retest the 50-day Moving Average at 69.59 today.  It is on a sell signal, but the Cycles Model calls for a bottom early next week.  It may be wise to short on the bounce which may take up to three weeks.


Gold futures are on the decline again, having broken support at 1800.00.  It has less than a week to its Master Cycle low, according to the Cycles Model.  However, the Master Cycle high was on July 6, suggesting the low may not come in until the end of the month.


Posted in Published | Comments Off on July 21, 2021 – Let The Selling Begin

July 20, 2021

12:15 pm

TNX has reversed from its potential Master Cycle low this morning.  It should be fair warning that the rebound in stocks is treading on thin ice.  This low is on day 242 of the current (red) Master Cycle.  There has been a revision so that the blue Cycle topped out on day 260 on June 16.  I had been expecting a rally out of the blue Master Cycle (low), but it became too stretched.  The red Master Cycle may actually have a “double tap” where it makes its low today, but still has two to three weeks to make a new high as well.

The fascinating item is that, should Wave [5] equal Wave [1], we may see TNX rally to a potential target of 19.96 in the next 2-3 weeks!  Not far off my earlier target of 19.71.  In the meantime, the move in bonds is sending a false signal in stocks.  Read on…

ZeroHedge opines, “In a notable turn of events, the overnight session saw an initial attempt at a modest reversal in the recent Treasury rally only to be met with further buying interest. The net result was a tick lower in 10-year yields that brought the benchmark to levels not seen since mid-February.

With the next technical target sill 5 bps away, we’ll be watching the interplay between risk assets and US rates as the delta-inspired repricing continues. We’re cognizant that the severity of the recent move has led to stretched momentum measures, implying incremental gains will be more difficult to achieve. This isn’t to suggest the floor for rates is evident at the moment, rather that it should be anticipated that the pace of the rally will slow. There has been plenty of chatter surrounding the possibility 10- year yields dip below 1.0%; an eventuality that would be a short-lived endeavor, but not one that’s off the table. More immediately however, will be gauging the extent to which rising case counts can carry yields even lower from here.”


10:35 am

Within the hour SPX may complete a 4.3-day Cycle (30.1 hours).  The next decline may be multiples in length of the first.  This pattern may be a Leading Diagonal, a series of A-B-C declines.  It is probable that in the next week or two the SPX may reach or exceed “Point 6” listed on the chart.

ZeroHedge opines, “A few months ago, Morgan Stanley’s chief equity strategist Michael Wilson, who also recently emerged as the biggest Wall Street bear warning that the “rolling corrections” in the market presage a 10-20% drop in stocks, summarized the current economic state simply as “mid cycle“…

… which of course is the best place to be, as the initial euphoric surge higher in stocks tapers to a slow and steady grind as the economy chugs along at a modest pace.

But what if he is wrong? After all, yesterday the NBER determined that the covid recession – at just 2 months – was the fastest on record (even as 14 million Americans are out of a job and still collect unemployment benefits) and we are already well into the mid cycle, if not approaching the end.”


9:25 am – Don’t Buy This Dip

ZeroHedge remarks, “At the start of the month, Goldman trader John Flood correctly said that we are entering the best 2-week seasonal period of the year, with the first 18 days of the month traditionally the strongest period for markets…

… and followed up with a prediction that shorts will have to cover, which they did during a period in which we saw 13 out of 16 trading days hit new all time highs.

Of course, it all came crashing down in the last 3 days when the S&P slide accelerated, culminating with a scary rout on Monday when tumbling yields sparked a panic that the US economy is headed straight into a stagflationary crash.

And yet, with futures rebounding and traders clearly showing a desire to catch what has been the fastest falling knife in months, we were surprised to read that the same John Flood who correctly predicted the market ramp in the first half of July, has now flipped completely and in a note published overnight writes “don’t buy this dip.” He explains why:

I am a consistent buyer of dips but this wobble feels different and I am bracing for a weaker tape this week. Negative Covid headlines are picking up in velocity. Issuance spigots are fully turned on and this paper is getting harder to place from my seat (after some choppy px action related to issuance last week).

99% of S&P500 companies are in buyback blackout period into next week and quant flows remain asymmetric on the supply side (AKA CTA sellers will win this tug of war). Earnings last week were great but were not rewarded (banks)…this week and next are the 2 busiest weeks of the earnings period.”


8:00 am

Good Morning!

SPX futures reached an overnight high of 4279.12, equivalent to 4290.00 cash after bouncing off the 50-day Moving Average.    Investors are buying the dip.  However, the Cycles Model suggests a possible down draft this morning to the Cycle Bottom at 4160.12 before a meaningful retracement is possible.  The Cycles Model suggests the decline may last until mid-to-late August with much higher volatility.

ZeroHedge reports, “U.S. stock-index futures rebounded from Monday’s rout and European stocks were modestly in the green as investors weighing corporate earnings against the uncertain outlook for global growth, or as Bloombnerg put it, “as buy the dip outweighs fears.” But in a continuation of yesterday’s moves, treasury yields edged lower sliding to 1.16% while the dollar hit a fresh three month high while bitcoin tumbled below the key support level of $30,000. At 730 a.m. ET, Dow e-minis were up 200 points, or 0.6%, S&P 500 e-minis were up 23.00 points, or 0.54%, and Nasdaq 100 e-minis were up 70 points, or 0.48%.”


VIX futures pulled back to 20.50, still above the 50-day Moving Average at 18.01.  The Elliott Wave structure is incomplete and begs completion above the Ending Diagonal trendline.  Should the SPX decline to its Cycle Bottom at 4160.00, then the VIX may rally to its Cycle Top at 30.80 in the near term.


The NYSE Hi-Lo Index closed at -78.00 yesterday, firmly in the sell zone.  That should warn the buy-the-dippers that they have acted too quickly.  The NDX Hi-Lo Index closed even lower, at -217.00.  The Cycles Model doesn’t see an end to this decline until early September.

Institutional and dealer selling pressure must be monstrous, as retail investors and hedge funds are “all in.”

RealInvestmentAdvice remarks, “The “Fear Of Missing Out” has infected retail and hedge funds alike as they ramp up exposure to chase performance.

We have previously discussed the near “mania” of retail investors taking on exceptional risk in various manners. From increasing leverage, engaging in speculative options trading, and taking out personal loans to invest, it’s all evidence of overconfident investors.

Hedge Funds, Technically Speaking: Hedge Funds Ramp Up Exposure

However, that “risk appetite” is not relegated to retail investors alone. Professional managers, institutions, and hedge funds are “all in” as well.”


TNX futures made a new low at 11.64, but have risen since then.  This is yet another indicator that the selling pressure in the SPX may have only paused, but not stopped.

ZeroHedge reports, “In the days following the quarter-end burst to almost $1 trillion, usage of the Fed’s infamous overnight reverse repo facility had shrunk by roughly $200BN, gravitating in the $750BN – $800BN range, until today when 71 counterparties parked $860.5BN worth of reserves at the Fed, the second highest amount on record.

But despite renewed expectations that this latest push will finally send total RRP activity above $1 trillion as banks seek to park excess reserves/deposits anywhere but in the economy and/or markets, Curvature’s Scott Skyrm disagrees, pointing to one notable change: the surge in yields.

As Skyrm writes in his latest Repo Market Commentary “with the stock market sell-off and the bond market rally, it only means one thing! A flight-to-quality.” This matters because traditionally “a flight-to-quality will affect the Repo market by removing securities from the market.”


BKX gapped down through its Head & Shoulders neckline at 118.70 yesterday, confirming its sell signal.  While it may attempt to retrace the gap, the more likely outcome is a further decline through the end of August.


USD future rose to 93.10 this morning, on its way to the Cycle Top resistance at 93.50.  It may make its next Master cycle high in the next week or so.  The Rally structure still has a way to go, so it may extend through mid-September.


Posted in Published | Comments Off on July 20, 2021

July 19,2021

3:00 pm

SPX has been challenging the 50-day Moving Average at 4237.73 and appears to be breaking through.  This opens the probability of a further sell-off to the Cycle Bottom at 4159.81.  This could last into the morning open as support may take another hour or so to be established.  In the meantime, it is possible that the Wave pattern is not yet complete.

In the meantime, the NYSE Hi-Lo Index remains near zero and The VIX continues to challenge its Ending Diagonal trendline at 24.00.


11:04 am

BKX has finally broken is Head & Shoulders neckline, confirming the market sell signals across the board.  Liquidity is draining out of the economy and this signal formalizes that process.  Good luck and good selling.


10:28 am

There is some major recognition of a trend change as the VIX rises above its Ending Diagonal trendline at 24.00.  Analysts who don’t do charting still look at 25.00 as the breakpoint for a significant rally in the VIX as downside in the SPX.


10:09 am

The NYSE Hi-Lo Index has gone negative for the first time since May 10.  This confirms the sell signal in the VIX.  While there may be a bounce, cracking the zero line is significant.


8:00 am

SPX futures have broken their 9-month Ending Diagonal formation this morning, challenging Intermediate-term support at 4274.43 and threatening the 50-day Moving Average at 4236.36.  It is on an aggressive sell signal as of Friday afternoon when the VIX gave its buy (SPX sell) signal.  The Hi-Lo Index, which closed at 78.0 on Friday appears to be poised to give its signal at the open, confirming the sell signal.

ZeroHedge reports, “The Friday selloff sparked by a huge op-ex expiration which saw up to a third of market gamma rolling off, has accelerated on Monday morning with the narrative goalseeking today’s rout to concerns that the covid resurgence and elevated inflation will weigh on global demand. To help validate this on Friday, US infections surged last week, topping a 16% global increase. At 730 a.m. ET, Dow E-minis were down 357 points, or 1.02%, S&P 500 e-minis were down 48 points, or 1.12%, and Nasdaq 100 e-minis were down 91 points, or 0.63%. The rally in Treasuries continued, sending 10-year yields tumbling below 1.23%. The dollar strengthened, oil dropped and gold and bitcoin was also lower.

“The peak of economic growth rates is behind us and growth worries are back. The good news is that even if the peak of some economic indicators is behind us, equities should continue to perform positively in the medium term in a positive economic environment,” Berenberg strategists said in a note. “However, high valuations, COVID-19 fears, low trading volumes over the summer and high investor equity allocations argue against significantly rising markets for the time being.”

ZeroHedge further notes, “Futures are down (relatively) hard ahead of today’s open with Small Caps leading the charge to the downside…

Notably, SpotGamma points out that we start the session in a negative gamma position.

The official gamma flip points are coming in at 4335 but we suggest using 4300 as the key “risk off” level. This is due to fairly large open interest at that strike, which also makes it first resistance this morning. Key levels today are 4300, 4335 (gamma flip) to the upside, with 4240 downside support.

We certainly see the setup for weakness today… and another call to The PPT imminent…”


VIX futures rose to a morning high of 21.90, testing the upper Ending Diagonal trendline near 22.00.  A break in trendline resistance may bring recognition to a trend change in the markets and a flood of short sellers.

ZeroHedge observes, “Volatility is exploding.

We are seeing VIX and V2X move sharply to the upside today. Obviously not a shocker given the poor px action.

Regular readers of TME know our stance on hedges and protection; you basically do not chase it unless you think market is crashing.

On June 30, in our note, Protection – time to start planning…, we outlined our view on VIX and protection in general. We wrote;

“We would actively be looking to start using depressed vols for protection. You will probably need to endure some more short term theta pain, obviously depending when you get involved, but this boring market will eventually find the new narrative, and things will get dynamic again.

Source; Refinitiv

The 2010-2019 seasonality is with you…and we have earnings coming up as well so time for a gentle reminder;”


TNX has hit a new retracement low on day 265 of its Master Cycle.  The money flow from stocks to bonds may persist for a few days, but be warned that the Cycle is ripe for the turning.


USD futures hit a new high at 93.04 this morning as the narrowing Cycle Tope resistance comes into view.  The Chart pattern and Cycles Model both infer that this rally may be short, but strong.  The initial target appears to be the Broadening Wedge trendline at 96.00.


NDX futures are in decline after testing the daily Cycle Top resistance on Friday.  The NDX Hi-Lo Index closed on Friday at -52.00, confirming its sell signal along with the VIX (VXN).

ZeroHedge comments, “The world’s financial graveyards are covered with the career tombstones of those who, over the past decade, have called the end to a tech bubble that not only has yet to pop but has culminated with just 5 tech names – the FAAMGs – comprising 23% of the S&P’s market cap vastly surpassing the lofty dot com days, with a combined valuation of over $7 trillion.

Among those who were steamrolled by the tech juggernaut is Ned David Research, traditionally known for its accurate market timing calls if certainly not this time: two months ago it slapped a sell reco on tech right before it ripped the bears’ faces off and embarked on a 14% rally. And then, just as the FAAMGs fell out of bed late last week, the firm’s strategists pulled a Gartman, and abandoned their underweight stance, expecting that the rotation out of reflation and into growth, coupled with a plunge in yields, will lead to more tech buying when we may well be facing the first market rout since March considering last week’s coordinate selloff.”


BKX has been a tease all last week as it remained above the Head & Shoulder neckline at 18.70.  While the BKX is already on a sell signal beneath the 50-day Moving Average, it may have the ultimate confirmation through the Head & Shoulders formation.

ZeroHedge notes, “There was a remarkable disclosure in the latest JPMorgan earnings report: the largest US bank – an entity historically best been known for making loans to the broader population at least until the Fed nationalized the bond market – reported that in Q2 its total deposits rose by a whopping 23% Y/Y and up 4% from Q1, to $2.3 trillion, while the total amount of loans issued by the bank was flat both sequentially and Y/Y at $1.04 trillion.

In other words, only for the second time in its history  – Q1 2021 being the first one – JPM had 100% more deposits than loans, or inversely, the ratio of loans to deposits is now 50% (it did post a modest rebound from an all time low in Q1).”


Posted in Published | Comments Off on July 19,2021

July 16, 2021 – Options Day

3:48 pm

VIX has produced a buy (SPX sell) signal.  This is not unexpected.  SPX may not recovery on such short notice,  so it is time to put in your short positions.  We may see abounce on Monday, but the damage appears to have been done.


1:52 pm

While SPX may still bounce back to 4370.00 as indicated this morning, there is also a risk of failure which may set off a firestorm of selling.  Short-term support lies at 4342.00, below which the bears may take over.   While the existing retracement has been quick, it has already made the 61.8% Fibonacci level.  Max Pain is at 4300.00 and there may not be enough time to rally a second time to end the day.

Hedge funds and dealers may be eyeing their exposure to the market.

ZeroHedge comments, “Last August, in the middle of the low-volume summer doldrums, tech names exploded higher for several weeks in a move which stumped traders only for it to be reveled (on this website first) that the action was due to an attempt by SoftBank’s brand new public equity trading desk to ramp gamma higher in tech names.

The start of July witnessed an almost identical move, as FAAMG names soared higher driven by a surge in call buying. And, while we doubt SoftBank is behind the latest move the sharp increase in options trading activity to start July – July 2nd recorded the highest day of single stock options trading in history – has driven month-to-date average daily notional traded to all-time-highs.”


7:20 am

Good Morning!

NDX futures are testing the 2-month trendline just above 14800.00.  Due to the shallow decline thus far and trendline resistance, NDX may decline to Short-term support at 14624.80 today before revisiting the trendline again.  NDX is on a chart formation sell signal.  However, it is short-term oversold with limited options to affect it either way.   The NDX hi-Lo Index closed at -132.00, suggesting more downside this morning before a significant bounce.

QQQ (360.52), on the other hand, has a massive number of puts expiring at 355.00, so this options expiration may be tightly controlled to inflict maximum pain.


.SPX futures are mildly positive, as options expiration approach.  SPX is net gamma positive at 4300.00 and above, with nearly 3000 more  calls than puts at 4370.00 and a massive 8600 net calls at 4400.00.  The dealers must keep SPX between 4300.00 and 4370 for maximum pain to both bulls and bears.  That implies a further decline to 4300.00 this morning with a possible end of day rally back to 4370.00.

Market breadth has been poor.  The NYSE Hi-Lo Index closed at 48.00 yesterday.  Normally, that would indicate a sell signal for the SPX, but the Hi-Lo has declined to zero in the recent past and subsequently gone to new highs.  It appears that we must see a negative close to confirm the sell signal for the NYSE/SPX.

ZeroHedge explains, “US equity futures rebounded from yesterday’s slide and losses of as much as -0.3% overnight on dismal volumes, as 10Y yields rose up to 1.335% and the dollar pushed higher. At 7:15 a.m. ET, Dow e-minis were up 51 points, or 0.14%, S&P 500 e-minis were up 7.75 points, or 0.17%, and Nasdaq 100 e-minis were up 34 points, or 0.23%.

Volatility shrank, but with today’s op-ex seeing a third of SPX gamma expiring, there is a chance volatility may spike, and with the vol trigger level just below spot, there may be some market turbulence today.”


VIX futures declined to 16.56 in the overnight session, keeping it beneath the 50-day trigger at 17.95 for the time being.  Should the SPX decline further today, we may see the VIX rise above the 50-day for the next buy signal.  Truth to tell, today would be a good day to accumulate VIX options, futures or ETFs at any level.


BKX continues to hover above its Head & Shoulders neckline at 118.70 despite the less than stellar earnings reports.  While unable to move to new highs, the BKX still controls the narrative thus far.


USD futures rose to 92.74 this morning as it consolidates its gains.  The Cycles Model suggests a week-long decline to follow options expiration.  The probable target appears to be mid-Cycle support at 91.30.


TNX rose to a morning high of 13.36 after bouncing yesterday from mid-Cycle support at 12.98.  The Cycles Model calls for approximately three weeks of rally into strength starting this weekend.  .


Posted in Published | Comments Off on July 16, 2021 – Options Day

July 15, 2021 Gamma Positive, Market Down?

11:48 am

While SPX navigates the neutral gamma zone, NDX is challenging its 2-month trendline at 14800.00 for a possible aggressive sell signal.  Additional confirmation lies at Short-term support at 14607.00.  While the NYSE Hi-Lo is above 70.00, the NDX Hi-Lo is on a sell signal at -66.00, down from an open at -14.00.  I suspect that further negative movement in the NDX may trigger the VIX 50-day MA as well.  at 17.94 where it is at present.  Look for the VIX to rise above 18.00 to confirm.

ZeroHedge reports, “Last month, stocks tumbled in the days immediately following the Fed’s unexpectedly hawkish tilt, a move that was exacerbated by June’s Quad witching option expiration which followed just two days after the FOMC, and which we warned at the time would spike volatility due to a substantial rolloff in existing market gamma. It’s time to brace for another vol spike.

But first, a quick look at the market’s technical positioning courtesy of SpotGamma, which in its morning note today writes that while the S&P is falling into typical pre-OPEX lull, there is an interesting “tilt” to the QQQ position. As shown below, the SPX vanna model has a right skew which according to SG infers that there is resistance above “not surprising given the high gamma in the 4350-4400 area. However the QQQ has a subtle left skew which shows less resistance at higher prices but that also means heavier selling if markets decline. This is something that we saw back in March when there were large QQQ put positions in place.”

SpotGamma also note the accelerating weakness in the RUT/IWM landscape, which, along with tumbling meme stocks, has been hit hard as of late. There are likely macro-based reasons for this divergence, but regardless its something to flag (similar to the QQQ skew above).”


8:25 am

Good Morning!

SPX futures declined to test Short–term support at 4331.75 this morning.  This does not give us a chart sell signal, as we await the VIX and Hi-Lo Index to give further guidance.  Friday options are positive all the way down to 4250.00, so gamma remains net positive for now.  An aggressive sell signal lies at the mid-Cycle support at 4268.44.   A confirmed chart sell signal lies at the trendline at 4250.00, with the 50-day Moving Average at 4230.21, unless otherwise noted by the combination VIX and Hi-Lo.

ZeroHedge reports, “S&P futures dropped, trading near session lows and sliding along Europe shares and Treasury yields, as investors assessed a growth slowdown in China and dovish comments from Federal Reserve Chair Jerome Powell. The drop in yields helped push the Nasdaq higher with mega-cap technology stocks leading gains ahead of today’s initial unemployment claims report that will allow investors to gauge the strength of the labor market. At 7:00 a.m. ET, Dow e-minis were down 189 points, or 0.54% and S&P 500 e-minis were down 141.00 points, or 0.32%, and Nasdaq 100 e-minis were up 12.5 points, or 0.08%, with FAAMG heavyweights all gaining between 0.1% and 0.4%. The dollar weakened against haven currencies and bitcoin slumped back under $32,000; the British pound rose after a Bank of England policy maker said withdrawing stimulus may be appropriate soon.”


NDX futures remain positive this morning, but beneath Tuesday’s high at 15002.30.  A chart sell signal lies at the trendline at 14800.00.


DJIA futures are down this morning, but no sell signal after having made a secondary high at 35069.18 at yesterday’s open.  The all-time high remains on May 10 at 35091.56.  This market is too easy to misread.  The fact is, unless the INDU cracks that high, this is a most bearish setup..


VIX futures challenged the 50-day Moving Average this morning at 17.98, but settled back beneath it.  As you can see, a signal may be imminent..  However, due to the low 50-day, we will wait for the Hi-Lo for additional confirmation.


The NYSE Hi-Lo Index closed at 70.00 yesterday, showing poor breadth in the market action.  However, it does not yet constitute a sell signal.  A close beneath 0.00 would confirm the sell signal, since that would be our breakdown point.


China’s Shanghai Composite rose to 3565.03 this morning, testing Intermediate-term resistance at 3568.72.  A Head & Shoulder neckline awaits at 3485.00 which confirms our sell signal.  It remains on an aggressive sell signal beneath Intermediate-term resistance.  The tech-heavy index offers a strong influence on the NDX, which is still positive.

ZeroHedge observes, “Following Q1’s record-breaking surge in China’s YoY GDP (thanks to base-effect malarkey and a massive credit impulse), tonight’s Q2 GDP was expected to slow drastically (especially given the crackdown on investment/real estate deleveraging and the collapse in the credit impulse)…

Source: Bloomberg

The question is how much? Consensus estimates called for an 8.0% YoY GDP rise, but whisper numbers were notably lower with Bloomberg Economics’ Shu noting that various early indicators are consistent in pointing to some weakening in consumption in June.

“On balance, these indicators suggest production growth – after base effects are taken into account – may have slowed, but only a touch.”

The official services PMI fell to 52.3 in June from 54.3 in May, while its Caixin counterpart showed a much steeper slide from a strong reading to just slightly above 50 – the line between expansion and contraction.

The headline GDP growth figure printed a very slightly disappointing +7.9% YoY”


BKX remains on a sell signal beneath the 50-day Moving Average at 127.35, but frustrates the bears by remaining above the Head & Shoulders neckline at 118.70.  After a respectable second quarter, banks face a bleak future.

ZeroHedge reports, “Morgan Stanley shares dropped as much as 2% after the bank – which otherwise reported a solid set of numbers beating on the top and bottom line – became the latest to report disappointing second-quarter fixed-income trading revenue of $1.7 billion came in below analyst expectations for $1.9 billion, and tumbled 45% from a year ago even as the bank’s dealmakers generated the second-most profitable quarter ever thanks to $2.38 billion in investment banking revenue.


TNX may be retesting mid-Cycle support at 12.97 today as it declined to 13.20.  This retest offers an aggressive buy signal (sell signal for UST) as it may regain its strength through the weekend.


Posted in Published | Comments Off on July 15, 2021 Gamma Positive, Market Down?

July 14 – Bastille Day

7:10 am

Good Morning!

I have an 8:00 am meeting, so this blog will be brief.

SPX futures declined to 4250.12 before bouncing back to positive (above 4370.00 cash) this morning.  Yesterday’s cash market came awfully close to the 4399.00 mentioned as a major Wave relationship target.  This may have allowed the decline to begin.  Major bearish gamma strikes lie at 4370 and at various levels beneath that., so this may cause the reversal to gain momentum.


VIX futures dropped to a low of 16.66 this morning on the monthly options expiration day.  There are 700 more calls than puts at 17.00, so the VIX levels must be “controlled” to prevent a runaway VIX.  The picture I get this morning is that everyone appears to have their finger on the trigger.  Today may be a very interesting day.


TNX futures have made a shallow retracement to 13.88 after reaching 14.23 in the overnight session.  The Cycles Model suggest further strength by the end of the week, so further strength today may be problematic for the equity bulls.


Posted in Published | Comments Off on July 14 – Bastille Day

July 13, 2021 – Earnings Season, Hit Or Miss?

3:30 pm

I had been warning since yesterday that trending strength was on the increase.  It appears that the increase in strength will continue through the weekend.  A breakout above the 50-day Moving Average at 15.37 may be in order…

ZeroHedge reports, “After two mediocre coupon auctions were staggered on Monday ahead of today’s sale of 30Y paper in the form of a 29-Y 10-Month reopening, the bond market seemed content that there would be no fireworks. Alas, the bond market was wrong again, because moments ago the Treasury sold $24BN in what can only be called an ugly auction, if nowhere near as ugly as the infamous February 7Y auction.

With the When Issued trading at 1.976%, the market was expecting the first sub-2% high yield since February. It wouldn’t get it because the auction priced at exactly 2.000%, tailing the When Issued by 2.4bps, the biggest tail since last August.

The Bid to Cover of 2.193 was also quite ugly, down from 2.29% last month and the lowest since February. It was also below the six-auction average of 2.32.

The internals likewise were disappointing, with Indirects taking down 61.1%, down from 64.0% in June and below the 62.4% average. And with Directs taking down just 16.6%, the lowest since November, Dealers were left with 22.3% of the allotment, the most since October.”


3:15 pm

SPX had declined beneath its Cycle top resistance at 4377.00.  This puts us on alert that the probability of a reversal is at hand.  For tomorrow’s SPX option expiration, there are 1000 more puts than call contracts at 4370.00!  Should the SPX continue down, we may see an acceleration to the downside.  I had been commenting that there was evidence of substantial distribution by institutional investors.  See the comment below.  Is Goldman Sachs pulling out the rug from under us?

ZeroHedge remarks, “While most analysts and traders were digging through Goldman’s investment banking and trading results – of which the former came in stellar while trading, especially in FICC, was mediocore…

… when the bank reported its second best quarter on record, there was some more notable slide in the bank’s Q2 earnings presentation, and it had to do with what Goldman is doing for its own prop, or “asset management” book.

As shown in the table below, Goldman’s Asset Management (F/K/A “prop”) also had a stellar quarter, generating a record $5.1BN in net revenue, more than double the year ago quarter.”


8:15 am

Good Morning!

Earnings Season is kicked off with two Major banks, Goldman and JPMSPX futures made yet another all-time high at 4378.62.  Futures currently trade about 12 points beneath the cash market, suggesting a morning high near 4390.00.  The Cycles Model suggests another Master Cycle high may be due.  Notice that the last two Master Cycles ended during options week.  This one may be due either this week or early next.

ZeroHedge reports, “The dollar spiked after the much hotter than expected CPI print…

Source: Bloomberg

Stocks were slammed…

…and bond yields rose…


VIX futures made a low of 15.96 last night, but spiked higher this morning.  Note the coiling action of this year-long pennant formation.  This pennant infers a move as great or greater than last year’s rally (approximately 75 points).

Yesterday, NorthmanTrader observed, “Last week in “Crushed” we talked about a coming volatility spike and sure enough $VIX spiked to over 20 from the 15 handle in a matter of days only to be crushed again. Thursday’s one hour 1.7% dip on $SPX was once again ferociously bought and new highs have once again ensued, no matter what the internal picture of the market may be, which continues to rally irrespective of the lack of participation underneath the surface.

Just this morning we got a taste of this:”


NDX futures also made a new all-time high, but switched direction at 7:00 am and are clearly in the red as I write.  What has triggered this is unknown, but it appears to be serious.  Is this the Master Cycle High?


US 30 futures turned down at 7:45 am after a flat overnight session.  Note that a new all-time high has not been accomplished.  This has serious implications going forward , not only due to a Master Cycle change, but because a lower high infers that the most violent of declines may be straight ahead in Wave 3.


BKX, our proxy for market liquidity is sitting on the neckline of a Head & Shoulders formation that implies an approximate 25% decline, or greater.  A breakthrough at 118.70 appears to “pull the plug” on market liquidity.

ZeroHedge reports, “”Transitory” or not? That’s the question today as all eyes dives into the details behind the surge in Consumer Prices for signs that Powell’s plan is failing. BofA forecast headline and core CPI prints to come in hotter than expected (and they’ve nailed every print this year) and they were right again with a massive beat – Headline CPI rose 0.9% MoM (against expectations of +0.5%), the biggest MoM jump since June 2008. This sent YoY headline CPI soaring to +5.4%,”


TNX is trading on strength this morning and may be due for stronger moves in the next week or so.  This is especially ironic, since a 10-year auction was held yesterday.

ZeroHedge reports, “inety minutes after today’s first auction, when the Treasury sold $58 billion in a somewhat subpar sale, moments ago the Treasury followed up the 2nd coupon auction of the day when it sold $38 billion in benchmark 10Y paper in today’s 9-year 10-month reopening which also could have gone better.

The high yield of 1.371% – which stopped through the 1.374% when issued courtesy of a substantial concession throughout the day – was well below last month’s 1.497% and was in fact the lowest high yield for the tenor going back to February when it priced at 1.155%. However, the Fed’s hawkish pivot which spooked the bond market with traders fearing about the plunge in r* has pushed yields sharply lower in recent days and sure enough today’s 10Y auction yield was the lowest in 5 months.

Besides the dip in the high yield, the auction also saw the bid to cover slide to 2.39 from last month’s 2.58 and the lowest since April’s 2.36.”


USD futures leaped to a high of 92.71 this morning.  The Cycles Model suggests a strong follow-through for the next week or two.  A new Master Cycle high maybe due by the end of the month.


Posted in Published | Comments Off on July 13, 2021 – Earnings Season, Hit Or Miss?

July 12, 2021- The Trap Door Is Set

8:45 am

Good Morning!

DJIA futures made a morning low of 34548.00 after making its retracement high on Friday.  It has not broken above the May 10 high, which puts it in a very dangerous position.  Should the decline start here, it may be quite strong as it begins Wave 3.  The DJIA is a destination for institutional money.  Retail investors are not buying the dip here.   But money flows are coming into the market…for the time being.

ZeroHedge observes, “Despite the hiccup last week, SPX has managed to print a new all time high. This last sell off lasted for less than a day, which is telling you a lot about the upside panic.

There are many reasons for the sell off last week, but we will leave that to pundits to debate.

What about flows?

Money market fund inflow since Jan 2019 stand at $1.707 trillion. Add to this the bonds inflow and what GS calls the “defensive buffer” equals some $3.2 trillion.”


SPX futures are narrowly lower as traders await the Fed, inflation and earnings season.  The new marginal all-time high on Friday came as a bit on a surprise, but it completes a 9-wave impulse.  Primary Wave [5] is 4 X Wave [1] at 4399.00,  so there is a possibility that the SPX may probe for the trading channel trendline.

ZeroHedge reports, “After hitting an all time high of 4,365 at the close on Friday, U.S. futures drifted lower to start the week as investors awaited the start of Q2 earnings season starting this week in order to gauge whether corporate profitability can support equity valuations. Treasury yields dropped, as an upsurge in new infections caused by the Delta coronavirus variant pushed some investors into the safety of bonds and capped commodity price gains on Monday. At 715am emini S&P futures were down 7.5pts or -0.17% to 4,352 , Dow Jones futures were down 150pts or down 0.42% and Nasdaq futures were up 30 pts or +0.20%.”


VIX futures rose to a morning high of 17.50.  Last Thursday’s breakout above the 50-day Moving Average may be our signal to accumulate VIX shares , futures or options.


TNX appears to be consolidating above the mid-Cycle support at 12.88.  The Cycles Model indicates a possible strong reaction to the news today that may indicate rising rates again.


Posted in Published | Comments Off on July 12, 2021- The Trap Door Is Set

July 9, 2021 – The Trap Door is Set

9:05 am

It’s been a couple of weeks since I last reported on the GSCI Ag Index and it is due for an update.  It now appears that GKX may stretch its correction at least through options expiration next week and possibly through mid-August as well.  It is currently resting on a Head & Shoulder neckline at 384.00 and may break down in response to liquidity flight from the markets. While the consequences in the Ag Index may not be as dire as in the stock indexes, it would pay to know the “lay of the land.”

A standard 61.8% retracement would decline to 336.80, which falls inside the Cycle boundaries.  However, this decline may be much stronger, so be warned.

We are already seeing food inflation at the retail shelves, called shrinkflation.  I have noticed at Kroger that they have stacks of the old, larger cereal boxes at the end of the aisles on sale while the new, smaller cereal boxes are on the shelves at a shrinkage of more than 10%.  Most shoppers won’t notice the difference.

ZeroHedge reports, “World food prices fell in June for the first in 12 months, offering some relief for consumers and easing inflationary pressures.

According to a new Food and Agriculture Organization of the United Nations (FAO) report, the FAO Food Price Index, which measures monthly changes for a basket of cereals, oilseeds, dairy products, meat, and sugar, dropped 2.5% in June, coming off a decade high, but still 33.9% higher than its level in the same month last year. The decline in the index was the first in 12 months.”

However, even higher prices due to supply and demand may be just around the corner.  ZeroHedge notes, “Kirk Hinz, a meteorologist with BAMWX, published an agriculture note Thursday which outlines “persisting rains” in some parts of the Southwest but “expanding dryness” in the north.

Hinz concentrates on the corn belt, which spans the Midwest. He said, “expanding drought into a crucial time of the year ahead of pollination.” This means that persistent dry conditions could affect pollination success – and if pollination is not successful this year because of drought and lack of water, then harvest yields this season could come under pressure.

“A lack of consistent rainfall across a big chunk of the US major corn production areas in the Midwest and northern Plains this year continues, with the expanding drought into a crucial time of the year ahead of pollination as well. Weather models have remained volatile recently in regards to how much of these major production areas will receive timely rainfall, but the trend recently has been to push previously forecast widespread nourishing rains further south that’s starting to be a growing concern (plus more heat building back in a mid-to-late month) ahead,” Hinz wrote. 

Here’s what happens to corn if pollination is unsuccessful. “


7:10 am

The Shanghai Composite Index made a new low this morning, setting off the Head & Shoulders formation (upper right).  This may be a short-term formation, but with long-term consequences.  It appears that it may also trigger the Cup with Handle formation while meeting the Head & shoulders target.

Chinese officials at the PBOC may be aware of the implications of this formation.  However, no amount of money can reverse a loss of confidence.

ZeroHedge reports, “Just two days after we said that “China Prepares To Cut Rates As Economy Stalls“, this morning China did just that when the PBOC announced it is cutting the Required Reserve Ratio by 0.5% for most banks, a move that will unleash about 1 trillion yuan ($154BN) of long-term liquidity into the economy and will be effective July 15.

The announcement reduces the amount of cash most banks must hold in reserve in order to boost lending to the economy as growth has sharply waned, and is expected to prop up China’s slowing economy, which as noted earlier this week saw its Caixin Service PMI drop to the lowest level since the covid crisis, badly missing expectations.


Liquidity may be boosted in China but it may be tightening here in the U.S., the largest market.  The BKX (proxy for liquidity) tested its Head & Shoulders neckline at 118.70 yesterday and bounced to 121.11, but closed only 104 ticks from triggering the formation.  Should it slip through at anytime today, the liquidity plug may be pulled for it and the stock market.   Next Wednesday may be the Master Cycle low for the BKX with 4 out of 6 momentum indicators at full strength next week.  The average Master Cycle low only needs 1-2 momentum indicators at strength.  This may be a doozy.


SPX futures ventured higher in the overnight market to 4336.88 early this morning after yesterday’s rout.  Dealer gamma is net positive, so it makes sense to keep the market in line for options expiration.  The net open interest in calls is positive from 4300.00 and up, with the largest number of net call contracts at 4325.00 (4269, to be exact).  Dealers walk a fine line to keep payouts on either side at a minimum, so pressure is on to close near 4300.00.

ZeroHedge reports, “After a mini-rout on Thursday which briefly pushed the S&P into negative-gamma territory below 4,300, European stocks and US equity futures rebounded on Friday as energy and banking shares rose from a sharp selloff that was triggered by growth worries and has put the indexes on track for their biggest weekly fall since mid-June. At 7:30 a.m. ET, Dow e-minis were up 216points, or 0.61%, S&P 500 e-minis were up 18.5 points, or 0.43%. Nasdaq e-minis were down 3.75 points, or 0.02% after a report that Joe Biden is taking aim at big tech by encouraging regulators to reinstate net-neutrality rules. The dollar weakened against a basket of major currencies.”


VIX futures declined beneath the 50-day Moving Average to 17.16 this morning and may be completing a corrective move.  Every effort is being made to “steer” the  market and the VIX applies the most leverage with the least outlay.  However, should the SPX close beneath 4300.00, the VIX may explode higher.


TNX futures rose to an overnight high of 13.48, opening the cash market at 13.38.  The new Master Cycle has nearly a month to go with its target near 19.71.  The short-term target is the 50-day Moving Average at 15.45.

ZeroHedge remarks, “While stocks have been a (mostly) one-way ticket higher, 2021 has been a rollercoaster for interest rates: after 10 year yields rose +83bps in Q1, they fell -27bps in Q2 and have started Q3 by already falling another -12bps.

So yesterday, when commenting on the latest violent move in yields lower which left a majority of rates traders (who have been blindsided by the move) dazed and confused, we quoted JPM’s rates strategist Jay Berry who said that “the 10+bps decline in 10-year yields since Friday morning seems outsized all considered” and added that 10-year Treasury yields was 25bps too low relative to model-implied fair value, a 3-standard deviation divergence, and the largest such deviation since the early fall 2020.”


USD futures appear to be consolidating in a narrow range.  There appears to be a 2-week correction just ahead.  The probable target may be the 50-day Moving Average at 90.88, a near-50% retracement.


Posted in Published | Comments Off on July 9, 2021 – The Trap Door is Set

July 8, 2021 – Testing The Void

2:15 pm

Here is the SPX chart with updates.  There is a new Head & Shoulders formation.  A bit lopsided, but a legitimate one.  Should it be triggered, we may se a decline beneath 4200.00.  There is yet another potential formation that may agree with “Point 6” to be discussed later.  The Cycles Model tells us the decline may become quite intense on Monday, throwing next week’s monthly options expiration into utter chaos.  The week following options expiration also shows a potentially intense decline into the end of the month.  Be prepared for some very large moves in both directions.

It does not appear that the smart money is waiting for 3:00 pm to sell.  They are probably front-running the mutual fund holders who cannot exit until the final half-hour.


1:15 pm

While the NDX has not yet crossed its Ending Diagonal trendline (see bottom entry) the NDX Hi-Low Index has plummeted  to -54.44 this morning before a slight recovery, but it remains beneath the opening price.  The signal occurs at 0.00, so we have a NDX sell signal from this indicator.  For those who want extra assurance, a plunge beneath the trendline at 14600.00 confirms this Hi-Lo signal.


1:05 pm

BKX tested the neckline of its Head & Shoulders formation at 118.70 this morning, but did not break through.  It is only a matter of time.  In the meantime, there are other indicators of shrinking liquidity.  Weaker banks are pulling in their lines of credit .  We may also see credit card companies lowering their lines as well.  The doors start slamming shut just as the need to answer margin calls arises.

ZeroHedge remarks, “Wells Fargo just announced that it’s shutting down all of its existing personal lines of credit – a popular product offered by the retail-focused Wall Street giant – a move that will likely infuriate legions of customers.

The revolving credit lines, which will be shut down in the coming weeks, typically allow users borrow $3K to $100K, were pitched as a way to consolidate higher-interest credit-card debt, pay for home renovations or avoid overdraft fees on checking accounts attached to the loan.

Customers have been given a 60-day notice that their accounts will be shuttered, and remaining balances will require regular minimum payments, according to the statement.

According to CNBC, it’s the latest “difficult decision” facing Wells CEO Charlie Scharf, who is being forced to make cutbacks to the banks’ business thanks to restrictions imposed by the Federal Reserve years ago as punishment for the bank’s criminal scandals like the now-infamous scandal whereby branch managers opened credit lines for customers without permission. a scandal that outraged the public.”


12:00 noon

SPX appears to be completing a 50% Fibonacci retracement (at 4325.14) while challenging gap resistance at 4321.07.  This may be “it” for the bounce.  If not already short, this may be an excellent entry point.

ZeroHedge remarks, “Stocks are trading just 1% below their all time high, yet judging by today’s open there was sheer capitulation panic.

There is a reason for that: as noted last week, the market breadth has been collapsing similar to what we observed last summer when a handful of market “generals” did all the heavy lifting. Well, as Bloomberg’s Ye Xie shows market breadth has only gone from bad to abysmal, with the number of S&P stocks above their 50DMA at just about 50%, a very tiny increase from the 47% on June 29 when the S&P hit its first of many consecutive all time highs.

Putting these numbers in context, Xie writes that “over the past three decades, there were only two periods when we saw this negative divergence (record stocks with breadth below 50): in 1998 and 1999.” Of note, the latter print took place just before the dot com bubble burst.”


9:45 am

Normally we would see a bounce at the trendline (which still may happen).  However, a further decline beneath Short-term support at 4282.31 confirms our sell signal.  This is one such signal that we may not wish to hesitate on.

ZeroHedge explains, “It’s already been a harrowing session for bulls who have forgotten what the color red looks like after 8 all time highs in the past 9 trading sessions, but it could get a whole lot worse because with spoos down 1.3% just under 4,300 as they rebounded from 4,280…

… as the VIX surges above 20…

And with the cash index set to open just  over the critical 4300 line, SpotGamma notes that this means that gamma levels will start near zero, which implies a larger 1% max move for today. But it is under 4300 where the gamma flip line rests (below 4300 a drop move become self-reinforcing), and so SpotGamma looks for a spike in volatility if that level is broken. To the upside 4330 remains major resistance, although it’s unlikely we will get there today. .”


9:40 am

The NYSE Hi-Lo Index gave a sell signal this morning, opening at 2.00 and last seen at 0.00.  That, combined with the VIX signal (above the 50-day Moving Average) gives us a clear go-ahead to pick our best entry in short positions.


7:45 am

As of yesterday’s close, the BKX (proxy for market liquidity) closed within four points of its Head & Shoulders neckline.  Once the neckline is crossed, this represents the potential removal of all new liquidity since the the year-end.  Breaking the Ending Diagonal trendline infers a complete retracement of the Diagonal.  There is yet another potential formation that suggests a decline to or beneath the March 2020 low.  The Cycles Model suggests this may happen by the end of August.

ZeroHedge observes that this agrees with the outlook of Zoltan Posar, “With the Fed’s overnight reverse repo facility hitting a record $992 billion on June 30 (a number which included a generous dose of quarter-end window dressing, having since shrank by about $200 billion)…

… earlier this week we reported that according to the now-institutionalized (following his extensive WSJ profile this past weekend) repo guru, Zoltan Pozsar, said that as part of the Fed’s ongoing reserve sterilization which was unleashed when the Fed hiked the repo facility rate to 0.05% or higher than most short-term bills, he expected that some $1.3 trillion in flows would shift away from bills and into the Fed’s RRP facility by the end of August.” (my emphasis)


SPX futures are currently testing Short-term support at 4280.27.   Normally, I would put an aggressive sell signal beneath this level.  However, by declining beneath the upper Diagonal trendline at 4300.00, SPX has effectively ended its throw-over and may now be in full reversal.

Tomorrow’s options expiration give the nod to the puts at 4295.00 and lower.  We may expect a bounce into the Max Pain zone between 4300.00 and 4325.00 to frustrate both the bulls and bears.  However, accidents may also happen to upend the apple cart in time for weekly options chaos.

ZeroHedge reports, “After S&P futures printed at new all time highs on 8 of the past 9 days, one can almost feel sorry for the euphoric bulls (and meme stock traders) who woke up this morning to headlines such as this:

  • *S&P 500 INDEX FUTURES RETREAT 1.5%
  • *NASDAQ FUTURES DROP 1.5%
  • *STOXX EUROPE 600 INDEX DROPS 1.5% TO SESSION LOW

And sure enough, just one day after it appears that nothing could stop markets from exploding to recorder highs day by day by day, on Thursday morning both the reflation and growth trades were a dumpster fire, with Dow e-minis plunging 475 points, or 1.37%. S&P 500 e-minis were down 58 points, or 1.34% and Nasdaq 100 e-minis were down 190 points, or 1.3%, the VIX jumped above 20 after trading at 14 just a few days earlier and 10Y yields dropped as low as 1.25%. Bitcoin tumbled back down to $32,000.”


VIX futures rose to 21.229 this morning, possibly testing the mid-Cycle resistance at 221.95.  However, it did cross the 50-day Moving Average at 18.03, effecting a buy signal in the VIX.  We await the open to check the levels of the NYSE Hi-Lo Index for a possible confirmation of the SPX sell signal across the board.


TNX futures hit 12.50 at 6:45 this morning, but has since bounced, opening at 12.78.  The mid-Cycle support/resistance is at 12,80, leaving the status of TNX in limbo for the time being.  However, today is day 282 in the Master Cycle, which hardly seems able to be stretched even more.  Fortunately, Elliott Wave guidelines suggest this Wave structure may still be valid, unless TNX declines beneath the top of Wave 1 at 11.87.  The target remains at 19.71 (or higher) by mid-September.

ZeroHedge remarks, “It was a long time ago since we woke up with VIX printing +25% in early morning trading. Summer is here, liquidity is shitty and the crowd is feeling a huge p/l pain as consensus trades continue puking as the recovery seems to have suddenly died.

The US 10 year yield continues falling, currently at 1.26%. The trend line is broken, we are approaching the 200 day moving average and RSI has not been this oversold since March 2020, but recall yields have a slight mean reverting aspect to consider.

The crowd remains confused. JPM writes today:

“The continuous rally in USTs continues to surprise both ourselves and our clients…”

Bill Blain at ZeroHedge asks, ““How many impossible things can you believe before breakfast?”

US 10-year bonds and US equity are in full rally mode. They show contradictory expectations for a stalled recovery and future strong growth! How can that be? Because the market is about what participants collectively think – and how markets think has been utterly changed by 12 years of monetary experimentation, repression, and distortion. We’ve got to change the way we think about markets.

…and sometime during a discussion on markets my chum, CIO of a very large family office, spotted something interesting:

  • The yield on the 10-year US Treasury Bond was exactly equal to the Dividend Yield on the S&P 500. Both were 1.34%.”


USD futures appear to consolidate yesterday’s Master Cycle high (day 259).  There may be a two-week correction back down to the 50-day Moving Average at 90.85 before moving higher.


The Shanghai Composite Index declined to its neckline at 3520.00 in the overnight session.  This threat of a breakdown has a potential knock-off effect on the NDX as you will see below.


NDX futures fell to an overnight low at 14544.62, just above the diagonal trendline.  There is no sell signal in the NDX yet.  However, any further weakness in the Shanghai Composite may  push the NDX into a sell signal as well.


Posted in Published | Comments Off on July 8, 2021 – Testing The Void