2:55 pm

SPX ran up to test the Cycle Top resistance at 4415.00 before pulling back. From a Cyclical point of view, the decline took 25.8 hours and the rally will have taken 25.8 hours should it stop now. Today is an appropriate day for a Master Cycle high.
The DJIA made a triple top at 35087.52 today after reaching 35090.01 on July 16 and 35091.56 on May 10. This may be the major reason that those in the know are selling. The new Master Cycle doesn’t end until August 25, which allows plenty of time for a major decline.
11:15 am
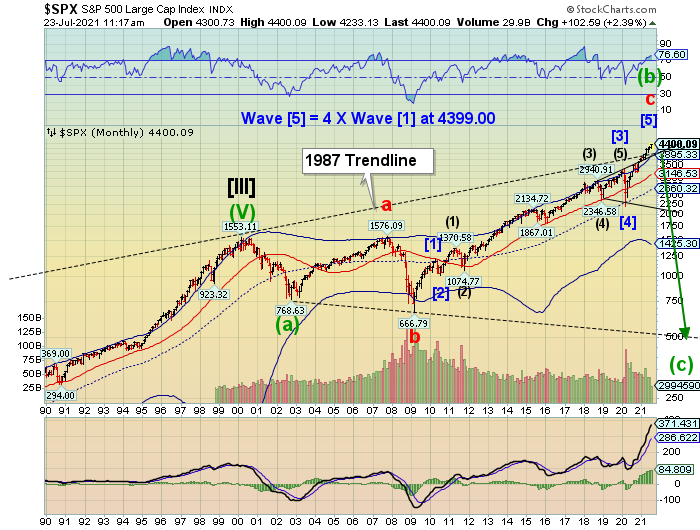
The last time I showed this chart was near July 10. It is simply unbelievable how this market has been stretched. This may be a good place for this rally to end.
ZeroHedge remarks, “One can’t say that Goldman’s clients have too much faith in Goldman’s trade recos.
As Goldman’s flow trader John Flood was urging clients on Monday “not to buy this dip“, they did just that and on Monday Goldman’s Prime Brokerage service observed a surge in hedge fund dip buying as the S&P tumbled as low as 4,220. Those same hedge funds, however, clearly unsure what happens next, then proceeded to dump the rally and on Tuesday the GS Prime book saw the largest 1-day net selling since June 17 (-2.2 SDs vs. the average daily net flow of the past year) and the biggest net selling in single names since Nov 2019, driven by long-and-short sales (1.6 to 1), as all regions were net sold led in $ terms by North America and DM Asia, and driven by long-and-short sales (2.5 to 1). This defensive positioning has continued through much of the post-Monday rally.
7:50 am

Good Morning!
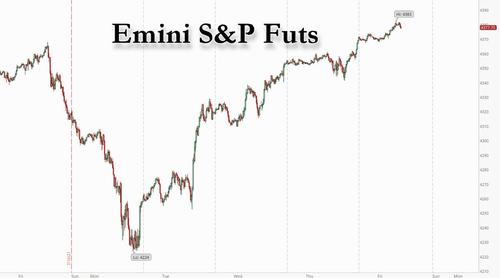
SPX futures topped out at 4380.88, but have backed down. The all-time high was 4382.62 on July 14. Should the decline continue, the slingshot move mentioned yesterday may still prevail. The alternate would be a new all-time high in the cash market, as well as the futures. The Cycles Model in futures runs paralell to, but not identical with the cash market.
The July 14 top marked on the chart occurred on day 247 of the Master Cycle. Today is day 256. Either the top is made in the next two days or a six-day selloff may begin to complete the Master Cycle.
ZeroHedge reports, “The V-shaped recovery has officially concluded, with eminis hitting 4,383 this morning, touching reaching their all time high from the second week of July (technically that was 4,384) as markets propel higher on earnings optimism despite mixed economic data and worries over Covid variant. At 7:30 a.m. ET, Dow e-minis were up 170 points, or 0.49% and S&P 500 e-minis were up 21.5 points, or 0.49%.
Nasdaq 100 e-minis were up 72 points, or 0.48%, trading above 15,000 points for the first time. Nasdaq futures hit a record high on Friday, helped by megacap technology stocks and strong earnings from social media companies Twitter and Snap, with investors eyeing business activity data later in the day.”

NDX futures reached an all-time high at 15015.50 before coming back beneath the prior futures high. The thought occurred to me that the dealers may be harvesting some gains in the futures this morning before pulling the plug in the cash market. We are that close to the drop-off. The cash high to overcome is 15002.20.
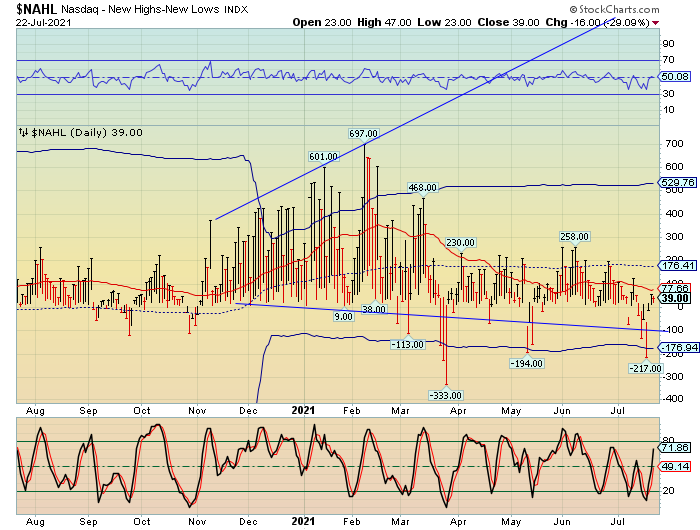
The NDX Hi-Lo Index closed at 39 yyesterday. While not below zero, this closing value shows extremely poor breadth while the NDX is attempting new all-time highs.
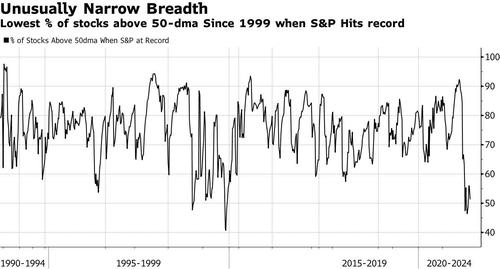
ZeroHedge reports, “Two weeks ago, when stocks suffered a modest airpocket, we pointed to something ominous: market breadth has been collapsing similar to what we observed last summer when a handful of market “generals” did all the heavy lifting. And as the following Bloomberg chart showed, market breadth had recently gone from bad to abysmal, with the number of S&P stocks above their 50DMA at just about 50%, a very tiny increase from the 47% on June 29 when the S&P hit its first of many consecutive all time highs.”
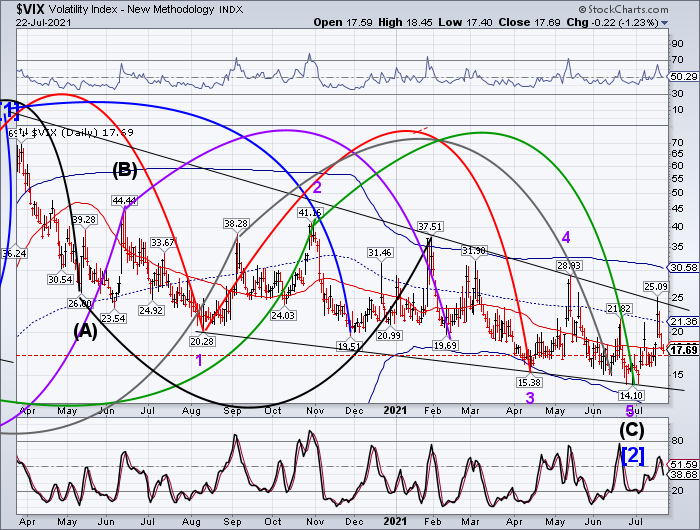
VIX futures hit a low at 16.92 this morning. Since VIX options have already expired on Wednesday it may be reasonable to assume that the VIX is being pressured to ignite a short squeeze in the SPX.
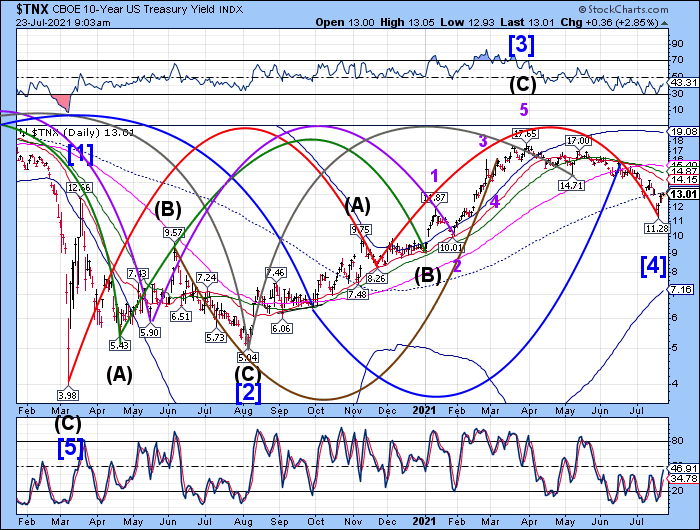
TNX appears to be testing the mid-Cycle resistance at 13.12. A breakout may send TNX to new highs over the next two weeks while UST tumbles.

