January 18, 2022

2:19 pm

SPX is making new lows.  Why isn’t VIX making new highs?  There may be several reasons.  First, the new lows in the SPX appear to be a Wave (b) expansion.  This would have a lesser effect on the VIX due to its corrective nature.  Second, tomorrow is the expiration for VIX monthly options.  VIX is still influenced by the shorts below 23.00.  Gamma turns positive at 25.00.  And third, VIX may be used by the dealers as a means of influencing the SPX, as in “Tail wags dog.”  Should SPX make a new high, the decline in stocks may accelerate.


1:59 pm

SPX made a new low, going deeply into short gamma territory.  It may have made an expanded correction and now must dig itself out of the hole.  To escape the short gamma, the minimum bounce must be above 4600.00.   The 38.2% Fib retracement would be 4638.02.  The 50% retracement is 4659.16 and the 61.8% Fib retracement would  be 4689.28.  Chances are that it may not cross the trendline at 4665.00.  This could be a fast bounce, but not fatal to the overall decline.  Should the bounce fail, we may see an oversold panic decline.


12:00  noon

Nomura Warns “Rates Vigilantes” Are At The Gates

ZeroHedge remarks, “Nomura’s Charlie McElligott began his note this morning with an ominous tone, warning that the Rates Vigilantes are at the gates and are now pushing through / above 4 hikes in ’22…
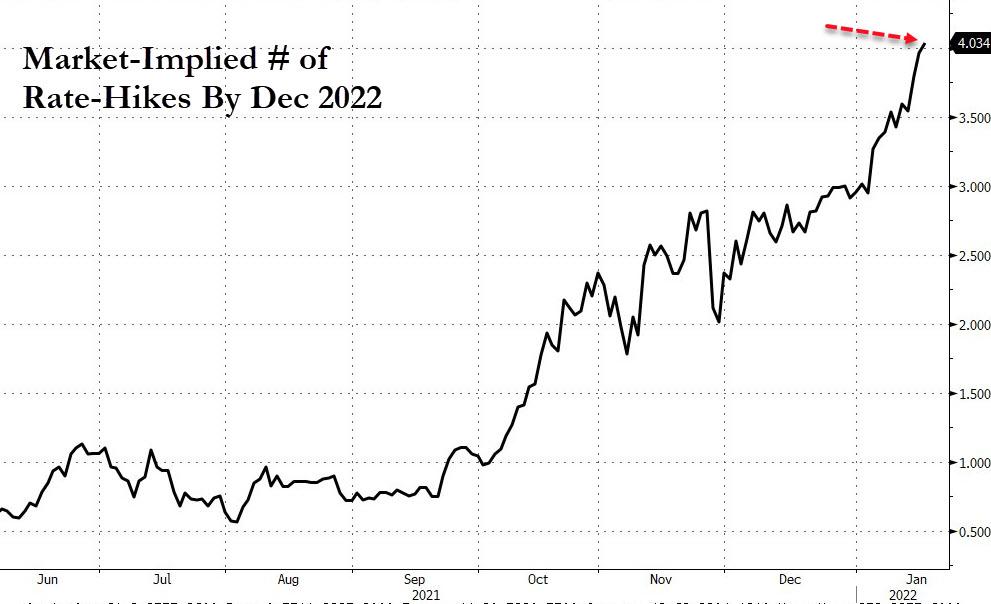
…(and with more “trending” to a 50bps hike out of the gate) – and with a chance now that IF the Eurodollar market were to go ahead and price a hike pushing towards a 50bps “rage liftoff” to start at the March meeting (I’m still paying little-to-no mind to talk of Jan)…
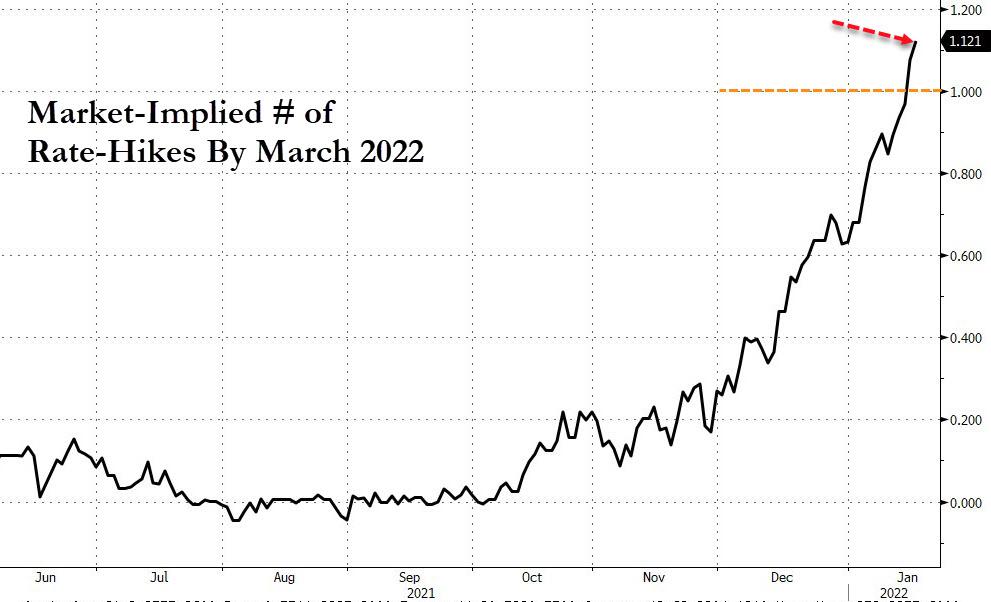
…the Fed will simply “have to” take what the market is dictating to them, despite me currently believing that the FOMC has little desire to do-so.”

(Ed: This is what I have been saying all along.)


11:50 am

BKX has challenged its Cycle Top this morning at 144.25.  Beneath that is a confirmed sell signal with the Cycles Model suggesting an almost continuous decline through the end of February.  Banks reporting losses and misses in their quarterly earnings confirm that liquidity is being drained from the market.

ZeroHedge reports, “One trading day after JPM reported disappointing earnings and its stock suffered the biggest post-earnings drop in a decade, moments ago Goldman joined it in the penalty box with its shares tumbling as much as 3.1% in premarket trading Tuesday after reporting worse-than-expected fourth-quarter trading revenue, even if overall revenue beat (Q4 revenue $12.6BN, Exp. $12.08BN), with EPS of $10.81 also coming in below expectations of $11.76. Total profit declined 13% to $3.94BN, even as revenues grew 8%. Still, this was a solid number in context: profit at JPMorgan fell 14% in the fourth quarter from a year earlier, while profit at Citigroup fell 26%.”


11:44 am

SPX bounced from its 100-day Moving Average at 4576.00.  It appears to be trapped below 4600.00 so the bounce may have ben shortened.  Short gamma is prevalent at this level, so be prepared for further weakness.

ZeroHedge remarks, “As Europe closes, US equity markets took a decided leg lower with Small Caps and Nasdaq leading the way but S&P and The Dow not escaping the selling pressure this time…

And this push lower sent the S&P to its 100DMA, The Dow broke below its 100DMA, Nasdaq surged below its 200DMA and Russell 2000 is searching for any support…”


11:05

TNX surged to a new high of 18.56 as ZeroHedge reports, “The New York Fed just issued a statement that is is rescheduling today’s planned Treasury Purchase due to “technical difficulties”:

Due to technical difficulties, today’s Treasury outright purchase operation – scheduled for 10:10 AM in the 4.5 to 7 year sector for up to $6.025 billion – is being rescheduled.

It is now scheduled to take place Wednesday, January 19, 2022 at 10:10 AM. Information on Treasury securities operations can be found on the New York Fed’s webpage.

This does not impact any other operations scheduled for today.”


10:15 am

SPX has completed a 5-Wave impulsive decline.  Now for the probable corrective bounce.  The 50% retracement value is 4668.00 while the 61.8% Fibonacci retracement is at 4687.00, just above the Wave (iv) high.  There is some indication that the bounce may fall short of those two targets.  Short gamma is very strong and may become irresistible beneath 4600.00.

ZeroHedge observes, “The market selloff into January rattled investors as concerns of “So Goes January, So Goes The Year” began to dampen expectations. Combined with a more aggressive stance from the Federal Reserve, rising inflation, and a reduction in liquidity, investor concerns seem to be well-founded.

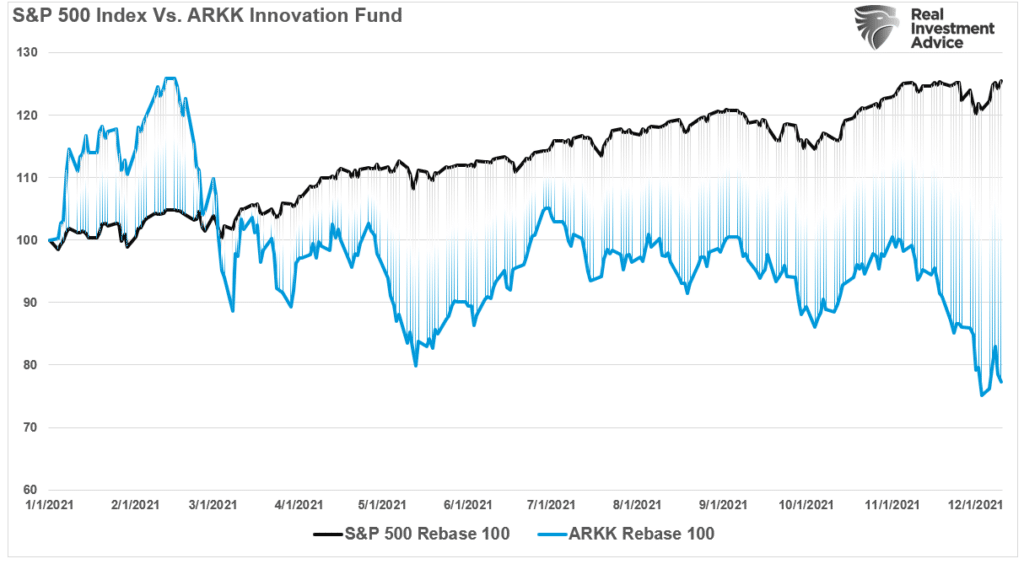
As discussed last week in “Passive ETFs Are Hiding A Bear Market,” the “blood bath” in the high-beta stocks is particularly humbling for the retail crowd that piled into risk with reckless abandon last year.

“Probably one of the best representations of the disparity between what you see ‘above’ and ‘below’ the surface is the ARKK Innovation Fund (ARKK). While the S&P 500 index was up roughly 27% in 2021, ARKK is down more than 20%. That is quite a performance differential but shows the disparity between the mega-cap companies and everyone else.”
 

7:40 am

Good Morning!

NDX futures made a morning low at 15284.40 as short gamma has its sway on stocks that could only thrive in a low interest environment.  The dominoes are falling while NDX may have another 8 days of decline in a 21.5 day crash.  The NDX Hi-Lo Index fell to -600.00 on Friday, setting the tone for this morning’s bloodbath.


SPX futures fell to 4599.20 this morning, testing last Monday’s low and the 100-day Moving Average at 4575.14.  Today’s options are positive above 4685.00 and gamma turns long at 4700.00.  Today’s cumulative options expiration remains short at 4625.00 and gamma goes short beneath 4600.00 which may stat a chain reaction among the dealers who must match up their books with investors/speculators who are increasingly bearish in options.  SPX has 8 days left of a potential 17.2 day decline in the current Master Cycle.  On Friday the NYSE Hi-Lo Index fell to -98.00.

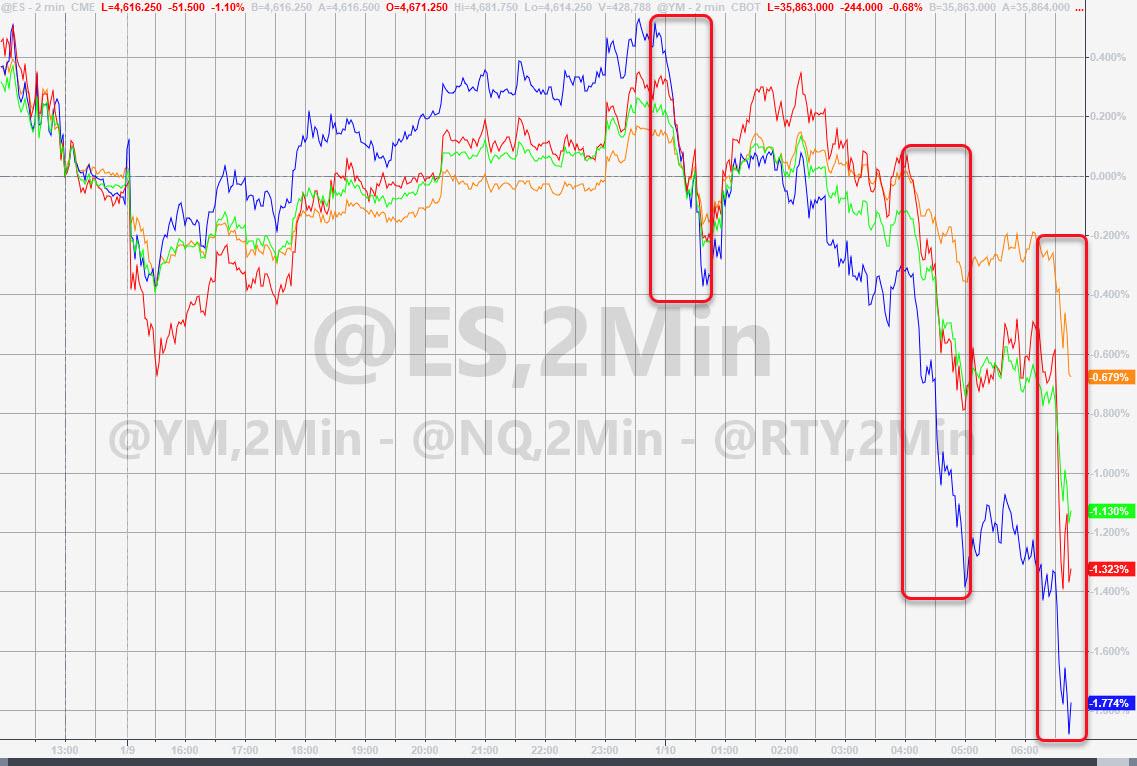
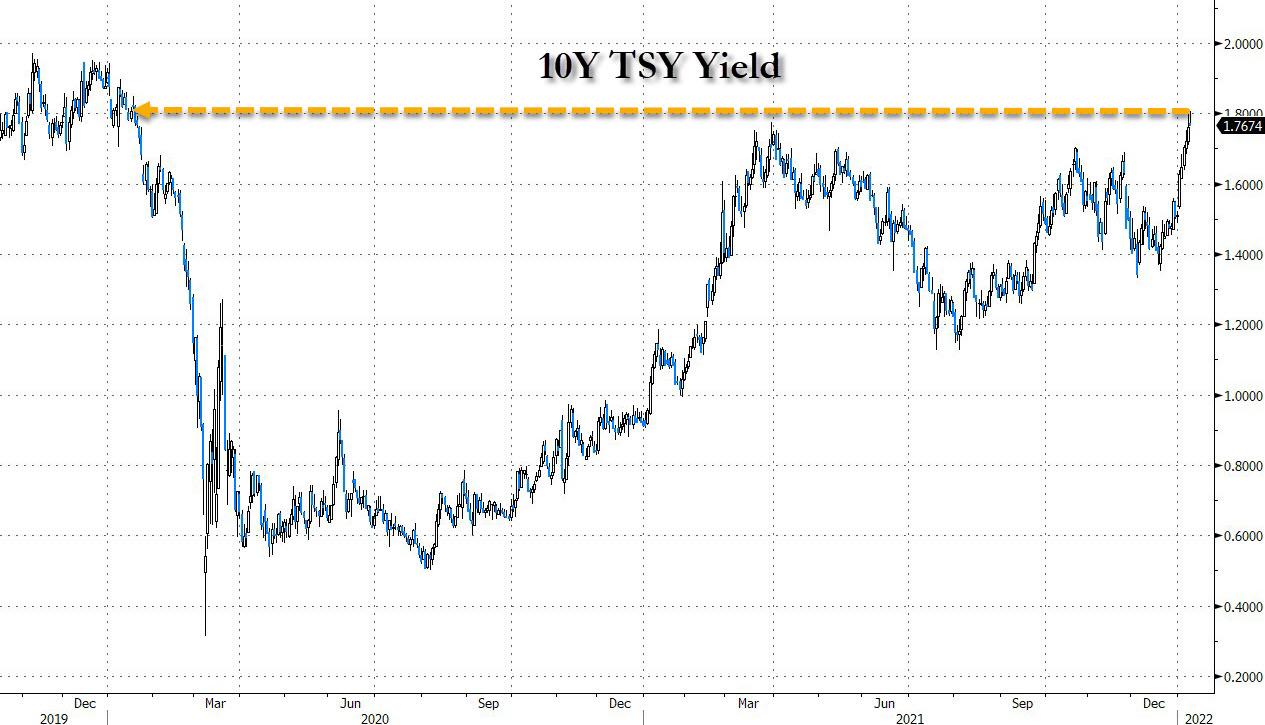
ZeroHedge reports, “Yesterday when US stock markets were closed but both bond and equity futures were trading, we pointed out that 10Y Treasury futures implied a yield of over 1.80%, a number which was the highest in years and which we warned would cause headaches for stock traders when the US reopened fully on Tuesday. And sure enough, with 10Y yields surging as high as 1.8536% overnight and 2Y yields jumping to 1.05% (up a whopping 15bps from 0.90% last Friday)…
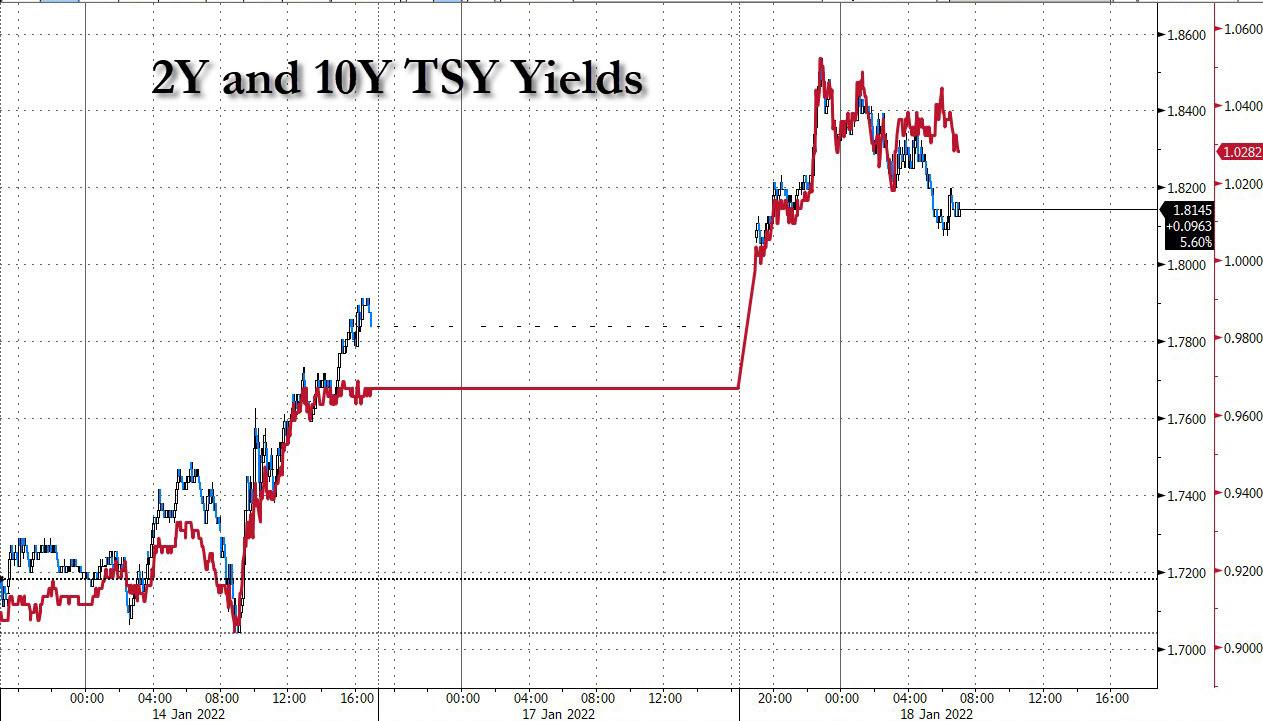
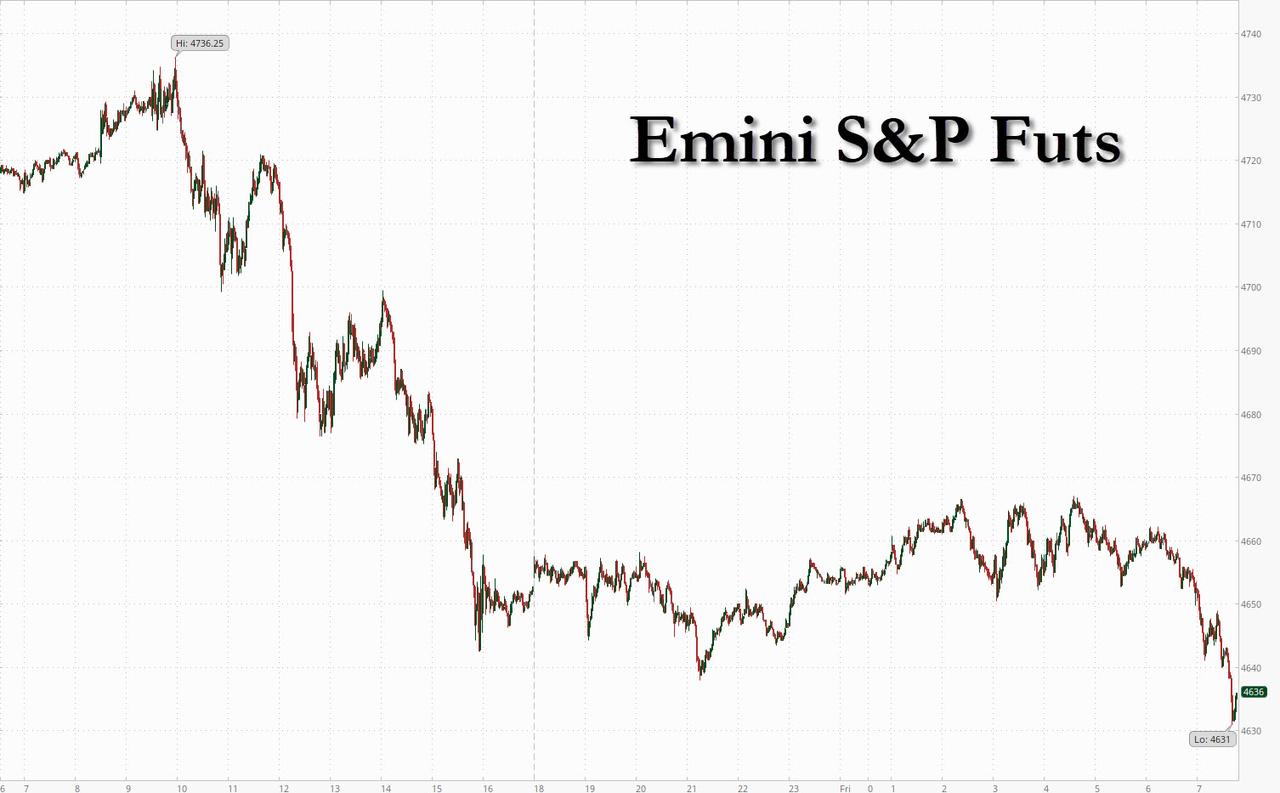
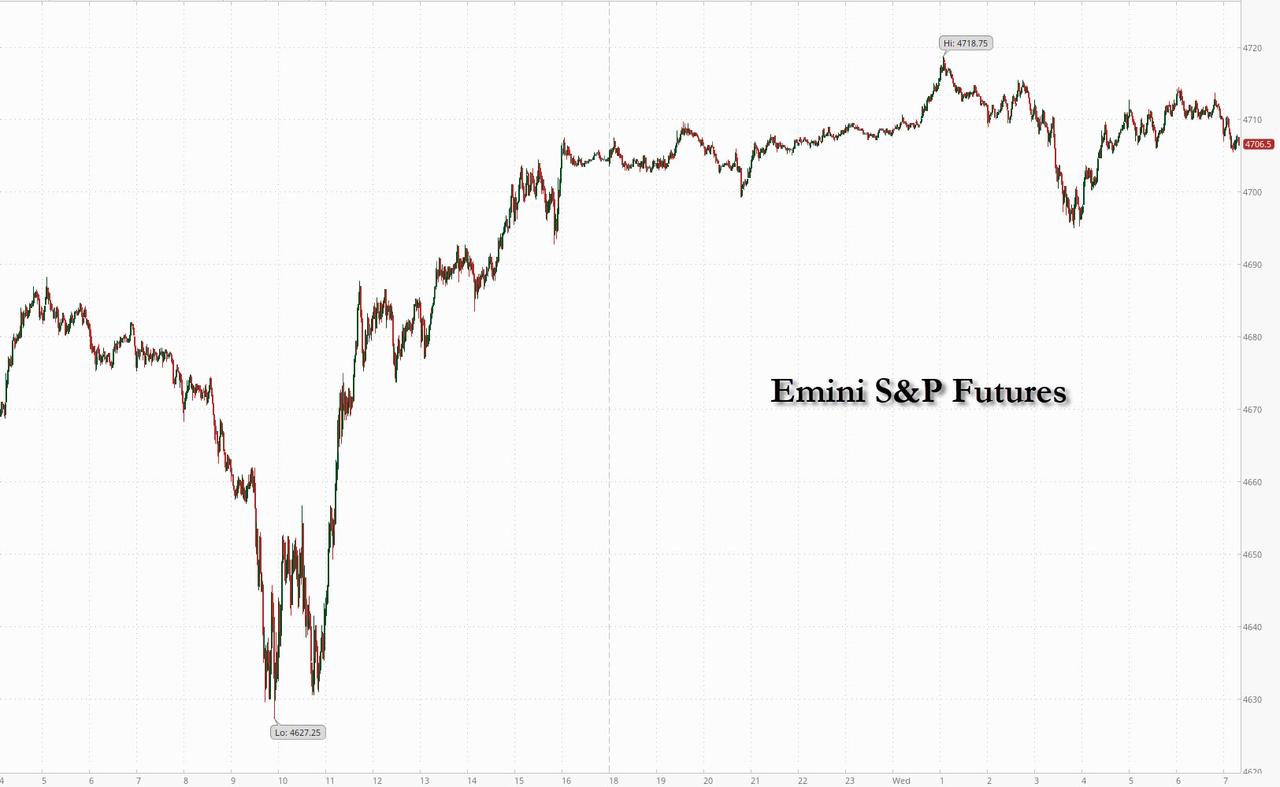
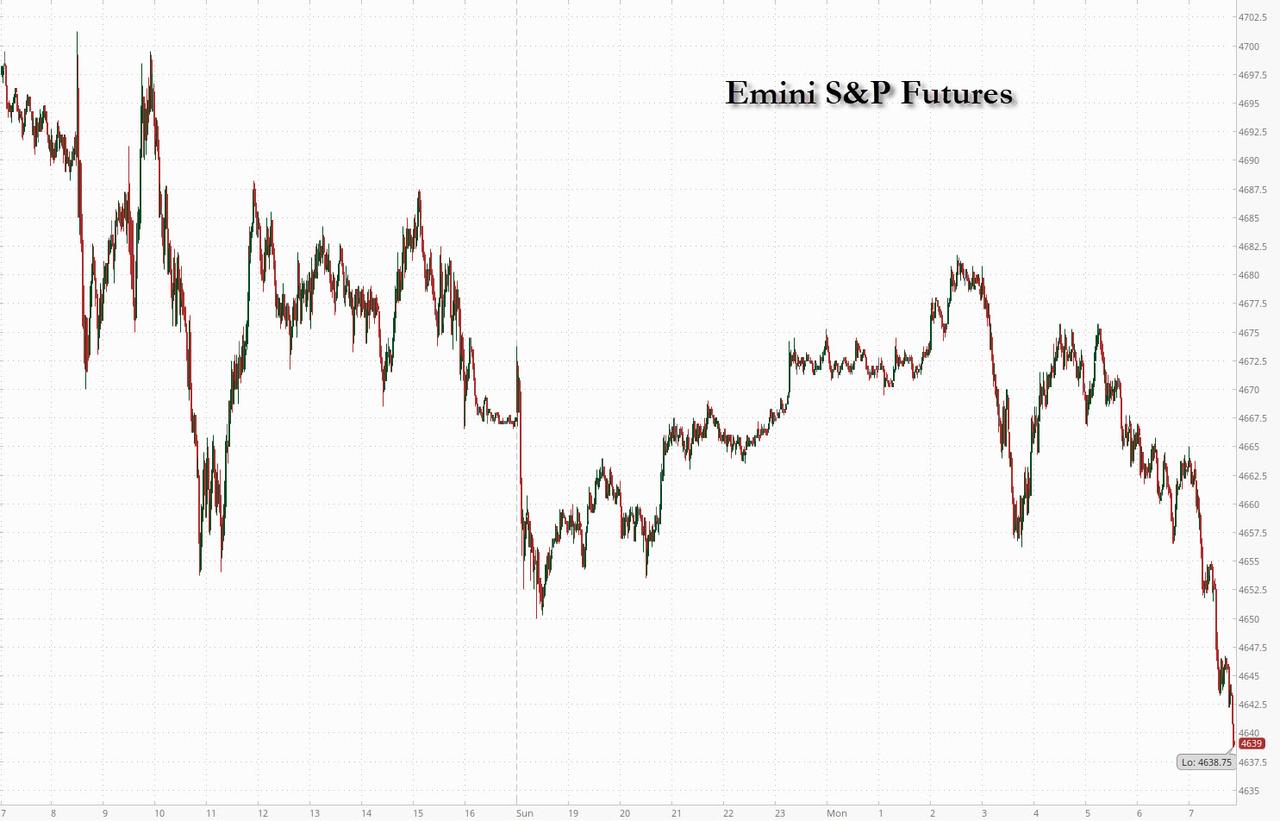
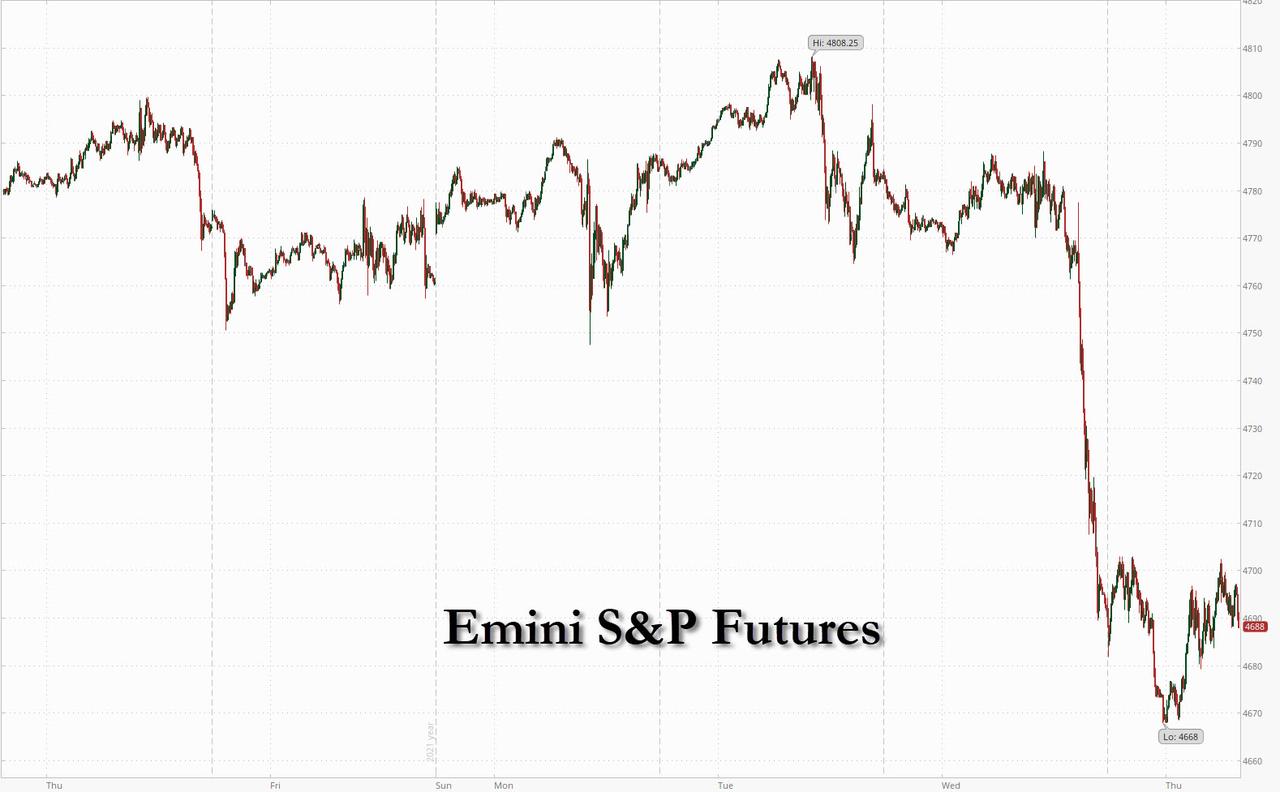
…. futures are getting hammered this morning, with emini S&P futures down 48 points or over 1% and just above 4,600, while Nasdaq futures were getting hammered again, sliding 1.62% or 254 points. The dollar rose and Brent oil touched $88/bbl, the highest price since 2014.”


VIX futures rose to a new high at 22.09 and is on a confirmed buy signal above the 50-day Moving Average at 19.95.  VIX is on the same Cycle as SPX, but inverse with 8 days left of the current Master Cycle.

ZeroHedge reports, ”

  • The Event: This Friday, January 21st, deep in the money calls worth billions of dollars are set to expire. Deep in the money calls are unique, because they are valued as being essentially equivalent to shares of stock (referred to as a Delta 1 position). Most of these calls were purchased in 2021 and have participated in the massive stock rally over the last year (S&P500 +24% since 1/1/21).
  • The Participants: We think these calls are held by a wide variety of players, from large hedge funds all way to wealthy individuals. For example, its well known that Nancy Pelosi favors purchasing long-dated call options. By purchasing large, long-dated call positions, investors gain levered exposure to higher stock prices, while limiting downside risk. Meaning, they can pay a premium to buy more upside through long-dated calls then they can get by buying shares of a company’s stock using the same amount of investment capital.
  • The Potential Impact: Regardless of these investor’s individual strategies, at SpotGamma, our models indicate that the net options delta set to expire on Friday, January 21st is over $125 billion.  Our base case is that the expiration of these deep in the money calls are a catalyst for volatility – that is expanded stock price movement higher or lower. The ability to assign a direction to this volatility is dependent on how one assumes these investors are positioned.
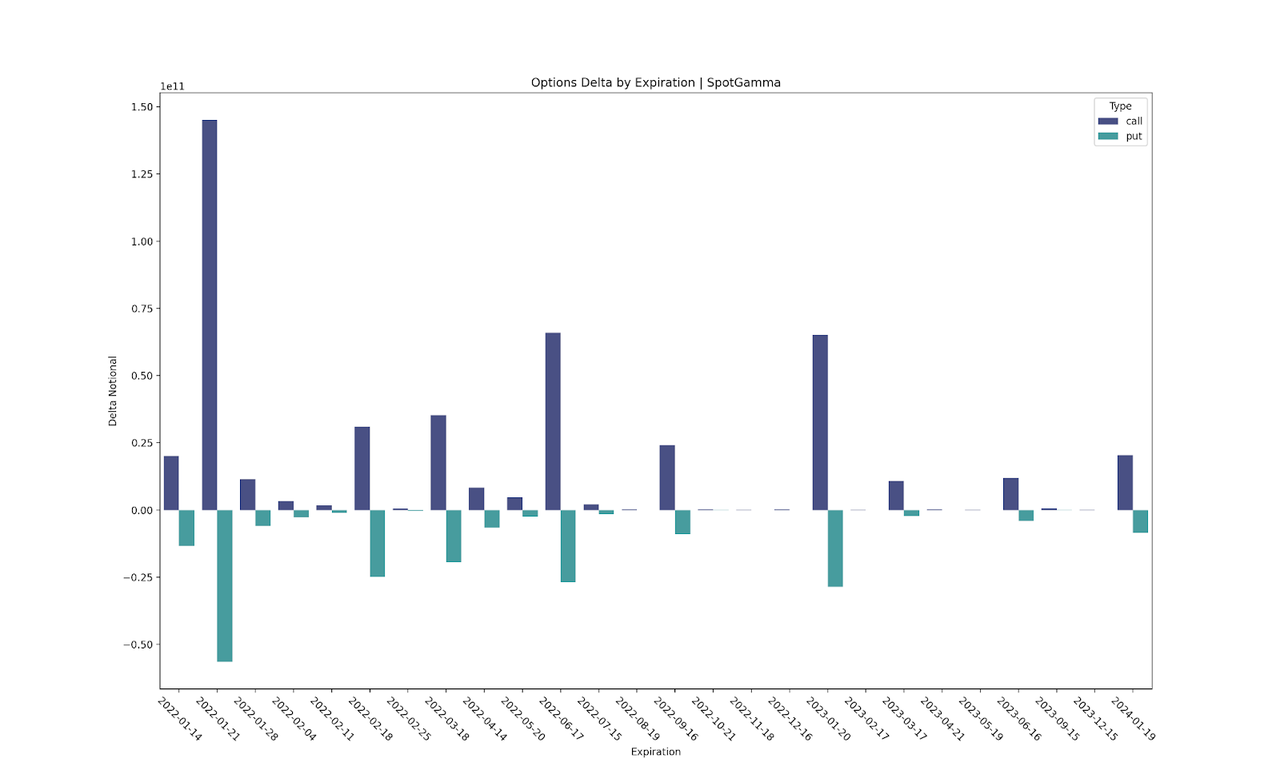
If the bulk of these call positions (which could vary on a ticker by ticker basis) are held long by investors, then our assumption is that there are options dealers who are short these calls. In turn the dealers likely hedge these short call positions through owning shares of the underlying stock, and/or offsetting long call options (aka long delta positions).

Conversely, if these investors are net short calls, then dealers would own long calls and may in turn short the underlying shares as a hedge.”


USD futures are climbing after having made their Master Cycle low on Thursday.  USD appears to be on the final surge of its corrective phase that may run to 98.30, the 61.8% retracement of the 2020 decline.


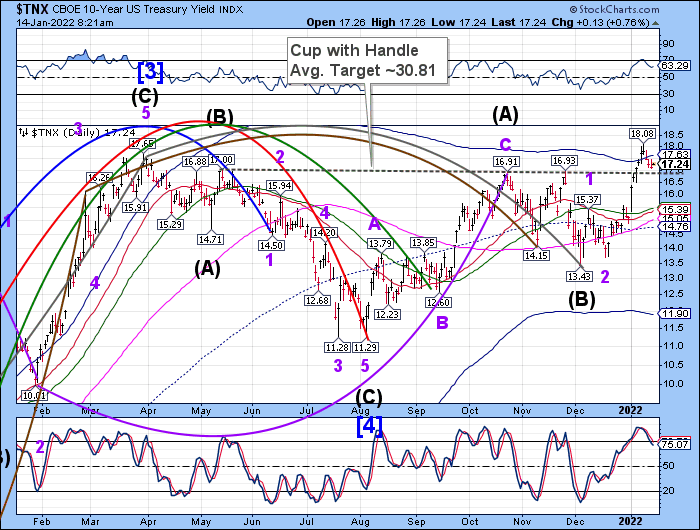
TNX gapped above the prior high as trending strength took hold this weekend.  This period of strength may last through the week with the current Maser Cycle set to last through the end of February.  Normally the interval between Cycles is 30 to 60 days.  This one is anticipated to go 86 days in varying degrees of strength.

ZeroHedge asks, “(Will) rates matter?

The short term gap between NASDAQ and the 10 year is rather wide here (again). If “they” start to care about rates properly, tech could be in for another round of beating…

Source: Refinitiv

GS: front end will shift higher

GS: “We think current market pricing is too low, and expect the front end of the curve to shift higher by the end of next year”.

Source: Goldman

Fed pricing still looks modest…

…when looking longer out. Nordea, who has been spot on the inflation/yields narrative, writes: “…we do see more room for such pricing to surface later this year and next and see higher bond yields also at the longer end of the curve.”


Posted in Published | 4 Comments

January 17, 2022 – Martin Luther King Day

7:30 am

Good Morning!

SPX futures are mildly positive this morning.  As of Friday’s low the SPX Cycle has gone 8.6 days from the January 11 peak at 4818.62.  It is now at a major crossroads.  The chart above shows the bullish view, showing the SPX rising to 4920.00 or higher by the end of the month in a Broadening Wedge formation.  Last week’s decline did not make a new low, raising the probability that this may be the outcome.

Tomorrow’s options expiration may guide us.  SPX options are negative beneath 4675.00 with negative gamma at 4625.00 and below.  Max Pain is at 4680.00.   Options turn positive abruptly at 4685.00 with positive gamma at 4700.00 and above.   The 50-day Moving Average is at 4679.65, which may be the demarcation guide for tomorrow’s outlook.


NDX futures remain flat this morning.  NDX also did not make a new low on Friday, although the options are clearly in negative territory beneath 16000.00.  Should NDX remain beneath the trendline at 15600.00 and make a new low tomorrow, it may pull the other indices substantially lower.  NDX appears to have made its Master Cycle low on January 10 (day 253).  This is out of sync with the SPX, which is ending its current Master Cycle next week.  However, the two indices appear to sync back up at the end of February.


TNX futures rose to 17.93, above the Cycle Top support/resistance at 17.64 and threatening the January 10 high.  Note that the NDX Master Cycle low occurred also on January 10.  Should we see a breakout in the next few days, the path for equities will become clear, as well.  Everything is interconnected.  Unfortunately, most analysts don’t see the whole picture.

ZeroHedge comments, “The Devil Is in the Details

The first two weeks of the year have reinforced the key message from our 2022 Strategy Outlook – the policy training wheels are indeed coming off, and fast! The hawkish shift in the minutes of the FOMC’s December meeting, reinforced by the rhetoric from a number of Fed officials, signals policy tightening through more hikes. They are coming sooner than expected, and the timeline between the first rate hike and the beginning of balance sheet runoff will be compressed. Our economists now expect the Fed to deliver four 25bp hikes this year, at its March, June, September,and December meetings, in addition to an August start for the balance sheet runoff announced last July. Market pricing already reflects this hawkish shift, with the March liftoff nearly fully priced in along with 3-4 hikes in the subsequent 12 months.


Posted in Published | Comments Off on January 17, 2022 – Martin Luther King Day

January 14, 2022

11:55 am

BKX has reversed back beneath the trendline after Yesterday’s Master Cycle high.  This constitutes a sell signal which may be confirmed once it declines beneath the Cycle Top support at 144.01.   The Citigroup’s earnings miss marks the top of this Cycle and ushers in reduced liquidity to the markets.

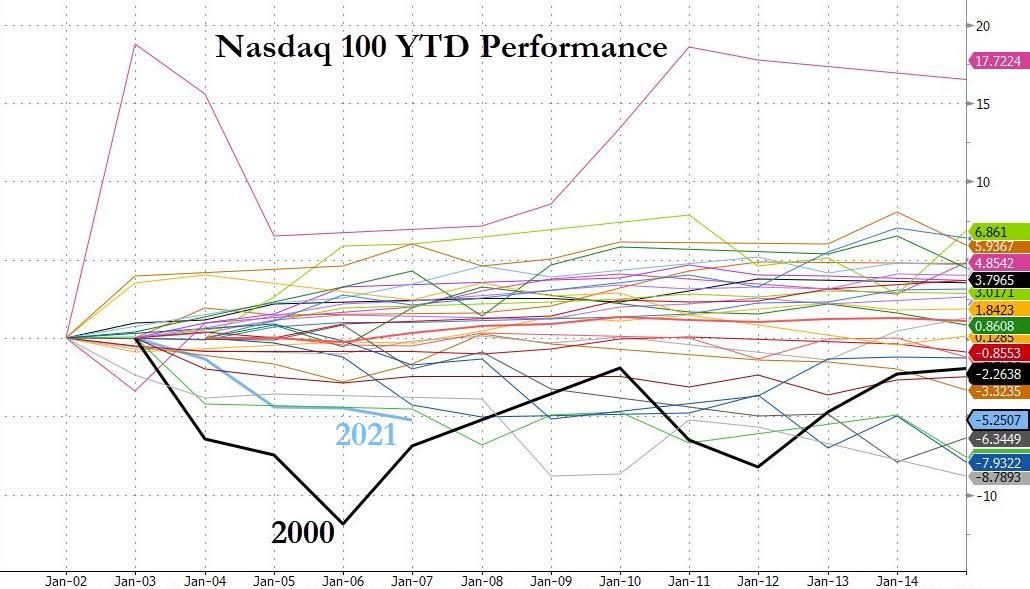
ZeroHedge remarks, “According to Doug Ramsey of the Leuthold Group, 334 companies trading on the New York Stock Exchange recently hit a 52-week low, more than double the amount that marked new one-year highs. That’s happened only three other times in history — all of them occurring in December 1999.

How did we get back to the precipice of the year 2000, where tech stocks plunged 80% and the S&P 500 lost 50% of its value over the ensuing two years? Well, start off with the fact that the amount of new money created by our central bank in the past 14 years is $8 trillion. That, by the way, is an increase in base money supply only and does not include all of the new money created by our debt-based monetary system. So, from 1913 to 2008, the Fed created $800 billion. And, it took from 2008 until today—just 14 years–for it to have created $8.8 trillion in base money supply. Is there really any wonder why inflation has now become a salient issue, especially for the middle and lower classes, and why the stock market is now set up for a meltdown similar to the NASDAQ collapse of two decades ago?”


7:45 am

Good Morning!

NDX futures have continued their decline overnight, slipping beneath the Ending Diagonal trendline and the 2-hour Cycle bottom at 15455.00.  Max Pain for today’s expiring options is at 15660.00.  It is deep in negative gamma territory and may lose control beneath 15500.00, near yesterday’s close.  At that point the decline may become self-reinforcing.  The NDX Hi-Lo Index closed at -318.00, showing investors heading for the exits.

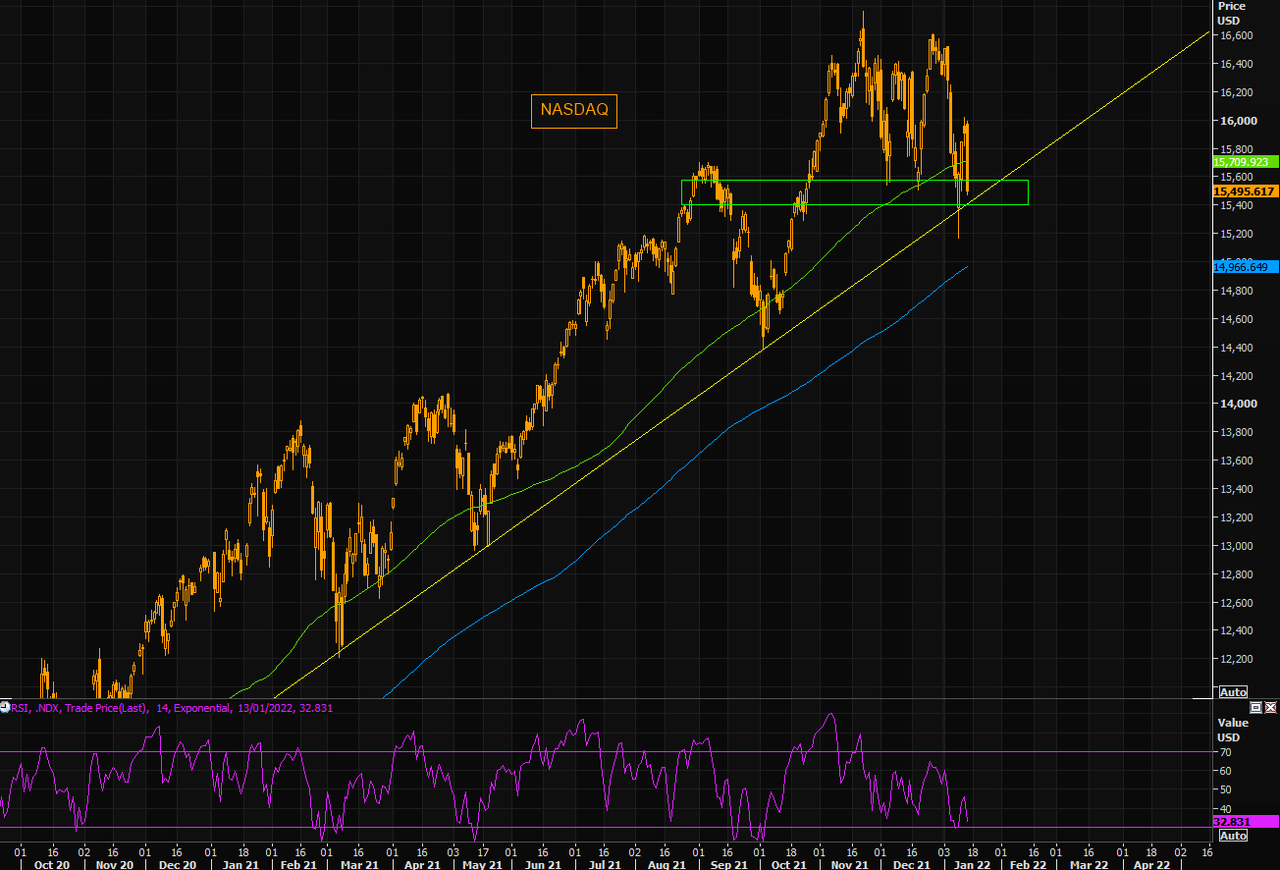
ZeroHedge remarks, “NASDAQ – back to very oversold, but…

NDX closed right in the big support “congestion” area. We closed below the 100 day moving average, but the longer term trend is still around these levels/slightly lower. 200 day is some 3% lower. RSI is oversold, but as we all know, oversold can stay oversold for longer time periods, especially when RSI “establishes” low levels (note RSI in February and September 2021). Big oscillations and a non trend remains the theme, but watch this closely should we close slightly lower…”

Source: Refinitiv


SPX futures have fallen beneath the 50-day Moving Average and the Ending Diagonal trendline at 4650.00 this morning.  It is on a confirmed sell signal with the potential of reaching 4000.00 by the end of the month.  It may go deeper.  The Ending diagonal target is its origin at the March 23, 2020 low at 2191.86 and may be complete by the end of February.


The NYSE Hi-Lo Index closed at 34, just above neutral territory at 30.00.  A sell signal is confirmed beneath the 50-day Moving Average at 7.36.

ZeroHedge reports, “fter trading flat for much of the overnight session, S&P futures slumped to session lows shortly after JPM reported earnings that disappointed the market (see our full write up here) and were last trading down 30 points or 0.64%, with Dow futures down 0.3% and Nasdaq futures taking on even more water as the “sell tech” trade was back with a bang. Treasury yields rose 3bps to 1.74% and the dollar reversed an overnight loss. The VIX jumped above 20 and was last seen around 21.

The Nasdaq 100 fell to the lowest in almost three months yesterday as tech came under pressure after Fed Governor Lael Brainard said officials could boost rates as early as March. It looks like the selling will continue today.”


VIX futures made a new high this morning at 21.82.  It is on a confirmed buy (SPX sell) signal.  An unofficial calculation shows the VIX may rise above 100.00 this month.  There may be two more weeks of rally in this Wave 3.


TNX may have launched its next surge higher as a triple dose of trending strength may have taken hold today.  That period of strength may last until the end of the month.    However, the top of this Cycle may continue to the end of February.


Posted in Published | Comments Off on January 14, 2022

January 13, 2022

11:21 am

NDX has made its reversal after the bounce fell short of the 61.8% retracement at 16056.00 and the 50-day Moving Average at 16087.68.  The opportunity to short the NDX is now.  SPX will follow.


10:05 am

BKX may be the answer to the conundrum of the sinking US Dollar.  It appears that money is still flowing into the financial system, evidenced by the rise in bank stocks, the first entities to benefit from money flows.  Today is day 267 of the the current Master Cycle.  It is not remarkably late yet, but is having a negative influence on Treasuries and the USD.


7:30 am

Good Morning!

SPX futures are holding steady near the options Max Pain zone at 4720.00.  Options turn negative at 4700.00, while gamma goes negative at 4675.00.   It is quite alarming to see how much the options market dominates the SPX.   Monday morning’s low was due to Friday’s bearish puts being settled, but SPX quickly recovered to minimize the options pain (to the dealers) by the close of the day.  Max Pain is the point where options speculators in both puts and calls get paid the least.  Dealers may still be licking their wounds to the wallet that the last decline produced.  The NYSE Hi-Lo closed at 64.00 yesterday.

The Cycles Model suggests a turn lower into the last week of January.  The probable decline may target the Cycle Bottom at 4063.47, or possibly lower.  Point 6 may be reserved for the end of February.

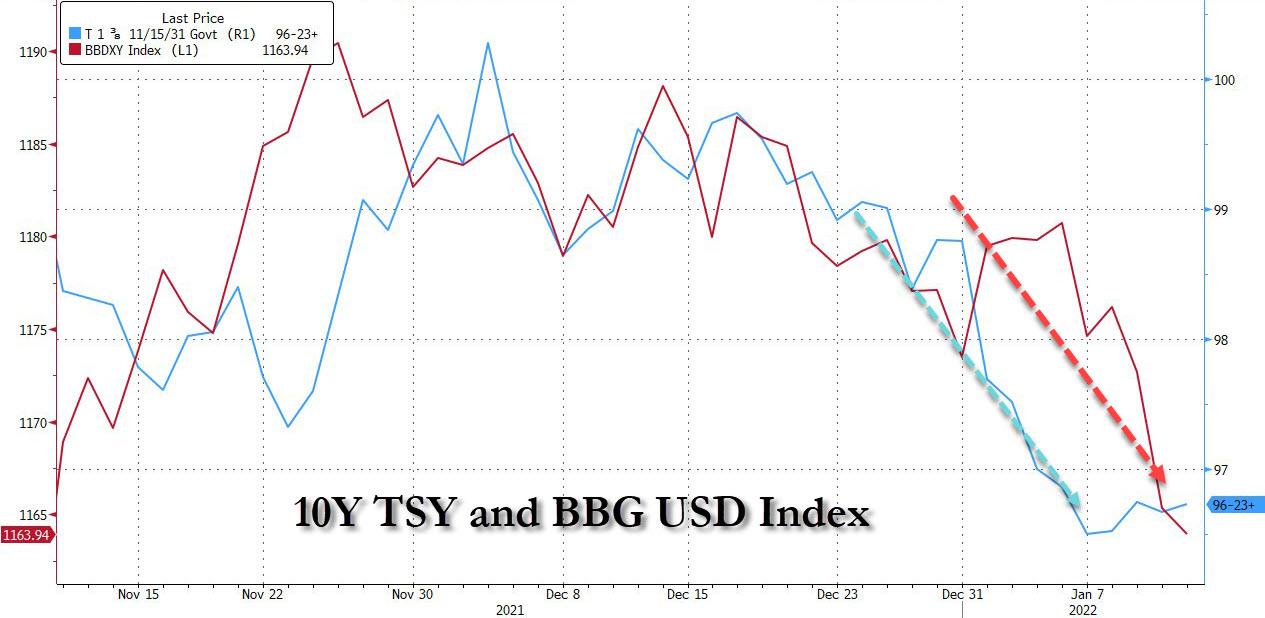
ZeroHedge reports, “US futures were little changed on Thursday one day after the highest CPI print since 1982 and just minutes before another red hot PPI print is expected (9.8%, up from 9.6%), as investors tried to gauge the timing and pace of monetary tightening. S&P 500, Dow and Nasdaq 100 futures were up 0.1% as investors waited for the next trading signal. 10Y yields were flat around 1.74%, and the dollar edged lower as a growing tide of investors bet the world’s reserve currency has reached a peak with rate hikes largely priced-in to the market with Fed tightening likely to lead to an economic slowdown.”


VIX futures rose this morning after an overnight low of 17.85.  Yesterday it made an 81.7% retracement, far more than the normal 67% retracement to the mid-Cycle support at 18.62.  It may be that the bounce has excited speculators betting on a further decline in the VIX since at the 18.00 strike there are 214,715 put contracts against 9,497 open interest call contracts for next Wednesday’s options expiration.    Max Pain for these speculators is 23.00.


NDX futures are rising modestly after the NDX closed positive gamma yesterday.  Tomorrow’s option expirations are positive above 15770.00.  A decline beneath the trendline at 15600.00 (Max Pain) would reinvigorate the bears.  It is interesting how trendlines and Moving Averages influence the investing crowd.  I think it is unintentional.


TNX paused near its likely Trading Cycle low made yesterday, due to pre-auction short covering.  The Cycles Model indicates that trending strength may come back with a vengeance over the next week.

ZeroHedge remarks, “Ahead of today’s 10Y auction, some rates pundits speculated that the auction would be another blockbuster affair like yesterday’s 3Y if for no other reason than the special, -0.1%  rate 10Y notes earned in the repo market suggesting the short overhang is once again extensive and there would be a short covering during the actual auction.

And while that may have been the case before today’s session, the sharp drop in yields across the curve as inflation fears faded after today’s CPI print, meant that it would be virtually impossible to get a non-tailing auction and sure enough, moments ago the Treasury completed the sale of $36BN in the 9-year 10-month reopening of cusip CDJ7, which priced at 1.723%, tailing the When Issued 1.720% by 0.3bps, making this the third consecutive tailing 10Y auction following the end of 6 consecutive stop throughs. The yield was just over 20bps higher than the 1.518% from December 2021 and also the highest since Jan 2020.”


USD futures are lingering near their overnight low at 94.65.  Granted, the USD may pull back as far at the mid-Cycle support at 93.19.  However, it has stretched the Master Cycle to 288 days, a month beyond the mean.  It could mean that investors have been frightened by the high CPI and PPI.  Or it could be a major institution is acting to keep confidence up.  We’ll know more soon.

ZeroHedge remarks, “Sometimes, financial-market discourse may sound as if Formula One commentators had suddenly switched over to a marathon, where getting overexcited about the first lap may say nothing about what the eventual result might be.

In the first few days of the year, as Treasuries slumped, analysts were wondering whether to tear up their calls for their year-end 10-year yield forecasts. Now, it’s the turn of the dollar — hard as it may to believe, we are just into the second working week of the new year.

In truth, fundamental judgments on none of the assets are passed every single day. Sometimes, there is a lot of noise, but no real signal, and it happens especially around the start of the year as flows move across seamless financial borders with greater velocity. Indeed, it does feel that way: real-rate differentials have hardly moved one way or the other since the start of the year, meaning capital flows may be the reason why we are seeing what we are.”


Posted in Published | 1 Comment

January 12, 2020

8:05 am

Good Morning!

NDX futures hit an overnight high of 15908.80, just above the Fibonacci 50% retracement level at 15886.35.  While I had thought that the 22-month trendline might be the stopper for this rally, and the retracement appeared complete, the powers-that-be had their own plans to raise the NDX to the Max Pain zone at 15850.00.  However, today’s options gamma turns positive at 15875.00 and especially so at 15900.00.  The Cycles are primed for a turn this morning.  That would give the NDX 8.6 days of decline and less than two days of a bounce.  The Cycles Model calls for a probable decline through the week of January 24, a possible 10.45 to 12.9 days of further decline.

The NDX Hi-Lo closed at -127.00 yesterday, still negative despite the impressive rally.

ZeroHedge observes, “Prices should continue to be unstable.

That’s the message from many in the market as while talking-heads want to proclaim yesterday as a fundamentally-driven buying spree confirming how ‘cheap’ hyper-growth has become, SpotGamma points out that is was actually a “short cover rally” fueled by delta (puts closed/rolled) and vanna (implied volatility crush).

Additionally, SpotGamma’s models continue to suggest high volatility until the 4700 strike is recovered – and it is not until 4800 that we would see significant dealer based support.”


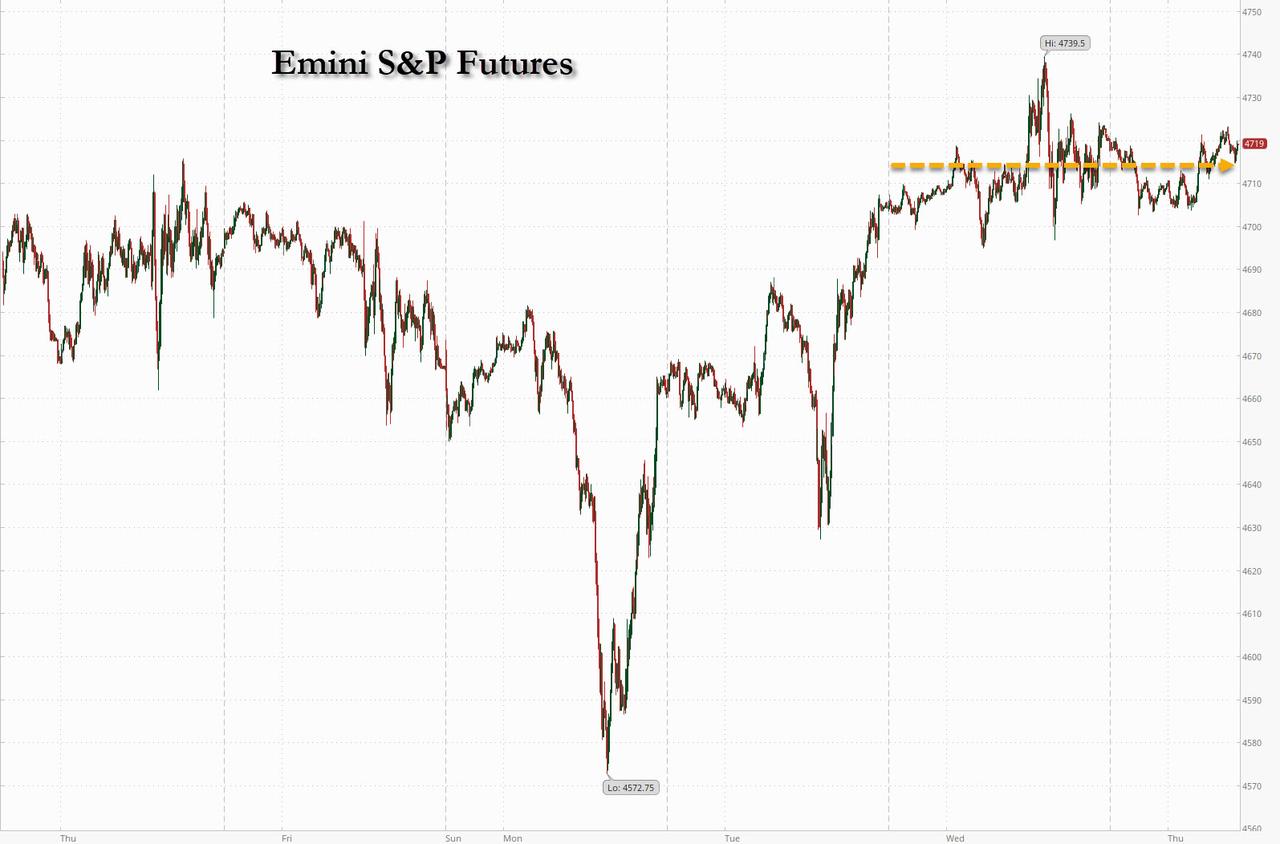
SPX futures rose to an overnight high of 4739.00, just beyond the 61.8% retracement value at 4728.42.  Today’s options expiration Max Pain zone is near 4700.00. While positive above that, gamma remains neutral to 4800.00.  Another Cyclical pivot may be reached this morning that may turn equities back down.  The NYSE Hi-Lo Index closed at 39.00 yesterday, above the 50-day Moving Average at 12.40.

ZeroHedge reports, “U.S. index futures were little changed, if slightly in the green on Wednesday as investors settled into a wait-and-see mode ahead of today’s “brutal” CPI report which is expected to show the highest CPI print in nearly 40 years, a time when the fed funds rate was 11% compared to 0% now…

… and gauge the pace of Federal Reserve tightening. Consensus expects December CPI to show inflation climbing to 7.0%, a result which could see front- end fully price in a March rate hike (currently priced at 85%). Helping the overnight mood in Asia, was a moderation in China’s inflation pressures, with CPI dipping to 10.3% y/y in December, giving the central bank scope to cut interest rates to cushion the economy’s downturn just as most major nations look to tighten policy. At 730am ET, S&P futures were up 0.2% of 7.50, and Nasdaq futures rose 22 points or 0.14%, recovering toward Asia’s best levels; Dow futures were up about 0.1%. The dollar was slightly lower, extending on its recent sharp drop, while Treasury yields were steady.”


VIX futures rose to 18.69 in the overnight session, still beneath the 50-day Moving Average at 19.75.  VIX has made a 73% retracement and may be poised for a lift-off.

TickerTape observes, “Markets crash. And when they do, it can be fast. So, it’s a good idea to study the Cboe Volatility Index—or more affectionately, the VIX—to help you guess when that next market sell-off might happen.

Often, the VIX is inversely correlated with the S&P 500 Index (SPX). When the SPX goes up, the VIX typically goes down. But there’s more to the VIX than this relationship. In addition to it being the market’s “fear gauge”—investors tend to be more fearful when market volatility (vol) is high, and less so when vol is low—the VIX measures the market’s expectation of future volatility implied by SPX options prices.”


TNX has pulled back beneath the Cycle Top and may test the Lip of the Cup with Handle at 16.93 this morning.  However, it may be running out of time, as the CPI has already been announced.  Be prepared for a blast-of ot Trending strength that may last up to two weeks.

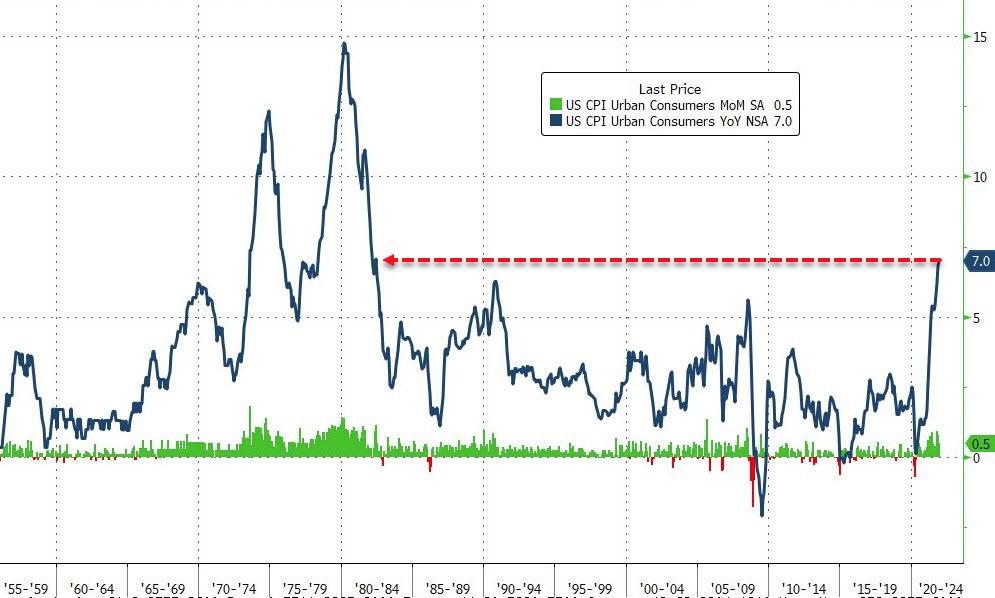
ZeroHedge reports, “Consensus was convinced – with barely any outliers – that this morning’s consumer price index would print with an astonishing 7.0% YoY (and notably 7 of the last 9 releases have come in above consensus) and they nailed it with the 7% print at its highest since June 1982 (when ET was launched in the US)…

Source: Bloomberg

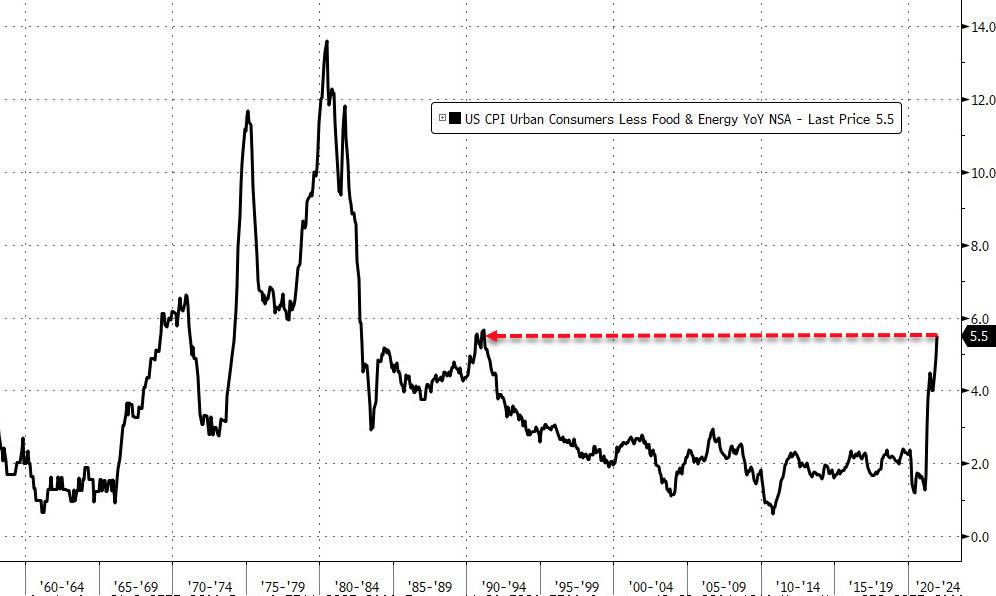
That is the 19th straight monthly rise in headline CPI and Core CPI also surged to its highest since Feb 1991 (printing hotter than expected at +5.5% YoY)…”

ZeroHedge observes, “What do you get when you tae half a portion of excess GDP growth this year over trend expansion, together with half a portion of excess inflation over its long-term trend and combine them with the neutral rate of the economy?

You get a Fed funds rate of 4.15%, that’s what. At least, that’s according to the recipe that John Taylor at Stanford University came up with before the turn of the century. Taylor himself agrees. The Fed is “way behind” the curve, and depending on the assumptions made, the federal funds rate should be anywhere from 3% to 6%, not the near-0% now targeted by the central bank, he remarked at this year’s annual meeting of the American Economic Association.”


USD futures made an new overnight low of 95.23 but may be poised for a bounce higher.  Trending strength comes back early next week and may last through the first week of February.


Posted in Published | Comments Off on January 12, 2020

January 11, 2022

7:30 am

NDX futures continued to rise after closing but peaked at 15745.90 at 5:30 pm as options were settled.  The Max Pain zone for Wednesday is 15650.00 while gamma turns positive at 15700.00.  However, at its peak retracement, NDX only retraced 40.8% of its decline.  The NDX is pivoting on 5-day Cycles (34.4 hours) and may reach its second Cyclical pivot this morning in the cash market.


The NDX Hi-Lo Index shows the internal weakness as the negative close merely shows the bounce was due to short covering in stocks that are already deeply in the red. This is not a sign of recovery, since new 52-week lows were being made.


SPX futures bounced to a retracement high of 4697.10, jut shy of the 50% Fibonacci retracement value at 4699.35 after closing at the 38.2% Fib value at 4671.28 on Monday.  It was also able to neutralize the lion’s share of Monday’s negative gamma starting at 4700.00.  It peaked 5 days later than the NDX, but now shares the second 5-day (34.4 hour) Cycle due to end this morning.  The Cycles Model calls for a Master Cycle pivot (low) on or around January 28.

ZeroHedge reports, “After yesterday’s miraculous tech recovery which saw gigacaps drop as much as 4% before recovering all losses and closing green, Nasdaq futures led gains among U.S. stock-index futures, hinting at further relief for technology stocks as Treasury yields retreated in early trading but have since steadied around 1.75%, unchanged from Monday. Nasdaq futures rose as much as 0.7%, while S&P 500 and Dow Jones contracts were also higher by about 0.4% ahead of Powell’s Senate confirmation hearing for second term as Fed chair which begins at 10am and where the Fed chair is expected to put on a dovish mask and walk back some of the recent hawkish commentary.

Dip-buyers rescued the Nasdaq from a fifth session of declines on Monday after Marko Kolanovic urged JPM clients to buy the dip, writing that yields aren’t too high and the Fed’s won’t derail the economy’s rebound. “We view the recent equity volatility as an adjustment to the Fed’s incrementally more hawkish stance, rather than a sign that the Fed is about to bring the recovery and the equity rally abruptly to an end,” Mark Haefele, chief investment officer at UBS Global Wealth Management, said in a note. “We now expect three Fed rate hikes this year, starting as soon as March.”


The NYS Hi-Lo Index fell while the SPX bounced, showing that short covering was the greater (maybe the only) impetus to the bounce.


TNX futures pulled back to 17.37 early this morning, challenging the Cycle Top support at 17.55.  It may pull back as far as the Lip of the Cup with Handle at 16.93, but a triple dose of strength is due for the remainder of the week and may last about two weeks.  Be prepared for some fireworks to come out of the Fed meeting tomorrow.  In the meantime, pundits are downplaying the rate hikes.

ZeroHedge opines, ” The Fed FOMC minutes came out last week, signaling tighter monetary policy. Peter Schiff talked about the minutes in his podcast, arguing that the Fed can’t do what it says it’s going to do. If it does, it will crash the markets and the economy. And it won’t lower inflation.

The Fed minutes were widely viewed as even more hawkish than the messaging coming out of the December meeting. Peter said the minutes even surprised him a bit. But he reminded us that when he’s talking about a “hawkish” Fed, he’s not really talking about hawks.

They’re extinct. They may as well be the dodo bird at the Federal Reserve. Everybody is a dove. We’re just talking about degrees of dovishness. And so, the Fed was less dovish than the markets had expected.”


Posted in Published | Comments Off on January 11, 2022

January 10, 2022

4:00 pm

Here’s a “what if” to consider.  What if Wave [3] of the VIX has the same dimensions as Wave [1]?  If so, we could use the same multiplier for the entire structure (5 Waves).  Currently Wave 1 of (C) of [1] is 8.28 points, while Wave 1 of (C) of [3] is 20.59 points, a multiple of 2.5 times.  Wave 3 of (C) of [1] is 37.73 points in length.  Using the 2.5 multiple, we get 94.33 points.  Add to the Wave 2 low (January 4) and the target for Wave 3 of (C) of [3] is 110.67.  Should we see the same time frame as Wave [1], we may see the top of Wave 3 by the end of January. and the top of Wave [5] by the end of February.  I may be giving the final calculation for Wave 5 at the end of the month.


2:17 pm

SPX bounced above the trendline and the 100-dayMoving Average at 4565.00  to attempt to close the gap beginning at 4655.00.  However, gamma is negative all the way to 4700.00 with put options dominating to 4715.00.  The bounce appears to stall under 4650.00 thus far.  Should that be the case, the SPX would have a running correction Wave 2.

11:02 am

BKX may have begun its Master Cycle reversal this morning on day 264.  It may produce a sell signal beneath the Cycle Top at 142.89.  Earnings season starts off on Friday with Citigroup, JP Morgan Chase, Wells Fargo and Blackrock all giving their earnings announcements.  The Cycles Model suggests growing trend strength over the next two weeks, so should the reversal take hold, the chances of a panic decline arises.

ZeroHedge observes, “After a relatively quiet start to the year on the economic event front, if not in markets where last week’s FOMC Minutes sparked the worst bond rout since 2020 triggering the worst first week for the Nasdaq since the dot com bubble burst…

… we have a “simply a massive week ahead for markets” according to Nomura’s Charlie McElligott, with Powell testimony and bunches of Fed speakers, along with US economic releases headlined by the market’s most important datapoint in the CPI release Wednesday, in addition to PPI, Retail Sales and Consumer Sentiment over the course of the week, plus two Duration-heavy auctions ($36B of 10Y and $22B 30Y, on top of tomorrow’s $52B 3Y) and finally, US corporate earnings season kickoff (highlighted by JPM, C and WFC this upcoming Friday)


10:33 am

SPX has crossed its 22-month trendline and begun to bounce beneath round number support at 4600.00.  The Cycles Model suggests that the bounce may be stopped at the trendline at 4620.00 so we may see the decline resume this afternoon, should the trendline hold.  The SPX may be at risk for a “running correction,” where the bounce is minimal or nonexistent.  A trendline of this dimension may prevent a bounce from rising above it.   In addition, the negative gamma appears to be growing, especially as the SPX may be closing at a new low for today’s options expiration.

ZeroHedge remarks, ““Minsky Moments” almost certainly await, warns Nomura’s Charlie McElligott in his latest note as he reflects on a massive week ahead for markets.

With Powell testimony and bunches of Fed speakers, along with US economic releases headlined by the market’s most important datapoint in the CPI release Wednesday, in addition to PPI, Retail Sales and Consumer Sentiment over the course of the week, plus two Duration-heavy auctions ($36B of 10Y and $22B 30Y, on top of tomorrow’s $52B 3Y),… and finally, US corporate earnings season kickoff (highlighted by JPM, C and WFC this upcoming Friday), it is no wonder that investors are degrossing still…


8:20 am

Good Morning!

NDX futures have fallen deeply beneath the 22-month trendline at 15550.00.  Options gamma remains negative and may be setting up a feedback loop.  The Decline has taken 8.6 days thus far and the hourly Cycles suggest the decline may accelerate beyond this point.  A possible inflection point (bounce) may be the daily mid-Cycle support at 15021.00 or the 200-day Moving Average at 14972.00.

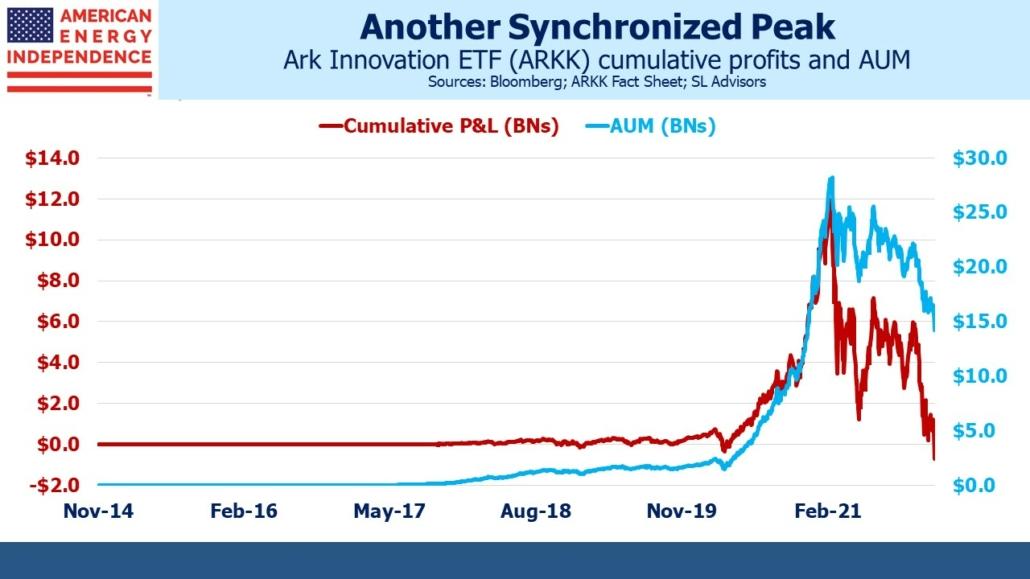
ZeroHedge remarks, “Last Thursday Jim Cramer described the performance of the ARK Innovation ETF (ARKK) run by Cathie Wood as “attrocious”. This caught my attention – Cramer, whether you love him or not, doesn’t often criticize other asset managers.

It turns out that the demise of ARKK highlights what happens too frequently in finance. To wit, because inflows to ARKK followed strong performance, as is usually the case, it turns out that the cumulative P&L on ARKK is negative. It peaked last February at just under $12BN and has been in steep decline ever since. At the beginning of this year it crossed into negative territory. The average dollar invested in ARKK has lost money.

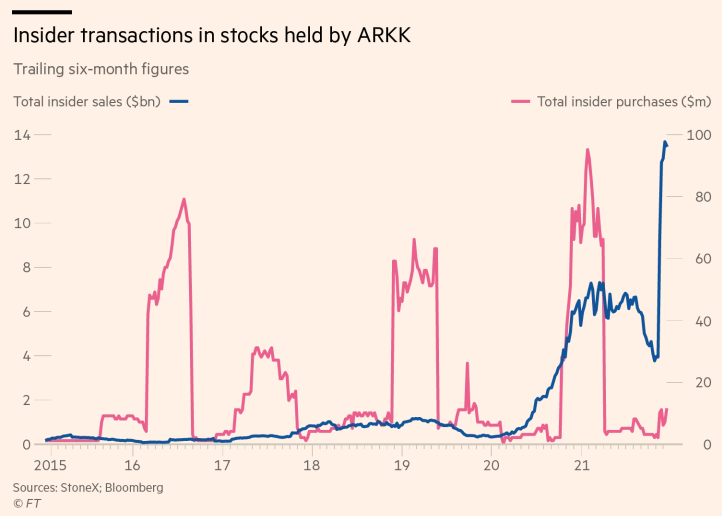
ZeroHedge further observes, “Could that bag that Cathie Wood is holding have been passed to her directly from the very same company insiders she is publicly supporting? It sure looks that way.

That’s because executives of companies held by Wood’s ARKK Innovation Fund are selling shares at a “swift clip”, according to a new report from the Financial Times.

The report notes that insiders have sold a stunning $13.5 billion in stock while purchasing just a paltry $11 million over the last six months. The sales are “far higher than in any previous period,” the report notes.

When you ex out the $10.7 billion recently sold by Elon Musk, the figure still stands at $2.8 billion versus $11 million in purchases. These are still “levels well above historic norms, having averaged nearer $500m per six-month period between 2015 and 2020,” FT notes.


The NDX Hi-Lo Index reflects the outflow problem with a lack of dip-buying after Wednesday’s massacre.


SPX futures are making new lows beneath the 50-day Moving Average at 4670.00.  The Cycles Model shows a possible bouncing point sometime early this afternoon.  The obvious place for a bounce is the 22-month trendline at 4615.00.  This may set up a positive close today.  However, the Max Pain zone for today’s options expiration is at 4725.00, near the 50% retracement value.  Anything short of that may cause the decline to resume.

ZeroHedge reports, “he new week has picked up where last week left off: with futures selling off and global markets lower as yields continued their relentless treck higher, hitting fresh two year highs (amid concerns of a faster Fed balance sheet drawdown coupled with a massive IG issuance slate forcing managers to put on rate locks in what remains an illiquid market).

US index futures traded down to session lows as US traders sat at their desks after rising modestly earlier in the session, and were down 27 points or 0.6% at 730am…

… while Treasury yields stabilized after reversing an earlier spike rising as high as 1.8064% before dropping to 1.7656% following a global bond selloff last week as investors awaited key inflation data later in the week. Tech stocks again led the decline with Nasdaq futs down 0.63%, while  Dow futures were down 0.12% or 44 points. The dollar rose, bitcoin dropped and crude oil steadied around $79 a barrel.


VIX futures made a new high at 21.20 after a consolidation on Thursday and Friday.  The Cycles Model shows increasing strength through the month of January.  The next few days may be dicey.  VIX has made a 52% retracement of a Minute Wave [i] thus far.  We may know whether that is sufficient in the next day or so.


TNX is forging higher as trending strength “triples down” this week.  Of course, this is totally unexpected by most pundits.  The Cycles Model suggests the trend may continue through the end of February, with January offering the strongest gains.

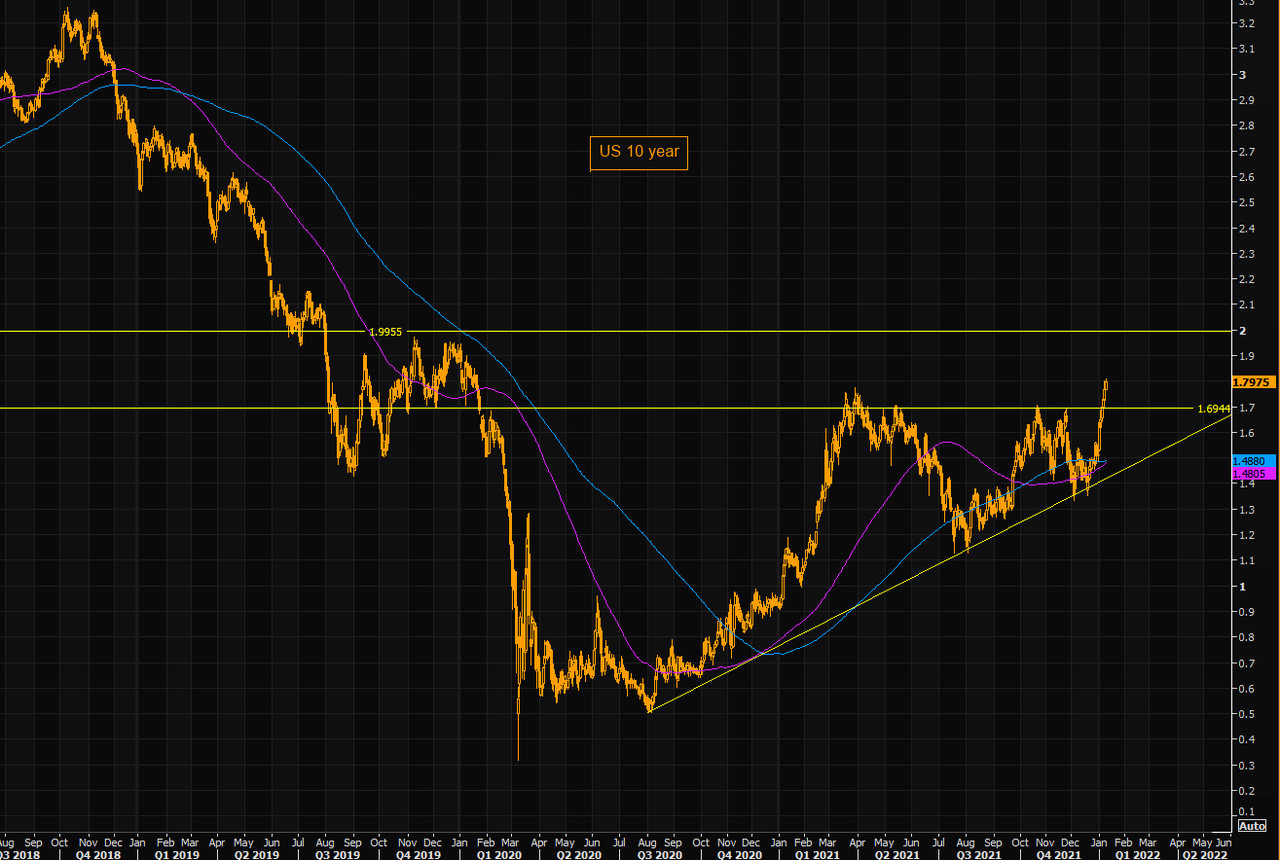
ZeroHedge remarks, “US 10 year – time for the second “golden” cross?

US 10 year is trading at 1.8%, highest levels in a year. A few days before Christmas we traded at 1.37%…so this has been a rather extreme move. 1.8% is a short term resistance level to watch (but there is nothing major to the upside until 2% should we close above the 1.8% level). Note the 100 day crossing the 200 day here. Momentum is strong, but this is getting ahead of itself in the short term at least.


USD futures are bouncing off the 50-day Moving Average at 95.63 and has reached the top of Friday’s trading range.  The Cycles Model calls for a steady climb this week with trending strength gaining in the latter half of the month.


Posted in Published | Comments Off on January 10, 2022

January 7, 2022

3:15 pm

SPX is trading flat at or beneath 4700.00 despite efforts to boost equities.  It’s time to short this market.  I cannot see it recovering on Monday after such a negative options expiration.  Be prepared for increased volatility.

The NDX is deep into short gamma territory.  This may have an influence on the blue chips, as well.


11:15 am

The SPX has crossed beneath the 50-day Moving Average at 4669.39 and may be heading for the 22-month trendline/100-day Moving Average at 4628.05.  The decline is now impulsive to the downside, although there may be a bounce once it hits support.


10:55 am

I have been watching the NDX with a mixture of amazement and disbelief.  The decline may now be impulsive (trend changing) and may have more decline ahead.  The negative gamma appears to be simply overwhelming and may build on itself.  The NDX is on a sell signal, but confirmation lies beneath the trendline.  Until then the risk of a pullback is very high.  This may not be an easy position to hang on to but the message is clear.  The Cycle may now be heading down for the duration of January.  I realized the Cycles Model may have been correct after all, especially as it pertains to the NDX.  Should the decline continue, the next target appears to be near 15000.00.  The daily Cycle Bottom appears near 13000.00.

The NDX Hi-Lo rose at the open to -2.00 in an effort to revive the bounce.  It has since subsided to -77.00.


10:36 am

TNX continues to rise above the Lip of a Cup with Handle formation.  What is not understood by many is that (1) the Fed is no longer in charge of rates and (2) rates may rise far more than anticipated or even imagined.

ZeroHedge remarks, “A hotter than expected wage growth print and tumbling unemployment rate have been greeted by selling in bonds and stocks as no obvious ‘dovish’ excuse can be gleaned from the data.

Academy Securities’ Peter Tchir’s instant reaction clarifies much and the headline is simple – this is not great for markets…”


7:30 am

Good Morning!

NDX futures are bouncing, but not yet able to exceed yesterday’s high at 15900.60.  Today it must overcome the 50-day Moving Average at 16101.25.  To put this into context, NDX option gamma is extremely bearish.  The Max Pain zone is at 16160.00 and gamma turns bullish at 16200.00.  QQQ (closing price $382.10) must rise to its Max Pain zone at 392.00.  Options gamma turns bullish at 400.00.

The Cycles Model suggests a probable Cycle top, if not a new all-time high, near January 15.  Since that is a weekend, it may be either January 14 or the 17th, should the Cycle be on time.  It is noteworthy that the heaviest options will be on January 21.

ZeroHedge comments, “NASDAQ – to dare or not to dare?

NASDAQ has actually done nothing since early September. The index has been stuck in a perfect range since mid Oct. The only thing that has risen is tech volatility, VXN. Price action today is not overly impressive post the carnage yesterday, but note VXN is up as we trade close to the 100 day, the longer term trend line and the lower part of the range. All break out attempts (up as well as down) have been reversed since October. Is this time different?”


The NDX Hi-Lo Index closed at -522.00, a very dicey position.  But the Hi-Lo has recovered from plunges this low in the past month.  There may be more choppiness ahead.


SPX futures are lingering near 4700.00, not as dire as the NDX.  The rotation to quality stocks has helped the blue chips.  However, the mega-tech stocks still weigh heavily in the SPX.  If we are to follow the NDX Master Cycle, we may yet see a new all-time high in the next week.  In today’s options expiration, gamma is very bearish at 4700.00, so a stumble lower may start a panic.  However, the Max Pain zone is at 4745.00.  Gamma turns bullish at 4775.00.

ZeroHedge reports, “US index futures climbed on Friday, paring this week’s losses fractionally as investors braced for jobs data that should provide clues about the pace of Fed tightening and which is expected to come in strong (whisper number at 502k, above 447k estimate, up from 210K last month; Wednesday’s ADP print was 807k, well above 410k estimate, our full preview is here) but not too strong – remember we now live in a “good news is bad news” world – or else the market will freak out that the Fed will hike even faster than is currently expected. Nasdaq futures also showed signs of recovery after a three-day selloff even as cryptocurrencies crashed again during the Asian session. As of 730am, emini S&P futures were up 4 points or 0.1%, Nasdaq futures were 0.24% higher, or 37 points and Dow futures were unchanged.Treasuries were steady, with the two-year yield heading for the biggest weekly spike since October 2019. Crude oil headed for the longest streak of weekly gains since October on tightening supplies.”


TNX just surged above the Cycle Top at 17.42 on the news of the Payrolls miss.  This may jolt equities lower.

ZeroHedge reports, “With everyone bulled up on the December jobs print which was expected to more than double the disappointing November print of 210K to 447K with a whisper of more than 500K, moments ago the BLS reported that in December the US job market deteriorated again, as only 199K jobs were added, a huge miss to expectations, and the lowest number since December 2020.”


Posted in Published | Comments Off on January 7, 2022

January 6, 2022

10:25 am

NDX appears to have bounced off its 22-month trendline and may be heading higher.  The new target, should it run to the top again, is 16700.00 where Wave C equals Wave A.  However, it will have some serious headwinds at the 50-day Moving Average at 16087.00.  In tomorrow’s NDX options expiration, 16300.00 appears to be the Max Pain zone, while gamma turns positive at 16400.00.  The dealers have their work cut out for them.


10:03 am

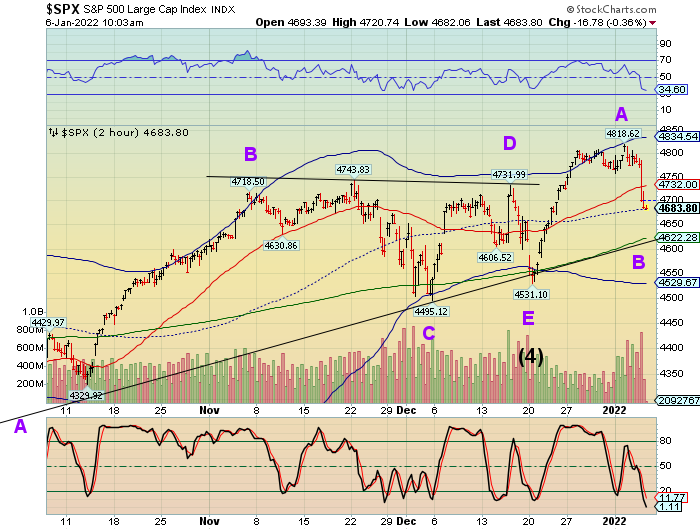
SPX may have bounced from its mid-Cycle support at 4682.00, although it is too early to tell as it may test the 50-day at 4667.00.  The current decline has kept the form of a Wave B, so the bounce is still in play.  For some reason this chart shows the 100-day (green line) and not the 50-day Moving Average.


9:43 am

BKX made a new high this morning as it challenges the Cycle Top resistance at 142.34.  The Cycle Trading Bands are narrowing, anticipating a probable reversal off the Cycle Top and the start of a powerful new trend.  It could be that, since Wave [5] appears truncated, that this may be another attempt at Wave [5].  If so, the top may appear closer to 145.00.


7:30 am

Good Morning!

NDX futures reached an overnight now of 15633.50, bouncing off the 22-month trendline discussed yesterday.  We may consider that to be strong support which may lead to a Wave C bounce to the vicinity of  the Wave A high (flat correction) or to 16732.00, where Wave C equals Wave A.  NDX is in seriously negative gamma territory and should do this quickly, as the next options expiration is due tomorrow.  QQQ (384.29) must rise a hefty 2.5 to 3% to achieve its Max Pain zone at 394.00 at options expiration tomorrow.

RealInvestmentAdvice observes, “The first part of our 2022 outlook looks through the front windshield and contrasts 2021s tailwinds with 2022s growing headwinds. While no one knows what 2022 holds in store for investors, our concern is that it should not foster the same optimism as 2021. The economic and financial environments are shifting rapidly making the 2022 outlook much more difficult than this past year.

Part 2 of the 2022 outlook, coming out next week, will cover our thoughts on the stock and bond markets.

“The more extended the advance, and the higher valuations become, the more stable and promising the investment can appear to be, when judged through the rearview mirror.” John Hussman


The VXN closed above its 50-day Moving Average at 23.30 and may reach its Cycle Top before a correction to retest the 50-day.  It is on a buy signal (short NDX), but shorting the NDX should be done on the pullback.    The NDX Hi-Low closed at -282 yesterday, giving it a sell signal.


SPX futures bottomed out at 4677.10 in the overnight session and has stabilized near 4700.00.  Should Wave C follow through, it may ultimately close above the Wave A high, as far as 4950.00 Where Wave C equals Wave A, a common relationship.  However. 4800.00 may provide heavy resistance, as 4775.00 is the Max Pain zone in Friday’s options.  Remember, options providers have the incentive to pay the least at expiration time.  At the moment, the dealers must be very uncomfortable, as gamma is negative below 4775.00 and there are 8,000 more put contracts than calls at 4700.00.

ZeroHedge reports, “US equity futures were little changed after earlier swings as traders digested hawkish Fed minutes that sparked a global stock rout on Wednesday. As discussed yesterday, minutes from the Fed’s December meeting showed a growing preference for a faster path of rate hikes and a shrinking of the bank’s balance sheet (one which would lead to yet another market crash and even more stimulus). However, while rising rates is terrible news for tech and high duration names, it’s good news for the value sector, and investors bet while the Fed’s faster-than-expected policy tightening (which will lead to faster than expected easing) may crimp highly valued technology stocks it will offer opportunities in other equity sectors, and sure enough with Nasdaq futures bombing again, energy names like Exxon are at 2 year highs. Treasury yields extended a spike, with the 10Y rising to 1.75%, the dollar was unchanged and bitcoin’s plunge continued even though the selling in stocks has subsided. At 730am, Emini S&P futures were down 3 points or -0.06%, Dow futures were up 82 points or 0.2% and Nasdaq futures were down 76 points or 0.5% but off worst levels.”


VIX futures reached a new high at 20.79 in the overnight session, but have come down, remaining thus far above the 50-day Moving Average at 19.55.  The probe higher may be finished for now, but the buy signal has been made and VIX investors may be looking for a better entry point.


TNX has challenged its Cycle Top at 17.42 this morning.  TNX futures rose to 17.53 before opening beneath Cycle top resistance.  This is significant, since the Cycle Top is 2 standard deviations from the mean 258-day average at 14.71.  Investors at analysts look upon the 17.00 level as a major cange in outlook, which it is.  However, they still view the Fed as being “in charge” of rates.  However, I have done a study which reveals that the Fed has always been behind the Fed Funds rate Cycle by 1-3 months since 1949, when that data became available in 1949.

ZeroHedge remarks, “Considering that today’s minutes covered a FOMC meeting that took place some three weeks ago, with numerous Fed speakers having ample opportunity to set the stage for what was to come (talk about those famous Fed “communication” skills), it is rather shocking how powerful and violent today’s stock tantrum was.

But what exactly spooked traders so badly?

Well, as JPM Michael Feroli writes in his FOMC post-mortem, the minutes portray “a Committee on the march toward removing policy accommodation” which is not a surprise to anyone except perhaps the biggest cubic zirconium hands out in Seoul. Regarding the expected path of policy rates the minutes note that meeting participants generally see rate hikes “sooner or at a faster pace” than previously expected. Of course, this too had already been hinted at by the dots released after the meeting.”


Gold futures are down beneath all supports this morning, creating a powerful sell signal.  It made its Master Cycle high on Monday, day 257.  Yesterday’s uptick was strong, but unable to make a new high.  The new trend may see a breakdown beneath the Broadening Wedge and Head & Shoulders formation.  the New Master Cycle may not pivot higher until mid-February.


Posted in Published | Comments Off on January 6, 2022

January 5, 2022

2:50 pm

TNX has broken above its straight line resistance at 16.93 and appears to be challenging Cycle Top resistance at 17.39.  It has been on a buy signal (UST sell signal) since it crossed above the 50-day Moving Average.  The bond bust may be moving faster than anticipated.

ZeroHedge observes, ” The FOMC Minutes are considerably more hawkish than expected in terms of both the timing of the liftoff of rates and the pace of normalization of the balance sheet.

*  *  *

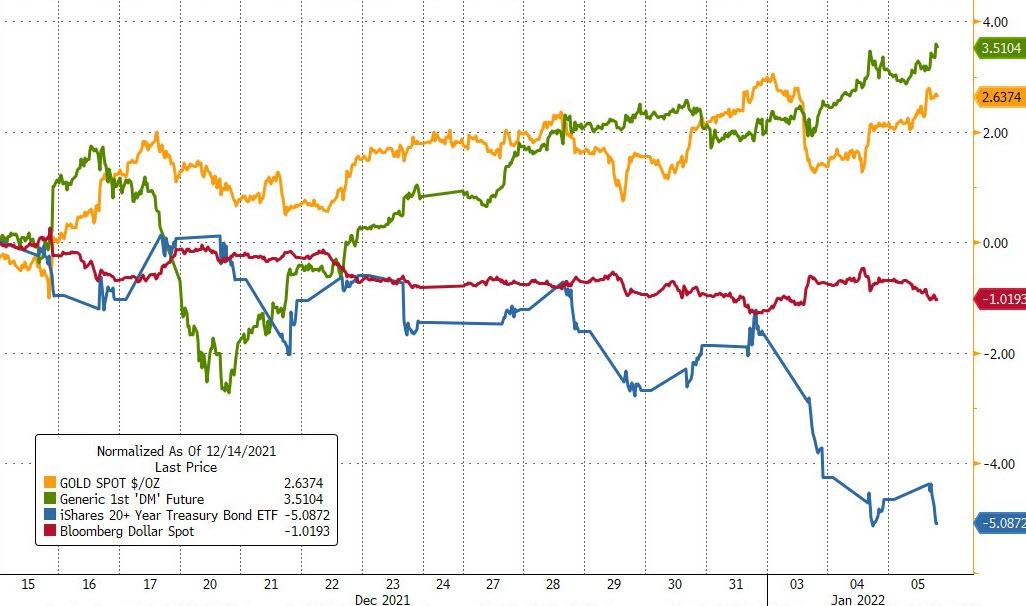
Since December 15th’s FOMC statement, bonds have been battered, the dollar is down modestly while stocks and gold are up strongly….

Source: Bloomberg

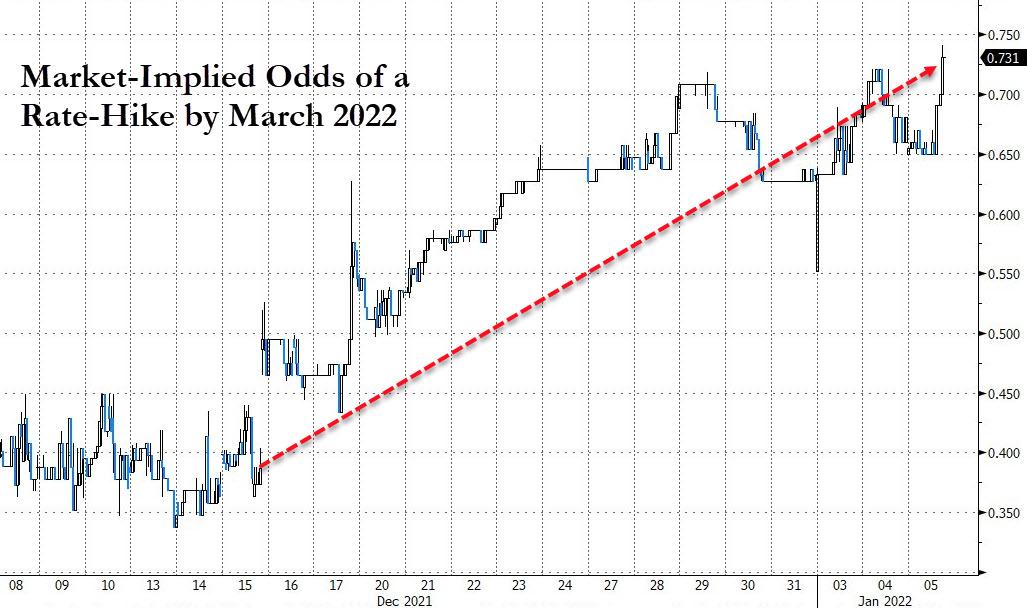
The short-end of the yield curve has risen dramatically, pricing in the new hawkish dot-plot offered by The Fed (for 2022) with a 73% chance of Fed hikes by March 2022 now ((from 40% pre-FOMC)…


2:42 pm

NDX has declined beneath its 50-day Moving Average and is heading for its Cycle Bottom at 15657.15.  The Scenario I mentioned this morning appears to be coming about.  I am hesitant to call for a sell signal since the potential Wave (2) is incomplete.  In addition, the potential Master Cycle is more than a week away.  The Cycle Bottom is near the Ending Diagonal trendline originating from March 2020, so I will err on the careful side. and wait for further developments.


7:45 am

Good Morning!

NDX futures are performing poorly as they bounce overnight at Short-term support at 16176.00.  Wave B may develop further, declining down to the Cycle Bottom support at 15664.21 before a last pile-on of BTFDers to rise to the Cycle Top resistance at 16748.42…and still not make a new high.  The NDX Hi-Lo Index closed at 2.00.

Today’s QQQ (396.47) options are bearish beneath 400.00 with a downward pull should Short-term support break.  Friday’s options expiration remains bearish beneath  399.00.

ZeroHedge reports, “After futures rose to a new all time high during the Tuesday overnight session, the mood has been decided more muted after yesterday’s sharp rates-driven tech selloff, and on Wednesday U.S. futures were mixed and Nasdaq contracts slumped as investors once again contemplated the effect of expected rate hikes on tech stocks with lofty valuations while waiting for the release of Federal Reserve minutes at 2pm today. At 730am, Nasdaq 100 futures traded 0.3% lower amid caution over the impact of higher yields on equity valuations, S&P 500 Index futures were down 0.1%, while Europe’s Stoxx 600 gauge traded near a record high. The dollar weakened, as did bitcoin, while Brent crude rose back over $80.

“The sharp rise in U.S. yields this week has sparked a move from growth to value,” said Jeffrey Halley, senior market analyst at Oanda Asia Pacific. “Wall Street went looking for the winners in an inflationary environment and as a result, loaded up on the Dow Jones at the expense of the Nasdaq.”


SPX futures remained flat in the overnight session.  While it made a nominal new high, the SPX may still decline further in Wave B.  Depending on the depth of the decline, if any, the preliminary target of 5000.00 may come off the table.  Traditional pensions, defined contribution plans and profit sharing plans all must make their annual contribution by January 15, or file an extension.  This may be the last hurrah for money flows into equities for some time.

ZeroHedge remarks, “The consensus narrative for stocks this year seems to be clear: Watch inflation and central banks’ reaction to it amid slowing global economic growth. But that means a lot of moving parts and when the seasonal strength in January ebbs, the path to further gains this year might not be so easy.”


VIX futures rose in the overnight session, still rangebound beneath mid-Cycle resistance at 18.56.  Above that level may be considered an aggressive buy, while above the 50-day may confirm that signal.  Note that the VIX has back-tested the Ending Diagonal trendline at its Master Cycle low yesterday (day 265).


TNX has also consolidated in place as the next Trading Cycle low may be due this weekend.  The uptrend is not being challenged by this minor Cycle.  However, the breakout may be delayed until next week as trending strength returns.


USD futures pulled back to 96.00 as it consolidates after two days of gains.  The uptrend ay remain intact through the second week of February.  A likely target for this upsurge appears to be the 61.8% retracement of the 2020 decline at 98.30.


Crude oil futures rose to 77.82 in the overnight session, topping out the potential last day of strength in this bounce.  The Cycles Model calls for a decline into the last day of January as it completes the correction.

ZeroHedge observes, “Oil prices rallied today with WTI erasing all of the post-Omicron losses after OPEC+ agreed to revive more halted production as the outlook for global oil markets improved, with demand largely withstanding the new coronavirus variant.

Global fuel consumption continues to recover from 2020’s collapse. There’s rising traffic and factory activity across key Asian consuming countries and dwindling crude inventories in the U.S., buoying oil prices to nearly $80 a barrel in London.”


Posted in Published | Comments Off on January 5, 2022