
4:00 pm

Here’s a “what if” to consider. What if Wave [3] of the VIX has the same dimensions as Wave [1]? If so, we could use the same multiplier for the entire structure (5 Waves). Currently Wave 1 of (C) of [1] is 8.28 points, while Wave 1 of (C) of [3] is 20.59 points, a multiple of 2.5 times. Wave 3 of (C) of [1] is 37.73 points in length. Using the 2.5 multiple, we get 94.33 points. Add to the Wave 2 low (January 4) and the target for Wave 3 of (C) of [3] is 110.67. Should we see the same time frame as Wave [1], we may see the top of Wave 3 by the end of January. and the top of Wave [5] by the end of February. I may be giving the final calculation for Wave 5 at the end of the month.
2:17 pm

SPX bounced above the trendline and the 100-dayMoving Average at 4565.00 to attempt to close the gap beginning at 4655.00. However, gamma is negative all the way to 4700.00 with put options dominating to 4715.00. The bounce appears to stall under 4650.00 thus far. Should that be the case, the SPX would have a running correction Wave 2.
11:02 am

BKX may have begun its Master Cycle reversal this morning on day 264. It may produce a sell signal beneath the Cycle Top at 142.89. Earnings season starts off on Friday with Citigroup, JP Morgan Chase, Wells Fargo and Blackrock all giving their earnings announcements. The Cycles Model suggests growing trend strength over the next two weeks, so should the reversal take hold, the chances of a panic decline arises.
ZeroHedge observes, “After a relatively quiet start to the year on the economic event front, if not in markets where last week’s FOMC Minutes sparked the worst bond rout since 2020 triggering the worst first week for the Nasdaq since the dot com bubble burst…
… we have a “simply a massive week ahead for markets” according to Nomura’s Charlie McElligott, with Powell testimony and bunches of Fed speakers, along with US economic releases headlined by the market’s most important datapoint in the CPI release Wednesday, in addition to PPI, Retail Sales and Consumer Sentiment over the course of the week, plus two Duration-heavy auctions ($36B of 10Y and $22B 30Y, on top of tomorrow’s $52B 3Y) and finally, US corporate earnings season kickoff (highlighted by JPM, C and WFC this upcoming Friday)
10:33 am

SPX has crossed its 22-month trendline and begun to bounce beneath round number support at 4600.00. The Cycles Model suggests that the bounce may be stopped at the trendline at 4620.00 so we may see the decline resume this afternoon, should the trendline hold. The SPX may be at risk for a “running correction,” where the bounce is minimal or nonexistent. A trendline of this dimension may prevent a bounce from rising above it. In addition, the negative gamma appears to be growing, especially as the SPX may be closing at a new low for today’s options expiration.
ZeroHedge remarks, ““Minsky Moments” almost certainly await, warns Nomura’s Charlie McElligott in his latest note as he reflects on a massive week ahead for markets.
With Powell testimony and bunches of Fed speakers, along with US economic releases headlined by the market’s most important datapoint in the CPI release Wednesday, in addition to PPI, Retail Sales and Consumer Sentiment over the course of the week, plus two Duration-heavy auctions ($36B of 10Y and $22B 30Y, on top of tomorrow’s $52B 3Y),… and finally, US corporate earnings season kickoff (highlighted by JPM, C and WFC this upcoming Friday), it is no wonder that investors are degrossing still…
8:20 am

Good Morning!
NDX futures have fallen deeply beneath the 22-month trendline at 15550.00. Options gamma remains negative and may be setting up a feedback loop. The Decline has taken 8.6 days thus far and the hourly Cycles suggest the decline may accelerate beyond this point. A possible inflection point (bounce) may be the daily mid-Cycle support at 15021.00 or the 200-day Moving Average at 14972.00.
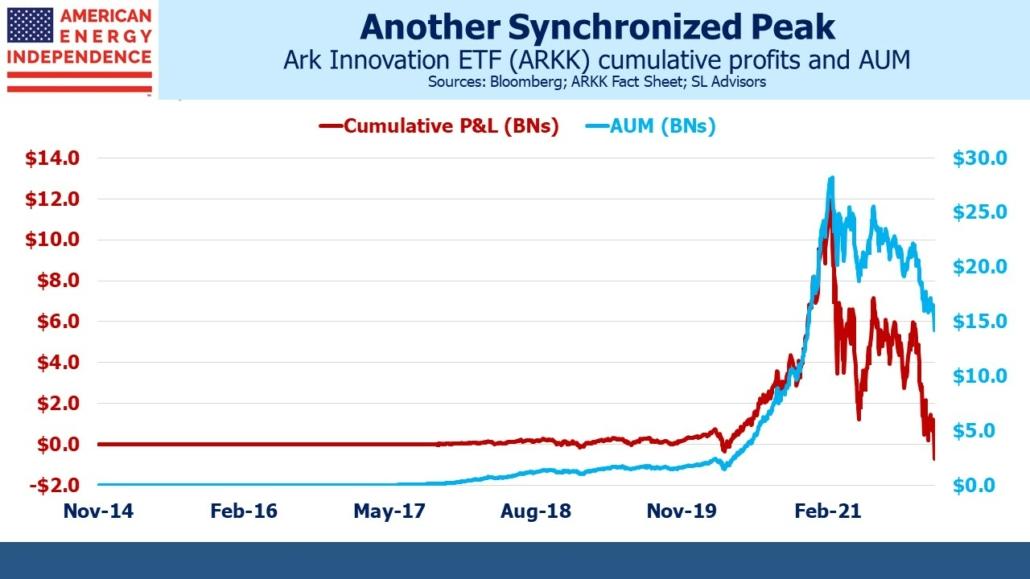
ZeroHedge remarks, “Last Thursday Jim Cramer described the performance of the ARK Innovation ETF (ARKK) run by Cathie Wood as “attrocious”. This caught my attention – Cramer, whether you love him or not, doesn’t often criticize other asset managers.
It turns out that the demise of ARKK highlights what happens too frequently in finance. To wit, because inflows to ARKK followed strong performance, as is usually the case, it turns out that the cumulative P&L on ARKK is negative. It peaked last February at just under $12BN and has been in steep decline ever since. At the beginning of this year it crossed into negative territory. The average dollar invested in ARKK has lost money.
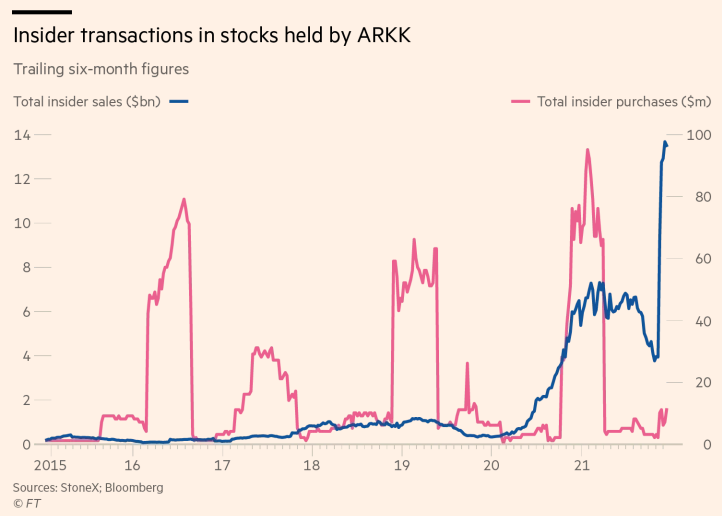
ZeroHedge further observes, “Could that bag that Cathie Wood is holding have been passed to her directly from the very same company insiders she is publicly supporting? It sure looks that way.
That’s because executives of companies held by Wood’s ARKK Innovation Fund are selling shares at a “swift clip”, according to a new report from the Financial Times.
The report notes that insiders have sold a stunning $13.5 billion in stock while purchasing just a paltry $11 million over the last six months. The sales are “far higher than in any previous period,” the report notes.
When you ex out the $10.7 billion recently sold by Elon Musk, the figure still stands at $2.8 billion versus $11 million in purchases. These are still “levels well above historic norms, having averaged nearer $500m per six-month period between 2015 and 2020,” FT notes.

The NDX Hi-Lo Index reflects the outflow problem with a lack of dip-buying after Wednesday’s massacre.

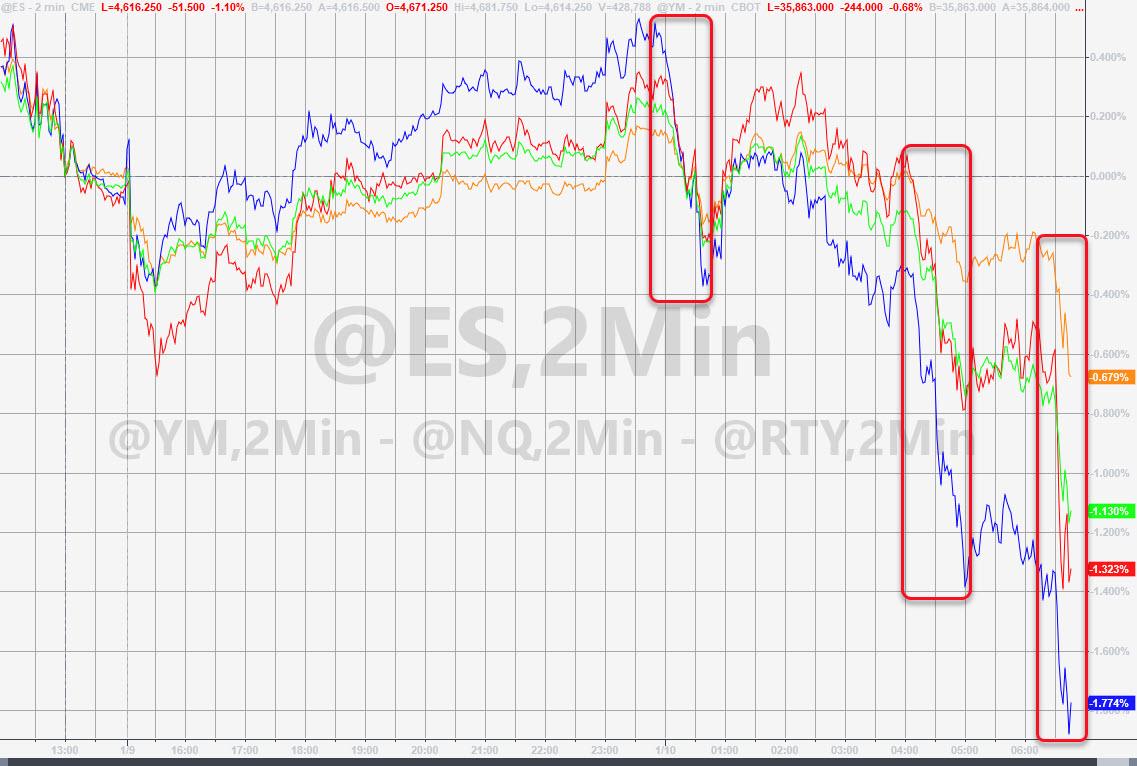
SPX futures are making new lows beneath the 50-day Moving Average at 4670.00. The Cycles Model shows a possible bouncing point sometime early this afternoon. The obvious place for a bounce is the 22-month trendline at 4615.00. This may set up a positive close today. However, the Max Pain zone for today’s options expiration is at 4725.00, near the 50% retracement value. Anything short of that may cause the decline to resume.
ZeroHedge reports, “he new week has picked up where last week left off: with futures selling off and global markets lower as yields continued their relentless treck higher, hitting fresh two year highs (amid concerns of a faster Fed balance sheet drawdown coupled with a massive IG issuance slate forcing managers to put on rate locks in what remains an illiquid market).
US index futures traded down to session lows as US traders sat at their desks after rising modestly earlier in the session, and were down 27 points or 0.6% at 730am…
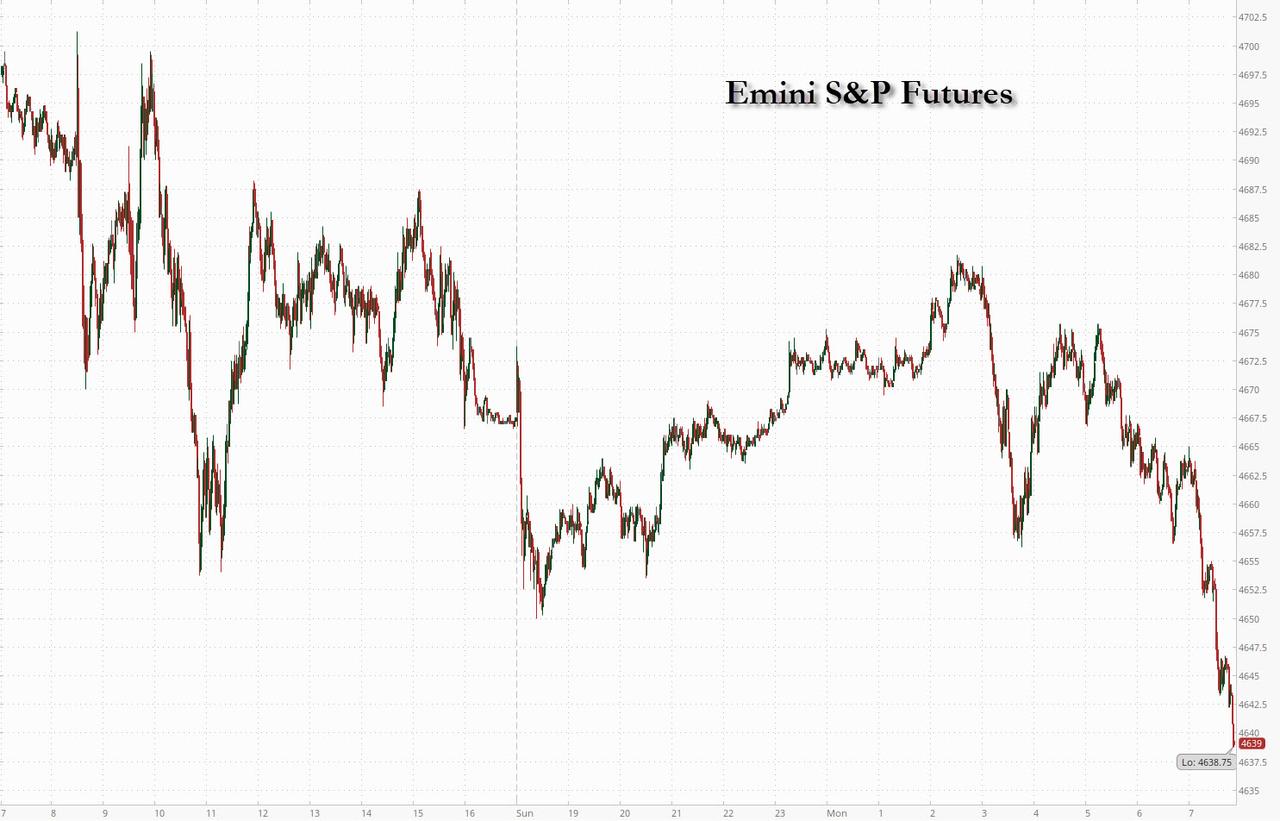
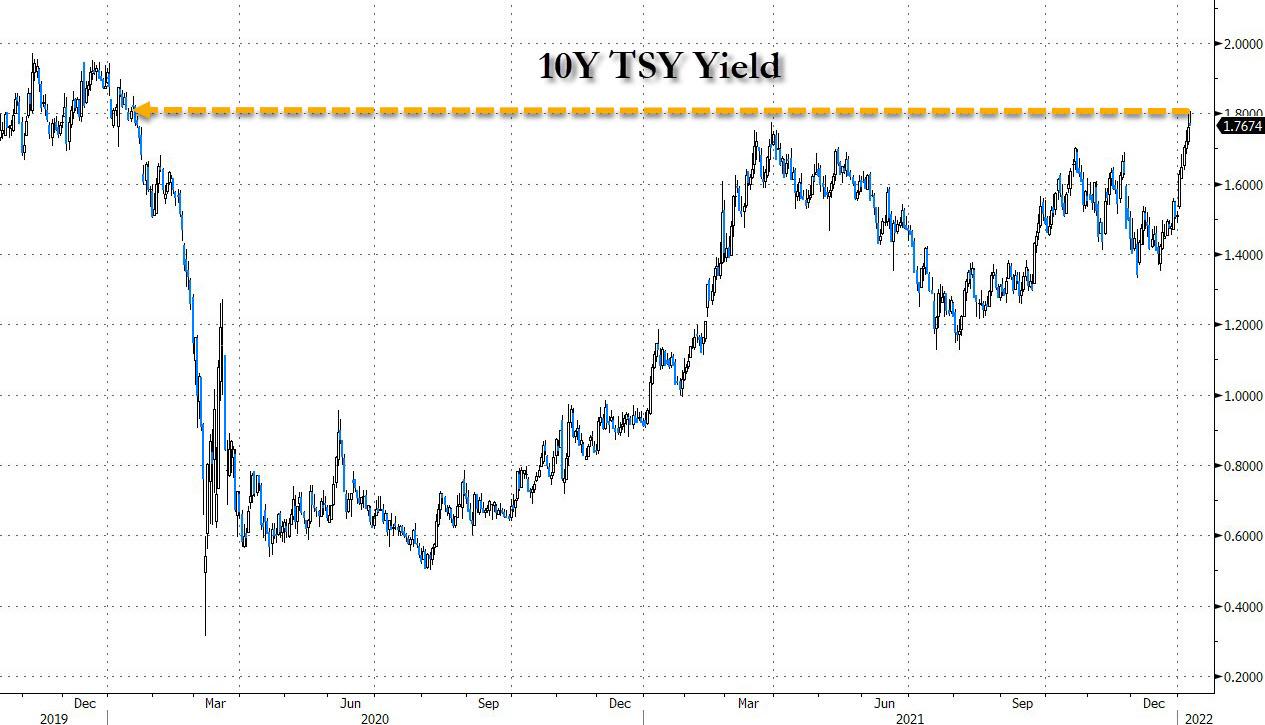
… while Treasury yields stabilized after reversing an earlier spike rising as high as 1.8064% before dropping to 1.7656% following a global bond selloff last week as investors awaited key inflation data later in the week. Tech stocks again led the decline with Nasdaq futs down 0.63%, while Dow futures were down 0.12% or 44 points. The dollar rose, bitcoin dropped and crude oil steadied around $79 a barrel.

VIX futures made a new high at 21.20 after a consolidation on Thursday and Friday. The Cycles Model shows increasing strength through the month of January. The next few days may be dicey. VIX has made a 52% retracement of a Minute Wave [i] thus far. We may know whether that is sufficient in the next day or so.

TNX is forging higher as trending strength “triples down” this week. Of course, this is totally unexpected by most pundits. The Cycles Model suggests the trend may continue through the end of February, with January offering the strongest gains.
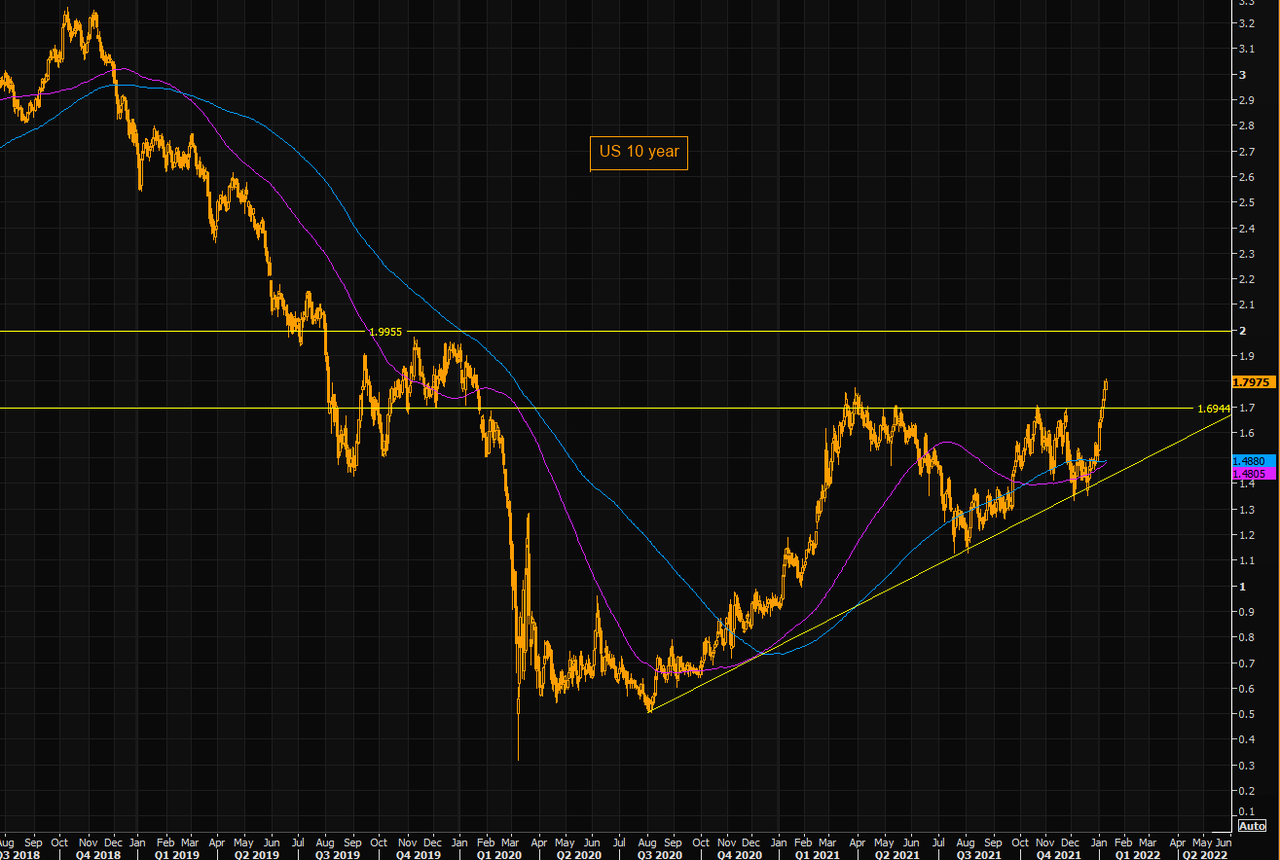
ZeroHedge remarks, “US 10 year – time for the second “golden” cross?
US 10 year is trading at 1.8%, highest levels in a year. A few days before Christmas we traded at 1.37%…so this has been a rather extreme move. 1.8% is a short term resistance level to watch (but there is nothing major to the upside until 2% should we close above the 1.8% level). Note the 100 day crossing the 200 day here. Momentum is strong, but this is getting ahead of itself in the short term at least.

USD futures are bouncing off the 50-day Moving Average at 95.63 and has reached the top of Friday’s trading range. The Cycles Model calls for a steady climb this week with trending strength gaining in the latter half of the month.