April 14, 2022

8:00 am

Good Morning!

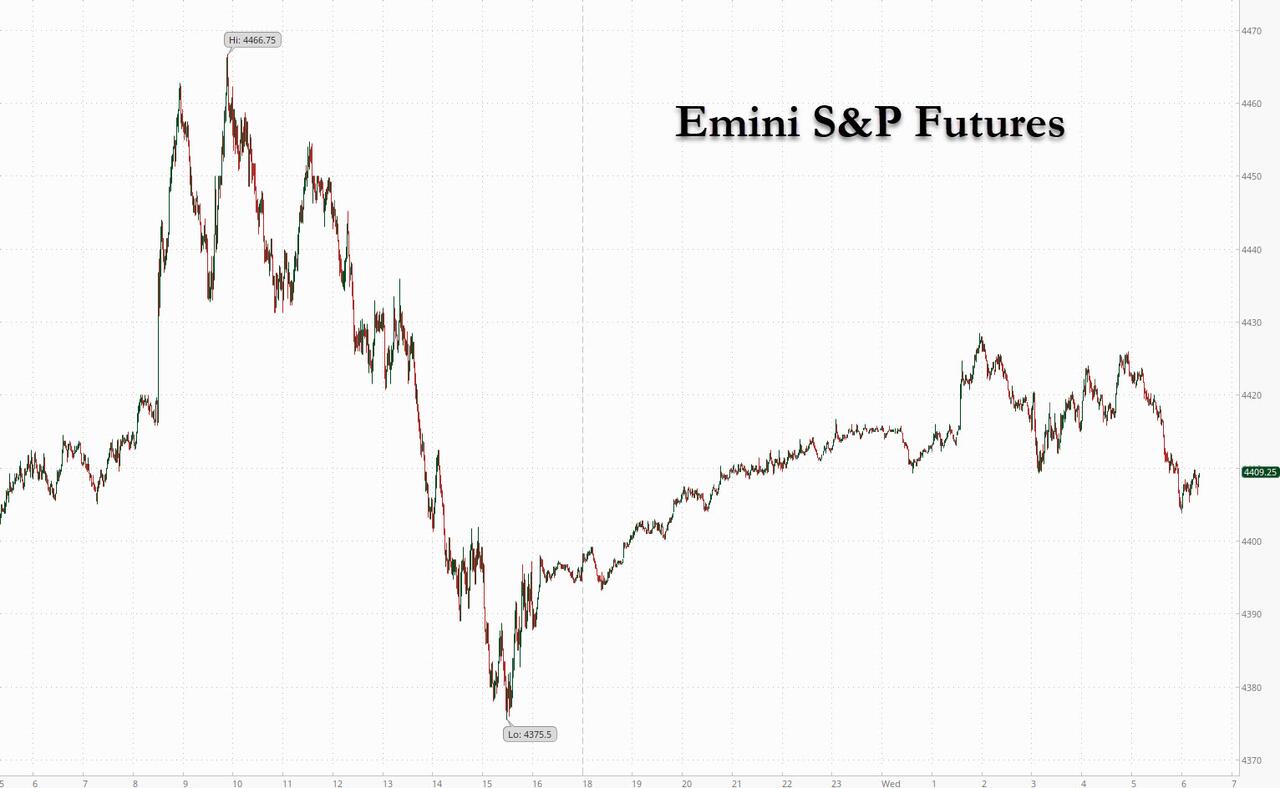
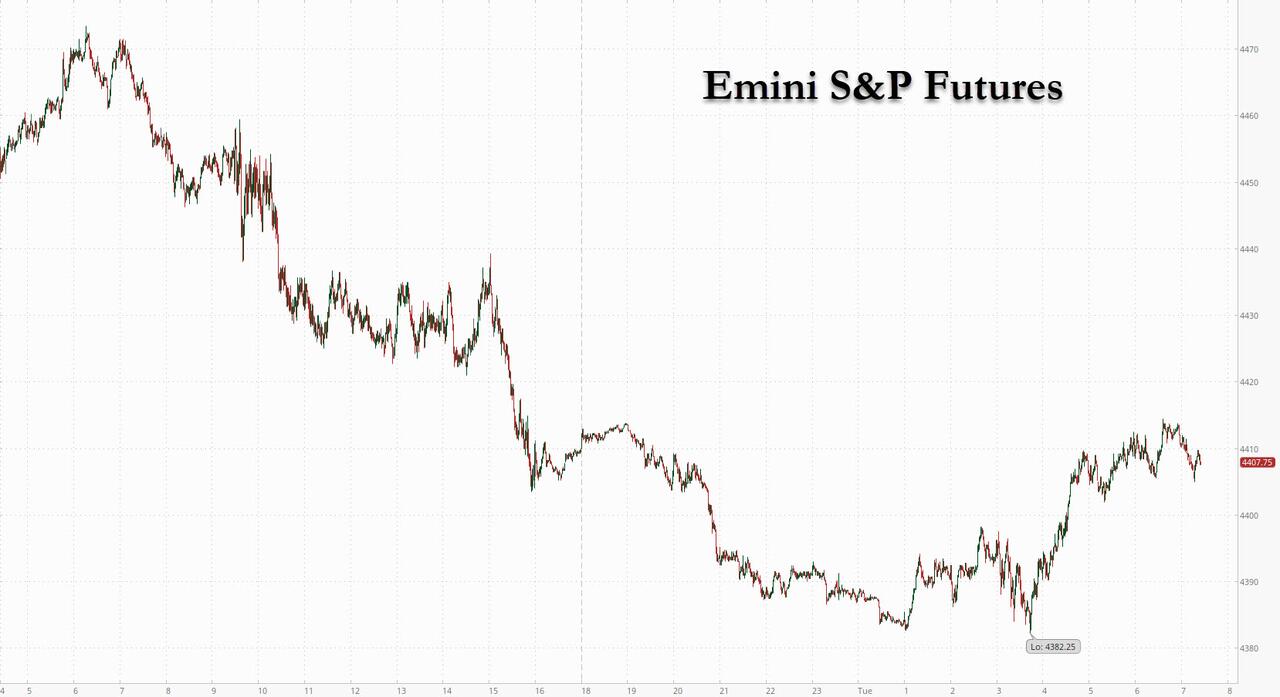
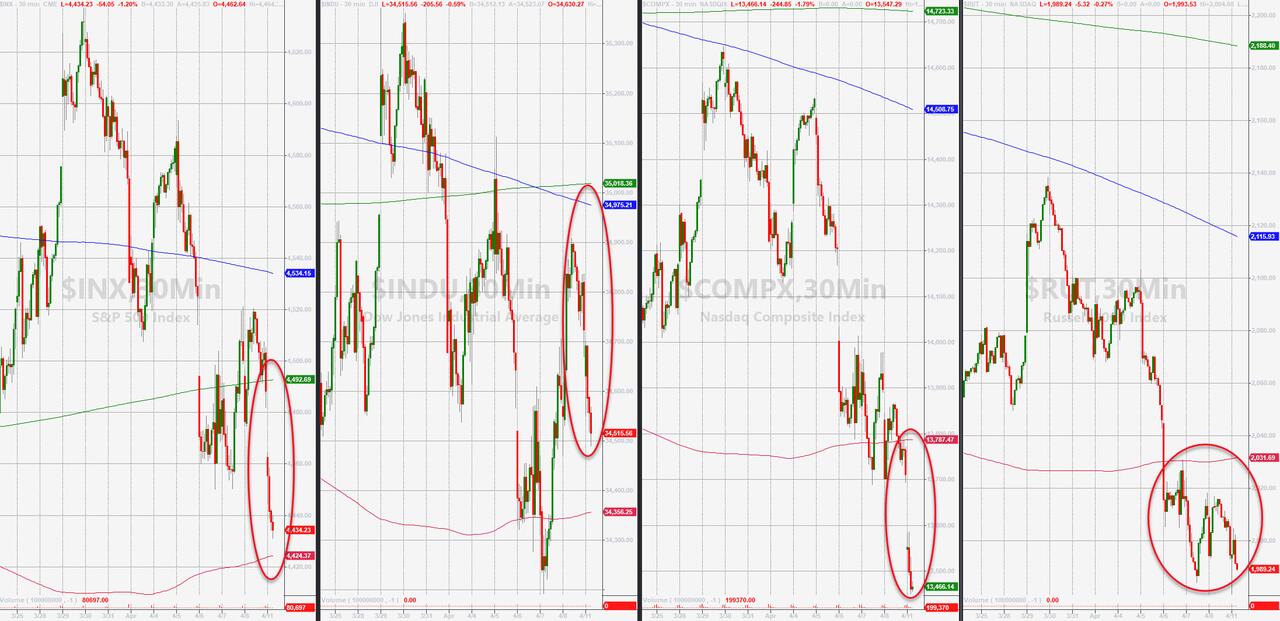
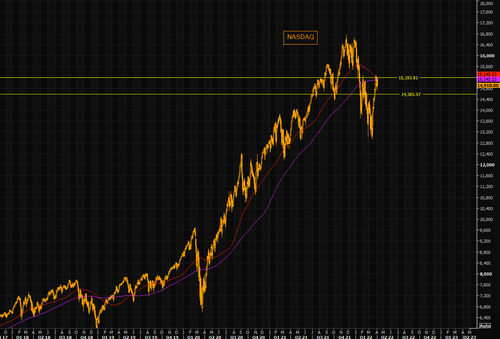
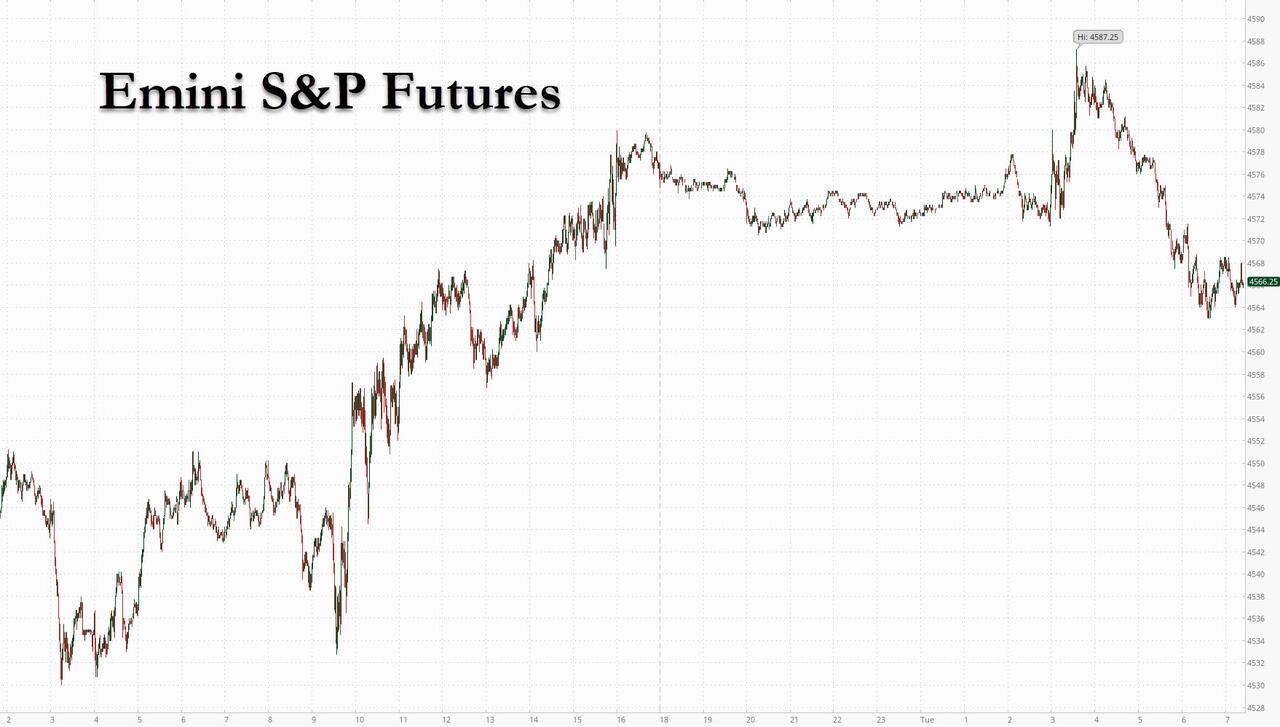
NDX futures attempted to assault the 50-day Moving Average at 14325.05, but failed, pulling back beneath Intermediate-term support/resistance at 14242.77.  While still oversold, the inability to overcome that double resistance may condemn the NDX to a continued oversold decline that may intensify into a panic.  The unfilled gaps give us a clue as to the profound weakness of the NDX.  Attempting to buy the dip here may be sheer suicide.


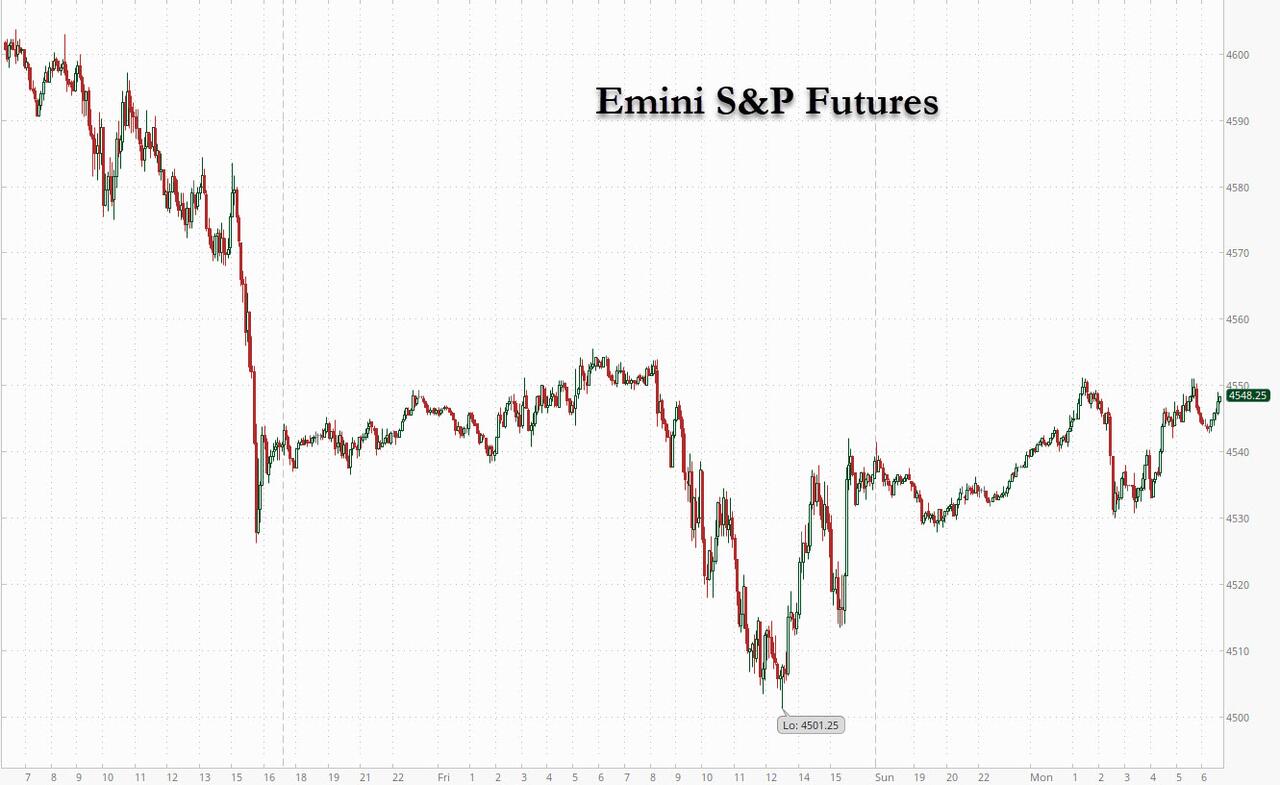
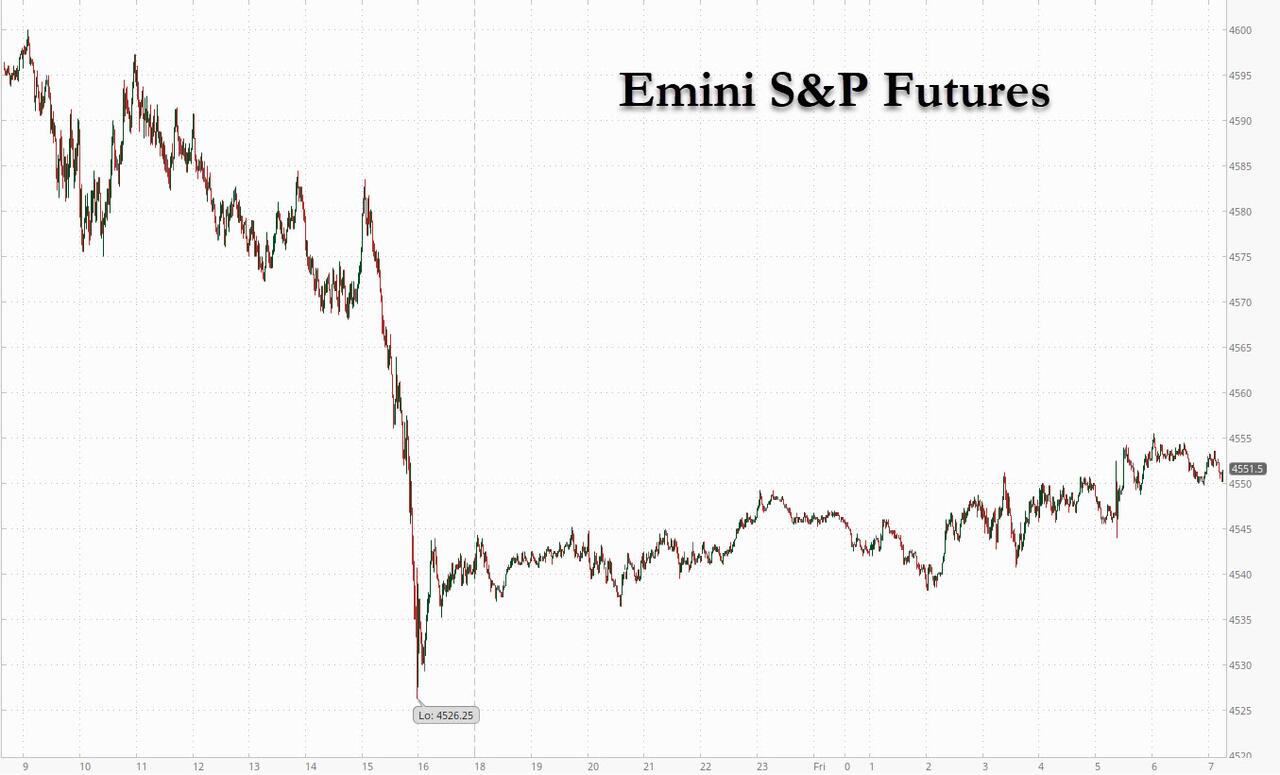
SPX futures, while still above critical support, also show similar signs of weakness.  Thus far they have managed to stay above the 50-day Moving Average at 4426.50, but once beneath that level, may spin out as well.

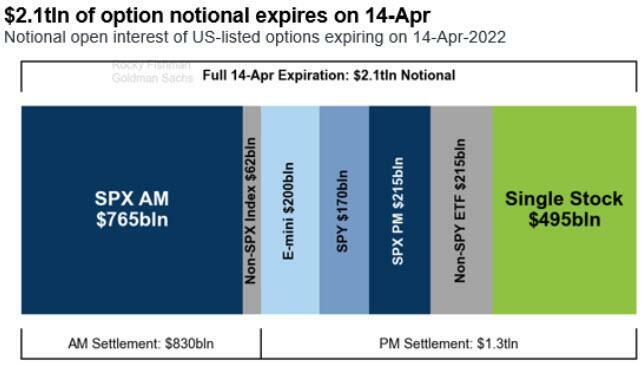
Today’s a.m. expiring options must settle near 4450.00 for Maximum Pain.  The majority of today’s options expire in the morning.  The p.m. options show Max Pain at 4430.00, but are considerably lighter, most likely in deference to Passover and Good Friday.

ZeroHedge reports, “US index were flat on Thursday, reversing earlier gains sparked by hopes of imminent easing in China, as investors turned their attention to the ECB which is set to maintain its speedier withdrawal of stimulus, data on retail sales and unemployment claims, and a barrage of earnings from Goldman Sachs, Morgan Stanley, Citigroup and Wells Fargo, and all of this happening as $2.1 trillion in options are set to expire (since tomorrow is a holiday).

At 7;00am ET, S&P futures were unchanged at 4440, Nasdaq futures were down 0.1% and Europe’s Stoxx 600 rose 0.2%. Asian stocks rose after China again indicated looser monetary policy is on the way. Treasuries extended gains as investors dialed back aggressive bets on Federal Reserve interest-rate hikes. The yen bounced from a two-decade low against the dollar. The greenback slipped after snapping its longest winning streak since 2020. Oil fell. Twitter shares soared after Elon Musk offered to buy the whole company for $54.20.”


VIX futures remain flat above the mid-Cycle support at 21.23.  Today’s Cycles Model shows little trending strength, but it may return over the next two weeks, leading into a probable Master Cycle high by the end of April.

YahooFinance restates, ” (Bloomberg) — Strap in for spikes in the S&P 500 index’s so-called “fear gauge” now that the Federal Reserve has flipped from being a friend to something more akin to a foe to markets as it tightens monetary policy.

That’s in essence the view from strategists at Bank of America Corp. for the Cboe Volatility Index, a gauge of implied equity swings for the S&P 500.

“High and persistent inflation is turning the Fed from a suppressor of vol and source of returns to a source of vol and suppressor of returns,” BofA strategists including Nitin Saksena and Riddhi Prasad wrote in a note. They added this kind of backdrop “skews our outlook for equities negatively.”


The NYSE Hi-Lo Index made a probable Master Cycle high of only 58.00 on Tuesday, day 257.  A lower high in this indicator is not a good sign.


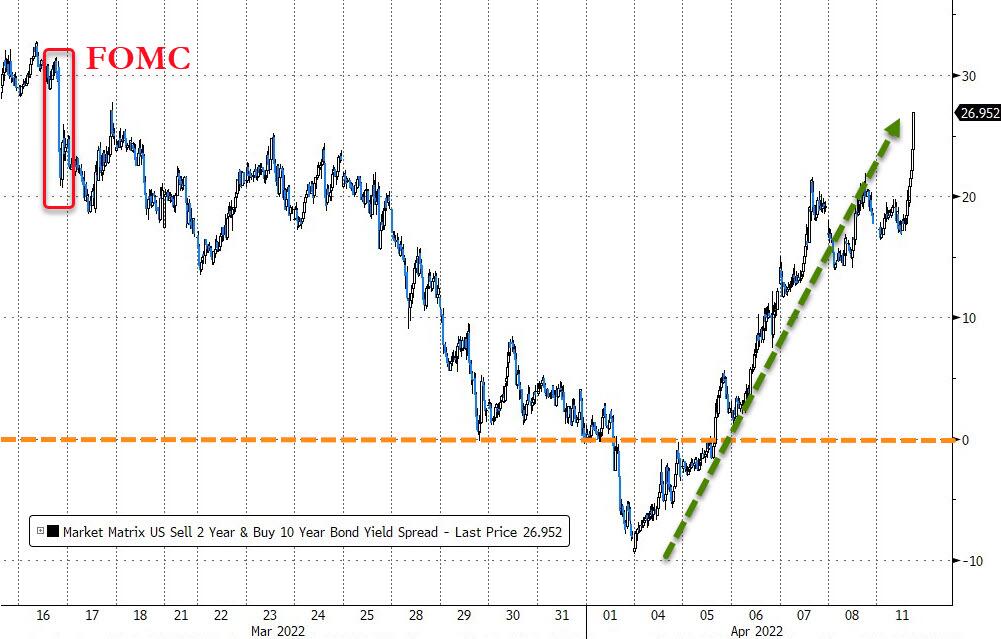
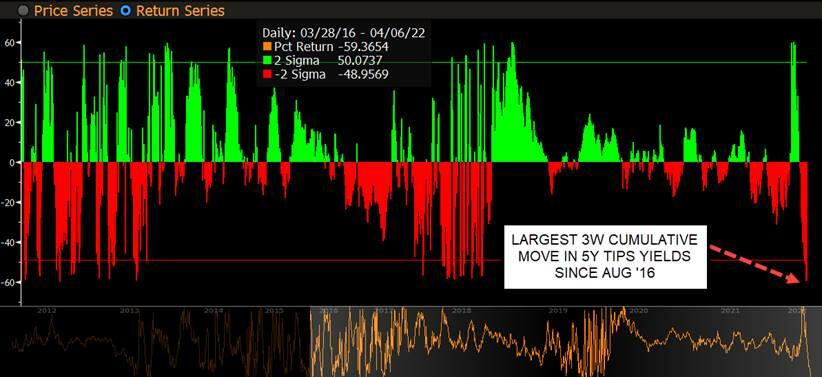
TNX may be finishing a shallow retracement as the Cycles Model suggests a return of the rally with strength early next week.  In addition, it may be due for a Master Cycle high by the end of next week.

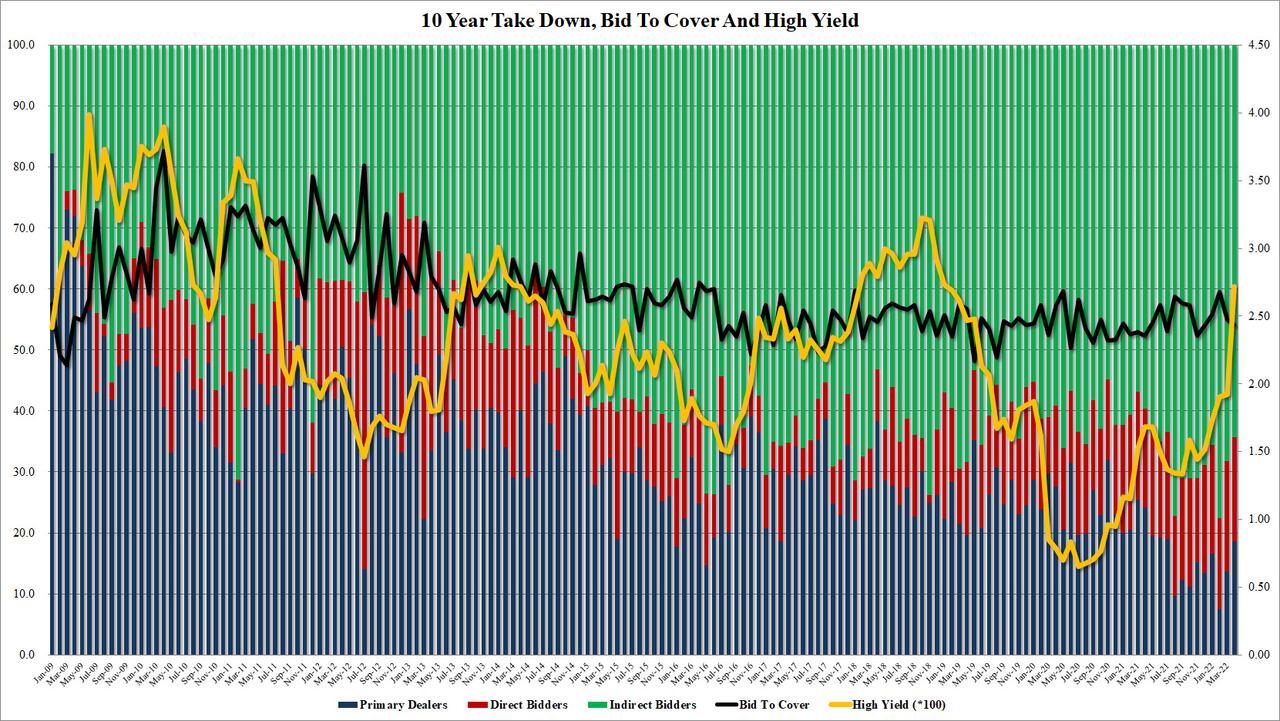
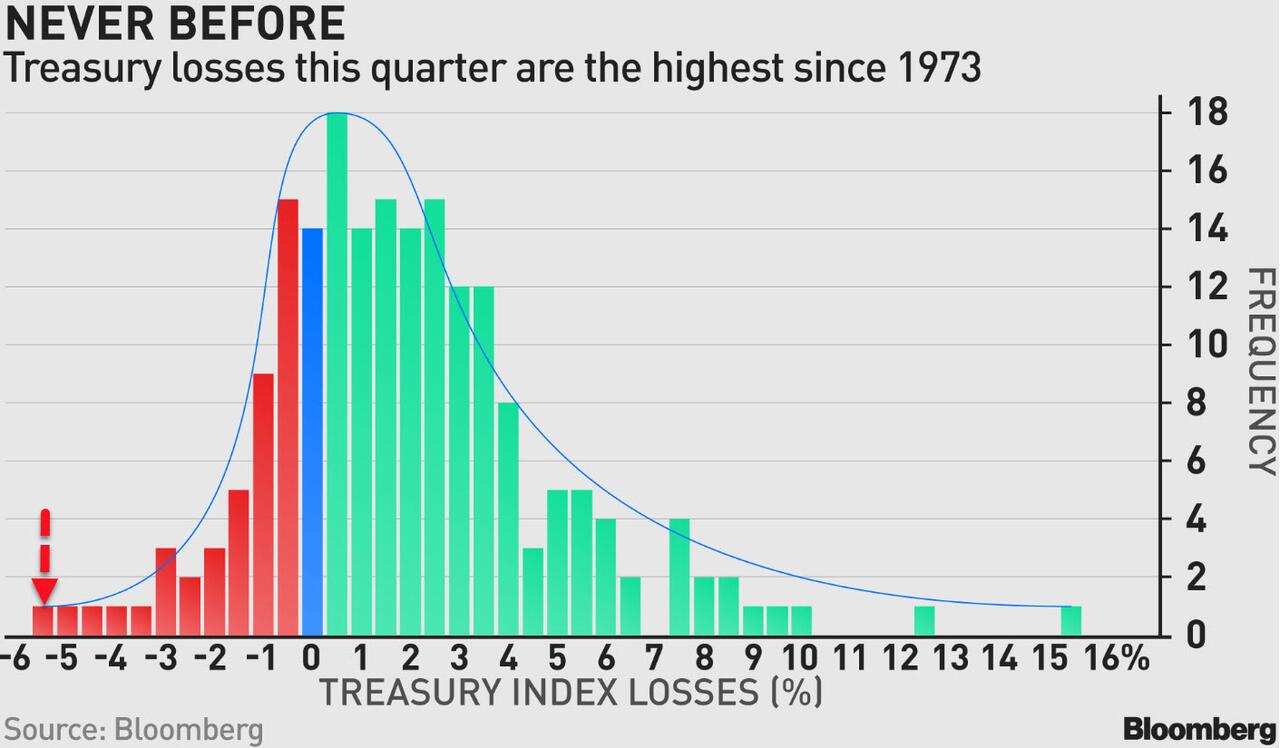
ZeroHedge reports, “Ahead of today’s last-for-the-week coupon auction, we asked if following yesterday’s unexpectedly ugly 10Y reopening which tailed more than 3bps following a 12bps intraday rally, we would see another chunky tail thanks to today’s repeat rally.

Then, just a few moments later we got the answer, and while not quite as “chunky” as yesterday’s 10Y, we did get another tail in the 30Y: with the auction stopping at a high yield of 2.815%, the highest since May 2019 and 44bps higher than last month, this was a 0.9bps tail vs the 2.806% When Issued. And while the auction was certainly uglier compared to last month’s 2.4bps stop through, it was nowhere near as bad as February’s disaster when as a reminder the 30Y tailed by a record 10.6bps during the initial market shock following the Fed’s furious repricing of rate hike expectations.

The bid to cover of 2.30 was below average, and sliding from 2.458 last month it was also below the six-auction average of 2.32%.”


USD futures appear to be consolidating in range this morning after making a probable Master Cycle high on day 257.  The “Top is In” at the point that USD declines beneath the Cycle Top support at 99.37.

ZeroHedge remarks, “Ever since Zoltan Pozsar started echoing Zero Hedge circa 2010, and in note after feverishly-drafted note, the former NY Fed repo guru has been writing about a coming monetary revolution in which commodity-backed currencies such as the yuan become dominant and gradually displace the world’s reserve currency – the US Dollar – which slowly fades into irrelevancy in a world where commodities are the fulcrum asset and where paper wealth is increasingly meaningless, there have been three reactions: i) those who have no idea what Zoltan is writing about (that would be about 98%), ii) those who agree wholeheartedly and believe that the USD should be dethroned as a reserve currency yesterday, and iii) those who are just a little bit “displeased” with all the attention the strategist (who has correctly called every major crisis and turning point in markets in the past decade) is getting and are starting to lash out at his stream of consciousness.

Rabobank’s Michael Every, himself a geopolitical status quo skeptic yet clearly misaligned with Zoltan as to what happens next (and in reality a believer that the broken system we have now will be the broken system we have for a long, long time to come), is in group three, and following a handful of “subtweet” shots across the Zoltan bow (which have barely registered in the financial media, especially Bloomberg, which Every continuously mocks yet reads religiously) the Rabobank strategist has (bravely) penned the closest thing to a Pozsar rebuttal we have seen.”


Crude oil may be consolidating between the 50-day Moving Average at 100.05 and Intermediate-term resistance at 104.82, going no higher than 104.16 thus far.  Should it go higher, it still has overhead resistance at the Cycle Top at 108.06.  Today is day 258 of the existing Master Cycle.  Should WTIC stall at or beneath the Cycle Top, we may see prices go lower.


Posted in Published | Comments Off on April 14, 2022

April 13, 2022

9:40 am

BKX is making new lows lest than a week after making its Master Cycle low. This is unusual, but may be anticipated in a slingshot move (lower).  We may see another test of the Lip of the Cup with Handle formation as mixed earnings results are announced.  However, the new Master Cycle may run through the end of June before breaking higher.  This is a proxy for market liquidity and a good indicator of what may be coming over the next two months.

ZeroHedge reports, “irst quarter earnings season has officially started with JPM reporting Q1 results which were somewhat mixed (top-line beat, EPS miss) thanks to strong trading offset by weaker than expected IB revenues. The company’s net interest income outlook was also raised for full year 2022 to $53BN from $50BN, and just to make sure that investors were happy, the bank announced a new $30BN share buyback, which perhaps was meant to cover up the fact that JPM reported an unexpected $524 million loss “driven by funding spread widening” as well as “credit valuation adjustments relating to increases in commodities exposures and markdowns of derivatives receivables from Russia-associated counterparties.”

Starting at the top, JPM reported total adjusted revenue of $31.59 billion, above the exp. of $31.44BN resulting in EPS of $2.63, just missing the 2.73 consensus estimate, the lowest earnings since Q2 2020.”


8:25 am

Good Morning!

NDX futures rose overnight to 14092.30 in as weak retracement.  Normally, we would see a retracement ot the 50-day Moving Average at 14329.62.  The weakness appears profound, possibly due to the short gamma effect.

ZeroHedge observes, “Last weekend, when looking at the latest JPMorgan Prime Brokerage data, we noted that the “pain trade” remains higher as unlike retail, hedge funds have been selling every rally aggressively with the largest US bank seeing “net selling in 8 of the past 9 days,” during which stocks have staged a torrid rally.

At the same time, we also observed that the bulk of the recent market meltup has been on the back of a massive short squeeze and covering of puts (creating a delta and gamma squeeze) which makes it especially difficult to predict what happens next as most if not all of the recent market meltup has been due to technicals and positioning, not fundamentals.

Still, we said that the simple conclusion is that that “either hedge funds will reverse their selling soon and jump on board the retail buying bandwagon (at which point it will again be time to short), or retail will run out of buying power amid the hedge fund-to-retail “distribution”, and stocks will tumble once again.


SPX futures rose to 4432.10 in the overnight session, then gave it all back in the premarket, declining back beneath 4400.00.  The Maginot Line for today’s options expiration is 4400.00.  While calls are marginally higher over 4400.00, puts prevail in volume beneath 4390.00.  The dealers and hedge funds supporting liquidity for this market are walking a very fine line…

ZeroHedge reports, “US index futures bounced, with Nasdaq 100 contracts halting a three-day drop, as investor attention turned to the start of corporate earnings season, which BofA dubbed the “Last big beat for a while” amid concerns over high inflation and slowing growth. Contracts on the Nasdaq 100 were up 0.4% as of 630 a.m. in New York, signaling a pause in the rout that wiped $1.6 trillion from the market value of technology behemoths in just over a week. S&P 500 futures and Dow futures gained 0.4%, with Asian stocks also rising even as Europe’s Stoxx 600 Index dropped; the selloff in U.S. Treasuries also eased with the 10Y yield flat at 2.72% while the US Dollar resumed its advance and the yen fell to a 20-year low as the growing gap between rising U.S. bond yields and perpetually low ones in Japan continued to pressure the currency. Oil rose after Russia vowed to continue the war in Ukraine and China partially eased Covid curbs. Bitcoin continued to trade on either side of $40K.”


VIX futures dipped to 23.13 late yesterday before  moving back to 24.14 this morning.  Should VIX not emerge above the 50-day Moving Average at 25.64 we may see an effort to suppress it back down to the mid-Cycle support at 21.21 to calm the equities market prior to the Easter weekend.  While the Cycles Model is unclear about direction over the next two days, the picture changes dramatically next week.

The NYSE Hi-Lo Index closed at -168.00 yesterday, clearly showing internal weakness.


TNX is consolidating in place, although that may soon change, as trending strength may prevail through the next week.  One reason for investors reluctance to sell stocks is that the “normal” rotation from stocks to bonds may be worse than simply staying in stocks, at least thus far.  It almost appears that there is a buyers’ strike in the 10-year Notes.

ZeroHedge reports, “Far uglier than yesterday’s 3Y auction, in fact far uglier than any 10Y auction in the past 5 years, moments ago the Treasury sold $34 billion in 10Y paper in a reopening auction at a high yield of 2.720%, 80bps above last month’s 1.92%, and a whopping 3bps tail to the 2.69% When Issued – the biggest tail on our record which goes back to 2016 – as buyers balked at purchasing the benchmark paper with yields trading near session lows following the “not as bad as expected” CPI print.

The bid to cover was also a disappointing 2.43, the lowest of 2022 and well below the 2.50 six-auction average.

The internals were likewise ugly, with Indirects taking down just 64.3%, the lowest since July 2021 and with Directs awarded 18.7% (the most since last July), meant Dealers were left with 18.0%, just modestly above the recent average of 16.7%.


USD futures have hit a new high at 100.51 this morning, as the final surge to the Master Cycle high winds up by the end of the week.


Crude oil is forging higher, to 102.42 this morning.  It appears to have made its Master Cycle low on Monday, day 255, in a flat correction..  The reversal closed above the 50-day Moving Average yesterday at 99.72, creating a buy signal.  Although there is no immediate pattern of strength, the new Master Cycle may run until the end of June.


Posted in Published | Comments Off on April 13, 2022

April 12, 2022

2:44 pm

SPX is now beneath 4400.00 and deeper in short gamma territory.  There may be a final push as high as 4471.00 made this morning to complete the corrective pattern in an expanded flat correction during Wednesday options expiration.  Once completed, the next move lower may take out the March 14 low.  Thursday may be aa different ballgame.

ZeroHedge comments, “One month after the March Fund Manager Survey was downright “apocalyptic” with the majority seeing a bear market and stagflation, and with optimism plunging to levels right before Lehman, today Bank of America published the latest, April FMS (available to pro subs in the usual place) in which the bank’s doom-and-gloomy Chief Investment Strategist Michael Hartnett found that his view is shared by even more Wall Street professionals, because the survey which polled 329 panelists managing $929 billion in AUM, found that global growth expectations plunged even more compared to last month, and dropped to fresh all-time lows (net -71%) …

… even as the percentage of those overweight equities remains stubbornly high (expect this number to slide in the coming weeks alongside stocks) and as BofA notes “The disconnect between global growth and equity allocation remains staggering.  Investors got slightly more bullish on equities. Though still at depressed levels, equities are nowhere near “recessionary” close-your-eyes-and-buy levels.” As a reminder, we first flagged this “rare disconnect” back in September, and since then it’s only gotten worse.”


8:00 am

Good Morning!

NDX futures bottomed out at midnight at 13897.90 before making a bounce.  This morning they have surpassed 14000.00 and may retest the 50-day Moving Average at 14330.93.  What was support two days ago may become resistance.  Should it surpass the 50-day, we may see a reprieve from the decline through the rest of the week.

Wednesday and Thursday are back-to-back options expiration days.  While Wednesday’s options expiration is light, Thursday’s expiration favors puts beneath 14150.00 and short gamma may prevail beneath 14000.00.

ZeroHedge notes, “Hedge fund positioning: Back to lows. 0%-tile

Equity long/short hedge fund leverage is back to mid-March lows. Gross and net leverage both fell about 3% since the end of March which puts both at the 0th %-tile on a 12M basis with gross at the lowest since May 2020 and net at the lowest since September 2020.

Source: JPM Prime Brokerage

Puke in a Pic

In N. America we’ve seen selling for weeks now and the 4wk net flows z-score is around a -3z level after touching as low as a -4z level in the middle of last week.

Source: JPM PB


The NYSE Hi-Lo Index closed yesterday at -245.00 at day 256 of the Master Cycle.  Regardless of the potential bounce today in share prices, a further decline in the Hi-Lo Index may indicate further weakness through the rest of the week.

ZeroHedge reports, “Having warned the world to expect “extraordinarily elevated” levels of inflation due to “Putin’s Price Hike”, The White House is likely in shock this morning as headline CPI rose 1.2% in March (vs +1.2% MoM) which sent the headline CPI up a shocking 8.5% YoY (vs +8.4% YoY exp and +7.9% prior) – the highest since 1981.

Source: Bloomberg

The 1.2% MoM rise is the biggest since Sept 2005 and CPI has risen for 22 straight months.

However, Core CPI (ex food and energy) rose just 0.3% MoM (below the +0.5% expected) and was up 6.5% YoY (above Feb’s 6.4% but below the +6.6% exp).

The shelter index was by far the biggest factor in the increase, with a broad set of other indexes also contributing, including those for airline fares, household furnishings and operations, medical care, and motor vehicle insurance.”

ZeroHedge comments, “On the basis that the CPI prints were “not as bad as they could have been”, US markets have reacted as if The Fed can step back from its hawkish stance and all will be well in the world.

Rate-hike expectations have eased modestly for the year… although the market is pricing in a 97% probability of 50bps hike in May(up from 92%)…


SPX futures also declined to 4387.20 by midnight, only to bounce in the morning back above 4400.00.  The 50-day Moving Average is at 4424.85 and may be challenged this morning.  Should it go higher, strong resistance lies at the mid-Cycle line at 4506.37.

This week’s shortened calendar brings heavy put and call positions every 50 points with calls edging out the puts above 4450.00 and puts prevailing beneath 4400.00 with very large positions on both sides up and down the scale.  this may be a difficult options week to evaluate.

ZeroHedge reports, “US index futures were flat on Tuesday, rebounding off overnight session lows as investors braced for red hot inflation data which the White House yesterday called “extraordinarily elevated” and which will likely boost the argument for aggressive monetary tightening – perhaps even a 75bps or intermeeting rate hike – despite a looming economic slowdown. Nasdaq futures were 0.2% higher, while S&P futures were flat after dropping as much as 0.5%.”


VIX futures rose to 25.36 at midnight, but have retreated since then, especially after the CPI print.  The Cycles Model allows the VIX to correct down to the mid-Cycle support at 21.19.  However, it indicates a probable explosion of strength over the weekend, suggesting a resumption of hostilities in the Ukraine during the Holy Week of Easter.


TNX pulled back this morning from its new high as it takes a breather.  The Cycles Model exhibits too much strength for a sustained or significant pullback for at least another week.


USD futures are consolidating within Monday’s trading range.  Today is day 256 of the Master Cycle A reversal may be made as USD crosses beneath the Cycle Top Support at 99.40.  It may happen at any time.


Posted in Published | Comments Off on April 12, 2022

April 11, 2022

2:18 pm

The Ag Index is approaching what may be a massive Head & Shoulders neckline at 571.00.  There is some argument that the neckline may be at the March high of 592.02, with a possible target closer to 950.00.  Regardless of the location, this possible formation cannot be ignored.

ZeroHedge observes, “Infant formula is in short supply as US retailers begin rationing. A combination of COVID-19-related snarled supply chains and a major baby formula recall earlier this year exacerbated shortages.

At least 29% of the top-selling baby formula products were out of stock by mid-March, according to an analysis by Datasembly, which tracked baby formula stock at 11,000 retailers.

“This is a shocking number that you don’t see for other categories,” Ben Reich, CEO of Datasembly, told CBS News.

“We’ve been tracking it over time and it’s going up dramatically. We see this category is being affected by economic conditions more dramatically than others,” Reich added. “

ZeroHedge notes, “Ukraine is one of the world’s top exporters of corn, sunflower oil, and wheat. Disruptions stemming from Russia’s invasion of Ukraine have stoked fears the war-torn country could experience a 50% decline in crop output this year, according to Bloomberg.

Forecast data from ag expert UkrAgroConsult show Ukraine’s corn output could be as low as 19 million tons, about half of last year’s 41 million tons.

UkrAgroConsult’s pessimistic outlook follows huge production uncertainties as farmers experience shortages of diesel and fertilizer and bombed-out infrastructure. ”


2:03 pm

SPX is testing te 50-day Moving Average at 4425.25.  It may bounce, but may not go far.  On the other hand, should it fall through support, the decline intensifies dramatically.

ZeroHedge remarks, “The major US equity markets have all extended losses this morning, breaking below key technical support levels.

S&P broke below its 200DMA (and is testing towards its 50DMA). Dow failed at its 100DMA and is testing down to its 50DMA. Nasdaq and Russell 2000 broke below their 50DMAs…

…all tumbling as the yield curve steepens dramatically back up to pre-March-FOMC levels (reminder, it is the un-inversion that sets the clock ticking on recession, not the inversion itself)…


7:50 am

Good Morning!

NDX futures lead the way down this morning making new lows at 14154.80 and declining.  It has declined beneath the 50-day Moving Average at 14334.34 and Intermediate-term support at 14219.45.  Although there is some support at the Cycle Bottom at 13630.30, the true target is likely to be The Lip of the Cup with Handle at 13000.00. While NDX is in short gamma territory beneath 14350.00, short gamma intensifies at 14300 and every 50 points beneath it. Thus, NDX may have hit the trip wire for a panic decline this morning.

ZeroHedge observes, “Two weeks ago, Goldman’s head of hedge funds sales Tony Pasquariello unexpectedly took a contrarian position to the conventionally bullish house view, warning that over the next few weeks, “he called the market lower.” So far he has been spot on, and stocks indeed are now lower than they were at the end of March as the retail driven melt up that started in mid-March has once again collapsed.

So what happens next? Well, it depends on whom one listens to: Goldman or Goldman, because while the bank’s traditionally permabullish chief equity strategist (for common consumption) David Kostin continues to push the bank’s retail clients to buy whatever Goldman has to sell, and as we noted on Friday, Goldman has been selling a lot…

… Pasquariello still refuses to jump on the bullish bandwagon, and instead in his latest Markets and Macro note says that while he is not yet ready to fully subscribe to the recession narrative, he is very close and adds that when all is said and done, “bulls are fighting uphill.”


SPX futures have collapsed beneath the 200-day Moving Average at 4492.82 and are headed for the 50-day Moving Average at 4423.65.  Today’s options expiration show a wall of (8573) puts at  4450.00.  Should SPX close beneath that level, a self-reinforcing panic decline may ensue.  To make matters worse, short gamma is deeply entrenched at that level for Thursday’s options expiration.  Markets are closed on Good Friday.

ZeroHedge reports, “US futures slumped on Monday amid renewed concerns around surging bond yields, high inflation and rising Covid-19 cases in China. Contracts on the technology-heavy Nasdaq 100 were down 0.8% by 7:15 a.m. in New York, with S&P 500 futures slipping 0.4% and Dow futures fell 0.2% after the French election revealed an outcome largely as expected with Macron facing Le Pen in the second round in two weeks…

… and as 10Y yield soared as high as 2.78% overnight, up almost 10bps on the day and the highest since 2019, with US yields briefly rising above China’s 10Y for the first time since 2010, before reversing some of the move.”


VIX futures rallied to a morning high of 23.10 and appears to be rising.  Trending Strength is especially strong today, suggesting VIX may make new highs.  The answer to the question of why the VIX Master Cycle low was extended to day 279 may be explained below.

YahooFinance relays:  (Bloomberg) — Ever since Barclays Plc halted sales and issuance of a popular stock-volatility product last month, it’s traded at a large premium to its underlying assets due to the sudden lack of supply.

But unexpectedly the exchange-traded note known as VXX has seen 20% of its shares redeemed since March 28 — instead of being sold in the open market at a higher price.”


TNX continues its advance with a triple measure of trending strength this week and extending to the Master Cycle high next week.  The Cup with Handle target may be within reach in the next week or so.

Mises.org comments, “The Federal Reserve states that it “conducts the nation’s monetary policy to promote maximum employment, stable prices, and moderate long-term interest rates in the U.S. economy.” However, let’s look at how well the Fed has done that job since its founding in 1913.

Economy and Long-Term Interest Rates

Since 1913, the US unemployment rate has ranged from 2.5 percent in the early 1950s to 25.0 percent during the Great Depression. Inflation has ranged from positive 24 percent to negative 16 percent. Inflation is currently 7.9 percent, well above the Fed’s 2 percent target. While the Fed has some influence over money supply, they have no control over money demand or how money is spent, which has a significant impact on employment and inflation.

The Fed’s goal to “moderate long-term interest rates” below free market levels is a form of price fixing. Since price fixing never works for long, it is no wonder the Fed has been unsuccessful in this goal. Since 1913, ten-year Treasury rates have ranged from 0.5 percent in 2020 to 16 percent in 1981. Interest rates have been much more volatile than before the Fed, as shown below.


USD futures are consolidating inside Friday’s trading range as it enters what may be the final highs this week.  Today is day 255 of the Master Cycle and USD did make 100.00 on Friday as suggested.  The Cycles Model infers some trending strength by mid-week, but a reversal may be imminent at any time.

ZeroHedge observes, “The dollar reserve system is facing its greatest threat yet.

Russian Finance Minister Anatoly Siluanov said on Saturday that the five BRICS countries – Brazil, Russia, India, China and South Africa  – could mitigate the backlash of Western sanctions against Russia on their economies by pooling their efforts and using a range of financial instruments at their disposal.

“The current crisis is man-made and BRICS countries have all the instruments necessary to mitigate its consequences for the national and global economies,” Siluanov was cited as saying by the Russian Finance Ministry.”


Crude oil futures made a new low at 92.95 this morning, extending the correction.  Today is day 255 of the Master Cycle and the last day of trending strength (down).  We may see a reversal by the end of the week, so stay on the alert.  The highest probability is a final decline to mid-Cycle support at 81.65 before the reversal.


Posted in Published | Comments Off on April 11, 2022

April 7, 2022

10:15 am

BKX ahs plunged beneath the Lip of the Cup with Handle formation and has entered a bear market with a 22% loss from the all-time high.  Today is day 262 of the current Master Cycle.  Should BKX not reverse here, this proxy of liquidity may show a serious strain on liquidity which may only get worse over the next 10 weeks.

ZeroHedge observes, “The second half of March came to an end and so did the meltup. Building on yesterday’s losses – as we detailed here – this morning’s breakdown has snapped all the major US equity markets below critical technical support levels.

The S&P is back below its 200DMA. The Dow and Russell 2000 are back below their 50DMA, and Nasdaq is rapidly accelerating down towards it 50DMA…

This comes as former NYFed President Bill Dudley issues another post-service op-ed warning that “If Stocks Don’t Fall, the Fed Needs to Force Them”…

It’s hard to know how much the U.S. Federal Reserve will need to do to get inflation under control. But one thing is certain: To be effective, it’ll have to inflict more losses on stock and bond investors than it has so far.”


9:59 am

The Ag Index is held beneath mid-Cycle resistance at 550.95 but may not remain there as Trending Strength is about to make a comeback.  The Cycles Model suggest very strong upward momentum through the end of April, starting tomorrow.  We may see ag prices double by the end of the year.

ZeroHedge reports, “America’s largest farmer cooperative sounded the alarm Wednesday about possible disruptions of fertilizer supplies from Russia due to Western sanctions on Moscow.

CHS Inc., the largest agricultural cooperative in the US, said in an SEC filing that it’s concerned about obtaining Russian fertilizer because of sanctions making it “more expensive and difficult to do business with Russia.” 

CHS warned that sanctions could “cause delays with respect to, or prevent, shipments of fertilizer to us, cause inflationary pressures on and impact our ability to purchase fertilizer, disrupt the execution of banking transactions with certain Russian financial institutions and result in volatility in foreign exchange rates and interest rates, all of which could have a material adverse effect on our business and operations.”


8:15 am

Good Morning!

SPX futures have been consolidating inside yesterday’s trading range, with a midnight low of 4458.80 and a morning high of 4500.40.  Having been repelled by the mid-Cycle resistance at 4503.91, it is now declining to test the 50-day Moving Average at 4418.38.  Options expiration for tomorrow shows SPX in short gamma beneath 4500.00 with the heat turned up dramatically beneath 4450.00.  The Cycles Model shows trending strength increasing on Friday which suggests a breakdown beneath supports.  It also shows a probable six weeks of decline.

ZeroHedge reports, “U.S. index futures edged higher, along with European shares, after the sharpest two-day drop in almost a month, as investors digested Federal Reserve’s hawkish path and were jerked higher by a fleeting moment of Ukraine ceasefire hope when Emini futures initially spiked to session highs on the following Reuters headline:

  • RUSSIAN FOREIGN MINISTER SAYS UKRAINE PRESENTED A NEW DRAFT AGREEMENT TO RUSSIA ON WEDNESDAY – IFX

… only to reverse the entire move two minutes later when the following headline hit:

  • LAVROV: UKRAINE PROPOSALS ON CRIMEA, DONBAS UNACCEPTABLE: IFX

Mini hiccup aside, S&P futures were about 0.1% higher at 4,481 while Nasdaq futures gained 0.5% to 14,574, signaling an end to a selloff in the underlying index that erased $850 billion in market value over two days.  Ten-year Treasury yields were flat around 2.61%, the dollar extended its rally to a sixth day, the longest streak in almost 10 months, and oil rebounded from yestereday’s IEA reserve release-driven plunge.”


VIX futures declined to a morning low of 21.54 and has bounced from mid-Cycle support.  The Cycles Model shows trending strength increasing this weekend (Friday, perhaps?) and gaining momentum through the end of April.

The NYSE Hi-Lo Index fell to -200.00, confirming an equities sell signal.

SeekingAlpha explains, “Summary

  • The VIX ETPs have quite a few quirks and as a result of these quirks and their high volatility, there are considerable risks for both longs and shorts.
  • From the 30,000-foot perspective, the big risk in being short volatility is that a big one-day VIX spike can theoretically destroy the value of your entire position.
  • While the number of VIX ETNs is dwindling, ETNs have their own set of issues, as these are debt securities – essentially a promise to pay the value of the underlying index – rather than a portfolio of VIX futures, as is the case with VIX ETFs.”


TNX continues making new highs this morning.  Normally we may see a pullback to Cycle Top support at 22.96.  However, TNX trending strength comes roaring back on Monday and continues through the end of the Master Cycle shortly after options expiration, suggesting a very short correction, if any.

ZeroHedge explains, “Everywhere we look we see short gamma – TLT edition

TLT is trading around the max short gamma pain level. Expect more erratic moves…

Source: Nomura


USD futures made a new overnight high at 99.85 before easing back.  USD is in the final stage of its Master Cycle with a potential 5 days left.  The potential target for this move may have a minimum of 101.00 and may go as high at 105.00.


Crude oil made a new low at 95.47 before bouncing to test the 50-day Moving Average at 98.83.  The Cycles Model suggests increasing downward momentum through April options expiration.   Wave C may equal Wave A near its trendline at 70.00.  A panic decline may go to the Cycle Bottom at 55.17.

ZeroHedge reports, “Western oil majors have quit Russia altogether, taking billions of dollars in vague impairment charges on Russian energy assets, and now comes the hard math. This morning energy giant Shell Plc said that it will write off between $4 and $5 billion in assets in a first-quarter 2022 outlook.

Thursday’s announcement provides investors with an early glimpse at the costs of fracturing global supply chains for oil majors following Shell’s decision to exit Russia after the invasion of Ukraine.

“For the first quarter 2022 results, the post-tax impact from impairment of non-current assets and additional charges (e.g. write-downs of receivable, expected credit losses, and onerous contracts) relating to Russia activities are expected to be $4 to $5 billion,” Shell said. 

“These charges are expected to be identified and therefore will not impact Adjusted Earnings,” it continued. 

The charge surpasses the company’s earlier estimate of $3.4 billion worth of oil-producing assets in Russia.

On a similar note, ZeroHedge observes, “Since Russia invaded Ukraine, many Western countries have banned Russian crude imports. Now, however, countries and companies are shunning the use of Russia’s massive fleet of oil tankers, which has driven up tanker rates, according to Bloomberg.

Shipping analyst Peder Nicolai Jarlsby at Oslo-based Fearnley Securities wrote that Sovcomflot PJSC, a state-controlled company with the largest Aframax-class fleet in the world, has been shunned by global oil traders. The result is fewer oil tankers available to haul crude, which has pushed up tanker rates.

Rising freight costs add to inflationary headwinds for the energy market that will only boost costs for refineries and, in return, continue to increase the costs for producing crude products, such as gasoline and diesel.


Posted in Published | 3 Comments

April 6, 2022

2:15 pm

FOMC Minutes Signal Bigger, Faster-Than-Expected QT, Multiple 50bps Hikes

ZeroHedge explains…

…and there it goes…

2:00 pm

SPX bounced at 4460.00 to retest the mid-Cycle resistance at 4503.96.  There is a likelihood that dealers and hedge funds supporting the options market may attempt to keep SPX elevated above the short gamma zone at 4500.00 through closing.  A close beneath that level may create a bloodbath in the options market.  Be aware of the dynamic that may cause a panic decline.

ZeroHedge comments, “The recent rally in stocks is, macro-wise, incoherent with what has been happening in financial conditions. Specifically, the 1w change in TIPS 2s10s curve was just the largest impulse flattening since the US debt downgrade in Aug ’11 and Dec ’08, while the cumulative 3 wk move in 5Y TIPS yields is the largest since Aug ‘16…

…along with tighter FCI and higher Rate Vol…all while Equities iVol has collapsed…

But, as Nomura’s Charlie McElligott points out in a note this morning, this sudden “shock tightening” in Financial Conditions – as Real Yields are exploding higher (5Y TIPS Yields from -1.66 to current -0.59bps over the past 3 weeks!) – is allowing “macro truths” to finally override recent “bullish” mechanical flows in Equities.”


10:30 am

NDX has declined beneath Short-term support at 14530.00 and may threaten the 50-day Moving Average at 14343.00 soon.   It is declining into short gamma which may make the decline self-reinforcing.  Watch what happens at the 50-day.

ZeroHedge remarks, “The second half of March came to an end and so did the meltup. Building on yesterday’s losses – as we detailed here – this morning’s breakdown has snapped all the major US equity markets below critical technical support levels.

The S&P is back below its 200DMA. The Dow and Russell 2000 are back below their 50DMA, and Nasdaq is rapidly accelerating down towards it 50DMA…

This comes as former NYFed President Bill Dudley issues another post-service op-ed warning that “If Stocks Don’t Fall, the Fed Needs to Force Them”…


9:45 am

GKX is wavering between mid-Cycle resistance at 551.00 and Intermediate-term support at 541.90.  However, the Cycles Model suggests a powerful breakout by the end of the week and extending through the end of April.  As mentioned previously, the minimum target appears to be over 800.00 over the current Cycle and may exceed 1000.00 by the end of the year.

ZeroHedge explains, “The EU is expected to deliver another shock to its agricultural sector by capping Russian imports of potash, a crucial ingredient for growing food, according to Bloomberg, citing a Dow Jones report.

The European Commission is expected to imminently unveil broad new sanctions on Russia. Much of the fertilizer is purchased from Belarus; the landlocked country in Eastern Europe could also be slapped with new sanctions for its involvement in Russia’s invasion of Ukraine.

Potash is a key ingredient for agricultural fertilizers. Europe produces only a negligible amount of the fertilizer, and to potentially cap imports from Russia and or Belarus (top producers) seems idiotic for Europe as the spring planting season is only beginning.

Even if Europe were to rework its supply chains to import potash elsewhere, only a few other countries would export it. The impact of capping imports will send prices even higher and create fertilizer shortages for crops. This can dramatically affect crop harvests at the end of the growing season. ”


8:20 am

Good Morning!

NDX futures are making new lows, having declined beneath the April 1 low at 14723.00.  It may have broken its trading range and descended into short gamma territory and, should it not reverse course, may decline into a doom-loop panic Cycle ending after May options expiration.

ZeroHedge remarks, “Beware the negative earnings revision

Earnings revisions just about to turn negative (so far disguised by commodity upgrades). Credit Suisse shows that in 71% of the times when earnings revisions turn negative the equity market falls (this measured as over the following quarter). (Credit Suisse Equity strategy)

NASDAQ – what was gained is now lost

Our main take remains intact, this market needs to consolidate before anything new big can take place. NASDAQ futs remain trapped in the 15200-14600 range for now. We are not getting short term excited until we break that range. Longer term, the 100 crossing the 200 day moving average isn’t overly bullish, although last time it happened was close to lows in late 2018 (chart 2).”


SPX futures have broken beneath mid-Cycle support at 4503.33 and is now threatening to break the 200-day Moving Average at 4489.23.  Today’s expiring put options may be exploding, since SPX is now in short gamma territory.  The sell signal is confirmed.

ZeroHedge reports, “There is a scene in My Cousin Vinny where Joe Pesci’s puzzled wannabe-lawyer character asks the judge if he was really serious ’bout dat.

On Tuesday and overnight, incredulous algos and 15 year old hedge fund managers had a similar question to the Fed about its market-crushing, rate-hiking intentions, after yesterday the Fed’s in house permadove and Hillary Clinton donor, Lael Brainard, shocked markets when she not only made the case for accelerated rate hikes but also a faster balance sheet drawdown after she said that curbing inflation is “paramount” and the central bank may start trimming its balance sheet rapidly as soon as May.

As a result, investors once again feared out that a more restrictive U.S. central bank could end up tipping the world’s largest economy into a downturn, or even a recession, something which is now Deutsche Bank’s base case for 2024. The virus resurgence in Asia and the war in Ukraine are also clouding the outlook for prices and growth.”


VIX futures leaped above the mid-Cycle resistance at 21.14  to a morning high of 23.43, confirming its buy (SPX sell) signal.  This may be the beginning of a nasty short squeeze in the VIX, especially should it rise above 25.00 where gamma turns seriously long.  It’s ironic that the SEC has approved the re-opening of the short-VIX ETFs in the past couple of weeks.

ZeroHedge remarks, “Remember the “good” old VIX days?

Remember when VIX’s “natural floor” or as quant analysts would call it “longer term average” was around 13/14? The VIX has trended higher over the past 5 years, despite the Fed expanding the balance sheet. You get the point, VIX is “distorted”. Let’s see what happens when they start the “rapid pace” reduction…

Source: Refinitiv

The disturbing trend in VVIX

VVIX and VIX are long term mean reverting assets, but they undergo structural shifts as well. Ever since Fed restarted the presses in 2019, the VVIX has traded well bid, trending higher. VVIX is down from recent highs, but let’s see what happens when the BS starts shrinking and volatility is already distorted.”

Source: Refinitiv


TNX gapped above its current trend channel, suggesting it may be making a running (irregular) correction.  This suggests a move that may be beyond “normal” expectations.  That is why it is important to pay attention to predictive formations, such as the Cup with Handle, which advises the 10-year yield climbing above 3.00 in a very short period of time.

ZeroHedge observes, “The inversion of the two-year and ten-year yields creates more problems for the Fed and the financial markets than for the economy.

That’s because the yield curve inversion has occurred at a relatively low level of interest rates, far too low to slow final demand and squash inflation pressures.

History shows that yield curve inversions offer an accurate negative view of the economy’s future path only when accompanied by a level of interest rates that prove prohibitive. In the past, restrictive interest rates were when the federal funds rate and market rates equaled or exceeded the growth in nominal income.

Notably, that is not the case today. On the contrary, it’s the exact opposite. A record gap exists between Nominal GDP growth of 10% in the past year and the current fed funds of .5%. There is even a record spread between Nominal GDP and two and ten-year yields of around 2.5%.

Yield curve inversion at low-interest rate levels is a nightmare for the Fed.”


USD futures rose to a morning high of 99.74, breaking through the prior high at 99.43 before easing lower.  The current Master Cycle still has a week to go, so the target of “above 100” remains valid until a reversal signals the end of the Master Cycle.


West Texas Intermediate Crude futures may be consolidating today, making neither a new high or new low.  However, the Cycles Model suggest weakness over the next week as the current Master Cycle comes to a close.  A lot may happen in a week’s time, especially when monthly options come due.  The average decline in Wave C may equal the length of Wave A, putting WTI near the mid-Cycle support at 81.25.  Should a panic ensue, crude may decline down to the Cycle bottom at 55.11.

ZeroHedge remarks, “Three weeks ago in mid-March, in the latest confirmation of Zoltan Pozsar’s prediction that commodity trading giants are caught in a “Margin Call Doom Loop” (see Pozsar: “We Could Be Looking At The Early Stages Of A Classic Liquidity Crisis“) Wall Street was stunned to learn that commodity trading houses had – in their view – become “too big to fail” and the European Federation of Energy Traders, a trade body that counts BP, Shell and commodity traders Vitol and the margin-call stricken Trafigura as its members, said the industry needed time-limited emergency liquidity support to ensure that wholesale gas and power markets continued to function.

Translation: the world’s largest commodity traders were calling on governments and central banks to provide a bailout in the form of “emergency” assistance to avert a cash crunch as sharp price moves triggered by the Ukraine crisis strained commodity markets and sparked massive margin calls across the industry.

However, as we noted at the time, it wasn’t immediately clear if central banks would come running to the commodity giants’ rescue. As the FT notes, “some may be reluctant to help trading firms that often make large profits from shifts in commodity prices.” However, senior ECB officials are keeping a close eye on global commodity markets, and as ECB vice-president Luis de Guindos said last week, derivatives, including commodity derivatives, were a very specific market that we are looking at very carefully.

Ultimately, central banks made a decision last Friday afternoon, when a Bloomberg headline briefly flashed only to be buried in the usual firehose of Ukraine news and fake news:

  • *ECB TURNS DOWN ENERGY TRADERS PLEA FOR FUNDING SUPPORT”


Posted in Published | Comments Off on April 6, 2022

April 5, 2022

8:15 am

Good Morning!

SPX futures made a 78.6% retracement yesterday, then started easing down in the overnight market.  For tomorrow’s expiring options, Max Pain is at 4570.00.  It is bounded by long gamma at 4600.00 and short gamma at 4500.00.  The Cycles Model shows trending strength reappearing today and Friday.  Should SPX decline beneath mid-Cycle support at 4502.40, the trend will be down.

ZeroHedge reports, “After initially trading sharply higher around the European open, US stock futures dropped to session lows as traders digested the latest developments in the Ukraine war, including a EU proposal to ban Russian coal imports, the same coal which we profiled yesterday as hitting record highs on lack of Russian supplies and where Russia accounts for nearly half of all European coal imports… it makes one wonder if Europe can’t stop, won’t stop until it commits energy suicide.

In any case, S&P500, Nasdaq 100, and Dow Jones futures all fell 0.3% each, with Bloomberg adding that the European Commission is also expected to propose banning most Russian trucks and ships from entering the bloc, although the EU isn’t planning to sanction oil or gas for now.”


VIX futures rose above 19.00 after extending its Master Cycle low to day 279.  The lengthy Cycle may be attributed either to dealers and hedge fund attempting to push the SPX higher through the back door or it may be a huge influx of retail investors buying the short VIX ETFs.  In either case, someone will be burned.  The Cycles Model suggests a rally in VIX through the end of the month is imminent.


TNX is marching higher as it may touch the rising trendline above 25.00 before the final retracement down to the Cycle Top support at 22.50.   This move may happen yet this week, as trending strength comes roaring back next week.


Posted in Published | 1 Comment

April 4, 2022

1:45 pm

SPX has made a 52% retracement and may  turn down at any time.  Investors may short the SPX beneath 4500.00.

ZeroHedge advises, “We have perhaps seen the end of the recent meltup as Nomura warns markets are suffering from some “macro fatigue”…

…and BofA confirmed in a trading desk note this morning that “our model’s S&P 500 short could be fully covered…” adding that “we are in the late-stages of a short-cover-rally as the implied vol spike in heavily-shorted names has started to fade…”


10:07 am

The GSCI Ag Index appears to be holding at Intermediate-term support at 537.40 and may be about to resume its rally higher.  The next Master Cycle (high) may come at the end of April, giving it plenty of time and space to rally.  While no specific target is evident, the technical landscape suggests highs between 800.00 and 1000.00.

ZeroHedge observes, “Just days after Germany reported the highest inflation in generation (with February headline CPI soaring at a 7.6% annual pace and blowing away all expectations), giving locals a distinctly unpleasant deja vu feeling even before the  Russian invasion of Ukraine broke what few supply chains remained and sent prices even higher into the stratosphere…

… on Monday, Germany will take one step toward a return of the dreaded Weimar hyperinflation, when according to the German Retail Association (HDE), consumers should prepare for another wave of price hikes for everyday goods and groceries with Reuters reporting that prices at German retail chains will explode between 20 and 50%:


9:45 am

BKX is due for a Master Cycle low as early as today as it hits the Lip of the Cup with Handle formation.  It may mean a retest of the mid-Cycle resistance and trendline at 132.37.  There appears to be trending strength at the end of the week.  However, BKX is in a downtrend, suggesting the decline may resume very quickly in a potential phase-shift to a panic decline.  This juncture is very hard to define, so forgive my speculation if I am wrong.

ZeroHedge comments, “While his friend and fellow Democrat Larry Fink used his latest annual letter to cheer for an accelerating transition to ESG while simultaneously warning about the fallout from “de-globalization” spurred by Russia’s incursion into Ukraine, JPMorgan CEO Jamie Dimon warned Monday in his own annual letter to investors that the US economy faces “unprecedented” risks from the confluence of COVID pandemic, high inflation and, of course, the situation in Ukraine.

“They present completely different circumstances than what we’ve experienced in the past – and their confluence may dramatically increase the risks ahead,” Dimon said.”


7:45 am

Good Morning!

NDX futures rose to a weekend high of 14936.70, but has since eased back from the high.  In today’s options expiration, QQQ (Friday’s close: 361.85) prices beneath 360.00 favor puts, while short gamma may start as high as 355.00.  Calls dominate above 362.00, but call volume is thin, making it difficult to judge where positive gamma begins.  In all, QQQ/NDX are testing short gamma again.  This morning shares got a boost when Musk took a 9.2% stake in Twitter.

ZeroHedge reports, “After suffering tremendous losses in January and February, March was a very confusing month for hedge funds: as JPMorgan’s Prime Brokerage writes in its monthly note, the start of March was characterized by one of the largest de-grossing episodes among Equity L/S funds in N. America, along with quite significant net selling globally (especially in APAC), and resulted in some marquee names such as Tiger Global suffering massive losses.

So as markets closed out the month and quarter with a very sharp rebound in equities, most funds were again caught by surprise, while few are willing to embrace the recent move higher in risk as a persisting trend.”


SPX futures also got a boost, rising to 4556.70 before subsiding.  In today’s expiring options, Max Pain is at 4545.00.  SPX options turn negative at 4535.00 and short gamma resumes at 4500.00.  This confirms the next level of intensity in the decline beneath mid-Cycle support at 4501.42.  While options become positive above 4560.00, positive gamma doesn’t kick in until 4600.00.

Should SPX decline beneath mid-Cycle support, the trend becomes short.  The Cycles Model indicates increasing trending strength this week.

ZeroHedge reports, “US futures rose along with stocks in Europe and Asia, as corporate news took some of the focus off developments in the Ukraine war, where peace talks are expected to resume on Monday. Nasdaq 100 futures led gains among other gauges, climbing as much as 0.4% with S&P futures up 0.2%, while equities also rose in Europe. Twitter soared as much as 29% in premarket trading after Elon Musk took a 9.2% passive stake in the company. Tesla shares also rose after the automaker posted record first-quarter deliveries despite supply chain and logistical constraints, taking other electric-vehicle stocks higher as well.


VIX futures got a boost to a high of 20.74 over the weekend.  However, it remains beneath mid-Cycle resistance at 21.07.  Wednesday’s expiring options show Max Pain at 21.00, which explains the hesitancy to rise above mid-Cycle resistance.  Short gamma begins at 20.00, while long gamma begins at 25.00.  Should VIX rise above its mid-Cycle resistance, it may experience trending strength during monthly options expiration and in the final week of April.


NYSE Hi-Lo Index made its Master Cycle extended (272 days) high on Wednesday at 149.00.  The Hi-Lo issues a sell signal with a close beneath 0.00, with confirmation beneath mid-Cycle support at -59.33.  The Cycles Model suggests an upcoming Master Cycle low in about three weeks.  However, it may linger near the low through the end of the month.


TNX opened at the lower end of Friday’s trading range.  It may test the Cycle Top at 22.31 this week before a return of trending strength next week.  The Cycles Model suggests a Master Cycle high may be made the week after options expiration.


USD futures are rising out of their Master Cycle low last week to challenge the Cycle Top resistance at 98.96 today.  The Cycles Model anticipates a very short Master Cycle ending on or near April options expiration.  The intended target may be 100.00, or slightly higher.


Posted in Published | Comments Off on April 4, 2022

April 1, 2022

9:40 am

GKX appears to have had its Master Cycle low on Tuesday at 527.64 on day 263.  I had allowed for a deeper low as Wave C is equal to Wave A at 515.00.  However, corrections are modest in the strong Primary Wave [3].  The Cycles Model suggests the minimum target for the new Master Cycle may be 818.00 by the end of April.  1200.00 may be achievable by the end of the year.

ZeroHedge remarks, “Fertilizer prices are at record highs following Russia’s invasion of Ukraine puts massive pressure on American farmers to transition to crops that need less fertilizer.

Bloomberg survey found that farmers will plant 2 million more acres of soybeans and about 2 million fewer of corn. That’s because soybeans require very little fertilizer versus corn.

Fertilizer isn’t the only problem.  ZeroHedge reports, “An outbreak of the deadly strain of bird flu is quickly spreading across the U.S. The risk to humans is low, but bird flu could wreak havoc in the nation’s poultry industry ahead of Easter.

The United States Department of Agriculture’s (USDA) Animal and Plant Health Inspection Service (APHIS) announced on Wednesday that highly pathogenic avian influenza (HPAI) was detected in five new states.

  • A non-commercial, mixed-species backyard flock (non-poultry) in Berkshire County, Massachusetts;
  • A non-commercial, mixed-species backyard flock (non-poultry) in Johnson County, Wyoming;
  • commercial poultry flock in Johnston County, North Carolina;
  • A non-commercial, backyard chicken flock (non-poultry) in Franklin County, Ohio;
  • And a backyard chicken flock (poultry) in Kidder County, North Dakota.

According to Bloomberg, USDA data shows the bird flu has been found in 23 states in flocks totaling about 17 million birds up and down Mid-Atlantic and Northeast and across the Midwest.

Overseas, the situation is worse.  ZeroHedge observes, “The National Farmers’ Union has warned the UK is sleepwalking into a food security crisis. Soaring energy and fertilizer costs have led to an unprecedented situation where growers’ margins have collapsed, forcing many to halt growing operations.

Reuters says because of the inclement weather in the UK. Farmers grow cumbers, plant peppers, aubergines, and tomatoes in vast greenhouses. Greenhouses use natural gas for heat, but after last year’s surge in gas prices exacerbated by Russia’s invasion of Ukraine last month, the crops have become uneconomical to produce. ”


8:00 am

Good Morning!

SPX futures have bounced to an overnight high of 4560.40 before easing back.  The overnight bounce constitutes a 28% retracement, should that be the extent of it.  We will know more at the open.

Today’s expiring options show that puts dominate at 4550.00 and below, while calls become more numerous at 4570.00 and above with Max Pain at 4560.00.  It remains to be seen whether the dealers and hedge funds can maintain a sideways market today.

ZeroHedge reports, ” Following yesterday’s furious quarter-end puke, which saw the S&P tumble 50 points in the last hour of trading as a massive $10 billion Market on Close sell imbalance sparked a liquidation frenzy, U.S. index futures started off the new quarter on the right foot, rising as investors weighed a drop in oil prices sparked by Biden’s unprecedented pre-midterm election draining of the petroleum reserve, ongoing developments in the Ukraine war and tightening monetary policy ahead of ISM and payrolls data. S&P500 and Nasdaq 100 futures gained around 0.5% before March payrolls figures later on Friday, after U.S. stocks ended their worst quarter since the start of the pandemic. Europe’s Stoxx 600 gained after its worst quarter since the pandemic bear market. Oil reversed an earlier decline as euro-area inflation accelerated to another all-time high and Russia’s Gazprom PJSC started telling clients how to pay for gas in rubles. Treasury yields rose and the dollar was steady as traders await the jobs report, which unless it is a total disaster, will strengthen the case for a 50bps rate hike in May. U.S. data on Friday include nonfarm payroll and ISM data while no major company is expected to report earnings.”


VIX futures eased back to a morning low of 20.10, within yesterday’s trading range.  A rally above the mid-Cycle resistance at 21.05 produces a buy signal.  As I have mentioned over the past week, this is a good time to accumulate share of VIX derivatives.

Yahoo!Finance gives a reason for higher VIX prices, “The U.S. ETF market has an inverse volatility fund trading once again, more than four years after “Volmageddon” wiped out $2 billion in assets tied to the strategy.

The -1x Short VIX Futures ETF (SVIX) and the 2x Long VIX Futures ETF (UVIX) debuted on the Cboe Global Markets Wednesday with respective management fees of 1.35% and 1.65%.

The funds provide inverse and double the return on an index tracking short-term VIX futures over the course of a single day, making it a more targeted approach compared with the ProShares Short VIX Short-Term Futures ETF (SVXY) and the ProShares Ultra VIX Short-Term Futures ETF (UVXY) that provide inverse and 1.5x exposure to an index of first- and second-month VIX futures.”


TNX bounced up to 24.41 this morning as it continues its corrective pattern.  Trending strength may not return until options expiration week.  However, the correction may extend to the upper trading channel trendline.

ZeroHedge reports, “As brutal as the bond-market backdrop has been, losses in Treasuries may abate in the second quarter even as the Federal Reserve takes aim at quelling inflation that is running at a breakneck pace.

The odds of a repeat of the first-quarter selloff are approximately 1-in-30,000…

The Bloomberg Treasury Index incurred a loss of 5.91% since the start of the year through Tuesday, the worst in data going back nearly 50 years.

That represented a 2.5 standard-deviation move to the left — in itself an extreme probability in a normal distribution of returns that is confirmed by running the Kolmogorov-Smirnov test.

Fundamentals also suggest that losses may moderate.

ZeroHedge adds, “Shortly before the close on Thursday, the closely-watched 2s10s yield curve, better known as the recession harbinger, inverted again for the second time in three days, and this time it will likely fail to bounce as the US slides ever closer to its recession D-Day.”


USD futures rallied to an overnight high of 98.66.  USD may have given us a Master Cycle low on March 30 (Wave [iv]).  A double dose of strength may elevate USD to 100.00 by mid April in the new Master Cycle.


Crude Oil futures tested the 50-day Moving Average (97.68) by declining to 97.81 this morning.  The Cycles Model shows today as a day of trending strength, which may mean a further decline, as the trend may have turned down.  The next Master Cycle turn is approaching by mid-April.  A normal correction would terminate near the mid-Cycle support, where Wave C seeks equality with Wave A.  However, there are indications of trending strength, suggesting a panic decline as low as the Cycle Bottom support at 65.16.


Posted in Published | 5 Comments

March 31, 2022

7:00 am

Good Morning!

I am getting an early start because I am spending time this morning with three granddaughters, all under the age of 5.  Yikes!  I am “re-using” charts from yesterday afternoon, since StockCharts appears to be down.  Perhaps it is due to the mass coronal ejection that is hitting us this morning.  Our location is having a strong wind storm that is rattling the house and is due to bring in snow by the end of the day.

SPX futures retraced above the trendline overnight, hitting 4620.00 before giving up all of its gains.  It is currently in the red beneath the trendline and may be going lower.  Tomorrow’s op-ex shows Max Pain near 4550.00 with positive gamma at 4650.00 and short gamma beneath 4520.00.

The Cycles Model suggests a repeat performance for Wave (3) in time.  The decline into the Master Cycle low is scheduled to take 51 days, just as the prior decline did.  However, that is where the similarity ends.  Wave (3)s can never be the smallest Waves.  In the 2008 decline [SuperCycle Wave (a)], Waves threes were consistently 1.5 times the sized of Wave ones.   SuperCycle Wave (c) should be a multiple of SuperCycle Wave (a).  By all indications, Wave (3) may be triple the size of Wave (1).  The Cup with Handle target of 2542.00 agrees, in this case.

ZeroHedge reports, “US equity futures were muted and flat on the last trading day of the month and quarter, fading a modest overnight gain as the underlying index headed for its first quarterly decline in two years on worries about surging inflation, hawkish monetary policy and an economic slowdown. Contracts on the S&P 500 were down 0.1% at 730 a.m. ET while Dow futures were little changed and Nasdaq 100 futures rose 0.2%, while European stocks fell, heading for the first quarterly decline since 2020. Asian equities retreated on lackluster Chinese PMI data and regulatory concerns. Treasuries held gains with the 10Y yield dropping to 2.31% (from 2.50% earlier this week when the 2s10s inverted) and the dollar ticked up against almost all G-10 peers. Fed watchers will be focused on the PCE deflator, which may have sped up in February.”


VIX futures have been climbing steadily all night and are currently at 20.27.  Should the decline in SPX get underway we may see a sharp reaction from the VIX.  The first buy signal comes above the mid-Cycle resistance at 21.03, but you may wish to accumulate shares (ETFs or options) before that event.  The Cycles Model shows the new Master Cycle in the VIX peaking at the end of April.


TNX futures have declined to a low of 23.11 this morning, keeping in stride with a possible retracement to the Cycle Top at 21.89.  Why that level?  Wave threes often “walk” along the Cycle Top, once they have emerge above that support, due to the strength of that phase in the Cycle.  There may be a decline to the Intermediate-term support at 20.70, but I would lay odds that the Cycle Top will hold.

ZeroHedge observes, “Rates – big levels coming up

Consensus about yields spiking further is strong. In our thematic email, Ready for the rates reversal?, we pointed out some facts that the move higher in rates had the potential to reverse/take a pause. Since then rates have come down and are approaching rather big levels. Things could get “dynamic” should we see yields move slightly lower as we risk taking out rather big supports.

US 10 year – is that a reversal in the making?

Quick short term levels for the mighty US 10 year. First support for yields coming in around the 2.3% level. Note that the 21 day moving average is still way lower. Next big support is down at 2.05% where the 50 day comes in. Resistance is the recent high in the 2.5/2.55% area.”


Posted in Published | Comments Off on March 31, 2022