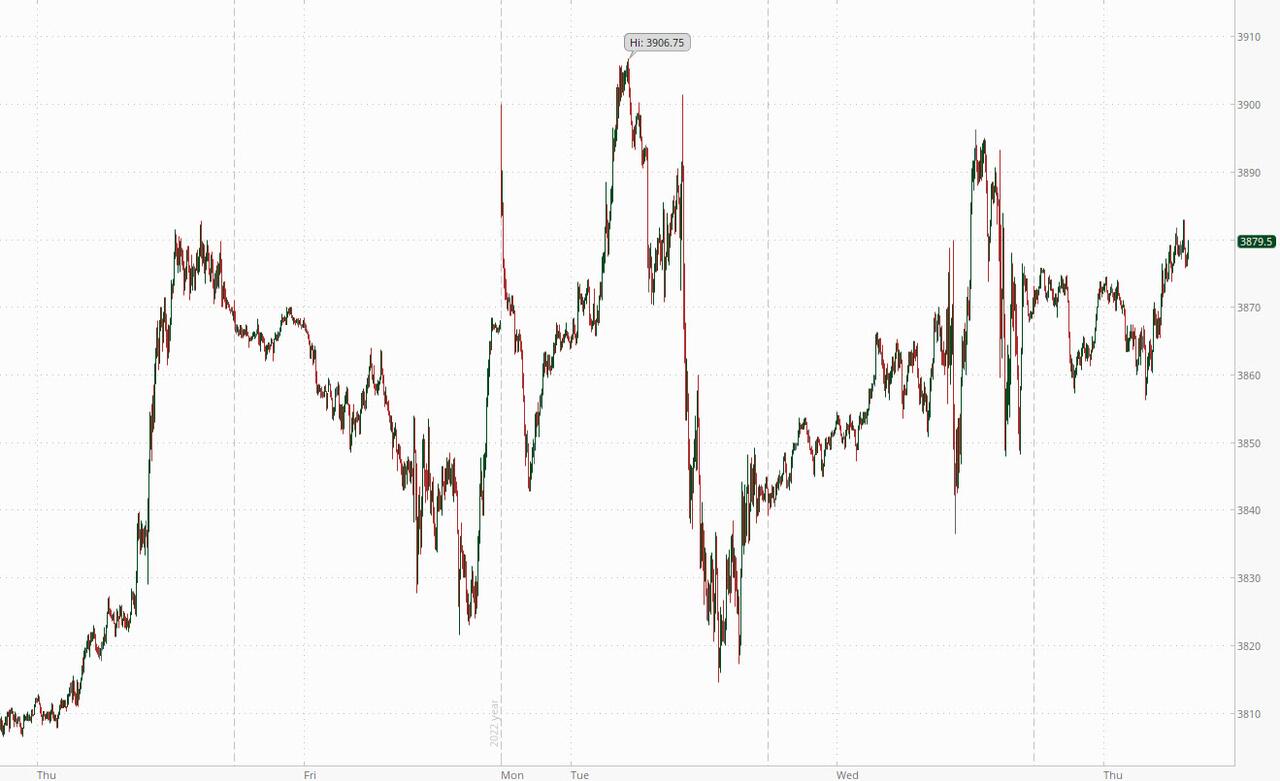
January 6, 2023

1:15 pm

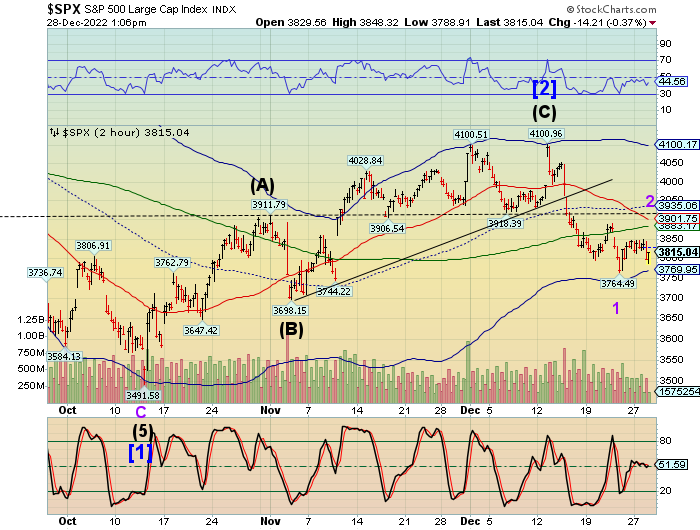
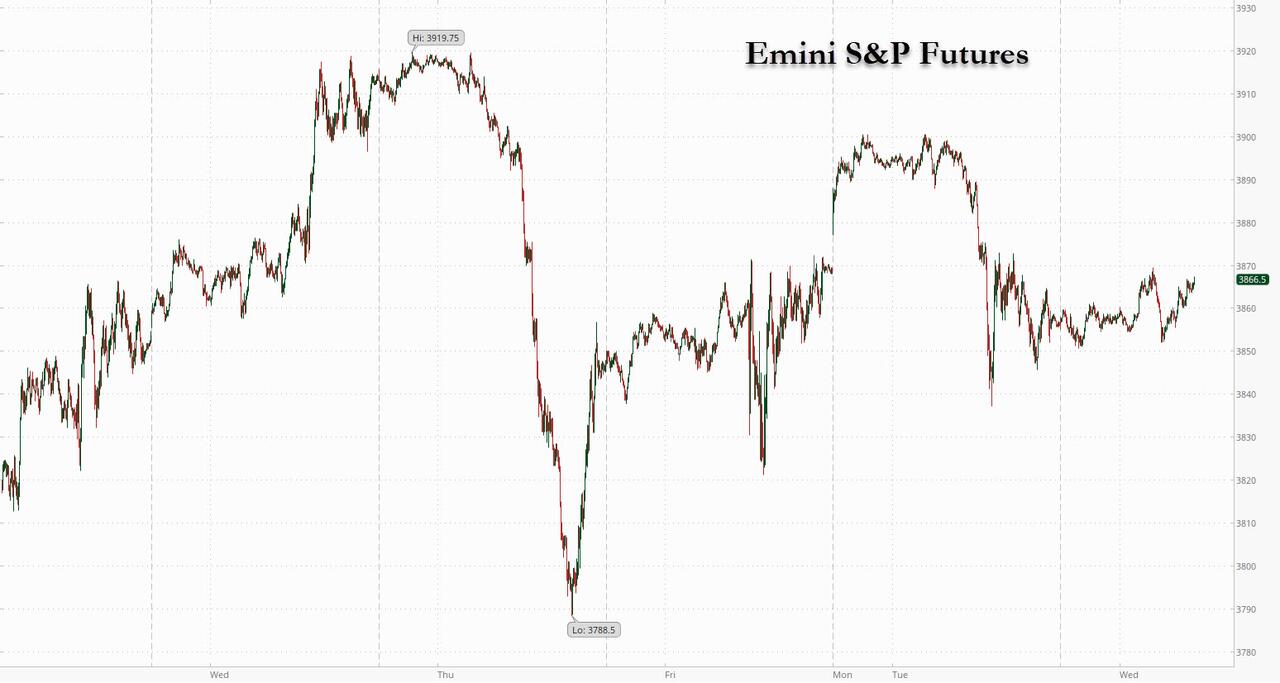
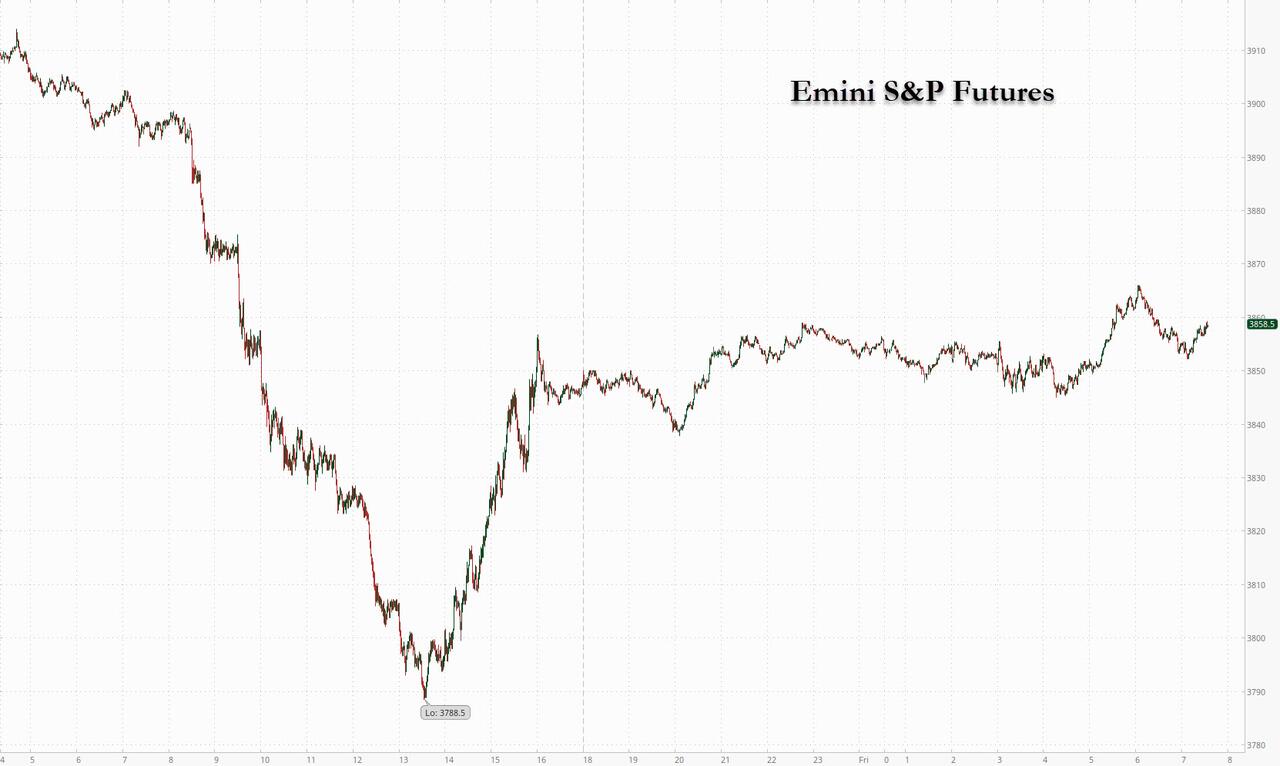
SPX made a new retracement high, but fell short of the 50-day Moving Average at this time.  It has the potential of a reversal here.  A Key Reversal may take SPX to or beneath 3800.00, so be prepared.  I have not given a buy signal since the retracement has been too choppy, although long.  The Triangle formation fits this description quite well and I have labeled it as such.


10:05 am

SPX gapped up to Short-term resistance at 3852.90, but failed to overcome it.  It has since declined to 3809.66 and is hovering between support and resistance.  Should Short-term resistance be overcome, the 50-day Moving Average and the Fibonacci 38.2% retracement lie at 3898.00.  The market is now focusing on weaker wage growth.


8:55 am

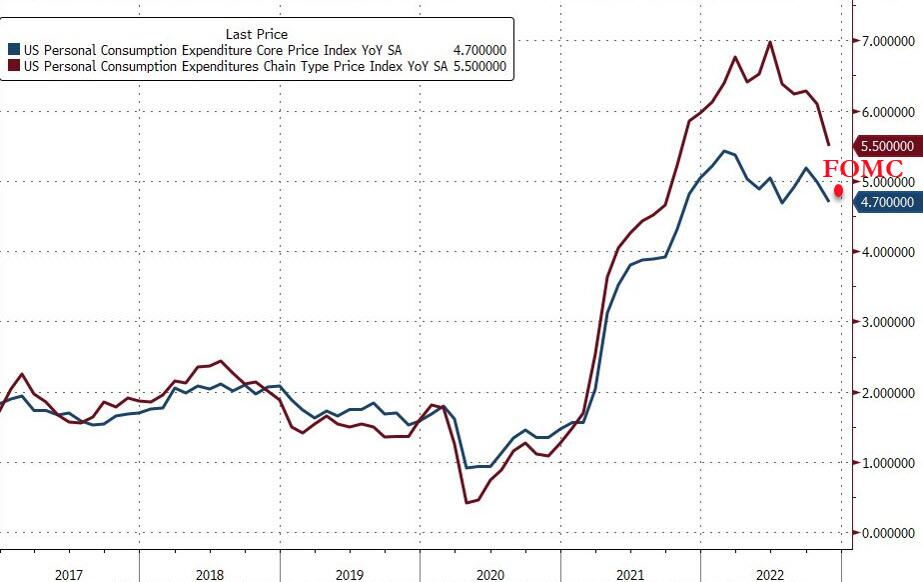
ZeroHedge analyzes, “There was a general sense of foreboding ahead of today’s jobs report, because as we wrote in our payrolls preview, several strategists noted that there was virtually no number that would be good for risk assets. As Goldman trader John Flood said, “whispers into December’s jobs print are creeping higher as we have already gotten 4 strong labor data points this week… We are still in a good data is bad for stocks set up but the new spin is that really bad data is also bad for stocks. AKA risk is skewed to the downside.” Meanwhile Bloomberg’s Heather Burke writes that the “median estimate for the change in non-farm payrolls is 202k versus a prior 263k and for the unemployment rate to stay steady at 3.7%. But the Fed’s own estimate is for the unemployment rate to shoot up to 4.6% this year. Until we get there, there is not going to be an alignment of demand with supply, which will compel the Fed to stay hawkish with no chance of a pivot.

So with that in mind, here is what the BLS reported moments ago:

In December, payrolls rose 223K, which was down from last month’s downward revised 256K and also the lowest since the negative December 2020 print, but was above the consensus estimate of 202K.”


8:40 am

BLS reports, “Total nonfarm payroll employment increased by 223,000 in December, and the unemployment rate edged down to 3.5 percent, the U.S. Bureau of Labor Statistics reported today. Notable job gains occurred in leisure and hospitality, health care, construction, and social assistance.”


7:45 am

Good Morning!

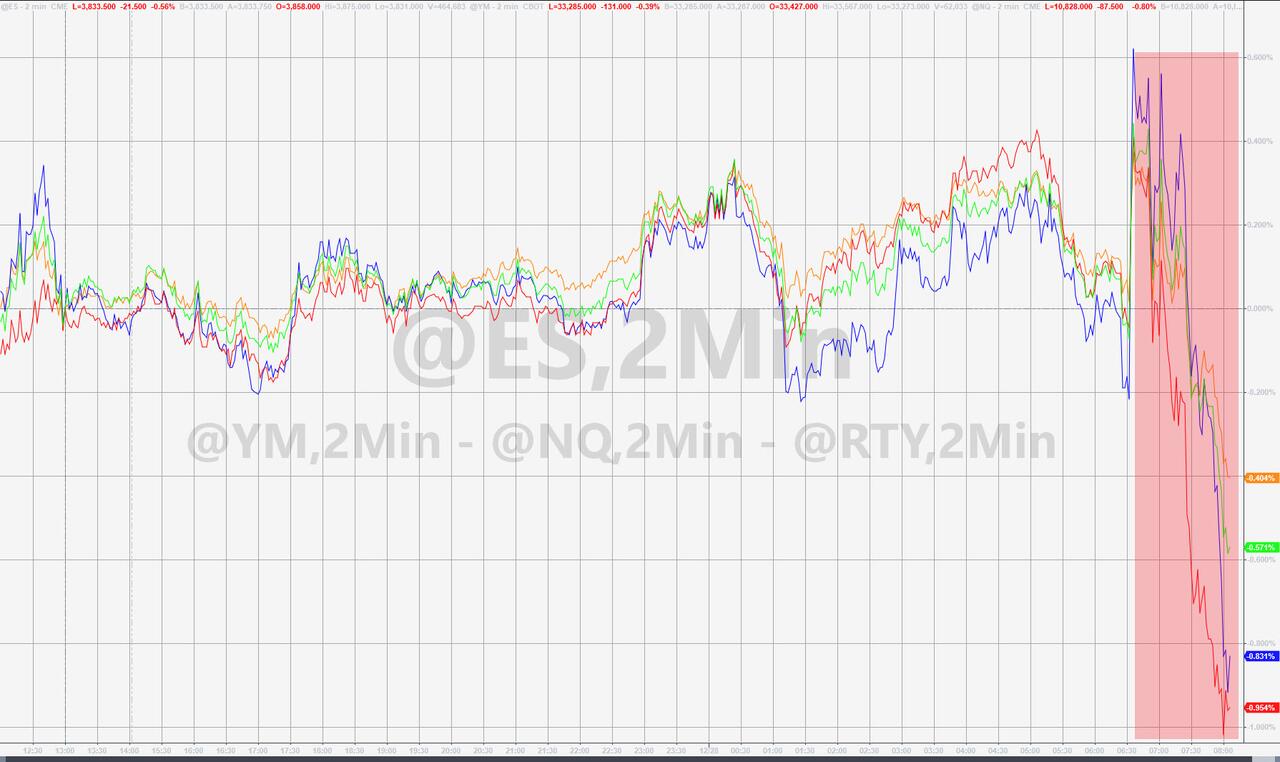
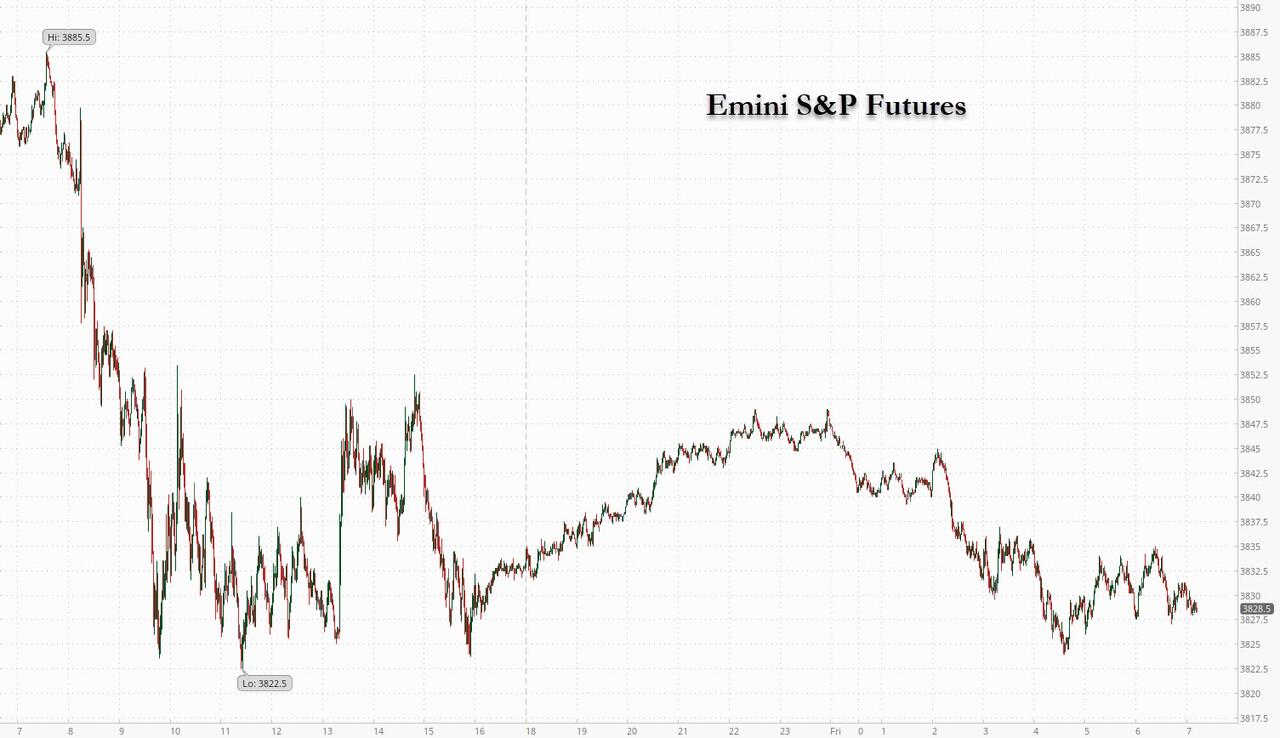
SPX futures bounced in the overnight session, only to fall back to the flat line by morning.  The markets await the BLS Employment Situation Survey. due at 8:30 am.  A better-than-expected report may cause a breakdown beneath 3800.00 confirming the decline that may continue through the end of January.  A report that comes in at or beneath expectations may cause a challenge of the 50-day Moving Average at 3898.70.

Today’s op-ex shows Maximum Pain for options investors at 3810.00.  Long gamma begins at 3850.00 while short gamma starts at 3800.00.  A report exceeding expectations may break through the 3800.00 barrier and possibly break the hold that the options players have on the market.

ZeroHedge reports, “US equity futures struggled to maintain gains on Friday as traders awaited the December jobs report that will help chart the path forward for Fed monetary tightening. Contracts on the Nasdaq 100 and the S&P 500 were unchanged at 7:15am ET, erasing earlier gains sparked by a report that China was planning to relax restrictions on developer borrowing, and dial its stringent “three red lines” policy that exacerbated one of the biggest real estate meltdowns in the country’s history. US equities dropped on Thursday as separate data showed the labor market remained strong. European markets were steady as data showed euro-area inflation returned to single digits for the first time since August. Treasury 10-year yields steadied after climbing for the first time this week on Thursday following comments from Fed officials, while a  measure of dollar strength climbed for a second day, as the yen fell to levels not seen in a week, after the Bank of Japan unveiled further unscheduled bond buying to control its yield curve.”

ZeroHedge further states, “As discussed earlier, the rate of payrolls growth is expected to cool (modestly in December, much more in Q1), with the street looking for the addition of 202k nonfarm jobs in December, which would be beneath the prior 263k rise as well as recent averages.

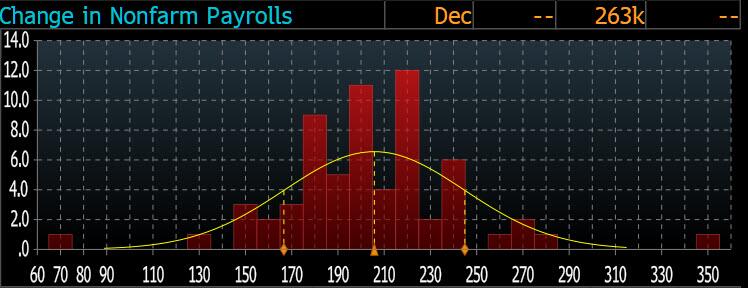
A couple quick points here: as Jim Bianco pointed out economists have consistently underestimated payrolls in 2022 and as shown below, the (first release) of the payrolls report has consistently beaten the median estimate for the past 8 months and 11 of the past 12.”


VIX futures are nudging against the 50-day Moving Average at 23.04 this morning.  There is pressure for a breakout above the 50-day as trending strength starts to build today for the first time since mid-December.  The Cycles Model calls for a peak during the week of the monthly options expiration on January 18.

Next Wednesday’s options expiration shows Max Pain at 22.00  Short gamma begins at 21.00, while long gamma starts at 25.00.  At the moment, there is more conviction on the short side, but that may chaange with the Monthly Employment Report.


TNX rose after the BLS report, but remained beneath the 50-day Moving Average at 37.83.  The trendline is near the Intermediate-term support at 36.67.  Waiting for the breakout or breakdown.


Posted in Published | Comments Off on January 6, 2023

January 5, 2023

8:00 am

Good Morning!  I have an abbreviated session due to outside appointments.  I may comment in more detain later in the day.

SPX futures consolidated in a narrow range during the overnight session.   Resistance is now at 3860.00 from the Short-term support/resistance line (not shown).   A breakthrough may allow the SPX to retest the 50-day Moving Average at 3895.00.  The Christmas low at 3764.69 may offer support i a decline.  Otherwise the next support may be at the Cycle Bottom at 3569.57.  The Cycles Model suggests the decline may gather strength through the end of the week.

In today’s op-ex Maximum Pain for options investors is at 3845.00.  Long gamma appears at 3850.00, while short gamma may begin at 3825.00.  Little wonder that the SPX is caught in such a narrow range.

ZeroHedge reports, “US stock-index futures were steady on Thursday, recovering from earlier losses as investors brushed off mostly hawkish commentary from the latest Fed minutes amid further signs of reopening and stimulus in China. Contracts on the S&P 500 and the Nasdaq 100 were both up 0.2% as of 7:15 a.m. ET following a positive session in Asia, driven by a rally in Chinese mainland and Hong Kong equity gauges on news the border with China will gradually reopen. Cautious Fed minutes on Wednesday evening failed to stem optimism, while investors await a private US jobs report later today. Europe’s Stoxx Index was also positive, erasing earlier losses, with retailers leading gains after Next Plc raised its profit forecast. Oil snapped a two-day drop, while the dollar was flat and 10Y TSY yields erased earlier gains.”


VIX futures continue to consolidate between the lower Triangle trendline and the 50-day Moving Average.  It has challenged the 50-day and may be on a buy signal, to be confirmed with a close above it.   The Cycles Model indicates a period of strength starting tomorrow and lasting through mid-January.  It appears to be significant.

Investing.com comments, “2023 started the same way 2022 ended, volatile and directionless. The S&P 500 opened Tuesday’s session with nice gains, but minutes later the index retreated into the red and quickly retested 3,800 support.

As dramatic as that 80-point collapse felt, rather than trigger a bigger wave of follow-on selling, supply dried up and prices bounced, which wasn’t a surprise because that’s exactly what we’ve seen every time the market tested 3,800 support over the last couple of weeks.

Big money is still on vacation, and that means retail investors are still in control. And in typical retail fashion, these impulsive traders overreact to every little bump in the road. Lucky for us, their accounts are so small they run out of money long before they can do any real damage.”


TNX bounced off Intermediate-term support at 36.66, just above the tendline.  The Cycles Model suggests another month of Cyclical decline before the rally resumes.  A breakdown at the trendline suggests a further decline to the Cycle Bottom at 24.10.


USD futures rose to a new high at 104.56 in the overnight session.  It is eligible for an aggressive buy signal as it has bounced off the trendline after a possible Master Cycle low (day 250).   Caution may be warranted for a few more days, due to the early low.  The new Master Cycle may last through the end of February.


Posted in Published | Comments Off on January 5, 2023

January 4, 2023

7:00 am – I am posting early as I am taking two grandsons to the airport this morning.

Good Morning!

SPX futures made a 61% retracement at 3844.40 in the overnight session and may already be declining again, suggesting the cash retracement may be lower.  The Cycles Model suggests the decline may continue through the end of January.  The weakness of the retracement to the 50-day may be telling us that the intensity of the decline may increase by the end of the week.  A decline in January does not bode well for 2023, as the “January effect” is a known phenomenon that recurs on a Cyclical basis.

ZeroHedge reports, “US futures reversed after Tuesday’s slump and gained on Wednesday, although easing off higher levels reached earlier, amid optimism around a boost from a potential recovery in China’s economy (which however was clearly not enough to find a bid below oil which crumbled for a second day), while investors awaited minutes of the Federal Reserve’s latest policy meeting for clues on the path of monetary policy. Nasdaq 100 futures rose 0.5% by 7:30 a.m. ET, while S&P 500 futures rose 0.3% after gaining 0.5% earlier following a burst of European optimism which sent the Estoxx50 2% higher, aided by European inflation data lifting risk appetite. The risk-on mood was also boosted after Chinese authorities said they are planning to usher in further support measures to ease liquidity stress at some of the nation’s too-big-to-fail developers as the property downturn persists. The dollar fell, erasing all of yesterday’s sharp gains, while Treasuries continued their “peak inflation is behind us and the Fed will soon stop tightening” ascent and added to Tuesday’s gains with yields richer by at least 6bp following wider rally across core European rates after French CPI unexpectedly slowed in December.


ZeroHedge relates, “According to Macrotrends.netthe S&P 500 has only seen consecutive years of negative returns three times since 1957, in 1973/1974 and in 2001/2002/2003 with returns getting worse in the second (and third) down year on each of those occasions. Since 1957, the S&P 500 has ended the year in the red 18 times including 2022. On 14 occasions, the index returned to growth the next year.”


VIX futures opened beneath the 50-day Moving Average at 23.24.  Piercing the 50-day puts the VIX on a buy signal.  While there may only be two weeks left in the current Master Cycle, the Model suggests Trending Strength may be returning this week.  The upper Triangle trendline may be its initial target.


TNX futures are testing the trendline at 36.50 this morning.  It turns out that the trendline seen in this chart may be an intermediate degree, while the longer-term trendline may be located near the Cycle Bottom near 23.95.


BKX, our liquidity proxy, lingers above the neckline of its Head & Shoulders formation at 97.00.  Yesterday it reversed from  its 50-day Moving Average at 102.90 on day 260 of its Master Cycle.  A full reversal may be imminent.

ZeroHedge notes, “Money supply growth fell again in November, and this time it turned negative for the first time in 33 years. November’s drop continues a steep downward trend from the unprecedented highs experienced during much of the past two years. During the thirteen months between April 2020 and April 2021, money supply growth in the United States often climbed above 35 percent year over year, well above even the “high” levels experienced from 2009 to 2013.”


Posted in Published | Comments Off on January 4, 2023

January 3,2023

10:16 am

The Ag Index may also be reversing today after a Master Cycle high on day 255 (Friday ).  The Cycles Model calls for a possible month of decline.


9:00 am

Good Moring!

SPX futures rose to an overnight high of 3883.20, approaching the 50-day Moving Average at 3890.93.  This may be the last hurrah of the correction.  The 38.2% Fibonacci retracement value is at 3894.37.  Today may give us a pivot into the next leg down.

Today’s op-ex shows Maximum Pain at 3825.00.  Long gamma may start at 3850.00, while short gamma begins at 3800.00.  The JPM collar may have expired on Friday.

ZeroHedge reports, “US stock futures rose on the first trading day of 2023, with some of the most beaten down and shorted stocks and sectors outperforming, as optimism crept – however briefly – into the market on the one-year anniversary of the S&P 500’s last record high.  Contracts on the S&P 500 climbed as much as 1.1% before fading much of their earlier gains. One year ago, the S&P closed at 4,796.56: since Jan. 3, 2022, the US stock benchmark endured its biggest annual decline since the global financial crisis, ending the year down 19%. Nasdaq 100 futures rose 0.6% Tuesday. The dollar jumped as the euro tumbled, while Treasuries were headed for their strongest start to a year in more than two decades as investors scooped up government debt on wagers the Federal Reserve will further slow its pace of rate hikes.”


VIX futures are on the rise, approaching the 50-day Moving Average at 23.48.  The year-long Triangle formation has coiled the VIX into a spring that may unravel up to 100.00 or higher.  The Cycles Model suggests a possible super strength trending for the next two weeks.


TNX has had a reversal since Friday, 12-30, leaving a probable Master Cycle high on day 253.  The Cycles Model suggests a possible 5-week decline that may beak through the trendline.  Should the decline go beneath 34.02, it may probe for the Cycle Bottom at 23.96.  Should this take place, it may have an opposite effect on stock prices.


USD futures have bounced of the lower trendline after a brief challenge at 103.14.  Should it go lower, it may sink to the Cycle Bottom at 99.44 in the next 1-2 weeks.  A lower USD may indicate money flowing out of the US.  This may also weaken the Stock Market, as the majority of the inflow is going to the DJIA.


Gold futures continue to make new retracement highs as the current Master Cycle may last through the month of January.  It has been on a buy signal since November.  The Current Master Cycle may last through the month of January.


WTIC made a wide-ranging (key) reversal this morning.  It rose to 81.50, challenging the 50-day Moving Average, then declined beneath Intermediate-term support to 78.15.  Today is day 267, 4.3 days beyond its previous high, completing the corrective structure.  The new Master Cycle may decline through the month of February.


Posted in Published | 1 Comment

January 2, 2023

Happy New Year!

Today I am spending time on analysis and corrections that may lead to better forecasting and more accurate placement of our position.  Primary Wave [1] consists of a 51-day Wave (A) followed by a 33-day Wave (B), then an 80-day Wave (C).  The number of days in Primary Wave [1] was 164.days.  Note that Intermediate Wave (C) was the strongest and the longest Wave of the Decline.  Primary Wave [2] took 60 days, clearly the longest correction of the series, since Intermediate Wave (B) of Primary  Wave [2] took 40 days.

Intermediate Wave (A) of  Primary Wave [3] took 58 days.  It was followed by a 40-day Intermediate Wave (B).  Intermediate Wave (C) may take 52 to 59 days.  Should the Cup with Handle formation be accurate, it may be the most powerful declining Wave, about 150% as powerful as Wave (C) of Primary Wave [1].

I am showing all this on a weekly chart to show that, even if the Cup with Handle performs as indicated, the SPX will still be on a secular bull market, since the target is higher than the March 23, 2020 low.


The NDX decline has the same Primary Waves, but began in November 2021.  Note that the Intermediate Waves are numbered differently.  Although it is due to decline through the uptrend line near 10900.00, most analysts don’t follow trading channel trendlines and therefore would consider NDX on a secular uptrend, since the proposed low would still be higher than the March 23, 2020 low.


Posted in Published | Comments Off on January 2, 2023

December 30, 2022

9:32 am

The Ag Index is now in its final week of the current Master Cycle.  It may rise as high as the mid-Cycle resistance at 492.99 as it is in a period of trending strength, but it may not last more than a few days beyond the holidays.  Support lies at the 50-day Moving average at 462.87.

ZeroHedge observes, “Believe it or not, now is a great time to be a farmer. Agricultural commodities are set to lock in another year of annual gains, the longest stretch in decades, prompting higher farm incomes.

The Bloomberg Agriculture Spot Subindex, which tracks everything from corn, soybeans, and wheat to sugar and coffee, will lock in the fourth year of annual gains today.

Bloomberg said this would be the “longest stretch of annual gains since at least the early 1990s as drought and war cut production and erode inventories, keeping global food inflation simmering.”

High prices for crops and livestock indicate boom times for the US farm belt, making farmers, ranchers, and agricultural firms all winners after a decade of sliding net farm income.”


8:00 am

Good Morning!

SPX futures declined to the JPM collar at 3825.00 in the overnight session.  The Cycles Model seems to agree by suggesting a quiet market for the next week or so.    Upside potential may be limited by the 50-day Moving Average at 3887.82 or the 100-day at 3905.40.  The 38.2%  Fibonacci retracement value is 3891.40.  The current hourly Cycle may last until (peak) Tuesday morning.  However, the danger of a sell-off intensifies beneath 3800.00.

Today’s op-ex shows Maximum Pain for options investors at 3830.00.  Long gamma starts at 3835.00, while short gamma begins at 3800.00, with the collar extending to 3850.00.

What is a collar?  A collar is an options strategy that involves buying a downside put and selling an upside call that is implemented to protect against large losses, but that also limits large upside gains. The protective collar strategy involves two strategies known as a protective put and covered call.

ZeroHedge reports, “US equity-index futures slumped on Friday, tracking European stocks lower, after Wall Street’s best session of the month and denting hopes that Santa Claus would make a late appearance on the last trading day of the year and ease the pain for investors as global stock markets are about to close the books on their worst annual performance since the global financial crisis in 2008.

Similarly to European bourses, US tech led the decline – after leading yesterday’s gain – with contracts on the Nasdaq 100 down 0.7% at 5:26 a.m. in New York. The tech-heavy index enjoyed a 2.6% jump during the previous session, thanks in large part to a sharp bounce-back in Tesla shares. The Nasdaq has lost a third of value this year as tech stocks emerged as some of the most vulnerable to rising rates. Optimism spurred by weaker than expected continuing job claims data signaling some easing in tight US labor markets faded overnight, taking contracts on the S&P 500 about 0.5% lower, and appears to be headed for that infamous JPM Collar strike of 3835.”


VIX futures are higher this morning, but still within yesterday’s trading range.  Trending strength may give VIX a boost above the Triangle formation as early as next week.  Strength may intensify through mid-January.


TNX is rising above the 50-day Moving Average at 38.19 this morning as it completes Minor Wave 1 from the trendline.  The current Master Cycle is due to end next week.  However, the rally may intensify after a brief pullback following the Pivot.

ZeroHedge reports, “And so, after a strong 2Y auction on Tuesday and a medicore, tailing 5Y sale yesterday, we finally came to the last bond auction of 2022 when just after 1pm ET, the Treasury sold $35 billion in 7 Year paper in what can at best be described as a sloppy affair.

The high yield of 3.921% was just above last month’s 3.890%, and tailed then when issued 3.913 by 0.8bps. This was the third consecutive tail if far smaller than last month’s 2.7bps gaping tail.

The bid-to-cover of 2.454 was higher than both October and November, but below the six-auction average of 2.512.

The internals were stronger, with Indirects taking down 68.1%, the highest since August and well above the 66.0% recent average; and with Directs awarded 16.2%, or slightly below the recent average of 19.8%, Dealers were left holding 15.8%, above the average of 14.2%.”


USD futures may have risen above the trendline at 103.50 this morning.   This indicates a potential move to test overhead resistance at 105.32 and above. Trending strength is due for a comeback during the second week of January, giving it an extra push above the 200-day and mid-Cycle resistance at 106.44..


Posted in Published | 1 Comment

December 29, 2022

11:35 am

Jamie Dimon may have got his Christmas wish, keeping the SPX range-bound for the week with the collar at 3835.00, above potential short gamma at 3820.00.  There may be a tilt toward long gamma to squeeze the speculators betting against Tesla and Apple.  If successful, SPX may rise to the 50-day Moving Average at 3887.83 or Short-term resistance combined with the 38.2% Fib resistance at 3893.00-3894.00 in the next 24 hours.

ZeroHedge remarks, “In the battle for supremacy over whether a Santa Claus rally will emerge into year-end or more coal, it would appear the critical players are Jamie Dimon’s whale of an options position being rolled (playing Santa) and an armada of day-trading options market players attacking TSLA with all their might (playing the grinch).

Exhibit A in the case for/against a rally is this rather shocking chart. The CBOE equity put/call ratio exploded this week to its highest level ever (amid devastating low holiday trading liquidity)…

Source: Bloomberg

So what the hell is going on? Well, it appears our old friends in the 0-DTE are taking advantage of Elon Musk’s headline-making skills and day-trading TSLA puts (and the obvious gamma-squeeze this creates – to the downside) to make a quick buck…

The massive scale of TSLA put turnover relative to call turnover is simply unprecedented and is likely the main driver of the chart above’s outlier-like appearance.”


7:30 am

Good Morning!

SPX futures bounced to 3802.00, then eased down.  The decline into the close may not have been enough to trigger dealer selling, but SPX is in a tenuous spot beneath 3800.00.  The Cycles Model suggests a probable bounce to the 50-day Moving Average at 3882.00, but the market is prone to overreact to bad news.

Today’s op-ex shows Maximum Pain at 3820.00, where short gamma may begin, while long gamma starts at 3825.00.  There’s barely a razor-thin margin for error.  SPY (close: 376.66) options show Max Pain at 382.00 with long gamma starting at 383.00 and short gamma at 381.00.  Dealers are praying for a flat trading day.

ZeroHedge comments, “xcerpted from Goldman Managing Director and derivative guru Brian Garrett’s notes,

Market Dynamics into Year-End…

In one line, there is a lot of long gamma in the market right now.

This is being offset by:

1/ increase in non-fundamental supply and

2/ decrease in fundamental demand.

Option strikes can only do so much of the heavy lifting in a bear market.

For those not in the seat today, NDX currently printing a fresh 2022 low (below Oct/Nov levels @ -34.6% ytd)…”


VIX futures are as flat as can be with a range between 22.03 and 22.31.  The Cycles Model shows activity picking up after the New Year,  Nothing to see here…until there is.

Next Wednesday’s op-ex shows Max Pain at 22.00.  Short gamma appears at 21.00 with 12,486 put contracts, while long gamma eases in at 25.00.   No surprises expected here.


TNX remains above the 50-day Moving Average at 38.24.  It has about a week left in the current Master Cycle, but it may go out with a bang.

ZeroHedge reports, “One day after a stellar 2Y auction stopped through by the widest margin since 2016, moments ago the Treasury sold $43 billion in 5Y paper in a solid if modestly  tailing 5Y auction.

The high yield of 3.973% tailed the When Issued 3.965% by 0.8bps; ironically the December auction was almost a carbon copy of November, when the 5Y paper priced at 3.974% and tailed by 0.7bps. With the tiny decline in yield, this was the lowest 5Y auction yield going back to August.

The bid to cover of 2.46 rose from last month’s 2.39 and was above the six-auction average of 2.36, if largely in line with the tight range the BTC has seen over the past 8 years.”

Note:  I have a family obligation that requires me to be out until after 10:00.  I will return for more comments later.


Posted in Published | 1 Comment

December 28, 2022

1:06 pm

SPX challenged the 3800.00 put wall, but traders did not take the bait.  A higher low suggests a retest of the upper resistance at 3883.00 to 3910.00 over the next two or more days.


11:25 am

NDX is leading the indexes lower tis morning.  The next level of support is at 11632.40.  It has been on a sell signal since December 13.  The Cycles Model suggests the sell signal may continue through the month of January.  It as suffered an 11.75% loss since the peak.

While NDX options are light, QQQ (price: $261.03) options expiring today are in short gamma beneath 266.00.

ZeroHedge observes, “An initial excited bid in US equities this morning ignited hopes that the Santa Claus rally could indeed make an appearance… but that’s all been decimated now as Nasdaq and Small Caps lead the puke lower…

Source: Bloomberg

The S&P is back below the critical JPM Collar 3835 level…”


8:15 am

Good Morning!

SPX futures had a slight positive tilt during the overnight session, but did not exceed yesterday’s high.  The structural pattern is to the downside, so we may see 3700.00 being tested before a bounce.  Overhead resistance remains at the 50-day at 3880.52.

Today’s op-ex shows Maximum Pain for options investors at 3835.00.  Long gamma sets in at 3850.00, while short gamma begins at 3825.00.  This is a very narrow “neutral’ band.

ZeroHedge reports, “US stock futures edged higher on Wednesday alongside European bourses, as a selloff in tech was set to pause following a drop on the Nasdaq in the previous session, with Tesla shares erasing earlier declines as dip-buyers returned to the stock after a seven-day losing streak. Nasdaq 100 futures rose 0.3% at 7:45 a.m. in New York, reversing earlier losses, while S&P eminis were up 0.3%. Treasury yields ticked lower as a global bond selloff eased, and a gauge of the dollar slipped.”


VIX futures consolidated above the Triangle trendline at 21.40 this morning.  This kind of (in)activity puts investors to sleep, as they have lowered their expectations over the holidays.  The Cycles Model suggests that trending strength may pick up after the New Year.  However, stay on the alert for breakout, especially after op-ex.

Today’s op-ex shows Max Pain at 22.00.  Short gamma begins at 22.00, but watch out for long gamma at 25.00 with 16,552 call contracts.  The January 18 (monthly) op-ex is loaded with big money calls up to 75.00.


TNX has pulled back, testing the 50-day Moving Average at 38.23 this morning.  The Cycles Model suggests that TNX may surge higher, starting today and lasting into the first week of January.  The probable target may be the Cycle Top resistance at 42.10.

ZeroHedge reports, “In a day bond yields moved sharply higher on expectations that China’s upcoming reopening will spark a powerful reflationary impulse across global markets, and which sent the 10Y up from the low 3.70% last week to 3.85% a little after 12pm ET today, moments ago the US sold $42BN in 2Y paper in an impressively strong auction, one which saw a surge in foreign demand and the biggest stop through since May 2016.

Starting at the top, the High Yield of 4.373% was a drop from last month’s 4.505%, and the first sequential yield decline since July 2022. More importantly, the yield stopped through the 4.390% When Issued by 1.7bps, the biggest stop through gap since March 2016, showing just how much pent up primary demand there was for today’s issuance (which is now trading about 60bps below where the Fed sees the terminal rate in 2023 as nobody believes the Fed any more).


USD futures are creeping along the trading channel trendline, despite the Master Cycle low on December 14.  The current Master Cycle may have about two weeks left to run its course.  Trending strength does not appear until after the current Master Cycle may terminate, suggesting the trendline creep may continue.


WTIC futures are easing lower after yesterday’s probable Master Cycle peak on day 260.  The outlook is not good for crude, as the Cycles Model suggests a possible two months of decline.  The 61.8% Fibonacci retracement is at 53.07, so the Broadening Wedge target may be realistic.

OilPrice.com comments, “Mild winter weather in many parts of Europe, rising wind power generation, and lower electricity consumption were dragging European natural gas and power prices lower on Tuesday.

Prices at the Title Transfer Facility (TTF), Europe’s key gas benchmark, were down to a six-month low at midday on Tuesday due to milder winter compared to early December and still comfortable gas storage levels across Europe.”


Posted in Published | 3 Comments

December 27, 2022

12:17 pm

SPX declined to 3813.22 testing the JPM Collar and short gamma at 3800.00.  The bounce from there didn’t take it any higher, so SPX may be range-bound for now.  The top of the range appears to be the 50-day Moving Average at 3880.15 and the bottom may be 3800.00 or a bit lower.  A close beneath 3800.00 may set of a panic decline.  The 38.2% retracement is at 3893.00.

ZeroHedge remarks, “After some wild moves in early and mid-December, the last four days of trading in 2022 should be a muted affair, with few notable macro/econ events or newsflow, and with technicals driving any year-end volatility.

So what should one watch for?

According to SpotGamma, major resistance remains at 3900, while support can found at 3850, the previously discussed JPMorgan “vol killing” collar at 3835, and eventually 3800. here, SpotGamma remains of the opinion that the S&P holds the 3800-3900 into Friday, 12/30 OPEX, and “for this week, this suggest that SPX moves to either side of this range should mean revert back into the 3835-3850 area.”


7:45 am

Good Morning!

SPX futures tested the 50-day Moving Average at 3874.67 this morning before backing down.  The Cycles Model called for a peak retracement this morning and that may have been it.  The last week of 2022 may be a rather peaceful week, as there are no Cyclical indications, positive or negative, to imply otherwise.

Today’s op-ex shows Maximum pain for options investors at 3820.00.  Calls are sparsely populated up to 3900.00, where long gamma kicks in.  Short gamma begins at 3800.00.  This arrangement leaves a wide berth for a potential sideways market.

ZeroHedge reports, “US futures reopened from the extended Christmas break, rising as high as 3900 and following European and Asian stocks higher as China’s reopening buoyed sentiment in the final trading week of the year. At 745am ET, S&P futures were up 0.5% at 3,890 while Nasdaq futures rose 0.2% even as Tesla tumbled again in premarket trading. Asian stocks extended gains for a second day after China moved to end quarantine for inbound visitors, effectively ending its zero-Covid regime.  Futures are advancing after the underlying benchmarks slid over the last three weeks. Treasury yields were higher, 5Y-30Y at highest levels since November, with the curve steepening. The dollar declined versus most of its G-10 peers. Gold was in the green. Oil in New York traded for $80 a barrel, buoyed not only by China’s reopening but as freezing weather shut more than a third of Texas Gulf Coast refining capacity over the past few days. Trading remains thin with many markets including Australia, New Zealand, the UK and Hong Kong closed for holidays”


NDX futures rose to challenge the trendline near 11050.00, but pulled back, as well.  This situation appears to be more dangerous to equities, as NDX is leading the indices lower.

Today’s op-ex show both puts and calls are very sparse, with a possible long gamma at 11100.00.  QQQ (Friday’s close: 267.36) shows Max Pain at 267.00.  Long gamma may begin at 274.00, while short gamma starts at 265.00.

ZeroHedge observes, “After a strong October and November, the final month of 2022 has seen a brutal return to the same painful grind lower that marked most of 2022, and is on pace to record the 2nd worst December performance on record…

ZeroHedge remarks, “Some stunning stats on the epic collapse in the tech sector, i.e., the GAMMA (Google, AAPL, Meta, MSFT, AMZN) Meltdown, courtesy of Goldman trader Michael Nocerino and Peter Callahan:

The Big Tech cohort (AAPL, MSFT, GOOG, AMZN, TSLA, META & NVDA) has collectively shed ~$4.9 trillion of market cap during the course of 2022.”


VIX futures rose above the Triangle trendline at 21.00 this morning.  While there is no unusual activity in the Cycles this week, things may intensify after the New Year.  The first two weeks of January show a strong return of trending strength.

Wednesday’s op-ex shows Max Pain at 23.00.  Short gamma may be nonexistent, while long gamma begins at 25.00.


TNX gapped up to the 50-day Moving Average at 38.25 this morning, although the futures show a lower peak.  The Cycles Model shows trending strength roaring back this week with a potential Master Cycle high in the first week of January.   TNX is on a buy signal.


USD futures challenged the long-term trading channel over the Holiday weekend, but has emerged above it.  There are two weeks left in the current Master Cycle.  There is no indication in the Cycles Model of any strength before the pivot date, so the short-term trend may be sideways-to-lower.


Crude oil futures peaked overnight at 81.06 and appears to be making its reversal on day 260 of the Master Cycle.  It may not reach the 50-day Moving Average at 82.05.  If so, we may see a two-month decline in crude prices.  The Broadening Wedge formation has a potential target of 49.92 which may be reached by the end of February.  That would be a 61.8% Fibonacci retracement from the March 2022 top to the April 2020 bottom.


Posted in Published | Comments Off on December 27, 2022

December 23, 2022

8:20 am  Merry Christmas!  We are getting white-out conditions with an outside temperature of 6 degrees and a wind chill of -15 degrees.

Good Morning!

SPX futures are somewhat higher prior to the PCE print.  I thought it best to wait until after the print to make my observations.

Today’s op-ex shows Max Pain at 3840.00 with a red-hot contest tilted toward calls at 3850.00.  Short gamma begins at 3830.00.

ZeroHedge reports, “US stock futures edged higher after Thursday’s slump as investors weighed strong job data and prospects of further policy tightening to cool inflation ahead of today’s closely watched core PCE print which may reverse the negative sentiment (especially if it comes at 4.5% Y/Y or lower) and send stocks sharply higher (see here for more). Contracts on the Nasdaq 100 and the S&P 500 gained 0.3% by 7:30 am ET one day after the S&P 500 cash index plunged 1.5% on Thursday and was set for a third consecutive weekly loss, the longest losing streak since September. The index is also on pace for its second-worst December on record, while the Nasdaq 100 is on course for its steepest slump in the month since 2002.


VIX futures have gone down to 21.65, right at the Triangle trendline.  It may  be poised to make a deeper low, near 19.20, or possibly lower, as today is day  263 of the old Master Cycle.  However, the corrective decline may be complete having made a near-60% retracement of Wednesday’s ramp higher.

Next week’s op-ex shows Max Pain at 24.00 with long gamma at 25.00 with 16,374 expiring call contracts.  Short gamma starts at 23.00.  Barring some earth-shattering news, VIX ay stay beneath 25.00.


TNX has moved above Intermediate-term resistance at 36.97.  It has entered a period of strength lasting through next week and is on a buy signal.

ZeroHedge observes, “Twas the last trading day before Christmas and all through the market, not a trader was twitching… until today’s PCE print hits…

The Fed’s favorite inflation indicator – Core PCE Deflator – printed slightly hotter than expected in November +4.7% YoY vs +4.6% exp (MoM was in-line at +0.2% after an upward revision for October)…

Source: Bloomberg

That is below the 4.8% forecast in the FOMC’s December SEP.”


Crude oil futures are consolidating within yesterday’s trading range with a high of 79.70.  The Cycles Model suggests another probe higher before the reversal.  If so, a probable target may be the 50-day Moving Average at 82.23.


Gold futures are also consolidating, having bounced to 1808.20 this morning.  The Cycles Model suggests today may be the last day of strength this year with a decline to follow through the end of January.  Gold is on an aggressive sell signal with a lower high, to be confirmed at a decline beneath mid-Cycle support at 1781.03.


Posted in Published | 1 Comment