January 23,2023

11:24 am

SPX is challenging the downtrend line at 4025.00.  A close above that implies a potential extension of the rally for as much as 2 more weeks in a panic rally driven by long gamma.  However, it is also at a critical Cycle Pivot point.  Should SPX reverse in the next couple of hours it may relapse back into a panic decline that may last two more weeks.  This is a very critical juncture.

ZeroHedge warns, “Just as we warned last weekthe short squeeze is back again, perhaps as traders relished the start of the Fed blackout period (ahead of the Feb 1 FOMC) and the coming start of buybacks, with buyback blackout ending next weekend.

…and adding to this re-reversal in sentiment, is the latest note from Goldman prime (also available to pro subs), according to which there has been a notable shift in market sentiment as “hedge funds net bought US Info Tech stocks for a second straight week led by Semis & Semi Equip names (after being sold in 10 of the 11 prior weeks).”


8:00 am

Good Morning!

SPX futures have been treading in a narrow band from 3963.00 to 3978.00 over the weekend.  The 200-day Moving Average is at 3969.00 and appears to be hindering the retracement.  The trendline defining the decline appears at 4025.00 and has thus far been unbroken.  Trending strength reappears this week and may last for the next two weeks, ending in a probable Master Cycle low.

Today’s op-ex shows Maximum Pain for options investors at 3970.00.  Calls prevail above 3980.00 and long gamma above 4000.00.  Short gamma begins at 3950.00.  However, the sentiment for puts is not as strong as for calls.

ZeroHedge reports, “US equity futures were little changed, trading in a narrow ten point range during a muted overnight session on Monday as investors braced for a moderation in Fed rate increases after the Fed mouthpiece suggested a 25bps hike is now the baseline (coming at a time when the Fed is now in a quiet period until the Feb 1 FOMC meeting), while bracing for a busy week of earnings. S&P 500 and Nasdaq futures each rose 0.1% at 7:45 a.m. ET after both underlying benchmarks rallied on Friday. The tech-heavy Nasdaq 100 Index has posted three weeks of gains, the longest winning streak since mid-August. 10Y TSY yield rose 2bps to 3.50%, while the dollar rebounded from nine-month lows against the euro and a group of other currencies, after a slew of Federal Reserve officials laid out the case for a downshift in the Fed’s rate-tightening campaign. China and most Asian markets were closed for the Lunar New Year holiday.’


VIX futures have consolidated between 19.99 and 20.33.   Volatility may stagnate until next week when trending strength comes back.


TNX is rising, but has not broken through overhead resistance.  It is on an aggressive buy signal due to the Master Cycle reversal off the mid-Cycle support at 33.61.


Posted in Published | 1 Comment

January 20, 2023

1:09 pm

SPX has met its 38.2% Fibonacci resistance and daily mid-Cycle resistance (not shown) at 3935.00 and appears to be pulling back. The 50% retracement value is 3950.61.  It has met the required Cyclical time period of three days from the high at 4015.39.  Dealers want to avoid long gamma, so we may anticipate a decline back beneath the 50-day Moving Average at 3922.00.  I wouldn’t be surprised to see SPX close near 3900.00 since that level is so hotly contested.

ZeroHedge remarks, “By now everyone, of course, knows that the Fed has broken what was once called “the market” beyond repair. Add to that zero liquidity, a still healthy army of HFT bots and the explosion in 0DTE option trading…

… and what you have is a market that looks like this on a daily basis.

Nowhere is this brutal swing more visible than in the furious ebb and flow of shorting and squeezing activity. ”


9:38 am

BKX opened at the 50% retracement value of its 2-day decline.  Resistance is at mid-Cycle resistance at 105.37 and the 200-day Moving Average at 106.35.  The Cycles Model suggests the decline may intensify next week.  The trigger for the Head & Shoulders formation is at 96.50.  Rising rates, rising USD and mass layoffs are setting up a potential crisis in the banking sector.  The FTX implosion is creating a significant headwind.

ZeroHedge notes, “One week ago we looked at the latest consumer credit data where we found not one but two flashing red alerts:

  • First, the total amount of credit card debt hit a new all time high, which however was to be expected from one of the most consistently increasing series across all US economic data, and one which predictably is correlated to the US savings rate which is at all time lows.

  • Second, thanks to the Fed’s crusade to spark a great recession, the average rate across US credit cards just rose to an all time high 19%+”


7:40 am

Good Morning!

SPX futures have been consolidating between 3895.00 and 3915.00 in the overnight session.  Both the 50-day and Intermediate-term resistance are at 3918.00.  The mid-Cycle resistance is at 3934.50.  Final support is the 100-day Moving Average at 3865.27.  All the technical indicators point downward.  Whether the decline starts today or after op-ex remains to be seen.

Today’s op-ex shows 3900.00 being hotly contested by both 37,610 puts and 34,364 calls this morning.  Long gamma starts at 3950.00, while short gamma may begin at 3850.00 .  There may be intense pressure to keep SPX in its narrow range.  A breakout out of the current range may reinvigorate gamma in the prevailing direction.  Otherwise gamma falls off after today’s expiration.  Nomura warns today is “Gonna Be Spicy.”

ZeroHedge reports, “S&P futures are modestly higher this morning trading in a narrow range, with tech stocks leading on the back of solid earnings by Netflix. Contracts on the S&P 500 Index rose 0.3% while those on Nasdaq 100 were 0.6% higher even as the underlying gauges were poised for the biggest weekly losses since before Christmas.

Today will be the last day before Fed’s blackout period before the Feb 1 FOMC; today is also the largest non-quarterly option expiration day on record for indexes: according to Goldman, $797bn of single stock options will expire today, the largest since Jan-2022 and the fourth largest on record. From an index perspective, $1.3trn of options will roll today, the largest non-quarterly expiry on record.”


VIX futures remain in a tight consolidation between 20.28 and 20.63.  The Cycles Model suggests a rising trend through the month of February.

The January 25 op-ex shows Max Pain at 21.00.  Puts volume has fallen off, while Calls volume is rising.  Long gamma begins at 26.00.

ZeroHedge remarks, “Yesterday saw a notable dynamic play out as VIX trended lower in the face of equity index weakness, which suggested that traders were ‘less bearish’ than the previous day…

In fact, as SpotGamma detailed with their HIRO tool – measuring the real-time impact of options hedging – as the day progressed, traders bought the dip primarily through call options (i.e., bought call options)…”


USD futures are also consolidating after Wednesday’s Master Cycle low on day 265.  The Cycles Model shows gathering strength by next week with a potential (new) high by the end of February.  A confirmation of the buy signal lies above the trendline at 103.50.  The next move has all the earmarks of a crisis in-the-making.  Many foreign governments and corporations have issued debt in USD.  Rising interest rates and USD may crush foreign economies, including Japan and Europe.


TNX appears to be rising sharply out of its Master Cycle low yesterday.  The Cycles Model suggested this move today and also infers a very strong three-week rally out of the low.  The reversal from mid-Cycle support at 33.56 gives us an aggressive buy signal (UST sell).  Confirmation comes above Intermediate-term resistance at 35.93.


Posted in Published | Comments Off on January 20, 2023

January 19, 2023

6:40 am

Good Morning!

I have a breakfast appointment and ay not return until after the open.

SPX futures have continued their decline overnight, reaching a low thus far at 3888.00.  The 50-day Moving Average has been breached at 3916.00, confirming the sell signal after a month-long rally.  Should a bounce occur, the 50-day May provide overhead resistance.  This may prove to be a nasty decline, since most investors are now long.  SPX is deep into short gamma which may compound the intensity of the decline.  A Goldman analyst insists there was no apparent reason for the meltdown.


9:46 am

SPX gapped down at the open beneath the 50-day Moving Average at 3918.36 and may be aimed toward Short-term support at 3887.79 where a bounce may be generated.    While short gamma begins at 3910.00, it intensifies beneath 3880.00, where over 5,000 contracts were bought since the open.

ZeroHedge reports, “One day after the S&P had its worst day since Dec 15, failing to hold the 200dma, US equity futures entered Thursday extending recent losses with a third straight session in the red as renewed recession fears and the start of the earnings season weighed on risk appetite, sparking a risk-off tone that spread across global markets, from Japanese shares to oil contracts, sent bond yields lower and hit commodities. Pre-market Mega Caps and Metals/Miners were the biggest laggards. The dollar was flat, the VIX jumped above 21, and 10Y yields reversed earlier losses. The macro focus for today includes housing data, Philly Fed, and 3x Fedspeakers. Plus, there is a 10Y TIPS auction and NFLX kicks off MegaCap Tech earnings.

Contracts on the S&P 500 edged down 0.8% as of 7:30 a.m. ET and contracts for the Nasdaq 100 lost 0.7%.Stoxx 600 gauge halted a six-day rally. Most Treasuries erased gains, and the euro advanced, as hawkish remarks by ECB Governing Council member Klaas Knot reaffirmed the central bank’s aggressive stance.


VIX rallied up to the Triangle trendline and 50-day Moving Average at 21.97 this morning.  A confirmed buy signal lies above that level.  The Cycles Model calls for a 5-week rally from the Master Cycle low that may break through all overhead resistance.

The January 25th op-ex shows short gamma beginning at 20.00, while long gamma starts at 25.00.  However, Long gamma trails off above 32.00, as it appears there is little conviction of rising volatility.  This is where opportunities may abound.


TNX futures made a morning low at 33.21, challenging mid-Cycle support at 33.53.  The cash market has opened above that level and is rising, giving us at Master Cycle low on day 273.  A new Maser Cycle High may be due in three weeks.


USD may have put in its Master Cycle low yesterday, as today’s futures have stopped declining.  A possible buy signal exists at the trendline near 103.80.  The Cycles Model calls for a rally extending through the end of February.


Posted in Published | 4 Comments

January 18, 2023

12:52 pm

SPX has given a sell signal…

NDX has also declined beneath its Intermediate-term suort at 11495.00, giving a sell signal.


9:46 am

BKX may have made its Master Cycle high yesterday, on day 274.  The Cycles Model calls for a potentially sharp two-week decline beneath the neckline of the Head & Shoulders formation.  Following a retest of the neckline, the Model indicates a probable decline through the month of April.  By that point, the markets may be in a full-fledged panic Cycle.

ZeroHedge observes, “The credit cycle is turning, which points to wider credit spreads, increasing loan-losses at banks, and rising equity volatility.

Credit has exploded higher since the pandemic. But all good things must come to an end, with credit busts typically following close on the heels of credit booms. Cracks are now emerging in lending markets as the sharpest monetary policy tightening in decades begins to bite.”


8:00 am

Good Morning!

NDX futures rose to 11622.30, challenging yesterday’s high at 11616.00.   While the DJIA has exceeded its 61.8% Fibonacci retracement at 33762.00 and the SPX  has approached its 50% retracement at 4142.00, the NDX has thus far fallen short of even a 38.2 % retracement at 12856.00.  In addition, the NDX target for a Primary Wave [2] would most likely be near the mid-Cycle resistance at 11937.87 in the time left to complete the current Master Cycle (February 2).   I mention this due to the fact that NDX has closed above the 200-day Moving Average which has been a stopper of rallies for the past two months.  Today is a day of reckoning for the direction of the markets for the next two weeks.

In today’s op-ex, Maximum Pain for options investors is 11540.00.  Long gamma begins at 11550.00 while short gamma prevails beneath 11520.00.   QQQ (closing price: 281.54) shows Max Pain at 279.00.  Long gamma begins at 280.00 while short gamma prevails beneath 277.00.

ZeroHedge comments, “Last Monday, we showed the latest JPM prime brokerage data, which revealed that “high SI stocks in the US have seen a ~6 week period of persistent short additions. The magnitude and duration of these short additions is on par with the largest we’ve seen in past years and the cumulative additions put shorts in these types of stocks back at multi-year highs.”

This striking observation of near-record shorting by hedge funds, prompted JPM to muse that “given the consensus bearish view of Equity markets, driven by expectations for the Fed to hike us into a recession, a sharp squeeze would catch a number of investors offsides” and conclude that we are setting up for a tech-led squeeze higher as shorting gets extreme.”

ZeroHedge observes, “SPX – right on it

SPX futures trading right on the 200 day moving average and the longer term down trend. Our squeeze logic from January 8 () played out very well. The set up from here is a lot “harder”. Why not an overshoot to properly frustrate the crowd?”


SPX futures rose to an overnight high of 4013.50, not surpassing yesterday’s high.  The difficulty is that the 200-day Moving average at 3978.00 must be broken to reinstate the decline.  Further confirmation may come beneath the mid-Cycle support at 3938.50.  Sentiment is turning more bullish as this retracement wears on for three months.  A decline starting here ay be catastrophic, since no one is properly hedged.

Today’s op-ex is a very confused bag with Max Pain at 3975.00.  Long gamma may begin at 3980.00 while short gamma starts at 3970.00.  Options are too close to call.

ZeroHedge reports, “US stock-index futures were muted on Wednesday, swinging between gains and losses, as investors initially welcomes a dovish announcement by the BOJ which refrained from further expanding its yield curve control band, then turned to corporate earnings for more clues on the health of corporate America amid growing prospects for a recession. Nasdaq 100 and the S&P 500 futures were up 0.2% as of 7:15 a.m. in New York. Treasury and JGB yields tumbled after the BOJ kept monetary settings unchanged, while the yen first slid against the dollar but then recovered all losses amid expectations the BOJ has only bought a few weeks of time. WTI crude added 1.7% this morning and has been holding above $80 amid optimism around China reopening demand. Dollar is weaker; DXY at 102 helping gold trade back over $1900.”


VIX futures have sunk to a morning low at 18.92 and remains near the low.  Today is day 261 in the current Master Cycle, so there is a possibility of making  new low.  Last Friday’s low was on day 256, so the VIX is straddling its low point.


TNX is lower this morning and may finally reach mid-Cycle support at 33.50.  This makes a very stretched Master Cycle at day 272.  Futures have declined to 33.99, exceeding the December low.  The Cycles Model poses an interesting point that TNX may move explosively out of its low by Friday.  Retail Sales and the PPI may have driven yields lower this morning.  One must observe, however, that our military stockpile is diminishing while the war in the Ukraine intensifies.  At some point, congress will be coming back for more money to rebuild our military stockpile.  The resulting rising interest rates may be the downfall of the “soft landing” scenario.

ZeroHedge writes, “US Retail Sales Tumbled in December” and “US Producer Prices Plunge Most Since COVID Lockdowns


USD futures declined to 101.27 as Retail Sales and PPI reinforced the sentiment for lower rates.  This stretches the current Master Cycle to day 265.


Posted in Published | 1 Comment

January 17, 2023

3:28 pm

SPX short covering is showing fatigue after this morning’s brief foray above 4000.00.  The formation is an Ending Diagonal that may signal a reversal at the break of the lower trendline at 3980.00.  The Cycles Model calls for a 13-(market) day decline from here to the next Master Cycle low.  Should it break down, the decline intensifies starting tomorrow.

While JPM is telling us a short squeeze may be imminent, while Nomura says there’s a big disconnect in the market right now.  Which is correct?


11:28 am

The Ag Index has risen above its 50-day Moving Average at 460.31 this morning.  This confirms a buy signal that lasts until the end of January.  Should the Ag Index move above the mid-Cycle resistance at 486.67, the next Master Cycle (starting in February) may be a slingshot move higher until the end of March.

ZeroHedge reports, “Last year was a bad year for corn — the latest US Department of Agriculture (USDA) report shows drought conditions and extreme weather wreaked havoc on croplands.

USDA unexpectedly slashed its outlook for domestic corn production amid a severe drought across the western farm belt. Farmers in Nebraska, Kansas, and Texas were forced to abandon drought-plagued fields.

The agency estimated farmers harvested 79.2 million acres, a decline of 1.6 million acres versus the previous estimate — the smallest acres harvest since 2008.

The unexpected cut to US harvested corn acres means grain supplies are a lot tighter than realized. A report Thursday showed the corn area in the world’s largest producer is at the smallest since 2008 with crops failing in states such as Texas and Nebraska. That’s due to persistent drought conditions in the western part of the country that could also hit harvests for wheat plants that are currently dormant for the winter. — Bloomberg”


8:00 am

Good Morning!

SPX futures have declined to a low of 3981.40, it 200-day Moving Average.  Beneath this level may constitute an aggressive sell signal.  The mid-Cycle support at 3940.00 may confirm that signal due to short gamma.    Additional supports are at 3921.50, then 3912.40.  If the SPX is entering a Wave 3, the decline will cut through these supports like melted butter.  If not, we may see further rallies.  The 50% retracement of last year’s decline is at 4140.04.  The 61.8% retracement is at 4311.00.

Today’s op-ex shows Maximum Pain at 3985.00.  Long gamma starts at 4000.00 while short gamma begins at 3950.00.

ZeroHedge reports, “US stock futures slipped for a second day as investors braced for a busy week of parsing earnings reports for signs of an earnings recession, falling profitability and an economic slowdown. Contracts on the S&P 500 fell 0.2% at 7:10 a.m. ET, recovering from a -0.5% drop earlier, while Nasdaq 100 futures dropped 0.3% after trading in the cash market was closed on Monday for a holiday. The dollar was flat after rebounding from an 8 month low on Monday while the US 10-year Treasury yield rises to top about 3.55%.”


VIX futures rose to 20.22 this morning after making a new low not seen in a year.  A reversal from the Cyclle Bottom may constitute a buy signal on the VIC, to be confirmed above the Triangle trendline at 22.00 and the 50-day Moving Average at 22.26.  Perhaps they may converge later today.

Tomorrow’s op-ex shows Maximum Pain at 22.00.  Short gamma starts at 20.00 while long gamma begins at 25.00.  Short gamma nearly disappears after tomorrow’s op-ex.

ZeroHedge observes, “Some risk indicators are moving sharply higher

In case you missed it, but the most recent move in VVIX is actually up, not to mention the move higher in the SKEW index. This is not a predictor of equities moving lower, but shows you that people have started paying up for hedges. The last squeeze has managed forcing people into chasing longs, and they are hedging part of that “forceful” chase.”


TNX is moving higher, topping out at 35.79 this morning.   Intermediate-term resistance is at 36.22 while the trendline is at 36.50.00.  A move above them constitutes a buy signal.  The Cycles Model shows new trending strength later htis week, which goes into full bloom in early February.

ZeroHedge comments, “By now everyone knows that for the past year has seen the Fed unleash an unprecedented crusade against not only runaway inflation – having been responsible for the surge in prices in the first place thanks to trillions in post-covid “MMT” helicopter money – and employment – hoping to contained the soaring inflation by means of a broad economic recession – but has also targeted prices of equities and bonds, i.e., risk assets, which after a decade of merciless and relentless asset bubble blowing have been suddenly forsaken by the money printing institution of the US which has been doing everything in its power to hammer every rally and crush animal spirits (if only for the time being, a time when weekly angry phone calls from the senile occupant in the White House demanding the Fed make everyone equally poor impinge on the Fed’s true first commandment which is to make a handful of people very rich while monetizing the US debt in the meantime).

In its determined pursuit of lower asset prices, the Fed has been engaged in the fastest rate hiking campaign since Volcker broke the back of double digit inflation 40 years ago. But as rate hikes are about to downshift again to 25bps, before hitting pause (and going into reverse in the second half of ’23 according to the market if not the Fed)  the Fed is left with another, more powerful tool to crush risk prices: QT, the same Quantitative Tightening that Goldman’s head of hedge fund sales last week said that “While All Attention Is On Rates, The Real Risk Is That Global QT Is Just Starting.


USD futures have settled near Friday’s low, but not lower.  That was day 260 of the Master Cycle and a likely bottom.  However, there is no clear reversal, so we wait for a rally above the trendline at 103.50.  The Cycles Model infers that, should the Master Cycle be complete, the enuing rally may last through the end of February.

ZeroHedge advises, “Know your tails. In a year facing an unusually wide set of outcomes, knowing what the tail risks are and how to hedge them is of paramount importance.

The top three tail risks I see facing the global economy – and three havens offering a refuge – are:

  1. Stubborn or resurgent inflation —> commodities and other real assets
  2. US recession —> shorter-dated Treasuries or bills (or even cash)
  3. Global funding crisis —> US dollar”


Gold futures may have reversed from its Cycle Top at 1922.13 on Friday after an unusually long (270 days) Master Cycle.  The Cycles Model shows gold in  a projected decline to the end of February, opposit an USD rally in the same time period.


Posted in Published | Comments Off on January 17, 2023

January 13, 2023

1:30 pm

ZeroHedge remarks, “While some were more interested how banks did in Q4 – a quarter which we already knew would see catastrophic banking revenues (due to the lack of IPOs and bond offerings thanks to the plunging market), and mediocre at best for FICC and equity trading offset by very strong net interest income courtesy of soaring credit card fees – we were much more curious in how banks saw the future not by their always cheerful conference calls, but by how much loan loss reserves they took out in anticipation of the coming recession.

The results were concerning: let’s start with the largest US commercial bank, JPMorgan, which in Q4 almost double its reserve build from $808MM to $1.4 billion, the biggest reserve build since the fateful Q2 2020 quarter when covid locked down the US economy and nobody knew what would happen.


10:21 am

BKX , our liquidity proxy, put in its Master Cycle high yesterday, day 269 of the former Master Cycle.  It has declined beneath mid-Cycle support/resistance at 105.59 and is on a sell signal.  It may retest yesterday’s high, but the reversal has been overdue.  Today starts the earnings season for banks and one can see massive increases in loan loss reserves due to deteriorating conditions and rising rates.  The Cycles Model warns that something may break over the weekend.  Here ae the headline articles:

Losses ‘Accelerate’ For Goldman’s Credit-Card Division

JPM Slides … As It Boosts Credit Loss Reserves By $1.4BN

BofA Reports Solid Q4 Earnings… As Credit Loss Provisions Soars Above $1 Billion

BOJ Loses Control Of Bond Market As New YCC Band Breaks Amid Selling Panic

FitchRatings reports, “Fitch Ratings-New York/Chicago-10 January 2023: U.S. banks face rising deposit costs and sustained higher unrealized losses on securities portfolios given the growing probability that the Federal Reserve (Fed) maintains elevated interest rates for an extended period to combat inflation, Fitch Ratings says.

Weaker credit performance is expected to be the primary focal point for U.S. banks’ financial performance in 2023, but the industry response to meaningfully declining deposits will also be an important issue to monitor.”


9:00 am

Good Morning!

SPX futures have declined to the mid-Cycle support at 3943.18 after reversing at the 200-day Moving Average at 3994.39 at 2:00 pm yesterday.  What is interesting about that time is that it is 12.9 market days from the December 22 low and 30 days (4.3 weeks) from the December 13 high.   Crossing beneath mid-Cycle support gives us a sell signal.  We are now in the midst of earnings reports, so buckle up for a rough ride for the rest of the month.

In today’s options-driven market, Maximum Pain for options investors is at 3935.00.  Long gamma starts at 3950.00, while short gamma begins at 3900.00.  One may conclude that this morning’s decline may be dealer driven to maximize options pain.


VIX futures have rebounded to a morning high at 19.41 after making a new low not seen since April 4.  Yesterday’s new low takes the form of a double zigzag, which was totally unexpected since the prior low in early December had fulfilled all the requirements of a completed Triangle formation.  Unfortunately, Wave (E)s are rogues and can go “outside the box.”  Today is day 256 of the current Master Cycle.  A closer look at the Cycles Model suggests the reversal may come over the weekend, catching many unawares.

Buy Protection when you can…

Next Wednesday’s monthly VIX expiration shows Max Pain at 24.00 with 101,725 put contracts (short gamma) starting there.  Long gamma begins at 24.00 with 114,243 call contracts.  A low VIX at op-ex would be an unmitigated disaster for the dealers, as there are over 600,000 put contracts between 18.00 and 24.00.  However interest in calls is growing.

ZeroHedge remarks, “Last time VIX was here…

Expect to see a few of those calls soon, but they are wrong. Volatility is mean reverting, while the underlying assets can trend. Anyway, the VIX is puking further today and could be closing at the lowest levels since April 2022. Second chart shows the slightly shorter term view. The gap between VIX and SPX that started forming in mid December remains wide as people “suck fear” out of this market.”


TNX futures may have bottomed out last night at 34.18, but the morning cash market shows a higher low, leaving yesterday as a potential Master Cycle low at day 266.  Yesterday’s 30-year Treasury auction may have laid a trap for unexpected investors, not anticipating the market could turn on a dime.

ZeroHedge observes, “What a blowout auction.

After a stellar 3Y, an impressive 10Y (both of which came in far stronger than expected, prompting us to correctly say there were zero jitters about today’s CPI print in the bond market), moments ago we got an absolutely blowout, record 30Y auction.

The high yield of 3.585% was fractionally above last month’s 3.513%, but stopped through the When Issued by 2.4bps, one of the biggest stop throughs on record which was especially remarkable when considering the powerful rally across the curve going into the auction and lack of concession as the curve had tried to steepen on several occasions, and failed.

Th Bid to Cover of 2.451 was well above last month’s 2.249 and was the highest going back all the way to September 2021.

But it was the internals that were blowout, with foreign buyers, or Indirect bidders including central banks, private investors and sov wealth units, awarded a record 74.63%, the highest on record (and far above last momth’s 61.57%) as foreigners just couldn’t get enough.”


USD futures may have made a new Master Cycle low in the overnight session at 101.72.  However, it appears to be bouncing off that low.  Today is day 260 of the current Master Cycle.  The Model suggests a possible reversal over the weekend, with potential strength.


Posted in Published | 1 Comment

January 12, 2023

9:10 am

SPX spiked higher on the “in line” CPI print.  It challenged the 200-day Moving Average at 3987.35, then reversed.  This may trap “lazy long” investors who may not be ready for a Key Reversal ( when the share price accelerates in an ascending trend, exceeds the current peak and after a high opening on the next day, the price falls and closes below the previous day’s trading range), as we did in December.

ZeroHedge remarks, “Once again, US equity markets have squeezed dramatically higher in the last few days (post-payrolls) ahead of this morning’s all-important CPI print…

All of which, as Nomura’s Charlie McElligott notes, shows strong evidence of “fear of the right tail” yet again in Equities, due to “trending” expectation of a “dovish CPI” print today (set-up for disappointment on “just in-line”?)”


8:15 am

Good Morning!

SPX futures rose to 3984.10 this morning, above the 61.8% Fibonacci retracement value of 3971.40.  The CPI print may dictate the direction of the markets.  A lower CPI may give the SPX a burst of energy taking it to a possible high near 4150.00 over the next two weeks.  A higher CPI print may push the SPX o a new low.

Today’s op-ex shows Maximum pain for options investors at 3935.00.  Long gamma begins at 3950.00, while short gamma starts at 3900.00.  Friday’s Max Pain is near 3900.00 with long gamma starting at 3950.00 and short gamma beginning at 3850.00.

ZeroHedge speculates. “We previously showed a CPI-dependent market matrix from both JPMorgan and Goldman, as well as an analysis by Morgan Stanley why tomorrow’s CPI print is likely to miss big.  Now, we take a look at what consensus expects.

According to Wall Street economists, tomorrow at 830am, the BLS will report the following data for the month of December:

  • CPI MoM: exp. -0.1%, down from 0.1% in November
  • CPI Core MoM: exp. 0.3%, up from 0.2%
  • CPI YoY: exp. 6.5%, down from 7.1%
  • CPI Core MoM: exp. 5.7%, down from 6.1%

Broader picture, market is already pricing in a lower inflation path than Fed’s SEP shows for 2023. Specifically, CPI fixings imply headline PCE inflation below the Fed’s 2% goal by July and around 2% goal by year-end.”

ZeroHedge reports, “US futures are trading near session highs after earlier fluctuating between gains and losses ahead of make-or-break inflation data which many expect will show price pressures continuing to ease. S&P 500 futures traded 0.1% higher as of 7:30am ET, just shy of 4,000, one day after the S&P 500 clocked this year’s first back-to-back gains on Tuesday and Wednesday. The gains stem from bets that cooling inflation ill give the Federal Reserve room to slow its pace of rate hikes, a take substantiated by Boston Fed chief Susan Collins, who said she was leaning toward a quarter-point move at the bank’s Feb. 1 meeting. Treasuries steadied after gains in Wednesday’s session, with the 10Y trading at 3.52%, while a gauge of dollar strength edged lower as investors looked beyond the drumbeat of hawkish comments from Federal Reserve officials. The yen rallied on a report that the Bank of Japan will look into the side effects of its ultra-loose monetary policy. Commodities are mostly higher with the dollar weaker.”


VIX futures consolidated in a narrow range ahead of the CPI print.  The corrective pattern appears complete as of Tuesday, day 253 of the Master Cycle.  A reversal may be imminent.

ZeroHedge asks, did you know,”In the final days of 2022, Goldman’s economists predicted that “the biggest political risk” of 2023 will be the Congressional showdown over America’s favorite periodic drama: the debt limit.

This is what the bank’s chief economist Jan Hatzius said then: “The debt limit likely poses the greatest political risk next year, and we expect it to rival the 2011 episode in its disruption to financial markets and the economy. That said, we do not expect Congress to enact major fiscal changes. Republicans might press for spending cuts in a debt limit deal, but we do not expect substantial cuts next year. The White House might press for increased fiscal support, but this also looks unlikely as we believe a soft landing is more likely and a divided Congress would have difficulty responding to a recession even if one occurs.”


TNX extended its (declining) Master Cycle this morning, on day 266 of the current Master Cycle.  A reversal may be imminent, with a possible four weeks of rally ahead.

ZeroHedge reports, “Headline and Core CPI printed ‘as expected’ (which is likely disappointing for the whisper numbers and remember the last CPI printed ‘cooler than expected’). Goods inflation continues to slow but Services inflation continues to soar (highest in over 40 years). Shelter costs continue to soar.

*  *  *

Expectations for this morning’s headline CPI ranges from +6.3% to +6.8% YoY, with consensus seeing a 0.1% decline MoM – something the world and his pet rabbit has bid stocks up into anticipating this as the signal for an about face by The Fed on their higher for longer narrative as it ‘proves’ inflation has peaked.

The headline print came in right as expected with a 0.1% decline MoM (leaving the YoY print at +6.5% as expected)…”


USD futures made a new Master Cycle low at 104.06 on day 259.  This sets up a potential reversal into an USD rally through the end of February.


Posted in Published | Comments Off on January 12, 2023

January 11, 2023

3:09 pm

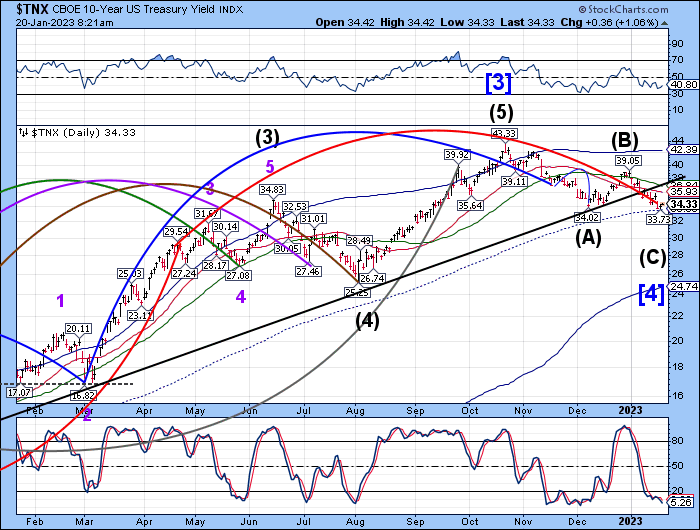
TNX faded after 10-year auction, then stabilized.  The Cycles Model remains neutral at this point, but the uptrend may resume.

ZeroHedge comments, “One day after what may have been the strongest 3Y auction in history (and if not, then certainly one of the top 3), moments ago the Treasury sold $32BN in 10Y paper (in the form of 9Y-10M reopening of Cusip FV8), in what was another stellar auction.

The high yield of 3.575%, was the second consecutive drop since the 10Y auction peaked at 4.14% in November, and was also down from 3.625% in December. More importantly perhaps, compared to the When Issued 3.580%, today’s auction stopped through by 0.5bps. This was the first 10Y auction that did not tail since August, and it certainly was better than last month’s auction when the tail was a record 3.7bps:”


2:50 pm

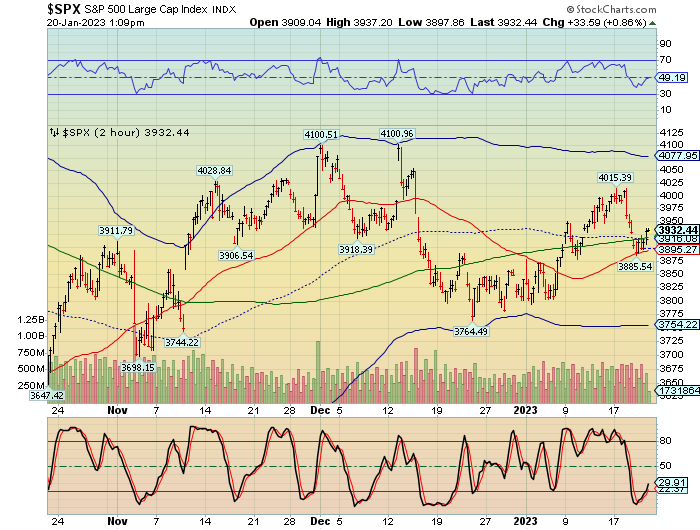
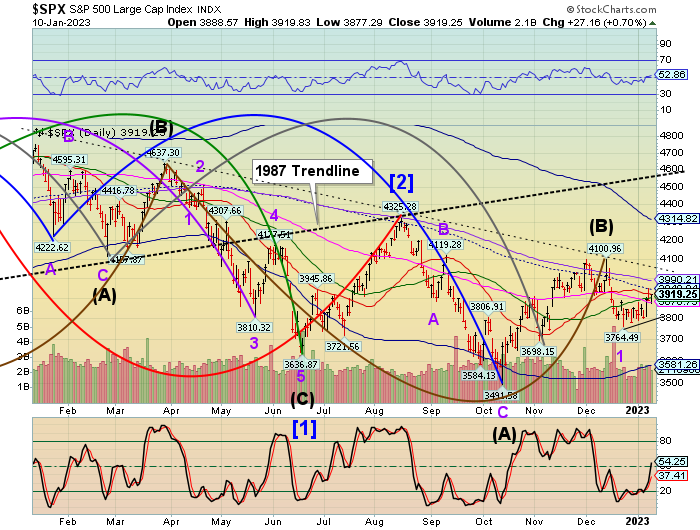
SPX is approaching its 61.8% retracement value at 3971.40 and has completed 19 market days since its inception on December 13.  It still has 17.2 probable days of decline ahead, starting this afternoon.  Most investors are looking up.  A reversal here may surprise many, followed by the CPI print tomorrow morning.

ZeroHedge remarks, “Nomura’s Charlie McElligott began this morning’s note by warning investors that tomorrow’s CPI print “is a bigger deal than the market is already giving it credit for.”

Specifically, he notes that while straddle pricing is for around a ~2.0% SPX move, we’ve continued to “over-realize vs implieds” consistently on CPI prints, which is why owning Gamma for this day has been the right trade for most of the past 9 months…”


10:14 am

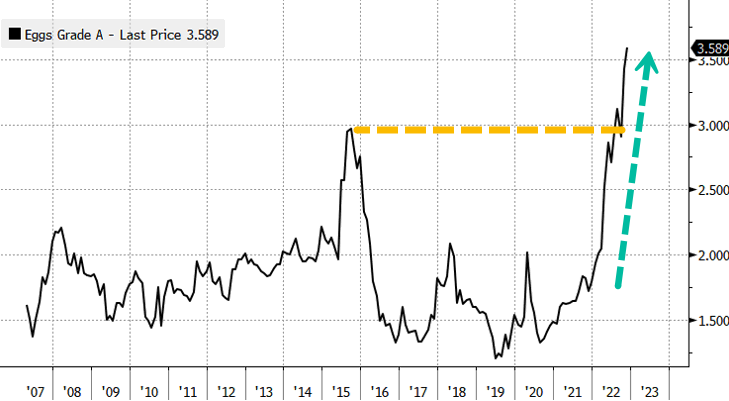
The Ag index may have put in its Master Cycle low yesterday, on day 266.  Should that be correct, the new Master Cycle may only last to the end of the Month, but may be buoyed with unexpected strength.

ZeroHedge remarks, “Most Americans have watched their food expenses at grocery stores ballon in recent years. The one item that likely shocked consumers the most is the skyrocketing price of a dozen eggs.

Avian flu has decimated the US egg-laying hen population at commercial farms. Tens of millions of hens have been culled to prevent one of the worst bird flu outbreaks on record from spreading, though efforts have failed as the virus continues to decimate US egg production, sending retail prices sky-high.

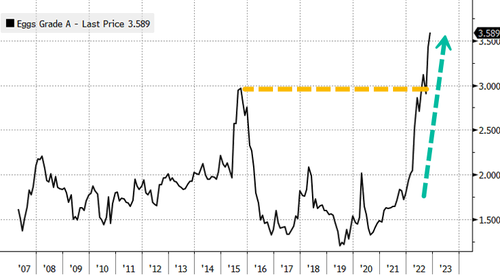
Readers have known about the dire egg situation for many quarters, but the evolving story is that people are now posting images of supermarkets across the country running out of eggs.”


8:10 am

Good Morning!

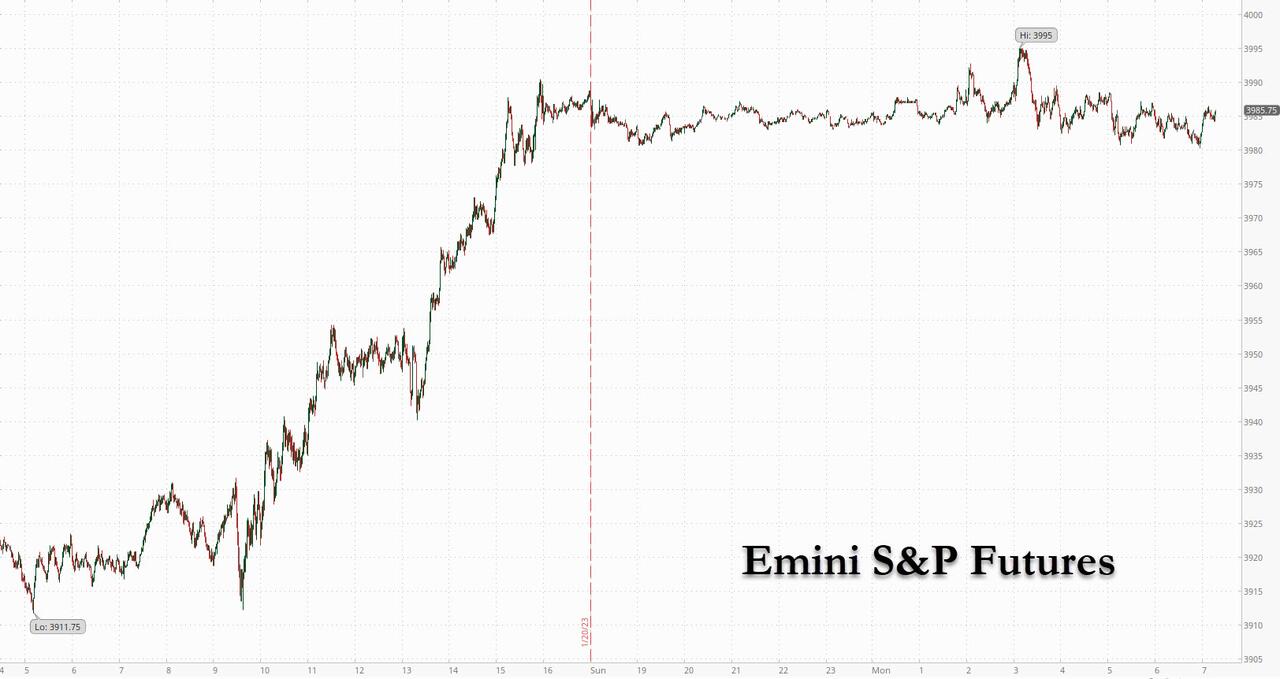
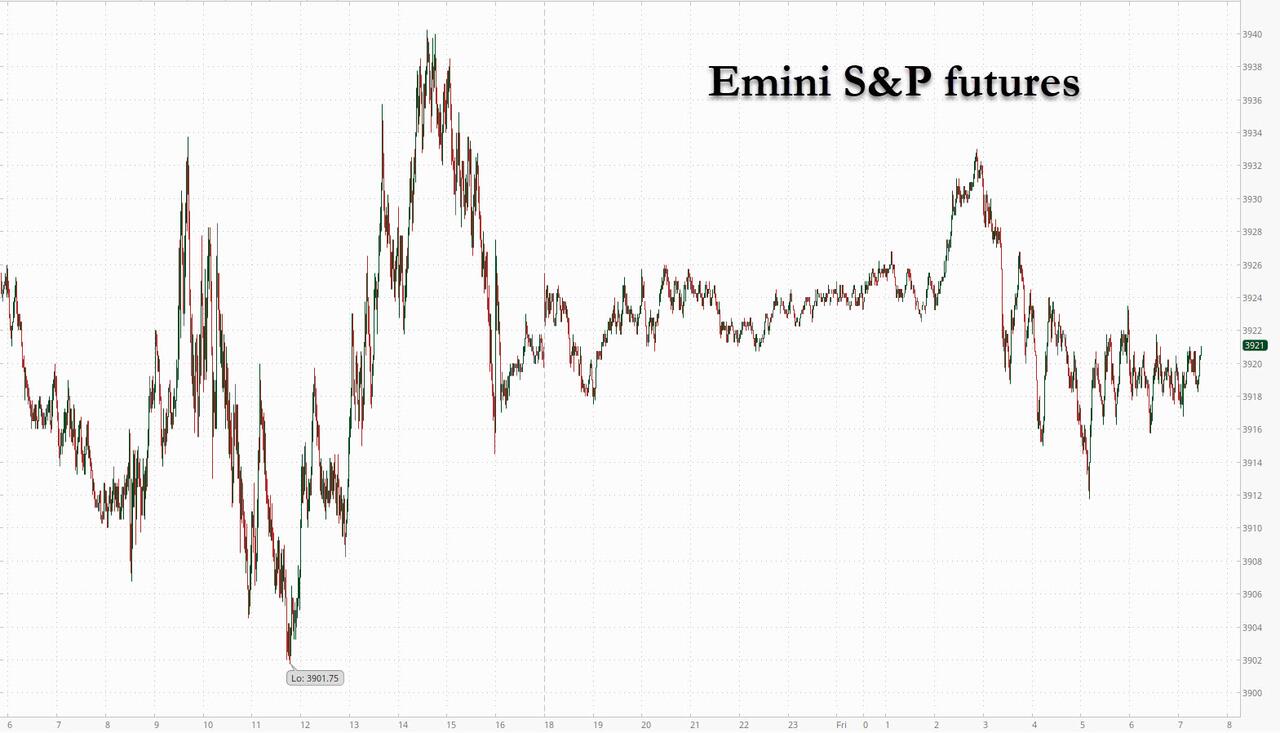
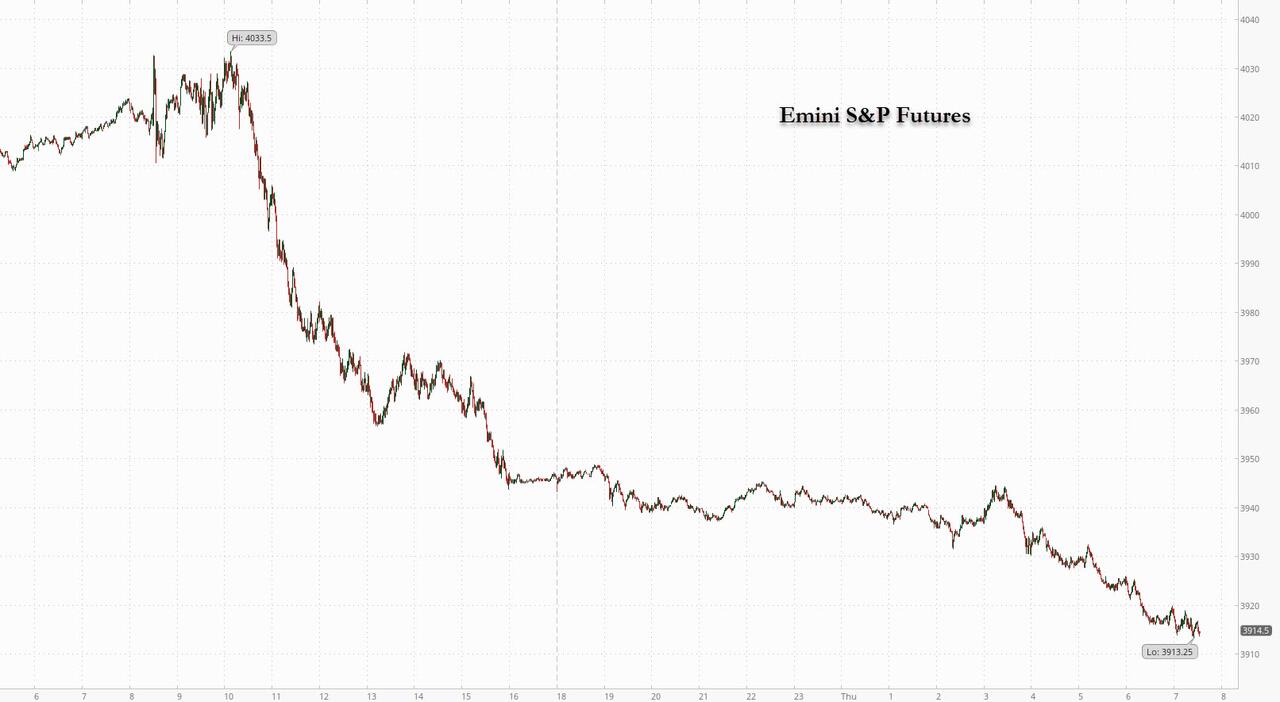
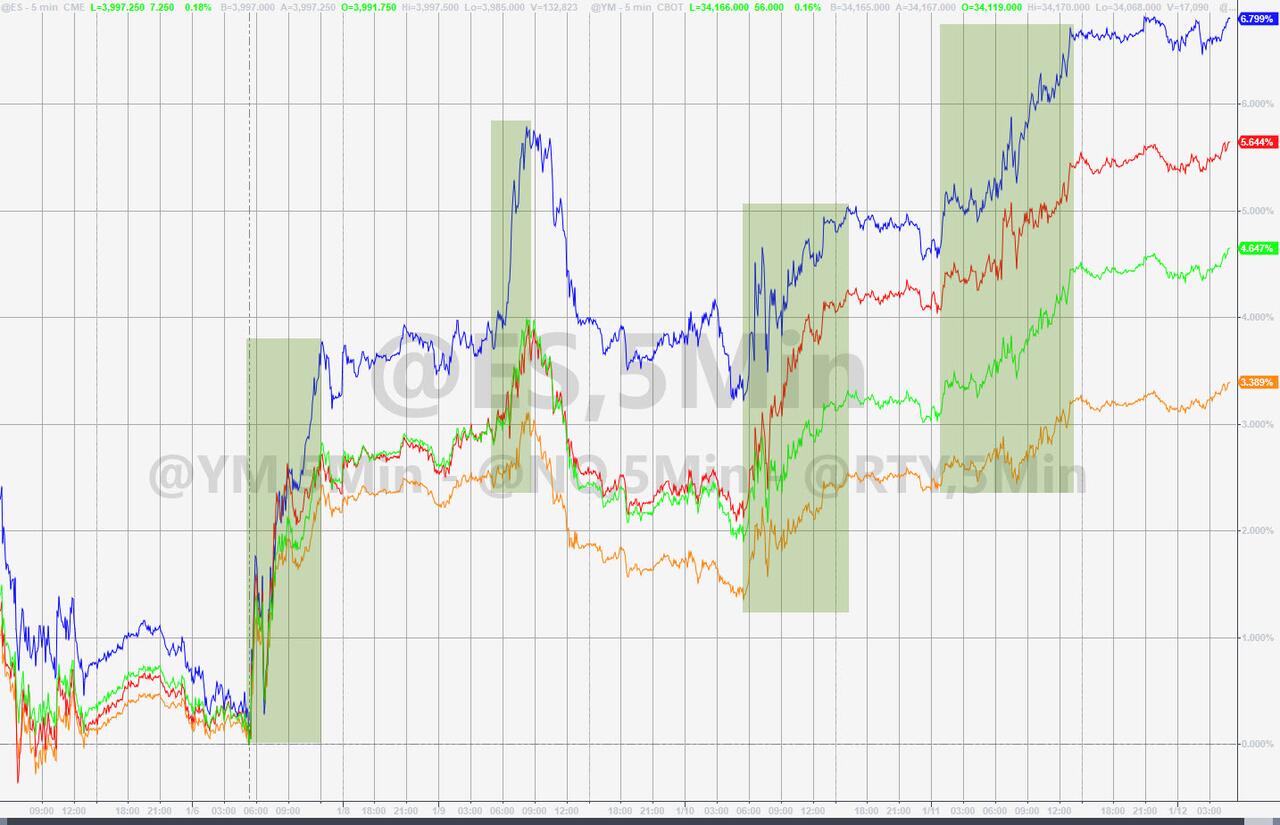
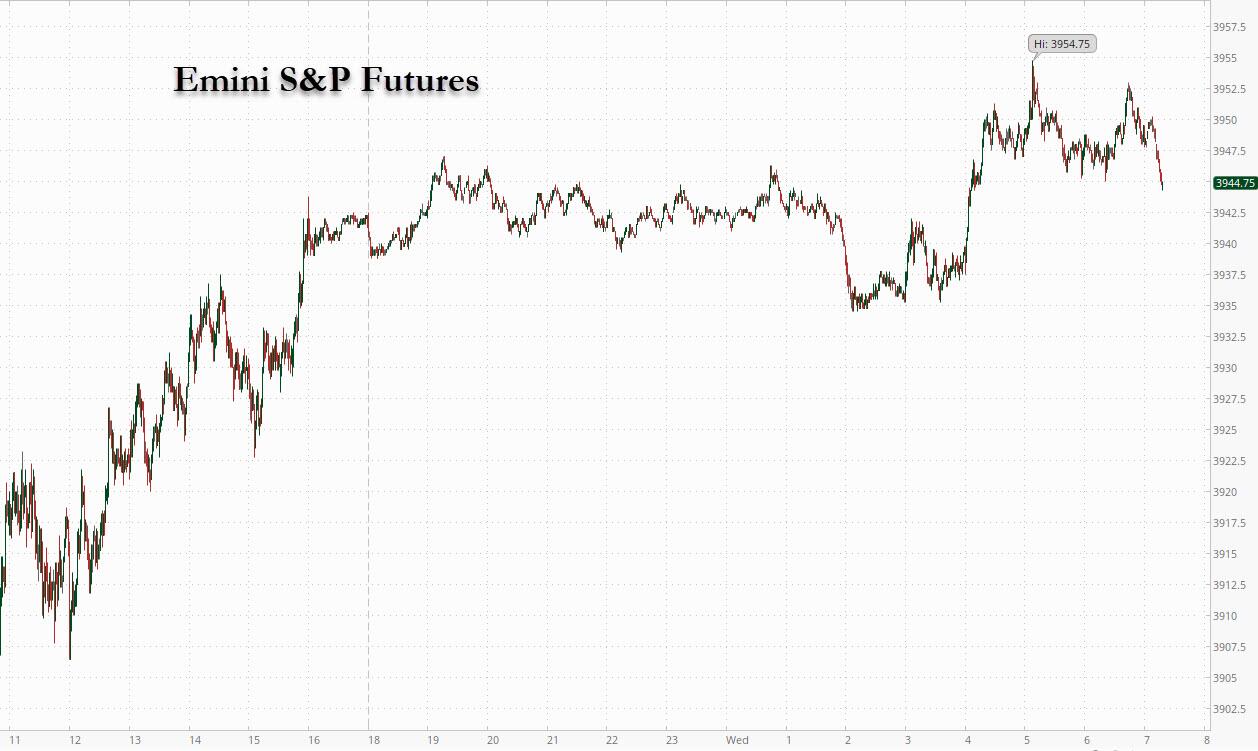
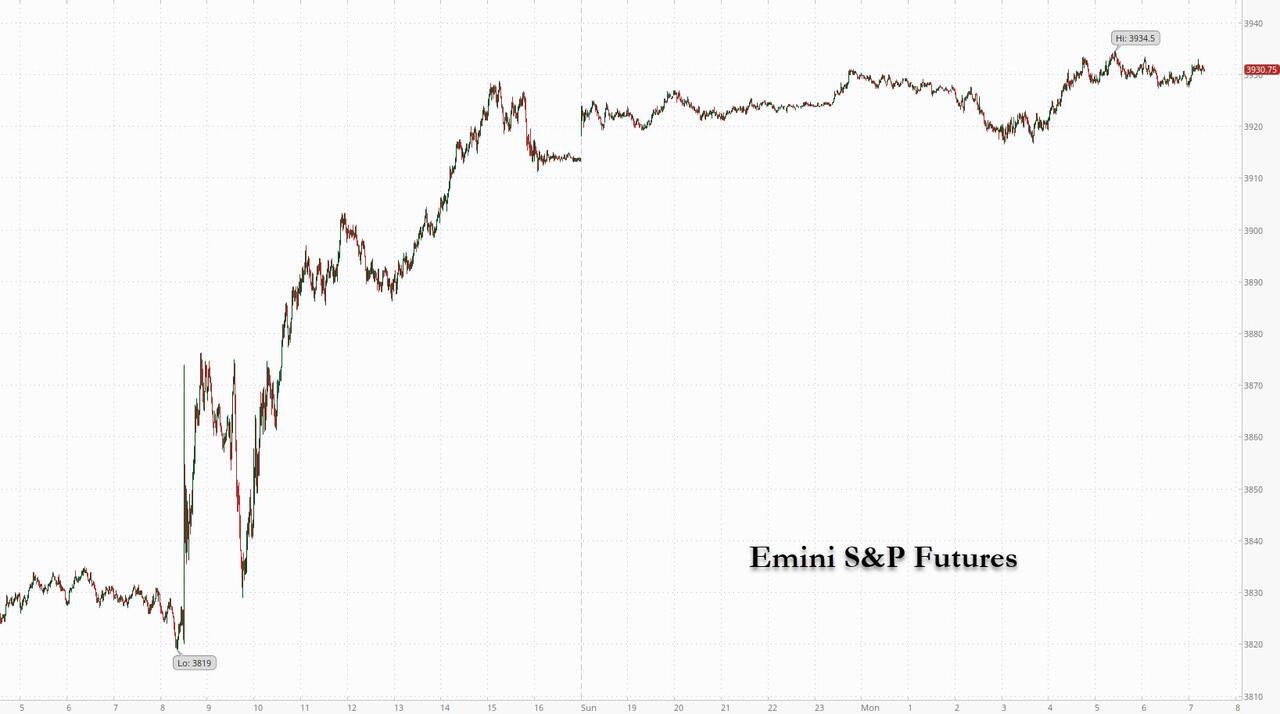
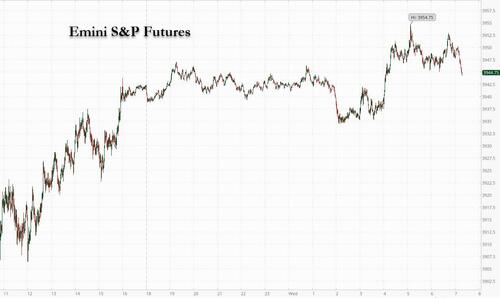
SPX futures are hovering in a narrow range near the close.  The high at 3950.57 remains intact, but there seems to be a hesitancy to decline.  There are three weeks left in the current Master Cycle.  Whichever way the market goes may set the tone for the rest of the year.

ZeroHedge reports, “US equity futures were set to rise for a second day as upbeat sentiment ahead of tomorrow’s key CPI print – which JPM gives 85% odds of pushing stocks at least 1.5% higher – lifted global markets despite a freak outage of key FAA advisory system this morning led to a nationwide ground halt for all domestic flights (until at least 9am) pre. Contracts on the S&P 500 and Nasdaq 100 ticked up 0.1% as of 7:15am ET while Europe’s Stoxx 600 Index rose 0.8%. The FTSE 100 climbed within striking distance of a record high; Asian equities were supported by China lifting Covid restrictions. Among the top corporate news, Credit Suisse weighs cutting by half the bonus pool for 2022 after a turbulent year and Apple plans to start using its own custom displays in mobile devices as early as next year. Treasury yields dropped and the dollar gained for the second day in a row.”


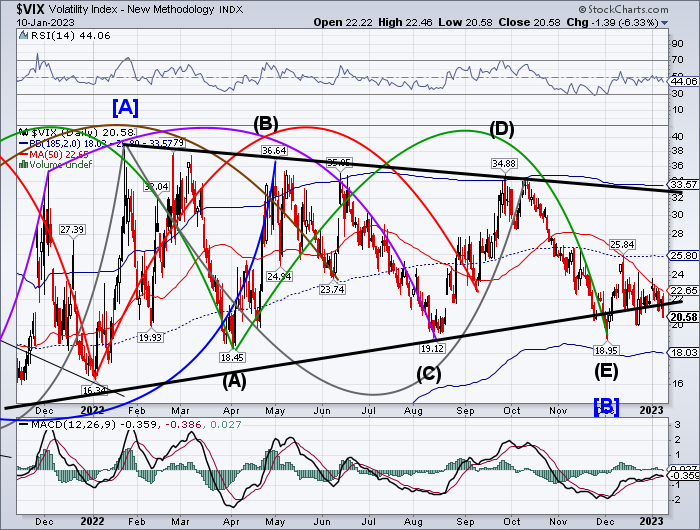
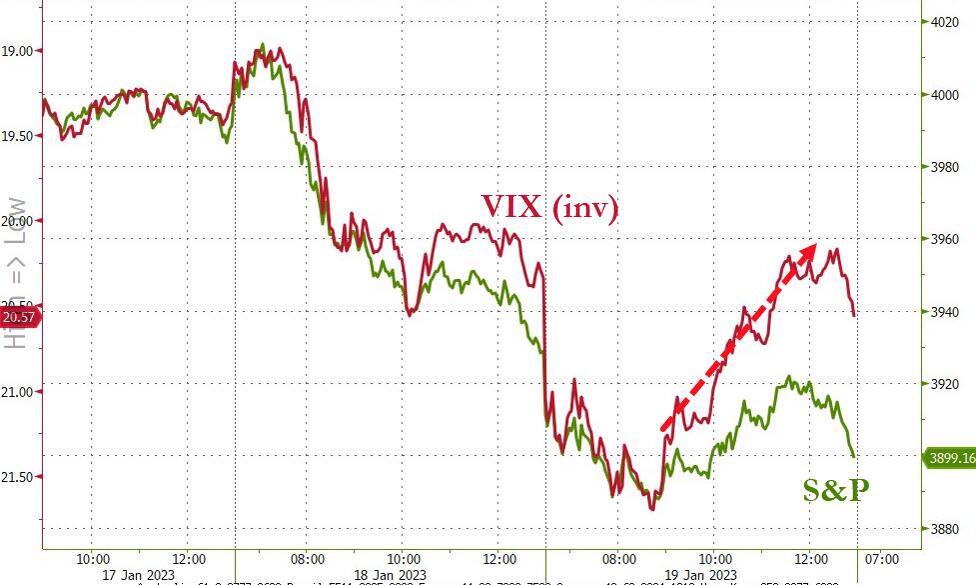
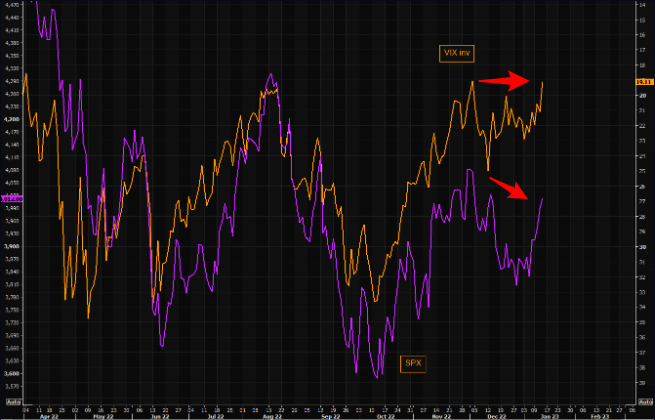
VIX futures appear stuck at the lower end of yesterday’s trading range.  This may be due to the weekly op-ex this morning. At the last count, there were 40,229 put contracts with a strike at 21.00 expiring this morning.  This may be a good example of short gamma suppressing the VIX.  At the same time, VIX may spring out of its box as the expiry is settled.  Today is day 254 of the Master Cycle, suggesting a low may be put in by the end of the week.

Today’s op-ex shows why the VIX remains near the low, as there are 40,330 put contracts at the 21.00 strike price.  While investors are loading up on puts for next week’s op-ex, there are some very large investors buying calls for next week’s expiry.  Someone invested over over a half million dollars for nearly 225,000 contracts at a strike of $70.00!


TNX is making a corrective pullback from yesterday’s test of the trendline.  Having made its Master Cycle low on January 9, it may be gathering energy for the  next leg up.  The new Master Cycle is about 4 weeks long and the Cycles Model suggests trending strength may be about to appear.

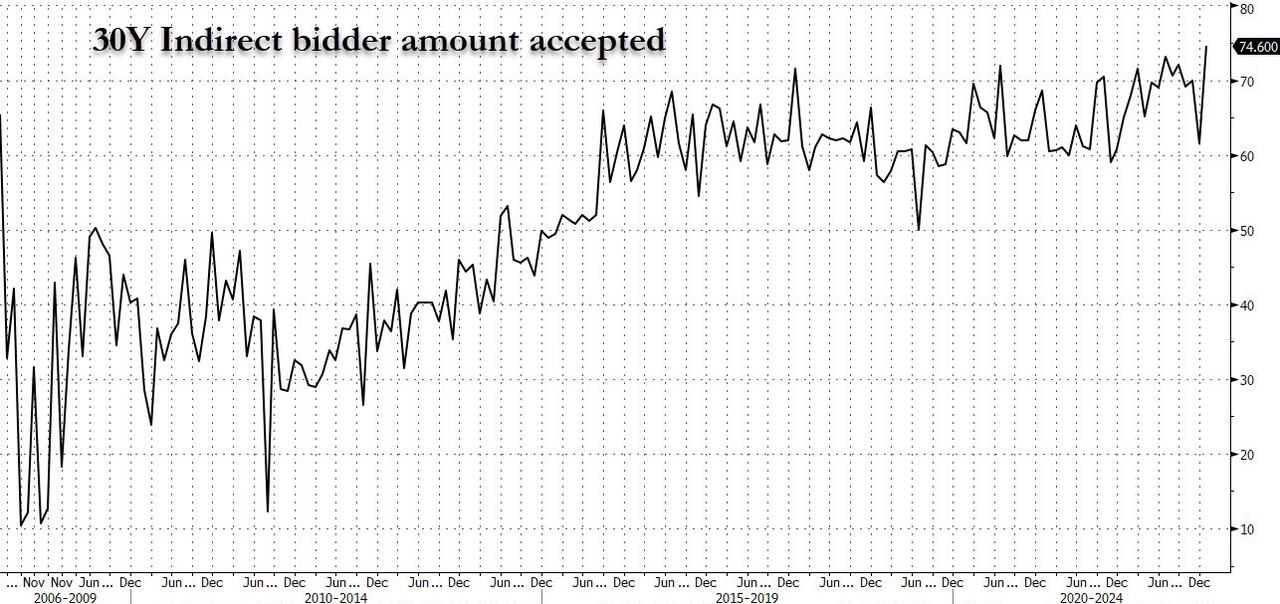
ZeroHedge observes, “And we’re off: the first coupon auction of 2023 is in the history books and what a blowout it was.

Today’s sale of $40 billion in 3Y paper can only be described as an absolute whopper, starting at the top: the 3.997% high yield was the 2nd consecutive drop in the yield, and the first sub-4.00% since September; more importantly it stopped through the 4.000% When Issued by 2.3bps, the biggest stop through since at least 2016 (which is how far back our series goes.)

The Bid to Cover was also stellar: at 2.839, it was not only above last month’s 2.551 but also above the six-auction average of 2.518; in fact it was the highest since April 2018.

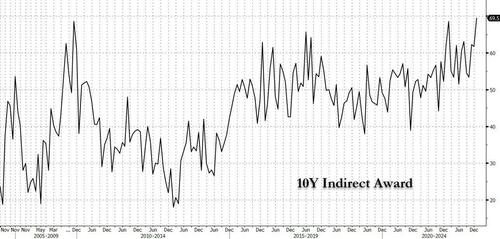
The internals were also stellar, with Indirects taking down a record 69.5%, and with Directs awarded 13.8%, that meant that Dealers were left with just 17.3%, the lowest on record.”


USD futures may be challenging the trendline near 103.00.  Today is day 258 in the current Master Cycle.  I have marked Monday’s low as the possible terminus of the Cycle, but await further developments, including a clear rally above the trendline for confirmation.


WTI futures hit a new high at 77.14 this morning as it emerges out of a probable Master Cycle low on January 5.  Crossing above Intermediate-term resistance at 76.63 may have created a buy signal, to be confirmed above the 50-day Moving Average at 80.35.  If so, the new Master Cycle may be nearly two months long and bullish for crude oil.

ZeroHedge remarks, “Oil prices eked out gains today (4th straight day higher) with WTI back above $75 as fears of a hawkish Powell speech passed painlessly (despite some hawkish FedSpeak from his underlings) and a flat dollar didn’t impact direction.

“Technically, the energy complex remains stuck in neutral, with a wide range for prices to swing inside of without creating a new trend,” analysts at wholesale-fuel distributor TACenergy wrote in a note to clients.

“Fundamentally, the case for prices bottoming is getting stronger as lingering supply issues coincide with demand picking up both domestically and abroad.”


Posted in Published | Comments Off on January 11, 2023

January 10, 2023

10:10 am

BKX, our liquidity proxy, made its Master Cycle high yesterday, on day 266.  Today may be the beginning of the decline from the mid-Cycle resistance at 105.81.  Confirmation of the decline and sell signal may be had beneath the 50-day Moving Average at 103.37.  It appears that a decline may be in order that may last through the end of January.  The Head & Shoulders formation may be our guide for a potential target.  While several US banks are showing weakness, the real problem may be in Europe, where several major banks are on the rocks.

ZeroHedge observes, “The last time we looked at the massive money-printing (literally) hedge fund that also moonlights as the Swiss National Bank, we were stunned to learn that its US equity holdings had exploded to a record $177 billion at the end of Q1 2022, orders of magnitude more than the mere $27 billion it held as recently as 2014.

Since then things haven’t gone exactly as planned for the massive asset gatherer, and the value of its US equity longs has tumbled by almost $50 billion from the record high in Q1 to $139.8 billion as of Q3, a two year low… and a huge loss despite the fact that all the SNB has to do is print some more Swiss Francs, sell them for dollars and then simply buy some more stonks to plug whatever P&L holes it has.”


8:10 am

Good Morning!

SPX futures declined to 3870.20 this morning after closing just above the 100-day Moving Average at 3882.38.  It had declined beneath the 50-day Moving Average at 3903.26, confirming a sell signal.  The Cycles Model suggests the decline may intensify over the next week with a likely target near 3400.00.  But the decline may not be over until the end of January.

A look at today’s options chain shows Maximum Pain for options investors at 3905.00.   The noose is tightening with long gamma starting at 3910.00 and short gamma at 3985.00.  Day traders are chasing the close trying get maximum gain instead of maximum pain.

ZeroHedge reports, “US futures dropped as investors waited to see whether Fed Chair Jerome Powell will differentiate himself from hawkish comments made by two policy makers on Monday when he speaks later at an event in Sweden at 9am ET. S&P 500 and Nasdaq 100 futures dropped to session lows around 7:15am ET after trading little changed for much of the overnight session. Traders are also reluctant to take strong directional bets before US inflation data is published on Thursday and visibility clears up on the trajectory of interest rates. The Bloomberg Dollar Spot Index was near session after trading earlier in a tight range, while the rest of the currencies in the Group of 10 were mixed. Treasuries also broke out above a range, hitting session highs around 3.57% around the time stocks stumbled. Oil rose with gold and Bitcoin rallying for a seventh-straight day.”


VIX futures rose to 22.45 in the morning session, approaching the 50-day Moving Average at 22.78.  A period of strength may have begun yesterday and may last another week.  Four of six indicators have turned positive for the next week, a rare event which suggests a probable breakout.

Tomorrow’s op-ex shows Max Pain at 22.00.  There is a massive short position at 21.00, possibly an attempt to sink the VIX.  Long gamma begins at 25.00.  Long positions are not very well populated.  However, day traders may be quick to move in on a breakout.


TNX has risen to 36.00 this morning and may rise above the trendline and Intermediate-term resistance at 36.50.  It made its Master Cycle low on Monday at 35.08, on day 263 of the Master Cycle.  The corrected Elliott Wave structure explains the extension of the prior Master Cycle from November 16 to December 7 to accommodate the completion of Primary Wave [4].  TNX is back on a buy signal above 36.50.

ZeroHedge reports, “At 9am ET, Powell will be speaking at a Riksbank panel on “central bank independence and the mandate – evolving views”, and accordingly, some believe that there is a risk that he disappoints those who are looking for fresh insight on the current monetary policy outlook.

Stocks slumped ahead of Powell’s speech yesterday on fears that Fed chair will talk stocks down as financial conditions have once again eased notably since the FOMC even though Powell explicitly warned that “unwarranted easing is a problem.”


USD futures are on the rise after a possible Master Cycle low yesterday on day 256.  A potential buy signal may have been made above 103.00.  If so, the new Master Cycle may see a rise in the USD through the end of February.


Posted in Published | Comments Off on January 10, 2023

January 9, 2023

1:18 pm

SPX may have reversed from the mid-Cycle resistance at 3950.82.    The reversal may be confirmed with a decline beneath Intermediate-term support at 3925.00 or the 50-day Moving Average at 3904.29.


9:50 am

The Ag Index has stopped its decline last Thursday on day 261, very likely ending a retracement.  I had previous thought that the Ag Index may decline alongside other assets as liquidity declines.  However, the Cycles Model may indicate otherwise.  In essence, food may become more valuable than any other asset as liquidity diminishes.


9:40 am

BKX, our liquidity proxy, has extended its Master Cycle to test mid-Cycle resistance at 105.88 on day 266 of the Master Cycle.  A reversal may be imminent.  If so, the new Master Cycle may take BKX beneath the neckline of the Head & Shoulders formation in a short-but-sharp decline lasting through the end of January.  Abundant liquidity may be a thing of the past.

ZeroHedge observes, “It would be best to consider the idea that if you have good credit you will always be able to get a loan a myth. This is not about you, it is about markets and reality. People learn in a credit crunch that liquidity is far more important than interest rates. We are currently in a credit tightening cycle and it seems that greed has temporally overshadowed the potential this has to impact the economy.

Many years of an easy credit environment have numbed people to the reality that credit is not a guaranteed right. This is a reality that can hit us like a slap in the face. The notion you stand a snowball’s chance in hell of getting a loan in such an environment has yet to dawn on many people.  ”


8:25 am

SPX futures reached a morning high of 3914.80, between the 50-day Moving Average at 3901.44 and Intermediate-term resistance at 3925.32.   The 50% retracement value is 3931.39.  Today SPX will have completed 17.2 market days from the December 13 high and has another 17.2 days to complete this Master Cycle.  Investors are being worn down since this is the 10th day of nominally positive returns after a 7-day decline.  The market just doesn’t feel bearish.

In today’s op-ex, Maximum pain for options investors is at 3875.00.  Long gamma starts at 3900.00, while short gamma begins at 3850.00.

ZeroHedge reports, “Futures extended their Friday post payrolls gain on the back of Chine reopening optimism coupled with speculation that China’s tech crackdown is finally ending – just as we speculated this weekend when reporting on Jack Ma’s ceding control of Ant Financial. S&P futures rose 0.4% as of 7:30 am ET while Nasdaq contracts 100 added 0.5%. And while European stocks were mostly in the green, the bulk of overnight action was in Asia where the Hang Seng Tech Index jumped 3.2% Monday, led by Alibaba Group after a top central bank official said the clampdown on the Internet sector was drawing to a close. The broader market also advanced, with a gauge of Chinese equities listed in Hong Kong rising 2%, helping push the MSCI Asia Index up 20% from its October low, setting it up for a bull market. The dollar weakened to a seven month low and oil rallied.”


VIX futures are higher this morning and may have crossed above the lower Triangle trendline at 21.50.  Overhead resistance is the 50-day Moving Average at 22.89, offering a potential buy signal.  Traders may recognize a breakout above 23.76 to 24.30.


TNX is consolidating above Friday’s low.  Friday is day 260 of the Master Cycle and may actually mark the low, should TNX rise above the trendline at 36.50.  This is a very close call and should be watched carefully.

ZeroHedge comments, “Is the Fed trying to wean the markets off monetary policy? Such was an interesting premise from former British diplomat Alastair Crooke via the Strategic Culture Foundation, to wit:

“The Fed however, may be attempting to implement a contrarian, controlled demolition of the U.S. bubble-economy through interest rate increases. The rate rises will not slay the inflation ‘dragon’ (they would need to be much higher to do that). The purpose is to break a generalised ‘dependency habit’ on free money.”

That is a powerful assessment that, if true, has an overarching impact on the economic and financial markets over the next decade. Such is especially important when considering the effect these repeated monetary and fiscal interventions have had on financial market returns of the previous decade.”


USD futures are challenging the trading channel trendline at 102.91 and may be putting in a Master Cycle low on day 256.  Stand by for a reversal that may confirm the low.


Posted in Published | Comments Off on January 9, 2023