December 22, 2022

1:10 pm

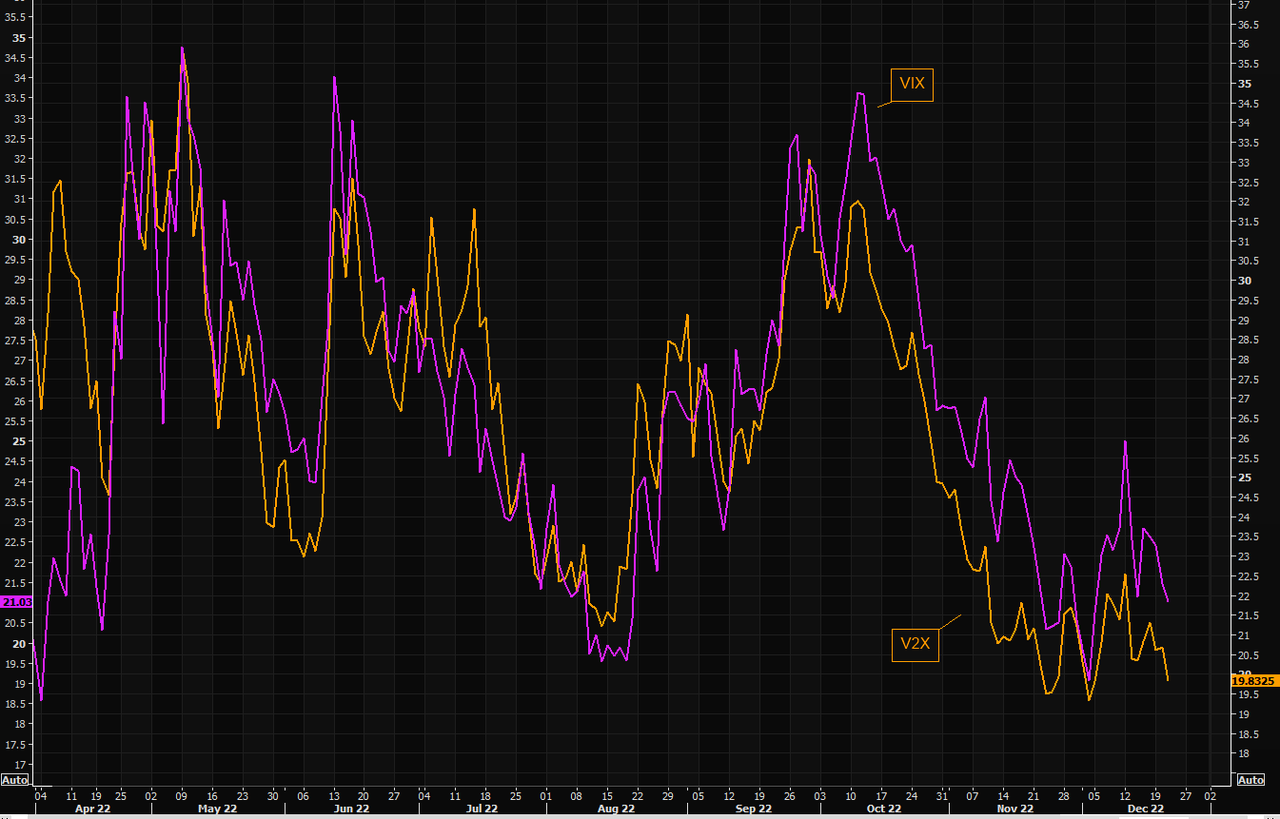
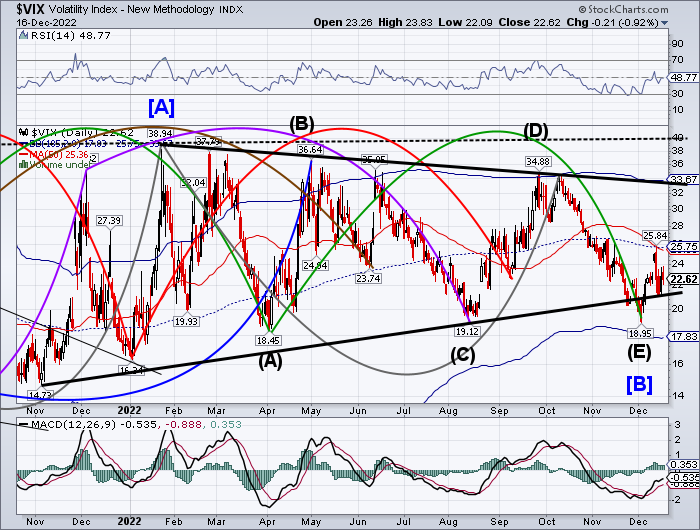
VIX has responded by rising toward the 50-day Moving Average at 24.50.  The rise above the trendline launched an aggressive buy signal.  The 50-day confirms it.


12:58 pm

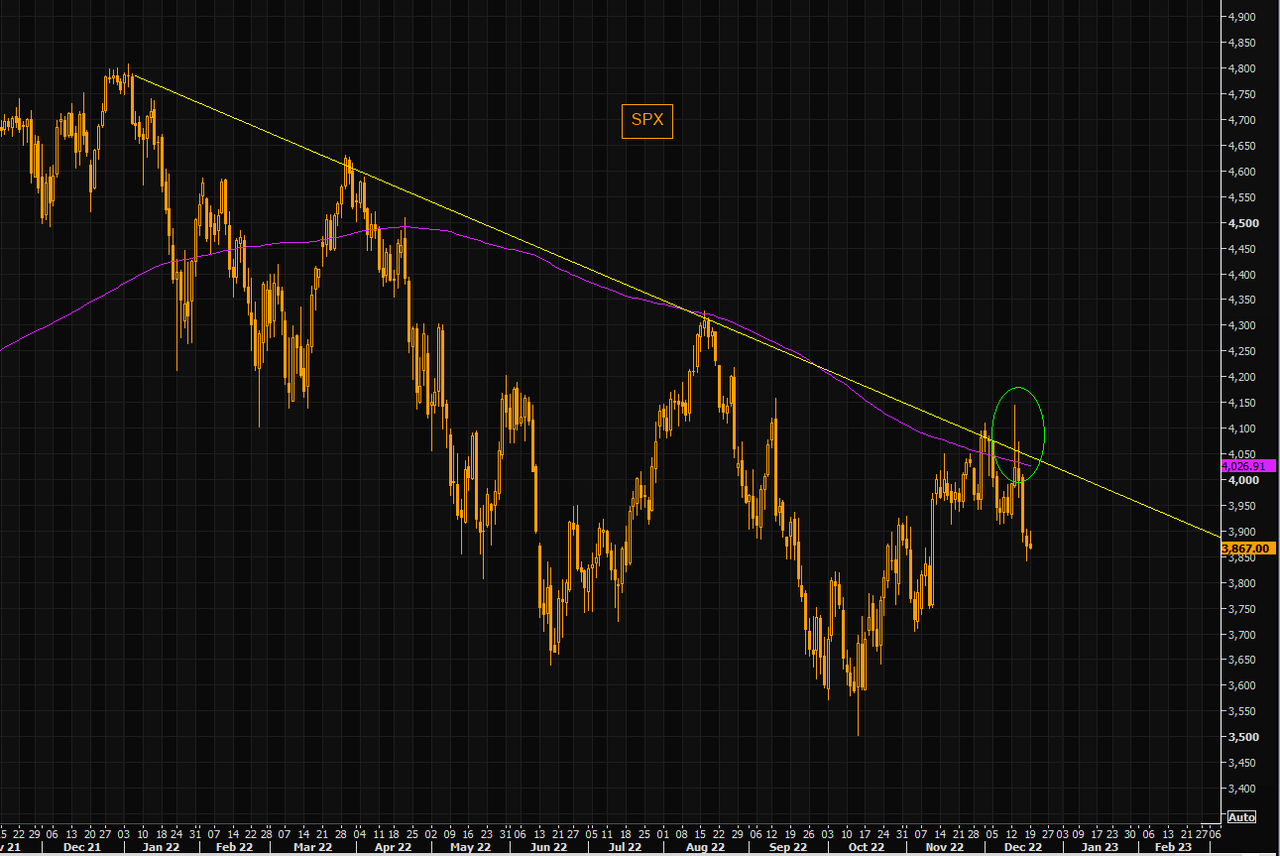
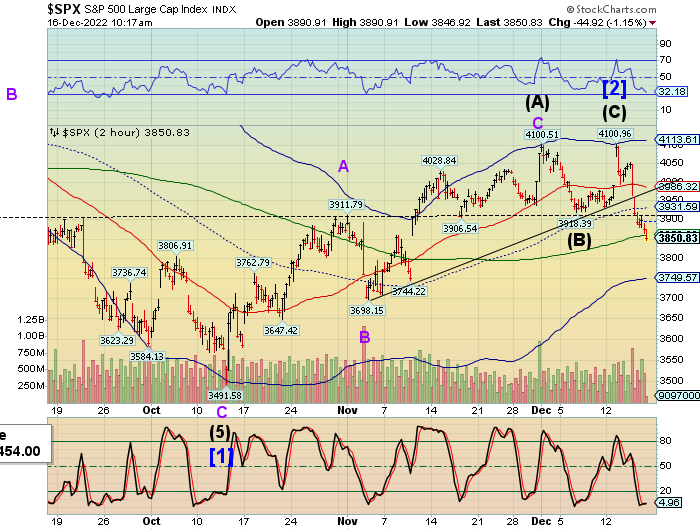
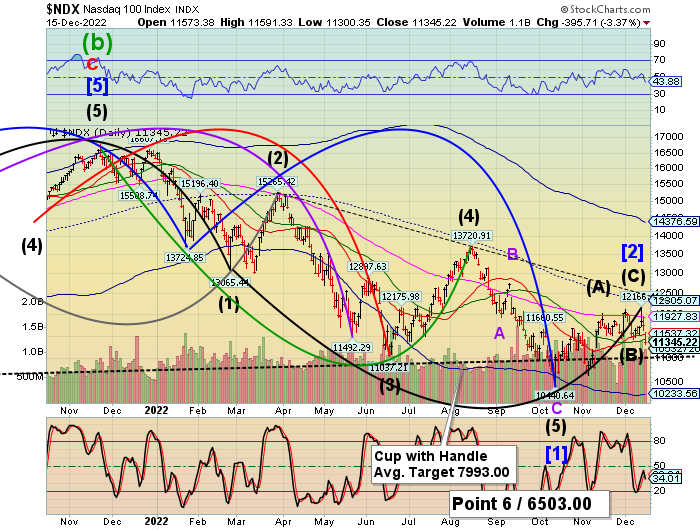
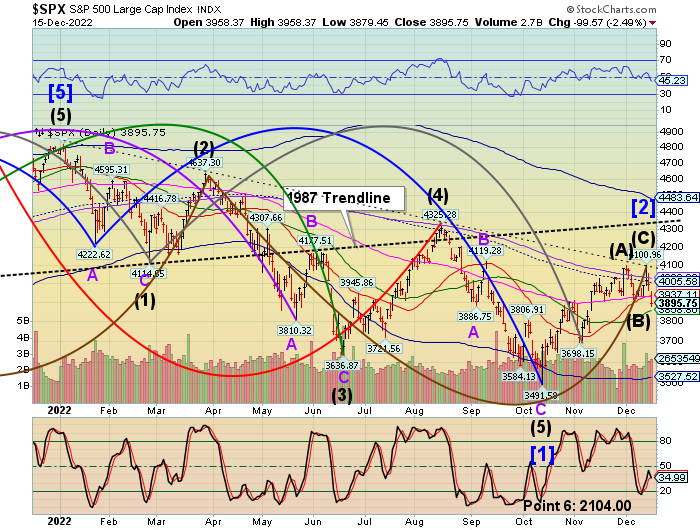
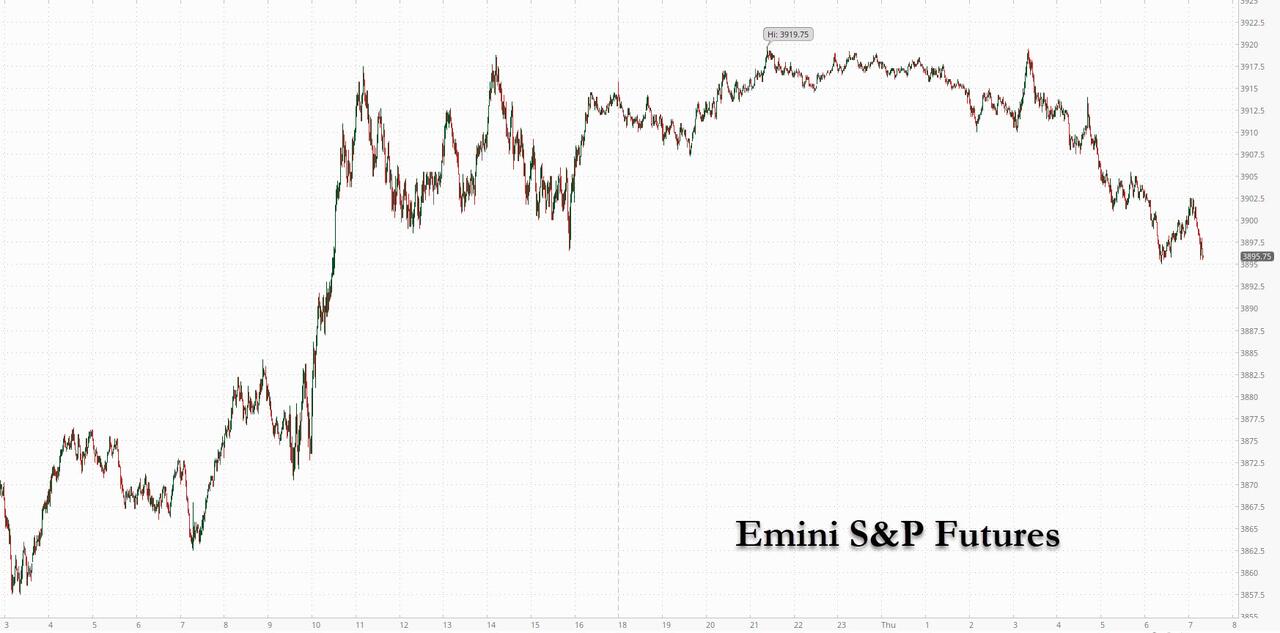
SPX has dropped well beneath its previous low at 3795.00, confirming the bearish trend.  The next possible support is at 3740.97 where a bounce may occur.  There is still the possibility of a bounce, but SPX is deep in short gamma beneath 3800.00.  Sadly, the runaway train may come at Christmas.

ZeroHedge observes, “Update (1245ET): Shit’s getting real in equity-land as this morning’s selling pressure has turned into a blood-soaked sea of red with TSLA leading the plunge, down 11%…

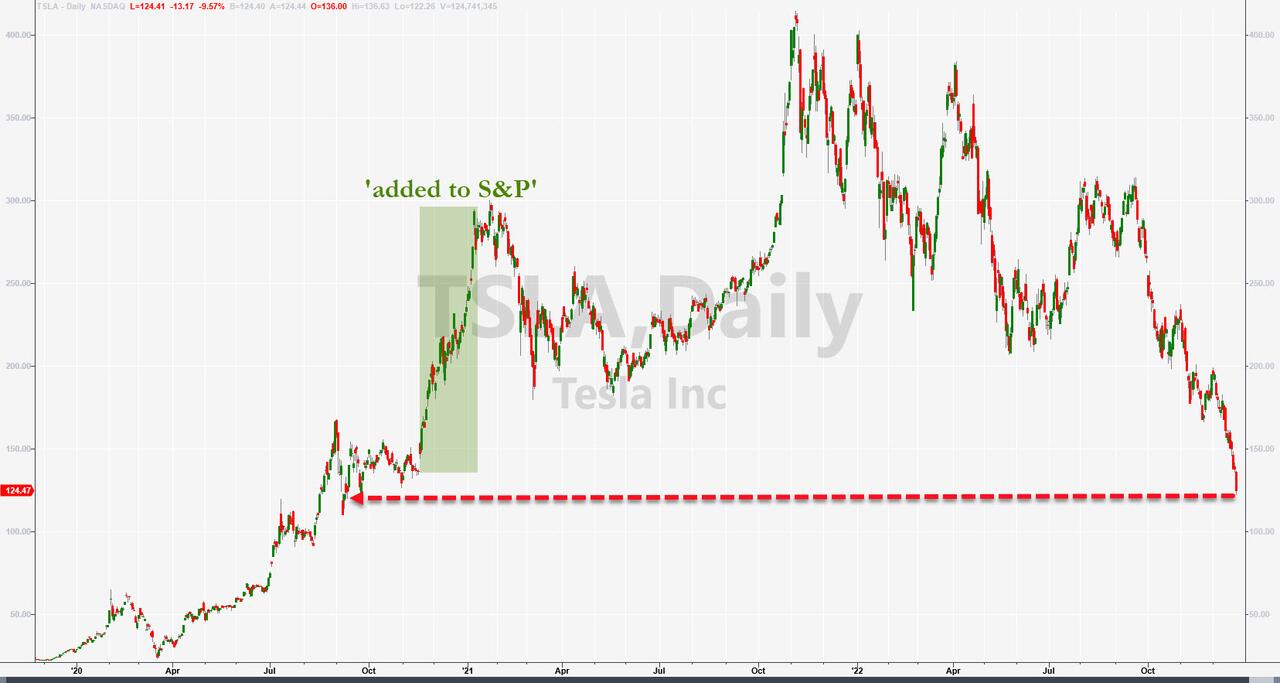
The S&P has erased all of the week’s gains…”


9:49 am

The Ag Index is challenging the 50-day Moving Average at 463.60 today. This may confirm a buy signal that may extend to the end of the year.  The target may be mid-Cycle resistance at 495.09 or the Lip of the Cup with Handle at 500.00.  The Ag Index may become very active next year as it emerges out of its six-month trading range.

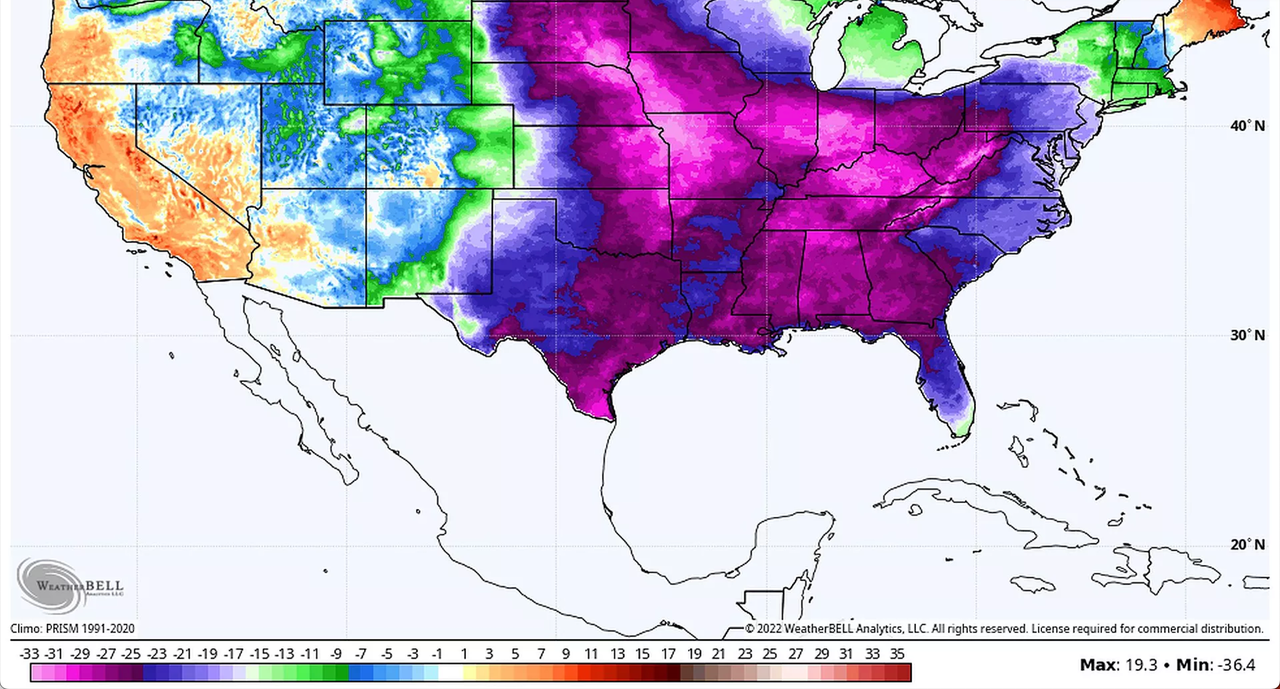
ZeroHedge warns OJ lovers, “Widespread cold air is already pouring into the Plains and Deep South. This cold will last through Christmas weekend into early next week and could threaten citrus groves across Florida.

America’s top orange juice maker is already battling a record decline in crop this season because of citrus greening, a devastating crop disease, and damage sustained by Hurricane Ian and Tropical Storm Nicole earlier this year. Now a cold blast could damage crops even more. ”

ZeroHedge observes, “Demand for US cropland remains robust despite skyrocketing borrowing costs and mounting macroeconomic headwinds. Private sales of cropland across the Midwest, the nation’s breadbasket, have jumped among the ultra-wealthy.

When it comes to investment choices, billionaires and centimillionaires make smart decisions (well, at least some) to preserve wealth. One of the best ways to do so is own tangible assets: land.

Investment in cropland has become popular among financial elites. The list of billionaires, including Bill Gates, Jeff Bezos, and Warren Buffet, has been growing amid a commodity boom across the US farm belt: ”


8:20 am

Good Morning!

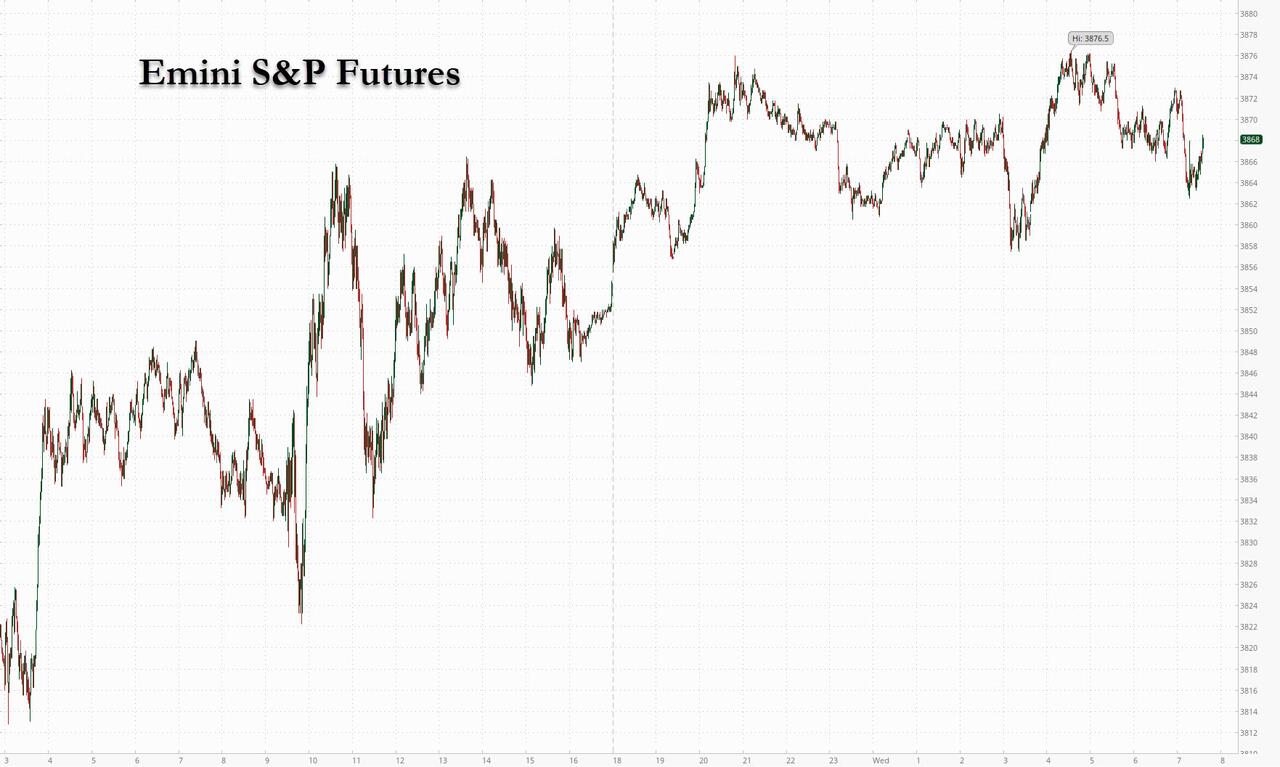
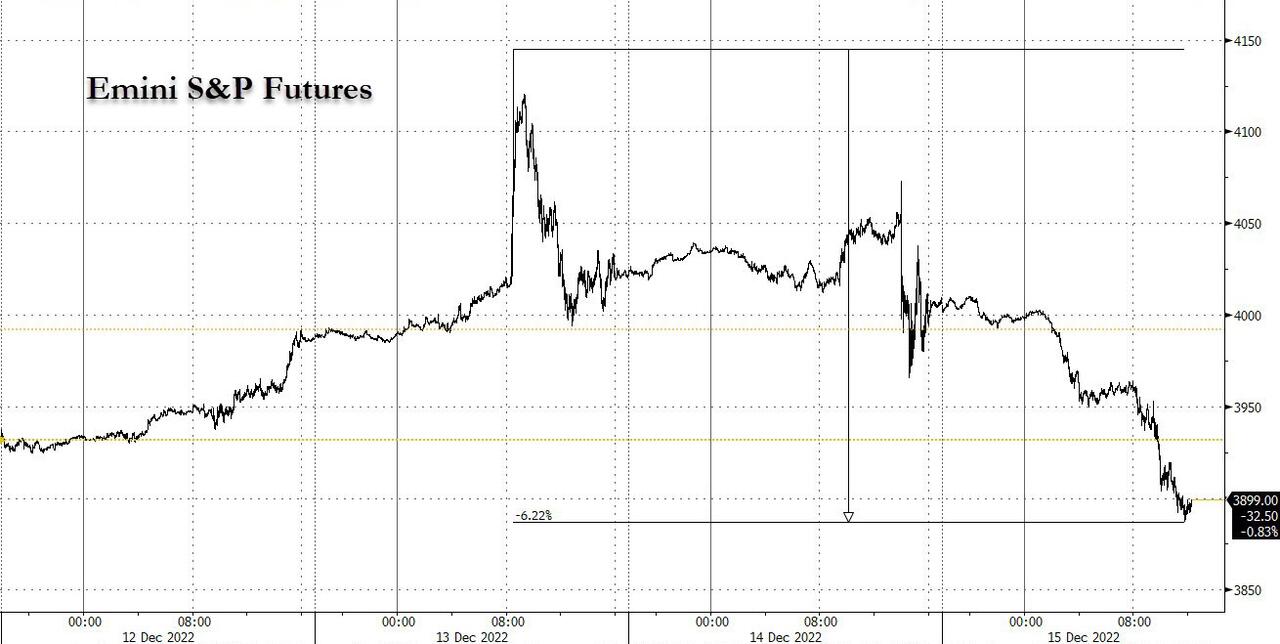
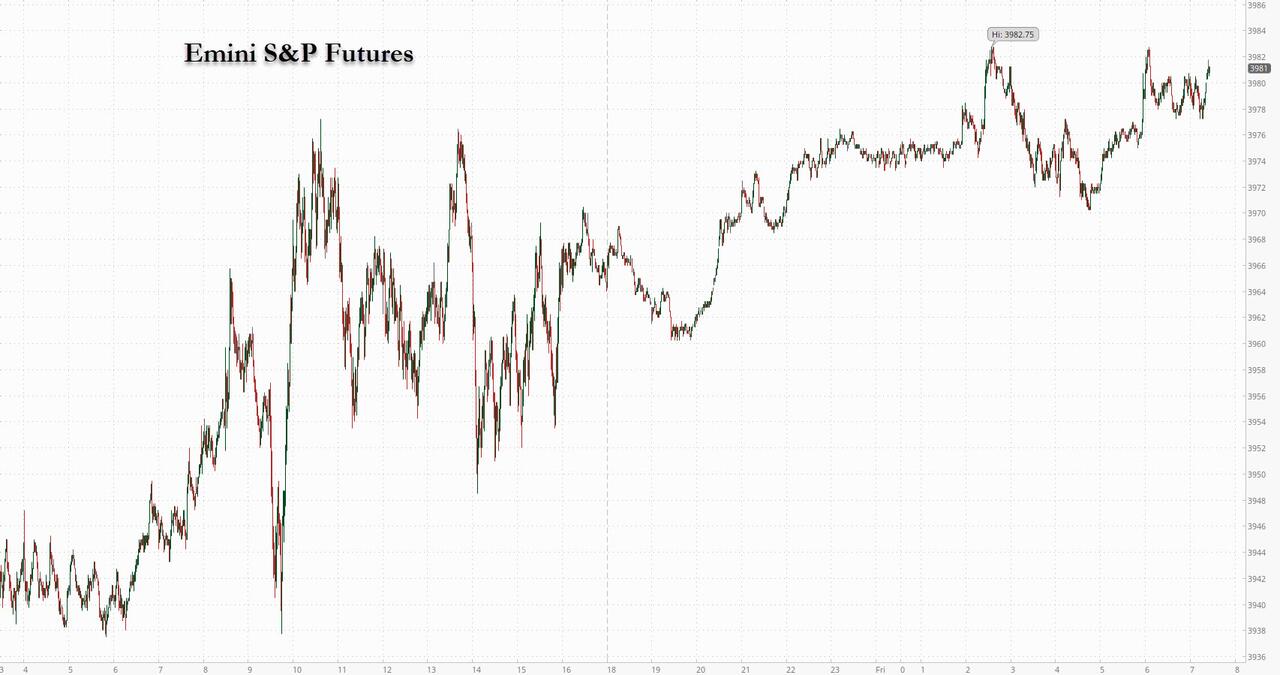
SPX futures are challenging the 50-day Moving Average at 3866.70.  The Cycles Model suggests today may be a consolidation day.  Trending strength may return on Friday.  Next week appears to be relatively peaceful, barring any potential earth-shattering news.

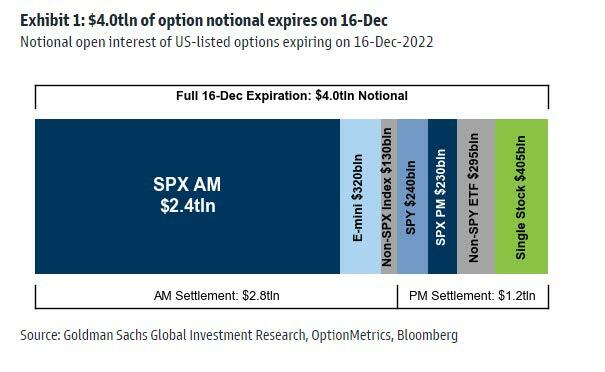
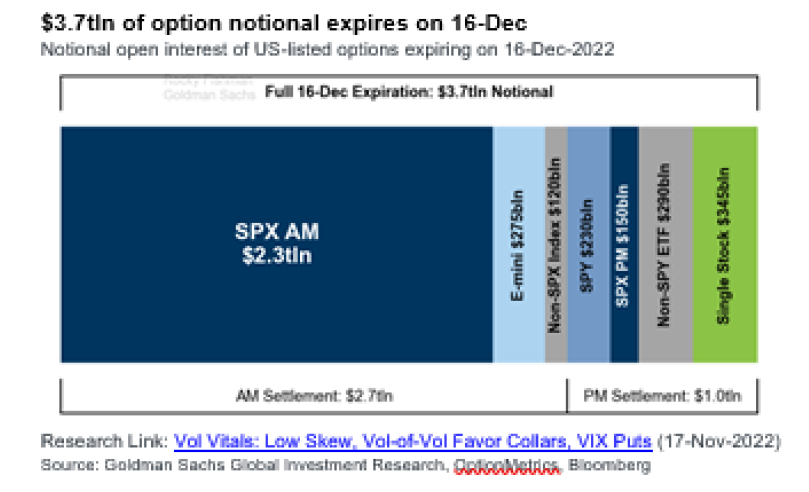
This Morning’s op-ex shows Maximum pain for options investors at 3890.00.  Long gamma starts at 3900.00, while sort gamma begins at 3875.00.  SPX may stay trapped in the neutral zone for the day.  Tomorrow’s op-ex shows Max Pain at 3955.00 with long and short gamma at lower levels as well.

ZeroHedge reports, “US stock futures reversed gains from earlier in the session and struggled to hold the momentum that propelled the S&P 500 to its best daily gain in three weeks, as investors assessed whether the world’s biggest economy can skirt worst-case recession scenarios. Contracts on the Nasdaq 100 and the S&P 500 were both 0.3% lower at 7:30 am ET, erasing earlier gains of 0.3%. Both indexes had bounced on Wednesday following better-than-expected earnings from FedEx and Nike as well as a pickup in consumer confidence, but the mood was dampened by memory chipmaker Micron, whose gloomy outlook knocked its shares in US premarket trading and weighed on other chip firms. European semiconductor shares also fell, erasing earlier gains on the Stoxx 600 gauge, though it remains set to break a two-week losing spell. The dollar index was flat while the US 10-year yield dropped to about 3.64%.”


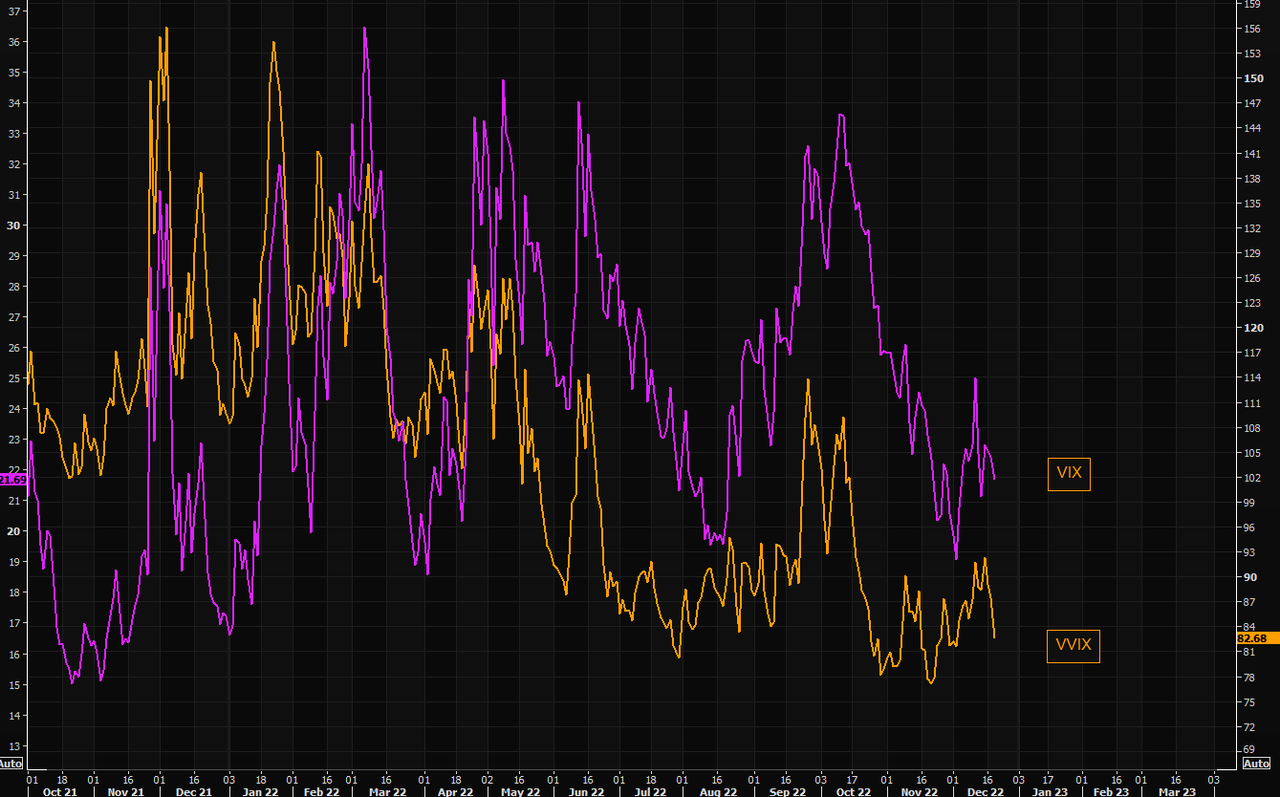
VIX futures consolidated in the lower part of yesterday’s trading range with a high of 20.40.  The threat of a new low lingers until the end of the week.  Today is day 262, nearly three weeks from the low on the chart.  Trending strength is due to re-appear at the new year.

As we move into next week’s op-ex, Max Pain is at 22.00.  Short gamma is at 18.00, while long gamma begins at 25.00.  This week’s downward pressure on the VIX has expired.


TNX appears to be consolidating just beneath Intermediate-term resistance at 37.11.  Above that is the 50-day Moving Average at 38.30 and a confirmed buy signal.  Today shows trending strength re-appearing and gaining strength over the next two weeks.  This may be a surprise to investors after three months of steady-to-declining rates.

ZeroHedge reports, “After several disappointing coupon auctions to start the month of December many of which tailed and pushed yields wider, moments ago the Treasury placed the final 20Y auction for 2022 when it sold $12 billion in 19-year 11-month (Cusip TM0) reopening. The auction was a blowout: the high yield of 3.935% was the first auction to price below 4.00% since September, it was well below November’s 4.101% and and also stopped through the 3.948% When Issued by 1.3bps, which while less than half of last month’s 2.9bps stop through was still the 10th stop through in the past 13 auctions.”


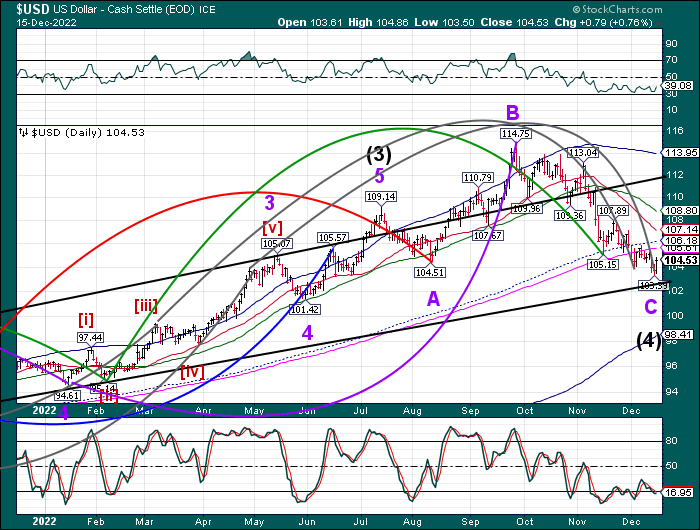
USD futures rose to 104.06, not -quite-a-breakout, and remained in the upper part of yesterday’s trading range.  Trending strength is due to re-appear as it returns to its uptrend through the second week of January.  The double bounce off the trendline offers an aggressive buy signal to be confirmed once it rises above the resistance levels.


Gold futures linger near their high with a chance of making a nominal new high in the next week.  Be aware of a potential reversal after the new year with a possible new low at the end of January.


Crude oil futures are higher, possibly aimed at the 50-day Moving Average at 82.50 in the next few days.  The Cycles Model warns of a potential reversal next week.


Posted in Published | Comments Off on December 22, 2022

December 21, 2022

1:00 pm

VIX has dropped beneath the Triangle trendline again and challenging the December 2 (day 242) low.  Today is day 261 of the Master Cycle and VIX may challenge the prior low.  The EW structure suggests a low above 19.00, but there are no assurances of that since structural constructs are guidelines and not rules.  Either way, the reversal out of this low will be significant.  Trending strength comes back after the first of the new year.

ZeroHedge remarks, “Welcome to inverse panic

European “VIX”, V2X, is moving sharply below the “magical” 20 level, last trading at 19.8. Do we see VIX print sub 20 today as well?

Source: Refinitiv

Exuberant VIX

Our logic on volatility moving lower into year end stays intact. Regular readers of TME are familiar with the fact volatility is about pace and not direction. The gap between SPX and VIX is very wide, and although VIX is not a “predictor” of SPX direction, the crowd will soon start pointing out this gap. Last time it got SPX moving higher…


10:42 am

The Ag Index is challenging the 50-day Moving Average /buy signal.  The next Master Cycle pivot is due the week of January 23.

ZeroHedge reports, “Lack of snow cover on fields and a cold blast down through the Great Plains and into Texas and the South could result in damage and even death of winter wheat crops.

The coldest air of the season is about to pour down from Canada, bringing dangerously cold temperatures where parts of Kansas could reach as low as -15F. The state is one of the top growers of red winter wheat.


8:15 am

Good Morning!

SPX futures are higher, reaching 3853.50 this morning, still beneath the 50-day Moving Average at 3862.12.   It may be due for a bounce, provided it can rise above the 50-day,as trending strength may come back for the balance of this week.  The most likely target for a retracement above the 50-day is the double resistance at 3933.07, the 50% retracement value.

In today’s op-ex, Max Pain is at 3840.00.  Calls predominate above 3850.00, while puts are the majority beneath 3830.00.  While there doesn’t appear to be long gamma, short gamma begins at 3800.00.

ZeroHedge reports, “US stocks were set to rise for a second straight day on Wednesday with risk appetite staging a modest comeback amid dismal trading volumes as investors digested the hawkish turn from major central banks over the past week. S&P 500 futures were up 0.5% at 7:30 am ET, while Nasdaq futures gained 0.2%. The dollar reversed earlier losses, while global bonds steadied from the previous day’s selloff as some of the shock following the Bank of Japan’s unexpected increase in its yield trading band ebbed; the US 10Y yield held steady around 3.67%.”


VIX futures fell beneath the Triangle trendline to 20.49.  The debate is whether the VIX may extend its Master Cycle to a new low.  Thus far there is no indication, although the MC window is still open.

Today’s op-ex shows Maximum Pain for investors at 23-24.00.  Short gamma starts at 23.00, while long gamma begins at 25.00.

ZeroHedge remarks, “Do we see a proper vol puke from here?

VVIX is moving sharply lower again. Will it drag VIX to retest sub 20 soon (again)?


TNX eased back from its recent high, possible testing the trendline near 36.00.  Trending strength may come back tomorrow and extend through the following week.  The current Master Cycle may continue higher until mid-January.


Posted in Published | Comments Off on December 21, 2022

December 20, 2022

3:00pm

SPX may be at a crossroads.  Normally we would see a rally back to the 50-day Moving Average at 3863.40 or possibly back to the support line at 3910.00.  However, it is flirting with short gamma beneath 3850.00 which intensifies beneath 3800.00.  A close beneath 3800.00 may cause SPX to tumble even lower overnight.

ZeroHedge remarks, “Despite the much-anticipated ‘dovish soft-CPI’, equity markets sold off last week and continue to do so (ignoring the Santa Claus rally). However, VIX remains notably low although uncertainty feels significantly higher and liquidity into year-end remains dismal as the quarterly roll-over of a massive put-spread collar that the $15 billion JPMorgan Hedged Equity Fund (JHEQX) owns as a protection for its portfolio remains the elephant in the room.

While the position consists of protective puts funded with the sale of bullish calls and even more-bearish puts, it’s the calls part of the trade that has Wall Street’s attention right now, in part because these contracts have a strike price near where the S&P 500 is trading: 3,835.”


2:25 pm

BKX tested the neckline of its Head & Shoulders formation at 97.00 yesterday and bounced.  The question is, will the bounce extend to the 50-day Moving Average at 102.62 (resistance), buying more time or simply roll over?  Liquidity is being drained from the economy due to rising rates.  Inflation pressures are causing consumers to drain their savings and rising funding pressures are affecting banks, as well.  It is estimated that some 30 major banks are on life support, but we won’t know who they are until they appear asking for a bailout.  In the meantime, liquidity continues to drain from the banking system until the year-end, as indicated by the Cycles Model.

ZeroHedge warns, “Six months after the Fed’s Quantitative Tightening started, the Fed’s balance sheet has shrunk by just over $400 billion, less than 10% of its massive expansion in the post-covid era when it nearly doubled in just days $4 trillion to $7 trillion, and then grew another $2 trillion over the next year.”


8:00 am

Good Morning!

NDX futures challenged the Lip of the Cup with Handle formation at 11000.00 last night by declining to 10942.00.  It is currently hovering at 11000.00 and may go lower, since the rest of the week shows trending (downside) strength.  The next possible support level may be the November 7 low at 10632.40, followed by the Cycle Bottom at 10246.04.

While puts dominate today’s op-ex, short gamma appears at 11000.00 and intensifies beneath 10700.00.  QQQ (closing price 269.75)  shows Max Pain at 280.00.  Long gamma may begin at 282.00 while short gamma starts at 275.00.  This has the potential of a runaway train.

ZeroHedge remarks, “Morgan Stanley’s Wilson continues nailing market moves. He turned bearish not long ago and continues to deliver his bearish thesis. His latest bounce call was just a technical bounce and we should once again focus on his longer term bearish fundamental view which can be summed up in 3 bullets:

1. weaker inflation data is bearish for stocks …”This makes sense as markets contemplate what falling inflation means for growth and the equity risk premium.”

2. earnings outlook is looking bad and deteriorating

3. weekly survey data falling…demand is basically worsening

Chart shows the perfect overshoot above the 200 day…


SPX futures dipped to a low of 3776.70 in the overnight session before a bounce.  It remains beneath the 50-day Moving Average at 3860.64.  Normally we would see a retracement to the combined 100-day Moving Average and Intermediate-term resistance at 3934.08.  However, the Cycles Model suggests an intensification of the decline for the remainder of the week.

Today’s op-ex shows Max Pain at 3850.00.  While calls dominate above that, long gamma my not be activated until 3900.00.  Puts dominate beneath 3850 with short gamma intensifying beneath 3800.00.

ZeroHedge reports, “After last week’s CPI and FOMC decision, it was supposed to be smooth sailing into the illiquid, year-end waters as trading desks closed down for the year, and where among those few traders left some expected a Santa rally while others kept pressing their shorts. The BOJ – which was badly been lagging all of its central bank peers in tightening financial conditions – however had other plans, and on Tuesday morning Japan’s central bank shocked the world when it announced it would widen the Yield Control Curve band on the 10Y Treasury from 0.25% to 0.50% on either side, a move which had been viewed as a “when not if” – as markets knew the BoJ would eventually have to realign the “kinked” 10Y point with the rest of JGB curve and fundamentals…”


VIX futures consolidated within yesterday’s trading range.  The Cycles Model indicates a surge of strength may be due today.  There are a few more days left for a potential Master Cycle high.  Otherwise the December 2 low may have ended the Master Cycle a bit early.  In that case, we may see rising volatility through mid-January.  Many analysts see the December 2 low as a break-down, indicating one should be short the VIX.  However, this may also be a wind-up for the strongest rally of the year for the VIX, given the re-entry back into the Triangle formation.


TNX gapped higher this morning in time for an increasing trending strength that may last several days.  There may be enough strength to rise above the 50-day Moving Average at 38.38 by the end of the week.

Investing.com observes, “Recent data for the US economy reflect a mixed profile, but several widely followed business-cycle indicators are screaming recession.

A pair of Treasury yield curves are signaling that the odds are high that a period of economic contraction is approaching. The spread for the 2- and 10-year Treasury on Wednesday (Nov. 22) edged deeper into negative terrain, slipping to -0.71 percentage points, a new four-decade low. The 3-month/10-year spread is also negative. History strongly suggests that when these yield curves are inverted, as they are now, a US recession is near.”


10-Year Treasury Constant Maturity Minus 2-Year Constant Maturity


USD futures have retested the trendline at 103.50 in the early morning session.  The cluster of Master Cycles in the past month indicate a possible effort to devalue the USD.   Japan’s effort to strengthen its currency may also have led to this event. However, the Cycles Model now indicates a rising USD through mid-January, despite the BOJ’s best intentions.

ZeroHedge remarks, “The BoJ decision to widen the YCC band was a surprise in the sense that’s it been viewed as a “when, not if” matter (while still messaging quite “dovishly” in the press conference, with Kuroda going out of his way to message repeatedly that this was not policy tightening, as they did not raise short-term policy rates nor adjust the monetary base target).”

.


Posted in Published | 3 Comments

December 18, 2022

9:00 pm

I will be spending the day tomorrow watching three lively granddaughters, ages two to six as their their parents seek a specialized medical treatment for their father, who has Lyme’s disease.  I may be unable to communicate the entire day, so I will try to lay out the parameters for tomorrow’s potential action.

SPX futures have gyrated from a low of 3846.50 to a high of 3861.90.  Most of the action has been beneath the 50-day Moving Average at 3859.90, a key resistance.  The next lower support is at 3750.00.  A morning open beneath that may bring the SPX down to 3582.00 (possible limit down).  Should SPX go higher, further resistance may be found at 3910.00 and again above 3930.00.  Should we see a significant move down tomorrow, trending strength may accelerate the move on both Wednesday and Friday.

Tomorrow’s op-ex shows Maximum Pain for options investors at 3855.00.  Long gamma may begin at 3860.00 and rising strength at 3875.00.  Short gamma starts at 3850.00 with strength of (short) conviction rising at 3825.00.  This appears to be a tight contest until it breaks out in either direction.


VIX futures open tomorrow morning, so there is little to see as  yet.  A must-see for tomorrow may be a move above the mid-Cycle resistance at 25.75 and breakout above 25.84.  VIX has been in a gigantic Triangle formation for the entire year.  The time has come for some eye-popping moves.


TNX futures appear to have risen above the trendline at 35.00.  If so,  TNX may be venturing to new highs in the next three weeks.  There may be a burst of strength to the upside by mid-week.


Posted in Published | 1 Comment

December 16, 2022

12:22 pm

BKX approaches the Neckline of its massive Head & Shoulders formation at 97.00 today.   Crossing beneath it may trigger a selling response not seen before.  The Cycles Model suggests the selling may accelerate into the New Year.

ZeroHedge remarks, “2022 is set to end up as one of the more volatile years on record, led by rapidly rising interest rates and high inflation, and while we note that December is (so far) on track to be the least volatile month of this high volatility year, the recent ‘surprise’ hawkish comments/actions from The Fed and ECB (right as the market convinced itself ‘enough is enough’) will likely exacerbate that into the ultra-low liquidity of year-end…”


10:17 am

SPX has declined beneath the 50-day Moving Average.  The next supports  are down at 3730.00-3750.00.  We may see an acceleration of the decline as the NDX is also beneath its 50-day.


7:40 am

Good Morning!

NDX futures continued their decline beneath the 50-day Moving Average at 11454.37, aiming at the Lip of the massive Cup with Handle formation at 11000.00.  The new low thus far is 11208.20.  Should Tuesday’s high at 12466.40 be the high, the new Master Cycle may decline over the next seven weeks to a possible waterfall low.  The mild descent to the October 13 low has inspired little fear of the coming rout.

In today’s op-ex, Maximum Pain for options investors is at 11050.00.  Long gamma begins at 11100.00, while short gamma starts at 11000.00.  QQQ (closing price $276.89) options expiration shows Max Pain at 288.00.  Long gamma kicks in at 290.00, while short gamma begins at 280.00.

ZeroHedge observes, “Earlier today we discussed why today’s violent market action – which was hardly predicated by the latest hawkish central banks developments, all of which were extensively telegraphed and generally priced in – may have been a frontrunning of the hobbled market conditions and technicals that await traders tomorrow during the massive, $4 trillion option expiration.


SPX futures declined through the 50-day to 3841.90, then bounced to retest the 50-day Moving Average at 3858.80.  The battle this morning may be to curb the losses prior to the open and maturation of the massive am expiration of $2.4 billion.  The outcome may set the tone for the rest of the day.

In today’s am expiration, Max Pain is at 3910.00.  Long gamma starts at 3950.00.  Short gamma may begin at 3900.00, adding a layer of difficulty to the am settle.

ZeroHedge reports, “A miserable week for global stocks – which wrongfooted traders as risk first soared after a weaker than expected CPI only to tumble more than 7% just two days later – was set to end with even more selling on Friday after hawkish signals from the Fed and the ECB sparked worries about higher-for-longer interest rates leading to a possible recession: the latest economic data signaled a slowdown in US growth; data from France showed that it faces a greater recession risk, with its PMI falling to its lowest level in two years. Similarly UK companies are steeling themselves for an economic contraction, with both the manufacturing and service sectors experiencing a slump in the fourth quarter. Economists now see a 60% probability of recession in the US and an 80% chance in Europe. Equity analysts have cut 12-month earnings estimates for the regions to the lowest levels since March and July, respectively.

Not helping matters is today’s massive, $4 trillion quad-witching option expiration, which as we previewed yesterday threatens to become a liquidity-draining vortex just as CTAs are forced to dump stocks. potentially leading to outsized price moves. With the S&P 500 stuck for weeks within 100 points of peak gamma at the 4,000 strike, the sheer volume provides a positioning reset that could turbocharge market moves. Given the backdrop of hawkish central banks and slowing growth, worries are mounting the expiration will act as an air pocket.


VIX futures rose, but remained within yesterday’s trading range thus far.


TNX rose above the trendline at 35.00 this morning, possibly reigniting the buy signal.  The attempt at a beat-down of the yields may backfire, sending the 10-year higher through the end of the year.


USD futures appear to be consolidating after reversing out of its Master Cycle low on Wednesday.  Although not yet recognized by the mainstream, USD may be rising through mid-January as investors in other currencies seek safety in the USD.


Posted in Published | Comments Off on December 16, 2022

December 15, 2022

3:25 pm

NDX has crossed back beneath the 50-day Moving Average at 11454.58.  The final support may be the Lip of the Cup with Handle at 11000.00.  There may be free-fall beneath it.

ZeroHedge writes, “Over the weekend, we predicted that with the market stubbornly rangebound, if the S&P was going to move “It will be this week as $3.7 trillion in options expires.” And sure enough, markets moved – a lot – with the S&P first spiking in kneejerk reaction to the weaker than expected CPI to briefly tag 4,145 before sharply sliding more than 6% in the opposite direction after the hawkish Fed and ECB, sent spoos tumbling below 3,900…”


11:28 am

SPX has now crossed beneath the trendline and round number support at 3900.00.  It may bounce briefly to retest the trendline at 3910.00, but the trend is solidly down.  Note that the month-long trading range has broken down. The next support beneath is the 50-day at 3857.00-3858.00.


9:50 am

SPX has crossed beneath its short-term trendline at 3965.00 , the mid-Cycle support at 3935.00 and the 100-day Moving Average at 3931.00, confirming its sell signal.  The next level of support is the trendline at 3910.00.  SPX is now declining into short gamma beneath 3950.00.  A decline beneath 3900 may accelerate the decline due to additional layers of short gamma being activated.


7:45 am

Good Morning!

NDX futures declined to a morning low of 11556.10, possibly to test Intermediate-term support at 11532.80.   Below that is the 50-day Moving Average at 11432.15 which defines the bottom of the trading range in December.  A breakdown confirms the sell signal that flashed an aggressive sell beneath the 100-day Moving Average at 11935.25.  The Lip of the Cup with Handle formation lies at 11050.00.

Today’s op-ex shows Maximum Pain for options investors at 11680.00.  Calls dominate above 11700.00, while puts control the area beneath 11650.00.  Gamma level are indeterminate in the NDX.  QQQ (closing: 286.51) shows Max Pain at 284.00.  Long gamma starts at 289.00, while short gamma may begin at 283.00.  Today’s op-ex is sparse.

Friday’s op-ex is heavily populated with Max Pain at 286.00.  Long gamma begins at 290.00, while short gamma may begin at 285.00 and accelerates at 280.00.  Tomorrow’s op-ex could be a very stormy session.

In the meantime, ZeroHedge takes a nap, “Still looking for the trend

Chart of NASDAQ over the past month. Don’t chase trends that do not exist…

Source: Refinitiv

SPX – king of ranges

SPX remains stuck inside the relatively tight range that has held since that massive November inflation print. Note we are practically on the 200 day moving average. No excitement from us until this breaks out of the range.”


SPX futures declined to 3944.20, just above Intermediate-term support at 3934.51 and the 100-day Moving Average at 3930.00.  SPX is on an aggressive sell signal beneath mid-Cycle resistance at 4008.61.  Crossing the next supports confirms the sell signal.  Should those supports be crossed, SPX begins a 7-week decline to new lows.  There is a 2-year Cup with Handle formation that suggests a target of 2250.00, possibly in the next six months.  Shorter term, SPX may decline beneath 3000.00.  The gentle decline of Wave [1] may turn into a waterfall in Wave [3].

Today’s op-ex shows Max Pain at 3995.00.  Long gamma begins at 4000.00, while short gamma starts at 3950.00.  Today’s op-ex is lightly populated.

Friday’s op-ex is another story.  Max Pain is at 4010.00.  The 4000.00 strike being hotly contested with over 150,000 put and call contracts.  Each 50-point interval is populated with at least 50,000 contracts down to 3200.00.  This train may turn into a runaway with no brakes.

ZeroHedge reports, “S futures extended declines on Thursday following hawkish signs from the Federal Reserve that it would keep rates higher for longer even as it pushed the US economy into a stagflationary recession. Contracts on the technology heavy Nasdaq 100 were down 1.3% by 7:45 a.m. in New York, while S&P 500 futures fell 0.9% after dropping as much as 1.1% earlier. Both underlying indexes dropped yesterday after Fed Chair Jerome Powell delivered a 50-basis-point rate hike, as expected, and said the central bank had more work to do – and will push the terminal rate to 5.1% or higher – in taming inflation despite ebbing price pressures and mounting fears of job losses.”


VIX futures rose to 21.94 this morning, still sleepy from the beat-down it received on FOMC day.  VIX monthly op-ex is three days later than the NYSE op-ex.  In conjunction with that, the VIX Master Cycle may be due for a peak by that date.  The VIX Cycles may be out-of-sync with the SPX Cycles due to the VIX monthly op-ex occurring the week after the NYSE Monthly op-ex.

Next week’s op-ex shows Max Pain at 24.00.  Short gamma begins at 22.00 and goes to 17.00.  Long gamma begins at 25.00 and rises to 70 with 157,181 contracts at that strike.  The numbers smack of institutional involvement and have a high probability of being realized.


TNX is testing the lows again, despite the long-delayed Master Cycle bottom put in on December 7.  This has the earmarks of a very large player buying long Treasuries before and since that time.  The Cycles Model suggests this could blow up (higher) by mid-week, as trending strength returns.  The new Master Cycle should last through the first week of January.

ZeroHedge remarks, “Thousands of tech workers laid off every single week as the Silicon Valley ponzi crumbles under the weight of the Fed’s rate hikes? Not according to the Department of Labor, which moments ago reported that in the latest week, initial claims unexpectedly tumbled by 20K to 211K from 231K, the lowest since September 23 and far below the consensus estimate of an increase to 233K; at the same time unadjusted claims dropped from 288K – the highest since January – to 248.9K.”


USD futures tested the trendline with a low of 103.10 this morning.  This may be the  low on day 254 of the new MC, only 7 days later.  This highly unusual cluster of MC lows may be due to the unusual buying of Treasuries by a large institution.  However both Treasury yields and USD are wound up for a very substantial rebound into January.  This has the makings of a disastrous year-end for the markets.


Posted in Published | Comments Off on December 15, 2022

December 14, 2022

2:36 pm

SPX has broken down beneath short-term support at 3995.59 and has bounced at the uptrend line at 3965.00.  It is on a sell signal with additional confirmation beneath the trendline and the mid-Cycle support at 3929.63.  Expect volatility to rise.

ZeroHedge remarks, “Tl;dr: Fed hiked rates by 50bps as expected but signaled, through its projections, that it will hike rates higher than the market expects and hold those rates higher for longer. Furthermore, the projections for economic growth, employment, and inflation all suggest The Fed expects a recession.

Fed rate expectations are notably more hawkish than the market’s…

With the market expecting rates to be lower than current levels by January 2024…


8:10 am

Good Morning!

SPX futures eased lower to 4010.90, near the mid-Cycle support at 4011.40, but beneath the 200-day Moving Average at 4033.69.  Today is FOMC day and, given past practices, we may see a nominal new high this afternoon after the announcement and press conference.  Today is day 260 of the Master Cycle, so a further probe higher may be acceptable.  It may also set the stage for a reversal to new lows.

Today’s op-ex shows Maximum Pain for options investors at 4005.00.  Long gamma begins at 4050.00, while short gamma starts at 3950.00.  This week’s op-ex is sparsely populated, which may lend itself to wider swings.  Friday’s op-ex, however, is loaded for bear beneath 4000.00 with 50,000 incremental contracts every 50 points down to 3400.00 and possibly lower.

ZeroHedge reports, “US equity futures were little changed ahead of the final Federal Reserve policy decision of 2022 as traders fretted whether cooler-than-expected inflation will justify smaller rate hikes. Contracts on the S&P 500 and Nasdaq 100 traded on either side of the unchanged line by 730am ET. The underlying benchmarks surged in early trading on Tuesday after the latest CPI data showed a US inflation posted the smallest monthly advance in more than a year, indicating the worst of inflation has likely passed; all gains were subsequently pared however with the S&P closing little changed (See “What Was Behind Today’s Drift Lower In Stocks“). Treasuries and bitcoin rallied, while the dollar slipped.”


VIX futures are clustered near yesterday’s close.  They are poised for a new move higher, which may take VIX to the Head & Shoulders neckline.  It appears to be common practice to goose the SPX and suppress the VIX immediately upon making the FOMC announcement.  A revisit to the bottom trendline of the Triangle formation may be anticipated.  Upward momentum (trending strength) may build through Monday.

Today’s op-ex is lightly populated with calls favored at 23.00 and higher.  There are no discernible long or short gamma levels for today’s expiration.  Next week’s op-ex shows Max Pain at 25.00 with short gamma at 22.00 and long gamma at 26.00.

Bloomberg points out, “While the S&P 500 was en route to a 1.4% gain Monday, the Cboe Volatility index — a gauge of cost on options tied to the stock benchmark also known as VIX — jumped more than 2 points to surpass 25. Not only do same-direction moves buck the historical pattern where the two normally move in opposite directions, their outsize jumps today mark the first time since 1997 when both climbed in sync as much as they did.”


TNX rose above its trendline at 35.00 this morning, signaling a potential positive trend may have emerged.  Of course, this hinges on the outcome of the FOMC report.  The Cycles Model implies a continued rally in rates through the end of the year.

ZeroHedge observes, “The Federal Reserve’s revised dot plot that will be unveiled Wednesday will acknowledge the need for policymakers to raise rates higher than previously anticipated in order to put the inflation genie back into the bottle.

The dot for next year is likely to show the median at 4.875% compared with the 4.625% estimated in September. A number even higher than that would spur an immediate selloff in Treasuries — especially at the front end — though slower-than-forecast inflation for November may stay the Fed’s hand from doing so.”


USD futures declined to a new low at 103.25 on day 259 of the Master Cycle.  This may be the low, or nearly so, as both time and target may be met today.  Should the reversal be made today, the Cycles Model projects the ris in the USD to mid-January.  The prediction of the demise of the USD is early and overdone.


BKX, our liquidity proxy, is due for a day of strength, which goes along with the “goose” of the  SPX upon the FOMC announcement.  However, the balance of the month may be in decline as BKX makes the final crossing of the neckline of the Head & Shoulders formation.

RealInvestmentAdvice declares, “Often, boaters take the warning blow of a foghorn for granted and disregard it. However, all skippers seem to pay attention when they hear the scraping of their hull against a reef.

The yield curve is a financial foghorn of sorts. Currently, it is bellowing that something is drastically wrong. As evidenced by earnings growth estimates for 2023, financial skippers are going about their business as if a recession is unlikely.

Yield curve foghorns are often unheeded by investors as they blow well before danger is apparent. As such many investors are unprepared when problems arise.”


Posted in Published | Comments Off on December 14, 2022

December 13, 2022

1:52 pm

BKX gave up all of its CPI spike gain and is back beneath the 50-day Moving Average at 102.74.  It remains on a sell signal, although an antacid may have helped the jumpy stomach this morning.  It’s downward course may be set through the year end.  We may see an “everything down” market for a while as liquidity is drained from the market.


1:47 pm

The CPI spike also brought TNX below the trendline for a brief test.  However, it stopped before making a new low and is back above the trendline.  The Cycles Model suggests a rally may resume until the first week of January.

ZeroHedge reports, “One day after the ugliest 10Y auction since 2016 (which however saw a blowout in yields ahead of the 1pm deadline) moments ago the Treasury sold the last coupon bond of the week ahead of tomorrow’s FOMC meeting when it found buyers for $18BN in 30Y paper (technically 29-Year 11-month reopening of Cusip TL2). In a nutshell, the auction was almost as ugly as the 10Y even though yields tumbled this morning after the far weaker than expected CPI print.

Pricing at a high yield of 3.513%, the auction tailed the 3.482% When Issued by 3.1bps, the biggest tail since December 2021.”


1:40 pm

VIX reversed its gains at the CPI spike, declining to the Triangle trendline at 21.45.  It has since recovered and may be ready for further gains.  Wednesday may show the breakout above the double resistance.

ZeroHedge remarks, “As we detailed over the weekend, this week’s options expiration is a doozy with a massive $3.7tln of option notional expires on 16-Dec…


12:45 pm

SPX made a surprise bulls-eye on day 259 of the Master Cycle with a (very) marginal new high, then giving up all of the CPI spike gains.  Needless to say, I had been expecting a different outcome.  Welcome to my world!  Now let’s discuss what’s next.  The Cycles Model calls for a very strong pivot in the first week of February.  That also happens to be 12.9 months from the top on January 4.   Thus, I was leaning toward a top at that point.  Leading up to that point would have necessitated a low in December followed by a sideways-to-higher rise through January.

Today’s new high on the MC Pivot day suggests otherwise.  Should SPX cross beneath the combined 100-day (3930.00) and Intermediate-term support at 3929.18, we may see a 7-week decline to the next MC pivot in Wave (1) of [3].  For now, we wait for the FOMC announcement tomorrow.


8:10 am

Good Morning!

SPX futures have tested the mid-Cycle resistance at 4013.79 and pulled back, waiting for the CPI report at 8:30 am.  The 50% retracement value is 4009.45.  As of yesterday’s close, the SPX barely exceeded the 38.2% retracement level at 3987.96.

8:30 am

SPX futures leaped to a new high prior to the CPI report, probing to 4133.80 before settling down beneath the prior cash high.  A reminder that today is day 259 of the Master Cycle.  More observations after the open.

ZeroHedge reports, “After a dismal start to December, US futures extended their gains to a second day ahead of today’s critical economic data: the final consumer prices print due of 2022 which in turn precedes tomorrow’s final for 2022 FOMC meeting where Powell is expected to slow the pace of hiking to 50bps. Contracts on the S&P 500 rose 0.6% higher by 7:45 a.m. ET while Nasdaq 100 futures gained 0.7%. The underlying benchmarks advanced on Monday in anticipation Tuesday’s inflation data and Wednesday’s Federal Reserve decision will establish a slower pace of interest-rate increases. The greenback halted a two-day rally, while Treasuries gained. Oil futures extended gains by another 0.5% after almost sliding below $70 on Monday on signs of further easing in China’s Covid rules. Oil traded higher by 0.5% on signs of further easing in China’s Covid rules.

Today’s op-ex show Max Pain at 3980.00.  Long gamma starts at 3990.00-4000.00.  Short gamma may begin at 3950.00, a hotly contested level.

ZeroHedge observes, “Nomura’s Charlie McElligott’s note this morning begins with a warning of sorts:

Fear of the dovish “right-tail” response to CPI is back… Bigly!

Expectations into today’s CPI print for a continuation of the “past peak inflation = past peak tightening = FCI EASING” theme are building, which is contributing now to this ongoing “bullish” tilt towards Upside optionality in US Treasuries / STIRS and Equities.”


VIX futures have risen to a morning high of 25.84, which may trigger a further buying response from the knowledgeable.  The mid-Cycle and 50-day Moving Average are both at 25.94.  A rally above that area may spark an abrupt change in outlook for the market.


NDX futures ramped up to 12191.80 as CPI came in under the consensus.  It now appears that the current Master Cycle (day 259) may end at a new retracement high.  The potential target may be the mid-Cycle resistance at 12351.33.

ZeroHedge observes, “The first of this week’s big event risks has arrived and while the world and his pet rabbit is focused on the number’s potential for ‘dovishness’, bear in mind that expectations are for a 0.3% MoM rise and 7.3% YoY rise (which while ‘slowing’ remains extremely high by any standards).

The banks’s CPI forecasts were all in sync:

  • 7.2% – Barclays
  • 7.2% – Credit Suisse
  • 7.2% – Goldman Sachs
  • 7.2% – Bloomberg Econ
  • 7.2% – Citigroup
  • 7.2% – Morgan Stanley
  • 7.2% – Wells Fargo
  • 7.3% – HSBC
  • 7.3% – JP Morgan Chase
  • 7.3% – UBS
  • 7.3% – Bank of America
  • 7.4% – SocGen

The headline CPI printed cooler than expected, rising just 0.1% MoM, with the YoY rise falling to +7.1% (below all the big banks’ expectations) – lowest since Dec 2021.”


Posted in Published | 1 Comment

December 12, 2022

8:00 am

Good Morning!

NDX futures rose to 11611.60 this morning, still beneath Friday’s high at 11707.08.  There are $3.7 trillion of expiring options on Friday, suggesting volatility ahead.  Today is day 258 of the equities Master Cycle.  Normally we would expect an end to this MC in just a matter of days.  However, as of Friday morning, the NDX may have completed 6.45 days of a 12.9-day decline, leaving six more days (as of this morning) to complete the Master Cycle at its low.

ZeroHedge remarks, “Earlier this weekend, we laid out the rather gloomy (it hardly catastrophic) outlook from Goldman’s headge of hedge fund sales, Tony Pasquariello, who previewed both the short-term case as well as the medium-term (namely the next 3 or so months), and concluded that he can’t see the argument for lasting, significant upside: “with QT and negative earnings revisions just starting to really kick in — alongside money market rates that are assuredly heading higher — we’re going into 2023 with a stock market that charges an 18 multiple for the prospect of 0% earnings growth.”


SPX futures made a morning high of 3950..1 thus far and may challenge Friday’s high at 3977.02.  Should it fail, we may see SPX tumble to new lows in the next week.  The chart illustrates that potential outcome.

Today’s op-ex shows Maximum pain for options investors at 3945.00.  Long gamma wins at 3950.00 with 6369 call contracts, edging out put contracts numbering 6097 put contracts at the same level.  Short gamma is confirmed at 3900.00 with 6394 put contracts vs. 677 call contracts.

ZeroHedge reports, “After tumbling on Friday and slumping for 9 of the past 11 days, US stock futures staged a modest rebound after opening lower ahead of a crunch week for markets, which also is the last real week of 2022, with investors bracing for the release of US inflation data tomorrow and the Federal Reserve’s 50bps rate hike on Wednesday. Contracts on the S&P 500 and the Nasdaq 100 were up 0.2% and 0.3%, respectively, as of 7:30 a.m. ET; the underlying indexes both ended down last week, snapping a two-week winning streak. The S&P 500 had its biggest weekly decline since September last week; the Nasdaq 100 has already receded 3.9% this month, while the S&P 500 is down 3.6%.”


Despite the bounce in equities, VIX futures made a new Cycle high this morning at 24.44, edging to the trigger point for many investors at 25.00.

Wednesday’s op-ex shows Mx Pain at 22.00.  While there are few put contracts, long gamma begins at 25.00, with 7034 call contracts vs. 274 put contracts.  Calls are well populated up to 47.50.  The December 21 expiry show Max Pain at 26.00 with Long gamma extending to 70.00


TNX futures came down to 35.20 to test the trendline before bouncing back above it.  While November 16 may have been the classic master Cycle at 26 days, there has been some powerful buying of long-dated treasuries until December 7 (day 281).  It appears that the buying has been exhausted and the uptrend in yields is being re-established.

ZeroHedge remarks, “The Real Goal of Fed Policy: Breaking Inflation, the Middle Class or the Bubble Economy?

“There is no sense that inflation is coming down,” said Federal Reserve Chairman Jerome Powell at a November 2 press conference, — this despite eight months of aggressive interest rate hikes and “quantitative tightening.”

On November 30, the stock market rallied when he said smaller interest rate increases are likely ahead and could start in December. But rates will still be increased, not cut.

“By any standard, inflation remains much too high,” Powell said.

“We will stay the course until the job is done.”


USD futures made a lower low at 104.32this morning, but the bounce/rally off the December 2 low remains intact.  The new Master Cycle may be very short, as today is day 257 of the current MC.  The Cycles Model suggests trending strength (long) may re-appear by this weekend.


Posted in Published | Comments Off on December 12, 2022

December 9, 2022

11:45 am

SPX may have reversed at 3975.90 at 11:45 am, as indicated this morning.  It achieved the Short-term resistance at 3984.00 before the cash open and may proceed lower for the duration of the day.  Be prepared for a possible gamma-induced panic beneath 3950.00.


8:00 am

Good Morning!

SPX futures have attained 3985.00, its 38.2% retracement value.  There may be another 1-2 hours left to the retracement.  The 50% retracement lies at 4009.00, should it venture further.  There may be another 7-11 days left in this decline.  The minimum target appears to be the 50-day Moving Average at 3828.70.

Today’s op-ex shows Maximum Pain for options investors near 3990.00.  Long gamma begins at 4000.00, while short gamma starts at 3950.00.

ZeroHedge reports, “After sliding 8 of the previous 9 days, US stock futures extended yesterday’s gains as investors awaited today’s PPI data (ahead of next week’s critical CPI print) and the Fed’s final meeting for 2022 next week. Contracts on the Nasdaq 100 were up 0.6% as of 7:30 a.m. in New York, while S&P 500 futures rose 0.5%; more importantly spoos were back above the critical and closely watched medium-term CTA trigger of 3976. Treasury yields were little changed, with the 10-year rate just below 3.5%. The Bloomberg dollar index dropped.


VIX futures climbed to 22.75 this morning, a warning to those who are comfortably long equities.  While the NYS Master Cycle may find completion on or near December 12, the VIX Master Cycle may be complete on December 19.  Master Cycle normally land at an important inflection point.  The Head & Shoulder neckline at 40.00 appears to fit the mold.

Investing.com observes, “If growth deteriorates too quickly or goes too far, then “bad news is bad news indeed,” JP Morgan Chase said. Professional investors are betting that a recession can be avoided, despite warnings to the contrary. It’s a risky bet — for several reasons, Goldman Sachs says in its analysis.

Fund managers prefer financially sensitive stocks, such as industrial companies and commodity producers, according to a Goldman Sachs study of the placement of Mutual funds and Hedge funds with assets totaling nearly $5 trillion.”


TNX made its extended Master Cycle low on December 7, day 281.  I inserted a small parabola to show the 21-day extension, since the Cycle appeared structurally complete on November 16.  This was no ordinary extension and implies that big players were involved.

TNX has risen from its December 7 low and above the trendline at 34.50.  Today may show trending strength as yields rise.

ZeroHedge reports, “Having fallen for four straight months, the year-over-year change in Producer Prices was expected to continue to slow in November to +7.2% (from +8.0% in October) with a 0.2% increase MoM. However,m the headline printed hotter than expected (+0.3% MoM) – the highest since June. This left the YoY PPI at +7.4%, the lowest since May 2021…


USD futures pulled back from the 200-day Moving Average at 105.43 in the morning session.  USD futures are in a no-man’s zone and are due for a potential reversal early next week, if not sooner.  It may target the lower trading channel trendline before a sustained rally begins.


Posted in Published | Comments Off on December 9, 2022