July 26, 2023

1:40 pm

Here’s some advance notice on SPX.  It has been testing the 2-month tendline for the past week and may be about to trigger an aggressive sell signal.  The trendline lies at 4550.00 and is likely to be broken at the FOMC announcement.  Remember, this is still an aggressive call.  Most traders only recognize the 50-day Moving Average which, when broken, may provide a confirmed sell signal.  I am announcing the aggressive signals coupled with the Cycle reversals, giving a higher degree of certainty and a wider trading range which may be more profitable.


10:20 am

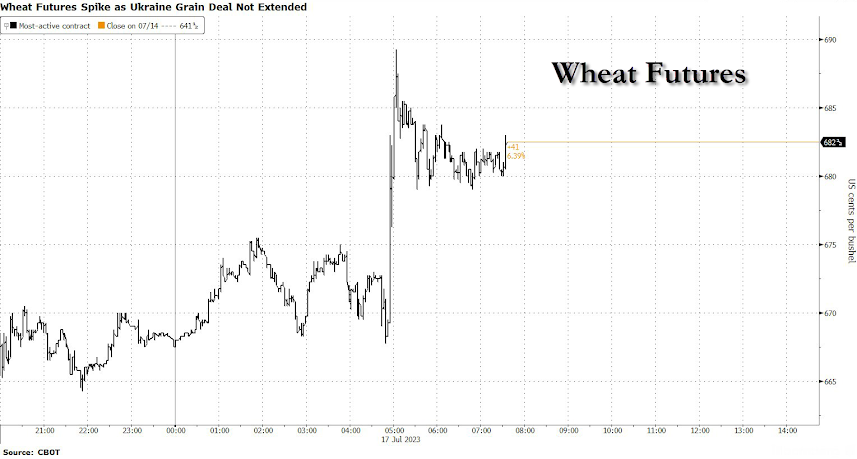
The Ag Index may have made its master Cycle high yesterday, on day 265.  What may come next s a 4-week decline to the 61.8% retracement at 387.76 or a possible extension to its 2021 low at 380.54.  Despite supply and demand fundamentals, the decline may have more to do with a sudden drop in liquidity.

ZeroHedge notes, “On Monday, orange juice futures rocketed to an all-time high due to global supply concerns among agricultural traders. The citrus greening disease continues to affect Florida and is spreading in Brazil — both regions are top producers, and a potential production loss from these areas could significantly tighten global supplies. ”

ZeroHedge points out, “The decision by India to ban certain rice exports has sparked panic buying at supermarkets across the US. Videos circulating on social media show the staple food is flying off the shelves as high demand depletes supplies amid concerns of a global shortage. Some supermarkets have responded by implementing purchase limits, while others have hiked prices. The scenes below should remind readers of the panic buying days during Covid. ”


9:41 am

BKX may continue its probe to the neckline at 93.00 today on day 257 of the Master Cycle.  While the Master Cycle may be ending, there appears to be some unfinished business in the Wave structure.  Completion may come with a probe to the neckline.

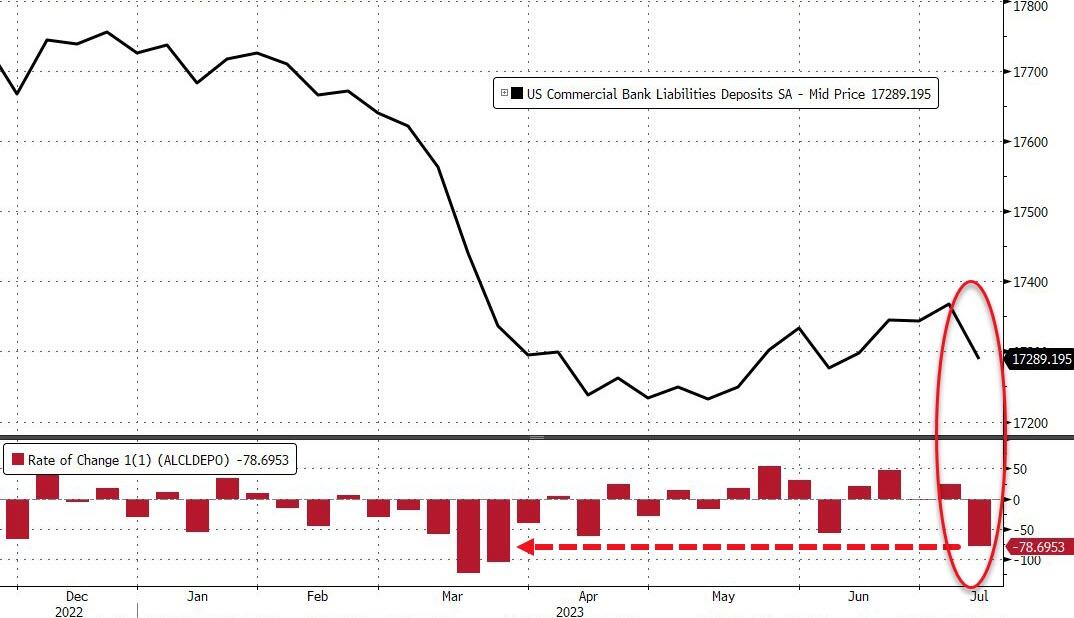
ZeroHedge announced, “Update (16:40 ET) : as leaked earlier by the WSJ, shortly after the close, PacWest Bancorp confirmed that it is merging with smaller rival Banc of California, in what is effectively a take under.

The banks said in a statement that Warburg Pincus and Centerbridge Partners would invest $400 million of new equity as part of the deal. The banks will sell assets with the aim of repaying $13 billion of wholesale borrowings, the companies said Tuesday.

PacWest stockholders will get 0.6569 of a share of Banc of California common stock for each of their shares. While PACW remains halted after hours, BANC shares are now trading at 14.75, suggesting that PACW stock will trade around just around $9 when it reopens at 5pm ET.”


8:00 am

Good Morning!

NDX futures are down this morning to a low of 15503.50, after testing support/resistance at 15566.04.  While the NDX is on an aggressive sell signal, it is the most likely to be subject to pushback.  The Cycles Model suggests today may be a day of strength.  After yesterday’s new high in the SPX, the trend may still be “up.”

Today’s op-ex shows Maximum Pain for options investors at 15530.00.  Long gamma begins at 15550.00 while sort gamma begins at 15510.00.

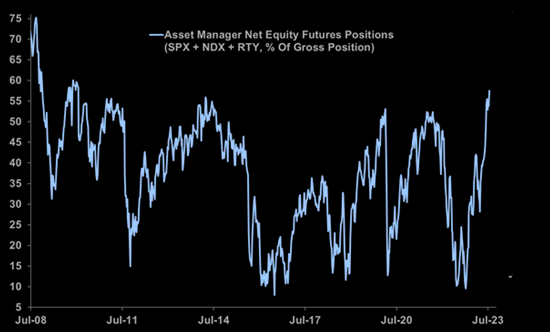
ZeroHedge observes, “Most long in a very long time

Asset managers are the most long US equity futures since December 2009 at 57% of gross exposure… historically these levels have seen the S&P 500 down by an average of 9% over the next 6M, with equities down 2/3 of the time…”


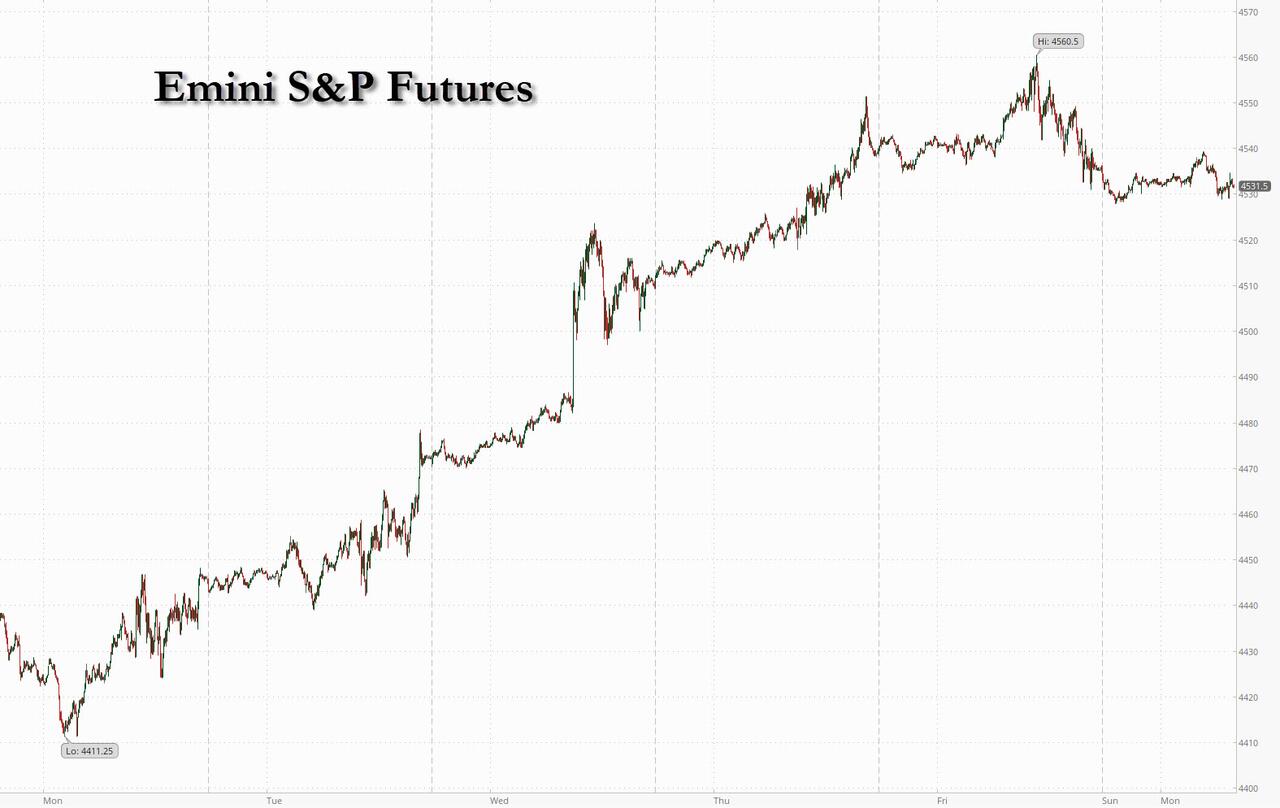
SPX futures are down to 4558.90, teasing the short-term trendline at 4550.00 where a possible aggressive sell signal may lie.  The Aggressive sell signal may be reinforced at the Cycle Top support at 4479.77.  Today is day 265 in the current Master Cycle.  Yesterday’s high may have been the top of this Cycle, but we await confirmation after the FOMC meeting.

Today’s op-ex shows Max Pain at 4545.00.  Long gamma starts at 4550.00 while short gamma may begin below 4540.00.  This is a very tightly wound market that may spring in either direction at the drop of a pin.

ZeroHedge reports, “US futures are lower as we enter the “last hike” day, with European stocks slumping after ugly results from LVMH (which tumbled 4.5%) and Asian markets also closing in the red as investors brace for more tightening from the Federal Reserve, even as results from some of the biggest European and American companies hinted at slowing economy and declining earnings. As of 7:30am ET, S&P eminis dropped 0.1% at 4,589 while Nasdaq futures were down 0.3%, pressured by disappointing results from some top constituents.”


VIX futures have pressed above yesterday’s high at 14.09.  The 50-day Moving Average awaits at 14.97 for a confirmed buy signal.  The Cycles Model views today as a day of strength, so it appears likely that the 50-day may play a big role in today’s action.

Today’s op-ex shows Max Pain at 14.50.  Short gamma shows very weakly at 14.00, while log gamma starts at 15.00 and runs to 40.00.

ZeroHedge notes, “GS volatility observations

1. The 1-month implied volatility for the average stock in S&P Technology sector (XLK) is in its 29th percentile over the past year which is the highest among all sectors.

2. S&P 500 average stock put-call 1-month normalized skew remains low vs history, implying investors are already positioned for short-term up move which makes it more difficult for the market to rally. (GS derivs)

Bond volatility – last man standing

The MOVE has drifted lower over past sessions, but remains elevated. Let’s see if the last elevated volatility index decides coming down post the upcoming FOMC. The gap vs VIX is still huge.”


TNX is down this morning to a low of 38.59 as it corrects toward Intermediate support at 38.23.  Today is day 252 of the current Master Cycle.  A lot may happen in the next week.

ZeroHedge remarks, “The size of the Federal Reserve pivot, i.e. the interest-rate cuts expected by the market, is likely to continue falling as inflation starts to decline at a slower rate.

The outcome of today’s FOMC is close to a foregone conclusion. After the expected 25-bps rate hike there is only 10 bps of rate rises left priced in by markets. But it is in the later parts of the SOFR rates curve – where the pivot is – that we’re likely to see more of the price action.

In the chart below of the SOFR curve, we can see the rate cuts priced in by the market have been falling.

Last meeting the Fed passed on hiking rates, but amped up the hawkish message. While it is clear what the Fed will do with rates this meeting, it is less certain what happens at subsequent meetings as the FOMC becomes less convergent in its views.”


USD futures drifted lower to 100.81 this morning.  USD may retest its trendline at 100.00, but the new trend may be higher.  While the Cycles Model appears calm, the USD may be prone to a sudden move should the Fed surprise.


Posted in Published | 2 Comments

July 25, 2023

8:00 am

Good Morning!

NDX futures have bounced to 15516.10 this morning, beneath the Cycle Top support/resistance at 15520.00.  It is on an aggressive sell signal.  The sell signal becomes a confirmed sell signal beneath Intermediate support and the smaller Diagonal trendline at 15080.00 – 15083.83.  The Cycles Model suggests that declining strength may get a boost today with continuance through the rest of the week.

In today’s op-ex, Maximum Pain for options investors appears at 15410.00-15420.00.  Long gamma first appears at 154550.00 and strengthens at 15480.00.  Short gamma appears at 15400.00.

Investing.com reports, ”

  • The Nasdaq 100 index is set to undergo its third rebalancing in history
  • It will reduce the weight of the top seven stocks in the index
  • Could that induce selling pressure from ETFs that track the index?

Back in 1998 and 2011, the Nasdaq 100 index faced a similar problem it faces today. First, with Microsoft (NASDAQ:MSFT) making up more than 25% of the entire basket, and later with Apple (NASDAQ:AAPL) taking up 20% of the index.

Interestingly, although Apple’s market capitalization was similar to that of Microsoft, its impact on the index was five times stronger due to a previous correction. In both cases, they decided to do a ‘special’ rebalancing to solve funds’ diversification issues.”


SPX futures rose to 4564.70 in the overnight market.  An aggressive sell signal awaits beneath support at 4500.00-4530.00.  Further support of the aggressive sell signal lies at the Cycle Top at 4471.23.  The Cycles Model puts us on the alert, suggesting declining strength may arise today and continue through the rest of the week.

Today’s op-ex shows Max Pain at 4545.00.  Long gamma may start at 4550.00, while short gamma may begin at 4540.00.  The options market is very tightly wound this morning.

ZeroHedge reports, “US futures are higher with bond yields also rising higher in quiet, cautious trade ahead of a barrage of earnings including MSFT and GOOGL later today, as well as central bank announcements tomorrow (the FOMC meeting begins today) and Thursday from the ECB and BOJ. S&P futures were fractionally higher, rising 0.1%, as a surge in Chinese stocks spilled over; Nasdaq 100 futures rose as much as 0.4%, after a weak session Monday, with Microsoft Corp. and Alphabet Inc. due to report their first earnings since artificial-intelligence fever broke out. Shares in both companies were about 0.5% higher in New York pre-market trading as investors waited to see if the results justify the companies’ hefty year-to-date share gains. Treasury yields climbed across the curve, while the dollar and oil both reversed earlier losses; iron ore prices climbed while gold reversed modest gains. Today focus will be on MSFT and GOOGL earnings after the close. On macro, we get Case Shiller, Consumer Confidence and Richmond Fed at 10am ET.”


VIX futures remain flat as the markets await a barrage of reports and earnings, as well as the FOMC statement tomorrow.  The Cycles MOdel suggests the VIX is likely to continue probing higher, with the 50-day Moving Average the next probable target at 15.03.

Tomorrow’s options expiration shows Max Pain at 13.00-14.00.  There is no short gamma, while long gamma begins at 15.00 and remains strong to 40.00.

ZeroHedge observes, “Speculation is driving the VIX lower but mid-summer seasonals are very positive for equity volatility, coinciding with an upcoming week of central-bank meetings and earnings announcements as potential vol catalysts.

We’re in the dog days of summer, but it’s never quite felt like you can let your guard down completely market-wise. Still, if your only gauge was the so-called “fear” index, aka the VIX, then you might have concluded we’ve already been in the doldrums for several months – last week, the index closed only smidge above where it was early 2020.

But that might be about to change. August and September are typically the months that see the most upside for the VIX. Seasonals should never be looked at in isolation. But nor should they be ignored when they show such a strong skew.”


TNX futures rose this morning to 39.16 (39.06 in the cash market).  The Cycles Model leaves us with a puzzle…  Today is day 251 in the current Master Cycle, leaving us an approximate week to determine the final outcome.  Should the probe higher continue, TNX may show a breakout above the Cycle Top at 40.80.  The alternate view is that The Master Cycle may have ended at the low of 37.35 on July 19 (day 245).  To make things even more interesting, the FOMC meeting starts today and announces at 2:00 pm tomorrow.  You can see why I am withholding judgement until the outcome is clearer.

Yesterday ZeroHedge reported, “Moments ago the Treasury concluded the week’s first sale of coupon paper when it sold $42BN in 2Y paper in what was a solid, if not stellar auction.

The auction stopped at a high yield of 4.823%, which was above last month’s 4.670% and the highest yield since June 2007. The auction tailed the When Issued 4.820% by 0.3bps, ending the brief streak of two stopping through 2Y auction.

The bid to cover of 2.782% dipped below last month’s 2.860% but was above the recent average of 2.74%.”


USD futures rose to 101.36 this morning as the new Master Cycle takes hold.  The Cycles Model suggests the rally may continue through the end of August.  USD is on an aggressive buy signal but may see confirmation above resistance at 101.98-102.36.


Crude oil futures pulled back to 78.30, leaving yesterday’s peak as the potential Master Cycle high on day 259.  The Cycles Model suggests a potential month-long decline to its 61.8% retracement of the 2020-2022 rally at 53.87.  Poor liquidity and seasonals may help channel crude oil to its target.  The rise above the 200-day Moving Average may be a red herring to cover shorts.

ZeroHedge comments, “Oil – taking out the 200 day moving average

Haven’t seen oil close above the 200 day moving average since Q3 2022….

Source: Refinitiv

Oil momentum

Brent momentum thresholds (short, medium & long term) are about to be triggered, and Brent positioning is still net short. (GS)”


Gold futures declined beneath the 50-day Moving Average, giving a confirmed sell signal.  The signal becomes twice confirmed beneath Intermediate support at 1951.83.  Gold often reaches its seasonal low in August and this may also be happening, but later than usual.  Should the decline persist during the month of August, iit may challenge the 2022 low.


Posted in Published | 3 Comments

July 24, 2023

10:16 am

The Banking Index is in day 255 of its Master Cycle.  It appears that the Cycle reversal may be a result of the FOMC announcement on Wednesday, day 257.  It is interesting how Cycle turns may occur on days like that.  Please note that the trendline at 93.00 from the Head & Shoulders formation has not yet been retested yet.  That may occur this week to signal the reversal.

.After Friday’s close, ZeroHedge announced, “The flow of funds continues into retail money-market accounts and banks’ usage of The Fed’s bank bailout fund remains at record highs (above $100 billion), but tonight we get to see The Fed’s latest efforts in obfuscation and seasonal-shenanigans about US banks’ deposits and loans.

Seasonally-adjusted, total deposits plunged $78.7 billion last week – the biggest weekly ‘run’ since March 22nd (right after SVB)


8:10 am

Good Morning!

NDX futures bounced to 15486.60 over the weekend, but have eased back  since then.  Last Wednesday’s high at 15932.05 remains the topo of the Cycle.

I am taking the long view (3.5 year chart) in order to point out some important technical details.  The first one is that NDX never violated the uptrend line that existed since 1987 (possibly longer).  This explains why NDX has outperformed all the other stock indices since the 80s.  The second observation is that NDX has been the major beneficiary of vast swathes of liquidity existent since the 80s and until recently.  Third, it has retraced 86.9% of the 2022 decline, completing its first probable bear market Cycle.  Finally, due to all the previous factors, investors are wildly bullish and may potential be caught wrong-sided in the oncoming decline.

Today’s op-ex shows Maximum Investor Pain at 15380.00.  Long gamma starts at 15400.00 while short gamma may begin gat 15350.00.

ZeroHedge observes, “Time may change me, but unlike David Bowie, we can trace time (or at least what went on over time). Let’s look at some weekly performance data for the Nasdaq 100 (NDX), the equal weighted Nasdaq 100 (NDXE), the Russell 2000 (RTY), the S&P 500 (SPX), and the equal weighted S&P 500 (SPW).

The Nasdaq has been leading the charge, but while it went up every week from late April until early June, the performance has been more inconsistent as of late. For the past 3 weeks, the Nasdaq 100 has provided the lowest return of the group (around 1.5% versus almost 4% for the Russell 2000).”


SPX futures retraced to 4550.10 this weekend, but has also eased back.  Wednesday’s peak remains the high for the Master Cycle.  The trend may revert to a decline.

The long view in the SPX is different from NDX.  It had historically remained beneath the 1987 trendline until early 2021.  After testing the trendline in February and March 2022, it decisively declined beneath it in May.  SPX came back to retest the trendline in August.  Normally that would have been the final retest.  However, the Liquidity injections by the Fed and the Bank of Japan may have given the SPX another retest.  The normal Cyclical pattern is that retracements usually stop near the mid-Cycle resistance, a 20% rally from the low.  However, when it exceeded that level, many claim the SPX may now be in a bull market having exceeded a 20% rally from the October low.    However, while the rally gained 31% from the low, it has only retraced 82% of the 2022 decline, the bull market is a myth unless the rally exceeds the January 2022 high at 4818.62.

In today’s op-ex, 4550.00 is heavily contested.    Long gamma may begin at 4575.00-4600.00, while short gamma kicks in at 4500.00.

ZeroHedge reports, “Futures rose as we enter a very heavy macro and earnings week highlighted by the Fed, ECB, BOJ, global PMIs and GDPs, US PCE, as well as earnings by GOOGL, MSFT and META. Global bond yields are lower after sharp declines in manufacturing and services gauges across Europe fanned concerns about economic growth. At 7:45am ET, S&P futures were 0.2% higher at 4,572 while Nasdasq 100 futures were up 0.3%. The USD was higher as cable slumped after a big miss in UK PMIs, commodities were in the green with gold, iron ore and oil prices all climbing. Today’s macro focus will be the US PMIs release (consensus expects 46.2 on mfg and 54.0 in services). Keep an eye on the price/inflation discussion in the detailed PMI report.”


VIX futures rose to a weekend high at 14.30.  The June 22 low remains the bottom of the 21.5 month Cycle.  This Cycle Pattern suggests a probable Long Cycle high in February-March, 2025.

Wednesday’s op-ex projects the probable Max Pain at 14.50.  While short gamma is virtually nonexistent, long gamma may extend to 40.00.  The next monthly op-ex on August 16 shows Max Pain highly contested at 17.00.  Short gamma extends between 13.00 and 16.00.  Long gamma begins at 18.00 and extends to 60.00.


TNX is lower this morning, on day 250 of the Master Cycle.  The Master Cycle low may have been put in early, on Wednesday.  However, there is too much potential for TNX to go in either direction in the next week to call the end of the Cycle.  Should it go lower, the mid-Cycle support is at 36.82, so the downside may be limited.


USD futures are higher this morning, to 101.15 after it has climbed above its trendline.  The bottom of the Cycle may have come early (day 245).  Since then it has made an aggressive buy signal.   That is worth taking note.  Should the buy signal hold, USD may rally through the end of August.


Posted in Published | Comments Off on July 24, 2023

July 21 2023

3:21 pm

SPX is testing the 2-month trendline at 4535.00 (was 4525.00 yesterday).  A decline beneath this second support reinforces the aggressive sell signal.


7:15 am

Good Morning!

NDX futures bounced to 15557.10 this morning in the expected retracement of yesterday’s decline after going deep into short gamma options territory.  Today is monthly options expiration and NDX rebalancing which may be volatile.

This morning’s op-ex shows Max Pain at 15350.00.  Long gamma may begin at 15375, while short gamma may start at 15300.  The afternoon settlement for QQQ (378.52) shows Max Pain at 372.00.  Long gamma begins at 375.00 while short gamma may begin at 370.00.

ZeroHedge observes, “Something remarkable is taking place under the market’s silky-smooth, VIX 13 surface: hedge funds are quietly blowing up. Not blowing up in the traditional sense of Amaranth, LTCM or Archegos, but as a result of some unique market dynamics (discussed in  “Historic “Spot Up/Vol Up” Chase Amid Multiple Unprecedented Developments In Derivatives“) hedge funds find themselves suddenly breaching position limits and forced to liquidate exposure (on both the long and short sides), in other words, degross and delever.”


SPX futures bounced to 4549.40 this morning, then eased back.  Wednesday may have been the Master Cycle top at 4578.43 on day 258.  Yesterday’s decline found support at the 2-month trendline at 4525.00 (shown yesterday afternoon).  A decline beneath it gives the SPX an aggressive sell signal.  The next level of support is the Cycle Top at 4455.01, reinforcing the aggressive sell signal.One should not be long after today.

Today’s morning op-ex shows Mas Pain at 4470.00.  Long gamma starts at 4500.00 while short gamma may begin at 4400.00. The PM expiration shows Max Pain at 4535.00 Long gamma starts at 4550.00 while short gamma begins at 4400.00.

ZeroHedge reports, “US equity futures are higher as futures pointed to a rebound from yesterday’s selloff, while the yen weakened on a BBG report that the the Bank of Japan won’t make any changes to its yield curve control program. As of 7:45am ET, S&P futures were 0.2% higher while Nasdaq futures rebounded 0.4% from yesterday’s 2.3% rout. Netflix and Tesla climbed in pre-market trading after leading the Nasdaq to sharp losses on Thursday on the back of disappointing results. The Bloomberg Dollar Spot Index traded near the day’s highs, pressuring most Group-of-10 currencies, with the yen suffering the biggest declines after Bloomberg reported that Bank of Japan officials see little urgent need to address the side effects of its yield curve control program. Treasury yields were little changed, mirroring lackluster trading in European and UK bond markets. Brent crude rose more than 1%, while gold fell and Bitcoin gained 0.2%. The Nasdaq rebalance will take effect after close today. Headlines remain quiet this morning; next week, we will receive key MegaCap Tech earnings, starting with GOOGL and MSFT on Tuesday (7/25), and the July FOMC on Wednesday.”


VIX futures declined to a ow of 13.72 this morning.  The Cycles Model calls for new trending strength today and through mid-week.  The current Master Cycle may last through monthly options expiration, the third week of the month.

Wednesday’s op-ex shows Max Pain at 14.50.  There is a small houlout of short gamma at 14.00.  Long gamma extends from 15.00 to 40.00

ZeroHedge observes, “As we previewed in far more detail yesterday, today is the largest July options expiration in history, driven by continued growth in index and ETF options volumes.

According to Goldman estimates, over $2.3 trillion of notional options exposure will expire including $500 billion notional of single stock options at the close, and $1 trillion in index options at the open.”


TNX has ease back to Intermediate-term support at 38.06 this morning.  The Cycles Model suggests the current Master Cycle may last until the end of the month.  It is likely to test the 200-day Moving Average at 37.05 in that time.


Posted in Published | Comments Off on July 21 2023

July 20, 2023

3:35 pm

SPX futures may be bouncing off the Diagonal trendline at 4525.00.  The 2-moth trendline is a clear demarcation for a sell signal.  Keep that in mind as tomorrow may be the largest July op-ex in history.

ZeroHedge remarks, “Tomorrow will see the largest July options-expiration on record, driven by continued growth in index and ETF options volumes.

Admittedly, July tends to be one of the smaller expirations of the year (January, March, June, September and December are the largest expiration months).

But, Goldman Sachs’ John Marshall estimates that over $2.3 trillion of notional options exposure will expire this Friday including $500 billion notional of single stock options.”


3:04 pm

NDX fell deep into short gamma territory beneath 15800.00 as the monthly op-ex and rebalancing loom large.  There is likely to be a bounce in the overnight session but the damage has been done.

ZeroHedge remarks, “Something remarkable is taking place under the market’s silky-smooth, VIX 13 surface: hedge funds are quietly blowing up. Not blowing up in the traditional sense of Amaranth, LTCM or Archegos, but as a result some rather unique market dynamics (discussed in  “Historic “Spot Up/Vol Up” Chase Amid Multiple Unprecedented Developments In Derivatives“) hedge funds find themselves suddenly breaching position limits and forced to liquidate exposure (on both the long and short sides), in other words, degross and delever.”


12:30 pm

The Ag Index has gained a lot of volatility, as news of world evens go from bad to worse.  It should be no surprise to see the dramatic moves over the past month.  At the end of June I had stated that this is a good time for accumulating shares of Ag products and businesses, with patience.  The reasons for this are two-fold.  The first is the opportunity to double or triple returns in the next year.  The second is that GKX is likely to decline to an earlier-stated target at 380.00 before the real uptrend begins.  The Cycles Model now suggests a month-long decline toward that stated target.  No one said that long-term investing is easy, but the rewards are there for the cool-headed.

ZeroHedge warns, “With as of Monday the Black Sea Initiative grain deal effectively having collapsed, Russia has been warning that ships traveling to Ukraine’s Black Sea ports will be seen as potential military targets.  The dire warning came after Ukraine’s government said it would persist in its grain and food exports via a temporary shipping route. A Wednesday statement from the Russian defense ministry (MoD) had announced “the flag countries of such ships will be considered parties to the Ukrainian conflict.”

Ukraine on Thursday issued its own ‘retaliatory’ message, warning in turn that ships and food tankers going to Russian ports could come under threat. US intelligence is also now alleging that Russia has begun laying mines once again in order to block Ukrainian ports.”

ZeroHedge explains, “After cancelling the Black Sea Grain Initiative deal, Russia has attacked the port of Odesa. Ukraine said the drone and missile strike specifically targeted its capacity to export grain out of Odesa, damaging a warehouse and a grain and oil terminal. Adding insult to injury, Russia warned that any ships sailing to Ukraine’s Black Sea ports would be seen as “potentially carrying military cargoes,” to further stifle Ukrainian exports. Russia did not say what it would do if any ships were found sailing to Ukrainian ports, but the US issued a warning that Russia’s attacks may expand to civilian ships.”


12:16 pm

The Banking Index may be in the final days of the retracement rally, having exceeded the 38.2% retracement value at 87.79 today, day 251.  $300 billion provided by the Fed in March has just delayed the banking index from imploding.  Liquidity is starting to unravel again with dire consequences.  The Cycle Model infers that (down) trending strength is about to return with a potential panic starting this weekend.  Americans have stopped paying down their debt, leaving banks holding the bag.

ZeroHedge remarks, “The New York Federal Reserve Bank said more Americans had their credit applications rejected last month at levels not seen in years.

The New York Fed reported on July 16 added that fewer people across the country also sought to borrow.

The report was part of the bank’s monthly Survey of Consumer Expectations, which is taken every four months to assess credit access issues in the United States.”


7:30 am

Good Morning!

NDX futures have fallen beneath a short-term support at 15775.00 this morning.  That, coupled with the Cycles Model suggesting the end of the Master Cycle, allows us to consider an aggressive short position.  The next level that reinforces the aggressive short position is the Cycle Top support at 15388.52.  At the minimum, long positions should be cleared.

Today’s op-ex shows Max Pain at 15825.00.  Long gamma starts at 15850.00 while short gamma may begin at 15800.00.  Sentiment leans toward the longs, but is weakening.

ZeroHedge remarks, “No declines market

The S&P has gone 37 days without a 1% decline. We saw this last at the November 2021 top. Is this time different?

Source: MacroCharts

Inverted fear

MAGMA options pricing is becoming extreme. Skew for this “sector” is close to all time lows, 1st %ile over 10yr. Some of the majors such as AMZN, MSFT, GOOGL are all trading with inverted skews, calls over puts. Upside fear is the new normal…”


SPX futures have eased down to a morning low of 4549.90.  We may have seen the Master Cycle high yesterday, on day 258.  It also marks the probable end of an 18.5-month Cycle from the 2022 top.  Should the reversal make its turn here, the Cycles Model suggests a decline to the end of August.

Today’s op-ex shows the strike at 4550.00 being hotly contested by both puts and calls.  Long gamma may begin at 4570.00, while short gamma may start at 4530.00.

ZeroHedge reports, “US  equity futures are lower as tech stocks struggle after some disappointing earnings updates from the sector. At 7:30am ET, S&P futures are down 0.2% while Nasdaq futures slide 0.8% as Tesla drops 3% in the premarket after Q2 profitability shrank, and Elon Musk said Tesla will have to keep lowering the prices if interest rates continue to rise. Months of markdowns have already taken a toll on automotive gross margin, which fell to a four-year low in the second quarter. Netflix tumbled over 6%, its biggest intraday decline since December,  after missing sales estimates and projecting third-quarter revenue that fell short of Wall Street estimates suggesting a crackdown on password sharing and a new advertising tier aren’t yet delivering the sales growth analysts anticipated. The rest of the Magnificent Seven are also lower while premarket bright spots includes airlines and banks. European chipmakers are also on the back foot after a cautious outlook from TSMC. Elsewhere, Treasury yields have climbed across the curve, while the dollar has drifted lower. Gold, oil, iron ore and bitcoin prices all increased. The macro data focus is on Leading Indicators, Jobless Claims, Philly Fed, and Existing Home Sales.”


VIX futures made a morning high of 13.98.  The  Cycles Model suggests a return of trending strength today and rising through next week.

Zerohedge remarks,”VIX’s “natural” floor

SPX is a trending asset, while VIX is a mean reverting asset. We have seen the SPX move higher, while the VIX refuses moving much lower. Volatilities at these levels have very limited downside. Using cheap volatilities for various strategies here makes a lot of sense. Replacing longs with calls, chasing further upside via calls or hedging downside exposure are all looking attractive.”


TNX may have resumed its rally, having risen above the Intermediate-term resistance at 37.98.  However, the Cycles Model suggests possibly another week of decline.  While normally this morning’s move would be a buy signal, the MOdel suggests we wait for further confirmation.

ZeroHedge comments, “Large and persistent fiscal deficits will entrench inflation and decimate the long-term real return of stocks and bonds, while reversing the secular underperformance of real assets.

Leviathan is back. After the post-GFC years of fiscal restraint, governments around the world are now running persistently higher deficits. This is a sea change, and it means a markedly different investment environment.

The Fed put was a backstop for financial assets. But the Treasury put is a different beast.

Assets may be able to post a positive nominal return, but in real terms they are likely to do poorly. Real assets, after 60 years of dreadful underperformance, are poised to finally begin outpacing stocks and bonds.”

Yesterday, ZeroHedge reported, “Moments ago, the Treasury held this week’s lone coupon auction in the form of a 20Y sale (really a 19Y-10M reopening) which came in solid, if not quite as stellar as last week’s auctions.

The high yield of 4.036% was above last month’s 4.010% and the highest since last November’s 4.072%; it also tailed the When Issued 4.035% by one modest basis point.

The bid to cover was 2.68, which while below last month’s 2.87 was just above the recent average of 2.67,


USD futures have continued to rise above the trendline at 100.00 for a possible confirmation of a buy signal.  The reversal is about two weeks early, so we may wish to reserve judgement for another day or two.  Should the reversal hold, the uptrend may be established, lasting through the end of August.


Posted in Published | Comments Off on July 20, 2023

July 19, 2023

7:45 am

Good Morning!

NDX futures are hovering near yesterday’s intra-day high as they struggle against overhead trendline resistance.  Today is day 258 of the Master Cycle.  It is time to anticipate a reversal as the Cyclical structure may be complete.  An aggressive sell signal awaits beneath 15696.44.

Today’s op-ex shows Max Pain at 15825.00.  Long gamma may begin at 15850.00, while short gamma starts at 15800.00.

ZeroHedge remarks, “There was a fascinating chart in today’s Fund Manager Survey report from Bank of America: it showed that while financial institutions are bearish (or at least deeply underweight stocks), US individuals – as measured by the AAII (American Association of Individual Investors) are very bullish: in fact there are only a handful of times when they have been more bullish.

But while it remains doubtful that institutions are truly “waiting for the moment to go short” or even merely underweight stocks, despite what their profess to the BofA Fund Manager Survey which, as we have lamented before, nobody ever tells the truth…”


While this is not absolute proof, the gains in the NDX for the past month may be explained by participation by the Bank of Japan.  Japan’s dirty little secret is that the BOJ owns virtually 80% of all Japanese-issued ETFs and the devaluation of the Yen has given Japan an artificial boost in their US stock holdings.  So, our equities markets have prospered even during stock buyback blackouts and low domestic liquidity.  No wonder that institutions remain bearish and are being dragged reluctantly into the markets by retail investors.  Until now, the Bank of Japan has their back…


SPX futures remain flat just beneath yesterday’s high.  The Cycles Model suggests that SPX is on target for a reversal.  The 2-hour trading chart shows the Cycle Top at 4553.00, beneath that may lie an aggressive sell signal.  The Diagonal trendline lies at 4500.00, where a short-term sell signal may be confirmed.

In today’s op-ex, the 4550.00 strike is being hotly contested with over 5700 call contracts and over 4000 put contracts.  Long gamma begins at 4565.00 while short gamma may begin at 4540.00.

ZeroHedge reports, “Futures were just barely higher, having erased earlier small gains following yesterday’s frenzied meltup that sent spoos just shy of 4600 to a fresh 52-week high. Sentiment was boosted by sliding Treasury yields after UK inflation came in weaker than expected, sending the pound sharply lower and UK bonds led a global fixed income rally, while the USD rose as the Japanese yen resumed its slide as markets reassessed the likelihood of BOJ YCC intervention. At 7:30am ET, S&P futures were up 0.01% at 4588, following mixed results from Goldman Sachs (more details in a follow up post). Bond yields are lower and the USD is higher as pound and yen slide. Commodities are bid in both Energy and Ags; corn and wheat are up more than 3%; oil is also higher while Bitcoin trades just above $30K, erasing much of yesterday’s loss.”


VIX futures probed marginally lower to 13.25 this morning as today is the monthly options expiration day.  The Cycles Model does not anticipate a new low, but there is room for a further decline as short interest in VIX options is very high.  Note that the majority of these short contracts will expire at today’s close.

Today’s monthly options expiration shows Max Pain at 17.00.  Short gamma is strong from 16.00 to 13.00.  Long gamma is strongest from 18.00 to 36.00.

ZeroHedge comments, “Index implied vols continue to drift ever lower, tracking realized vols ever lower

But, many expect today to be a local/short term “low” in volatility due to VIX expiration tomorrow, and equity OPEX on Friday.”

RealInvestmentAdvice explains, “The volatility index is so low it has to go higher eventually. Such seems obvious, but this year, despite the banking crisis, higher interest rates, and slowing economic data, investors continue to abandon hedges amid bullish optimism.

But what exactly is the volatility index, more commonly called the “VIX,” and why does it matter?

“The Cboe Volatility Index (VIX) is a real-time index representing the market’s expectations for the relative strength of the S&P 500 Index (SPX) near-term price changes. Because it is derived from the prices of SPX index options with near-term expiration dates, it generates a 30-day forward projection of volatility. Volatility, or how fast prices change, is often seen as a way to gauge market sentiment, particularly the degree of fear among market participants.”


TNX continues its decline, approaching the 50-day Moving Average at 37.22.  There may be a bounce to test Intermediate-term resistance at 37.94 before a further decline, possibly to the Cycle Bottom at 32.67.  An alternate view is that TNX may test its mid-Cycle support at 36.88 and may be capable of an early Master Cycle low in the next few days.


Posted in Published | 1 Comment

July 18, 2023

10:15 am

BKX has resumed its probe higher and may extend the current Master Cycle another week or longer.  Today is day 249.  The formation is rather complex, but may  become clearer over the next week.  Reducing bond yields increase excess liquidity giving the banks a chance to redeploy assets.  In addition, the Bank of Japan may have resumed its investments in US equities.  Any shift in the current situation may lead to a rout in bank stocks.  The large banks are managing to show a positive return despite underlying weakness, here and here.

ZeroHedge notes, “A re-acceleration in inflation is the primary endogenous risk for the stock market.

Stein’s Law states that:

“If something cannot go on forever, it will stop.”

What might stop equities in their tracks? The most compelling candidate – and therefore the one which investors should be most vigilant for – is inflation.”


8:40 am

Good Morning!

SPX futures are flat, hovering above 4500.00.  That appears to be a support (round number) from which either it goes higher, as investors are hoping, or breaks down.  Today is day 257 of the current Master Cycle.  After much study, the only conclusion I can reach is that the SPX is in an extension beyond the June 16 high, with diminished trending strength.  Should the reversal happen this week, it may be accompanied by a return of trending strength.

Today’s oop-ex shows Max Pain between 4515.00 and 4520.00.  Long gamma begins at 4535.00 while short gamma may begin at 4510.00 with reinforcements at 4495.00.  Friday’s (monthly) op-ex shows 4500.00 to be very hotly contested, but weighing more on the long side.  A decline beneath 4500.00 may set off a firestorm of volatility.Investors have discovered options as a means of putting a low cost call on the SPX, leaving the dealers doing all the heavy lifting.

ZeroHedge reports, “US equity futures were trading flat on Tuesday as Bank of America unveiled solid second-quarter earnings (and Morgan Stanley on deck), with retail sales also due this morning (expect a miss as noted last night) giving the latest insight on the health of American consumers. Contracts for the S&P 500 and the Nasdaq 100 futures were fractionally lower at 4,551 as of 7:15 a.m. ET. Treasury yields declined across maturities, while the dollar weakened. A rally in European bonds gained steam Tuesday after prominent ECB hawk Klaas Knot raised hopes that the end of the rate-hiking cycle is in sight. Gold, bitcoin and oil prices rose, whereas iron ore was down slightly.”


VIX futures declined to a low of 13.30 this morning before rising to the current high at 13.63.  The Cycles Model calls for positive trending strength to return later this week and to build strongly on that the following week.

Tomorrow’s (monthly) op-ex shows the 17.00 strike to be hotly contested with over 151,000 put contracts and over 161,000 call contracts.  Puts remain strong down to 12.00, while calls are well populated up to 70.00.  A misstep in the market may cause an explosion in the VIX.


TNX ix drifting beneath Intermediate-term support/resistance at 37.92 and may test the 50-day Moving Average at 36.90 today.  A probe above Intermediate-term resistance may lend a brief spike back toward the Cycle Top at 41.19.  However, the Cycle points down, toward the Cycle Bottom at 32.62, which may be accomplished by the end of the month.


USD probed to a new low at 99.22 this morning.  The Cycles Model suggests USD may drift lower until the end of the month in a throw-under formation.  The target of this decline may be near 96.00.  A surprise reversal may come in early August.


Posted in Published | Comments Off on July 18, 2023

JULY 17, 2023

9:10 am

The Ag Index may be nearing its Master Cycle terminus.  Today is day 257, so we are on high alert for a reversal.  GKX may yet test the 61.8% retracement at 387.76 or the Wave (4) support at 380.00 before re-establishing is uptrend.  This is a good accumulation zone for patient investors.

ZeroHedge reports, “Wheat prices jumped as news broke Monday that Russia let the UN-brokered grain deal lapse at midnight, Istanbul time, marking the end of the Turkey-administered humanitarian corridor which let Ukrainian grains get exported to global markets. Russia since confirmed the deal has been “terminated”.

What was formally called the Black Sea Grain Initiative had already been extended for multiple short increments since its implementation in July 2022. The Kremlin confirmed in a statement by Dmitry Peskov: “The Black Sea agreements ceased to be valid today. As the President of the Russian Federation said earlier, the deadline is July 17.”


ZeroHedge observes, “Meat is always on the menu in many parts of the world, as we can see when we map out meat consumption by country.

How do countries differ in how much, and what type of meat, they eat? In this colorful graphic, Visual Capitalist’s Pallavi Rao discusses creator theWORLDMAPS; breakdown of the most consumed type of meat in every country in the world, using data from the UN’s Food and Agriculture Organization (FAO).

Each color denotes a different category of meat – beef, pork, mutton, poultry, seafood, or other – with annual consumption calculated per capita in kilograms (kg).”

ZeroHedge comments, “Central planners are pulling double shifts.  Contriving plans and proposals to control what you consume, how you travel and cook, where your money is spent, and much, much more.

You know who we’re talking about.  The Davos WEF crowd.  The UN, IMF, World Bank, and central bankers.  Washington lobbyists, NGOs, public/private partnerships, technical advisory committees, nonprofits, and everything in between.  We’re also talking about your meddling neighbor, and many others.

What’s their deal?  Do they think they’re making the world a better place?  And, if so, a better place for who – them or you?”


9:00 am

BKX may have ended its Master Ccle on Friday, day 274.  This Master Cycle has been extended in time, but not in strength.   It may have completed it bounce with only a 32% retracement.  This has been an extremely weak retracement and may foretell even more weakness as the decline resumes.

ZeroHedge observes, “Things seemed rosier at 8am ET Friday .. 3 for 3 banks beating and taking guidance higher and yet banks ended -2%. Even best-in-class prints like JPM flat on the day. Why? 

Bank stocks came into these prints hot(ter) with softer CPI and this view that positioning was light (names were generally up ~3-10%). Further, we kick off earnings with potentially the best of the best .. essentially the banks that mkt viewed as having best shot of putting up good results and good guides, so there is an element of “is this a top tick?” and that potentially areas of concern will get amplified as we progress through EPS season.”


8:00 am

Good Morning!

NDX futures have been flat this weekend after making a new retracement high on Friday.  The Cycles Model suggests this week may be highly charged and volatile throughout the week and may extend into the following week.  Note that Friday is monthly options expiration and the next FOMC meeting is scheduled for July 25-26.  The Cycles Model may be offering an aggressive sell signal beneath 15500.00.  The Sell signal may be confirmed beneath the Cycle top at 15222.83.

Today’s op-rx shows Max Pain at 15550.00.  Long gamma starts at 15560.00 while short gamma begins at 15500.00.

ZeroHedge comments, “Bernstein says to take some profits in Tech

Bernstein come to the conclusion that if you were overweight, you should take some profits and move to neutral, not underweight. The sector is now at its highest relative valuation to the market, a 54% premium, for the past 45 years, ex dot com. Earnings have been upgraded, but that looks priced in. Particularly for some of the mega-caps like Apple, Microsoft, NVDA & ORCL.

Source: Sanford Bernstein

Are we in an AI bubble?

Bernstein points to the chart below which shows that both Bing & ChatGPT search volumes are rolling over. Now, AI is a lot more than ChatGPT knock-offs, but the other stuff is much more complicated and not as consumer facing and so inherently lower profile. AI isn’t going away, quite the contrary, but its almost immediate ubiquity doesn’t bode well for initial returns.”


SPX futures appear to be supported at 4500.00.  A loss of that support may sent the SPX to its Cycle Top support at 4425.88.  Beneath that the aggressive sell signal is strengthened.

Today’s op-ex shows Max Pain at 4380.00.  Long gamma may begin at 4485.00 while short gamma may start at 4475.00.

ZeroHedge reports, “US equity futures were flat erasing, a modest earlier gain, while European stocks and oil retreated as bonds rallied after the latest Chinese data dump delivered more evidence of a slowdown in the world’s second largest economy, where Q2 GDP rose just 6.3%. below the 7.1% consensus forecast. At 7:30am, S&P futures were down 0.1% to 4,531 while Nasdaq 100 futures were fractionally in the green. Bond yields are 3-5bp lower, with the benchmark 10Y at 3.78%; the USD is weaker again; commodities are mixed with wheat pricing spiking after Russia terminated the Black Sea Grain deal; base metals are lower after the soften China GDP print. Yellen said US should further de-escalate US-China tension, but lifting tariffs may be premature. Fed entered its blackout period ahead of its July 26th FOMC. On the calendar today, we get the Empire Mfg. index data today at 8.30am ET (-3.5 survey vs. 6.6 prior).”


VIX futures have risen to 14.00 over the weekend session.  It is on a confirmed buy signal that allows accumulation of shares on the pullback.  The Cycles Model suggests trending strength may be on the increase over the next two weeks.

Wednesday’s (monthly) op-ex shows the 17.00 strike highly contested.  Short gamma starts at 16.00 and extends to 13.00 while long gamma begins at 18.00 and extends to 60.00.


TNX has challenged Intermediate-term support at 37.93.  It may be due for a bounce over the next couple of days.   Once the bounce is over, it may test the mid-Cycle support at 36.92 by the end of the month.


USD futures rose over the weekend to 99.72, remaining in the throw-under position.  The Cycles Model suggests today may be a day of strength.  Should it rise above the trendline at 100.00, we may see the USD recover.  Otherwise, the USD may linger eneath the trendline until the end of the month.


Posted in Published | Comments Off on JULY 17, 2023

July 14, 2023

10:10 am

BKX, our liquidity proxy, made a new retracement high at the open, then reversed lower.  JPM’s glowing report comes at a cost to other banks’ solvency.  The Banking crisis may be about to resume.

ZeroHedge remarks, “Q2 earnings season officially started just before 7am ET when JPM reported earnings which, as expected, trounced expectations primarily on the back of generous contributions from the First Republican FDIC/taxpayer bailout-cum-gift, which has helped push the bank’s net interest income that much closer to a mindblowing $100 billion.”


8:40 am.  Bastille Day

Good Morning!  I spent a little extra time in analysis this morning.  I hope you appreciate it.

NDX futures spent the night beneath yesterday’s high at 15602.74.  It qualifies as an extended Master cycle high at day 273.  While there is no definitive reversal, the Cycle formation may be complete.

Today’s op-ex shows Maximum Pain for investors at 15530.00.  Long gamma starts at 15550.00 while short gamma begins at 15500.00.  Options investors have been front-running a very large playerthat may have withdrawn from the game.

ZeroHedge remarks, “NASDAQ – perfection continues

The perfect trend channel that has been in place since March lows stays very much intact. This time around we touched the 21 day and decided to bounce (without even testing the lower part of the channel). Note how far down the 50 day is…”


That player is the Bank of Japan.  Since early January, the Yen has declined 12% to the USD.  As a result, that change in the FX market has magnified the gains of all stock investments in the US, but especially in the NDX.  Since early this year, the NDX has appreciated by 56.5% in Yen.  The Bank of Japan is notorious for owning stocks, something that the Fed would not do publicly.  That Cycle may now be over, as this combination is now testing the Cycle Top at 212.65.  A cross beneath it implies a change in trend.  The “perfect investment” may have lost ist largest supporter.


SPX futures ventured marginally higher, to 4519.80 this morning, but may have lost momentum.  As mentioned earlier, yesterday was day 273 in the Master Cycle.  A new Master Cycle may have arrived.  With it may come a five-fold increase in strength and volatility.  I hope you are ready.

Today’s op-ex shows Max Pain at 4465.00  Long gamma starts at 4475, while short gamma may begin at 4450.00.

ZeroHedge reports, “The week’s powerful rally which sent US stocks to a new 52-week high has faded, with futs down small after a quiet overnight session on the day JPM officially ushers in Q2 earnings season as the post-CPI market rally pauses for breath as investors contemplate how recent US inflation data will impact upcoming Fed policy decisions. As of 6:45am ET S&P futures are flat at 4,542 while Nasdaq futures are down 0.1%. Bond yields are 3-5bp higher, and the USD has reversed higher after dropping the lowest level in more than a year. Commodities are mixed with energy lagging and base metals such as iron ore extending gains from yesterday. Yesterday’s dovish PPI and lower-than-expected initial claims supports the soft-landing narrative. Key focus today will be banks earnings; JPM, C and WFC report pre-market. Keep an eye on banks’ commentary on consumer health, credit trends and loan growth. We will also get the latest UMichsentiment data (consensus sees 65.5 vs. 64.4 prior); 1yr inflation expectation is estimated to fell to its lowest in two years”


VIX futures are on the rise, although not yetrising above the 50-day Moving Average at 15.62.  Recall that VIX has challenged the 50-day and pulled back.  This is a place to accumulate shares.


TNX has declined beneath the Intermediate-term support at 37.92, giving it a sell signal.  The Cycles Model suggests that TNX may continue its decline to the first week of August.  The likely target may be the Cycle Bottom at 32.59.

ZeroHedge remarks, “There was a shocking number in today’s latest monthly US Budget Deficit report. No, it wasn’t that US government outlays unexpectedly soared 15% to $646 billion in June, up almost $100 billion from a year ago…

… while tax receipts slumped 9.2% from $461 billion to $418 billion, resulting in a TTM government receipt drop of over 7.3%, the biggest since June 2020 when the US was reeling from the covid lockdown recession; in fact never have before tax receipts suffered such a big drop without the US entering a recession.”


USD futures have bounced to test the trendline near 100.00.  It is currently in a throw-under of an Ending Diagonal formation, which may last a couple of weeks.  During that time, USD may decline to its Cycle Bottom at 98.32.  Calls for the demise of the USD may become more shrill, but this decline is merely a retracement of the 2021-2022 rally from 89.51 to 114.75 and not a change in trend.

ZeroHedge comments, “The prevailing downwards trend in the dollar is primed to remain intact while the real yield curve flattens.

FX is one of the hardest markets to get consistently right. Traders often employ a lot of leverage so there is little room for error, or for indiscipline with stops or sizing. But sometimes getting the bigger trends is not as frustratingly hard.

One of the best leading indicators for the dollar, for instance, is the real yield curve. The intuition is the dollar is driven at the margin by the real return of foreign investors into US yields.”


Posted in Published | 2 Comments

July 13, 2023

3:31pm

SPX may be nearing completion of its final probe in this series at 4 degrees of trend.  Should it be so, the reversal may come overnight.  Looking at this as the end of a trend, we are in day 272, which barely leaves another day to go.  At the minimum, consider taking long profits. An aggressive short may be taken beneath the two-month trendline at 4450.00.  Earnings season will start tomorrow and analysts are unfazed.

ZeroHedge remarks, “On Friday, Q2 earnings season kicks off when JPM reports just before 7am followed by WFC, and C, while MegaCap tech reports earnings in two weeks (Jul 26). 82% of S&P 500 firms (80% of market cap) will have reported by August 7th, and the bulk of reporting takes place during the week of July 24, when 48% of S&P reports.”

ZeroHedge further observes, “As discussed in our CPI preview, Wall Street expectations were for a soft CPI. The final number ended up being a dovish bomb with a rounded-up 2-handle, sending the dollar tumbling and stocks soaring to respective 52 week lows/highs.

Wall Street, which has been extremely bearish for most of 2023, pretended as if it hadn’t been dead wrong for the duration of the post-October bull market, and spun the CPI data as the all-clear for continued gains.”


12:03 pm

The Ag Index may have hit its Master Cycle low today, on day 253.  It did not venture to its 61.8% retracement at 387.76.  However, the pattern appears complete, or nearly so.  It may be time to accumulate shares of Ag businesses.


10:20 am

BKX may have completed its Master Cycle at day 272 yesterday.  It completed a 32% retracement of its February-to-May decline.  The banking crisis maybe about to resume.  The key is that the banks’ earnings season starts tomorrow.


8:15 am

Good Morning!

NDX futures rose to 15429.80 this morning.  The next resistance is at 15500.00 as it remains above the Cycle Top at   15123.80.  This is a rare phenomenon, as the Cycle Top is usually the final resistance in a Wave 5.  It shows ample liquidity for stocks in a market that is known for its illiquidity.  The question is, Where is the liquidity coming from?  Today is day 252 in the latest Master Cycle, so this matter may be resolved in the next week.

Today’s op-ex shows Maximum Pain for options investors at 15330.00.  Long gamma begins at 15350.00, while short gamma starts at 15300.00.  The domestic (daytime) market is clearly driven by long gamma, which may be the origin of the aforesaid liquidity.

RealInvestmentAdvice observes, “A recent whitepaper by the Federal Reserve warns of “significantly lower profit growth and stock returns in the future.” In his article, End of an Era: The coming long-run slowdown in corporate profit growth and stock returns, Michael Smolyansky explains how the interest rate and corporate tax rate trends for the last thirty years provided a strong tailwind for corporate profits. As a result, stocks performed better than would have otherwise been the case.

Understanding why corporate profits and, ultimately, stock prices outperformed in the past is important. However, more critical for investors is the future and assessing how interest rates and tax rates will affect earnings growth and stock prices.”


SPX futures rose to a morning high at 4491.80, on its way to 4500.00.  It continues to use its Cycle Top at 4415.12 as support.  Again, a highly unusual circumstance at this late in the rally.  As mentioned earlier, today is day 252 in the current Master Cycle.  That leaves the market a possible week to rally further.  However, the formation may lead to a sudden collapse, catching many investors unawares.  An aggressive sell signal may be invoked beneath the Cycle Top at 4415.12.

Today’s op-ex shows Max Pain for options investors at 4475.00.  Long gamma begins at 4495.00 while short gamma starts at 4450.00.

ZeroHedge reports, “For the second day in a row, US equity futures are higher as part of a global risk-on move one which has sent spoos to fresh 52 weeks highs, and fast approaching the Jan 2022 all time high. Tech is again outperforming led by the “magnificent 7″ megacaps following the unexpectedly soft CPI print which sparked expectations that after the July hike the Fed is done, and has accelerated the dollar tumble. As of 7:45am ET, S&P futures were 0.3% higher to 4,522 while Nasdaq futures rose 0.6%. Bond yields and the USD continue their move lower, with steepening in the belly of the curve. The DXY has made a 52-wk low today. The plunge in the dollar means that commodities are bid with strength across all 3 segments; keep an eye on Ags as India may move to restrict rice exports and the Black Sea Grain Initiative expires next week. Today’s macro data focus is on PPI, which will boost confidence that yesterday’s CPI print was not a fluke. Keep an eye on PPI in the future as China’s negative PPI and the lack of money supply growth may put accelerating downward pressure on input costs. Bank earnings kick off tomorrow.”


VIX futures made a new retracement low at 13.29 this morning.  While VIX may go down to, but not below, the June 22 low, the reversal may be imminent.

Wednesday’s op-ex shows the strike at 17.00 to be hotly contested and the locus for Max Pain.  Short gamma starts at 16.00 and is strong to 13.00.  Long gamma begins at 20.00 and appears strongly held to 60.00.


I have endeavored to find the source of liquidity for our supposedly illiquid equities market.  It appears that the SPX, measures in Japanese Yen, rallied nearly 30% since the March low banking crisis, nealry matching the 32% rally in the NDX.  We know that the Fed injected $300 billion into the banking system, but that was used to band-aid over their own solvency issues.  Banks have raised their lending rates and tightened their credit requirements since then, so it was not the banks that gave the stock market the extra juice.

Instead, it may have been the Bank of Japan, which has been known to buy equities at the drop of a hat.  The Bank of Japan now owns approximately 80% of all the stock ETFs issued in Japan and is a major player in all the Japanese indices.  It should not surprise us to know that the Bank of Japan may have been been the “big player” in the most recent rallies in the SPX and NDX.


USD futures are challenging the lower trendline at 99.65 this morning.  Should it hold, we may see a reversal by the weekend.


TNX is testing its trendline at 37.95 this morning.  It may bounce today, but subsequently decline beneath the trendline to the 50-day Moving Average at 36.98.  The Cycles Model suggests that this correction may last to the end of the month, so the likelihood of a lower correction is high.

ZeroHedge remarks, “In a recent podcast, Peter Schiff warned that we could be on the verge of a further breakdown in the bond market and that a bear market in bonds could also maul US stocks and the dollar.

Financial commentator and investment guru Jim Grant has similar concerns. In a recent interview on Odd Lots Podcast, Grant said he thinks we’re at the beginning of a long-term trend of a weak bond market with higher interest rates that could last decades.”


Posted in Published | Comments Off on July 13, 2023