August 9, 2023

11:05 am

SPX has ventured into short gamma beneath 4490.00.  The 2-hour mid-Cycle and Intermediate support lies at 4481.00.  Hourly Cycle A ended at yesterday’s close.  Hourly Cycle B is beginning as short gamma begins to influence the SPX.  This may last until monthly options expiration. This is no place to be long, since SPX signals become elevated to a confirmed sell signal beneath 4481.00.  The 50-day Moving Average lies at 4404.40 where most traders assume a sell signal.


10:00 am

As the worldwide food crisis gathers momentum it is surprising to many that the Ag Index is still in decline.  The Cycles Model maintains that there may be another two weeks of declining prices.  As it turns out, the Cycles May be more powerful than any fundamental reason for the price being what it is.  While worldwide demand due to shortages may be rising, domestic consumption has gone down as consumers retrench.   This provides investors with a potential opportunity to buy food and ag-related investments at prices not seen in two years.  The news of pending shortages may not have hit the grocery shelves yet.

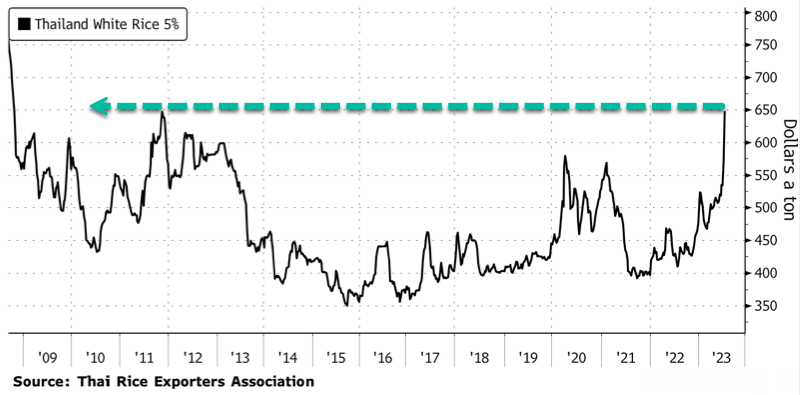
ZeroHedge observes, “On Wednesday, the Thai Rice Exporters Association revealed that the price of Thai white rice 5% broken, a key Asian benchmark, reached the highest level since Great Financial Crisis. This surge is mainly attributed to increasing fears of a global shortage due to the damaging effects of the El Nino weather phenomenon on Asian farmlands and India’s recent decision to restrict certain rice exports.

Thai white rice 5% broken hit $648 per ton this week, the highest level since October 2008. Prices are up over 50% since the start of 2022.

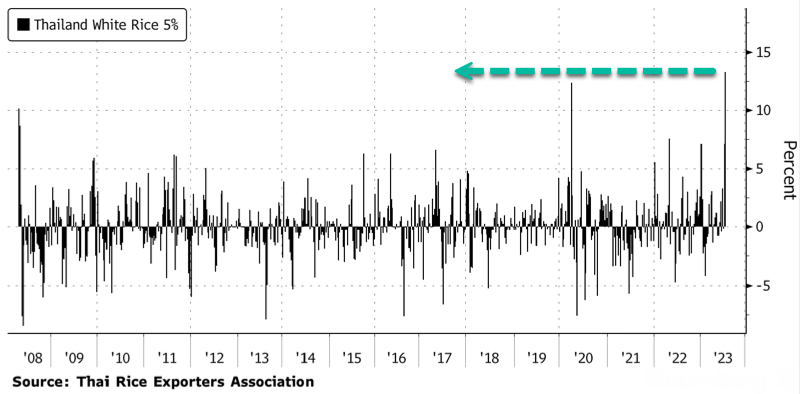
The weekly change in rice prices is about a 13% surge, the largest since the index began in the summer of 2008. ”


8:15 am

Good Morning!

NDX futures rose to an overnight high of 15354.10, approaching the Ending Diagonal trendline at 15500.00.  It has since reversed back down to the flat line.  While NDX may be positive for another hour or so, it may already have made the key reversal in the overnight session.

Today’s options expiration shows Maximum investor pain at 15280.00.  Long gamma begins at 15300.00.  Short gamma starts at 15200.00.  Sentiment is still positive in the NDX, with calls outnumbering puts.

ZeroHedge comments, “SPX – say hello to the 50 day moving average

SPX is approaching the 50 day moving average. The big trend channel since March lows is still intact, but watch for a possible break down eventually. Momentum has changed rapidly…100 and 200 day moving averages remain way lower.

Source: Refinitiv

NASDAQ hitting the 50 day

NASDAQ is currently trading right on the 50 day moving average. 15200 is a short term level to watch, but the bigger support is at 15k. NASDAQ is now established “well” below the channel and pretty much all bigger candles since recent highs are all bearish.”


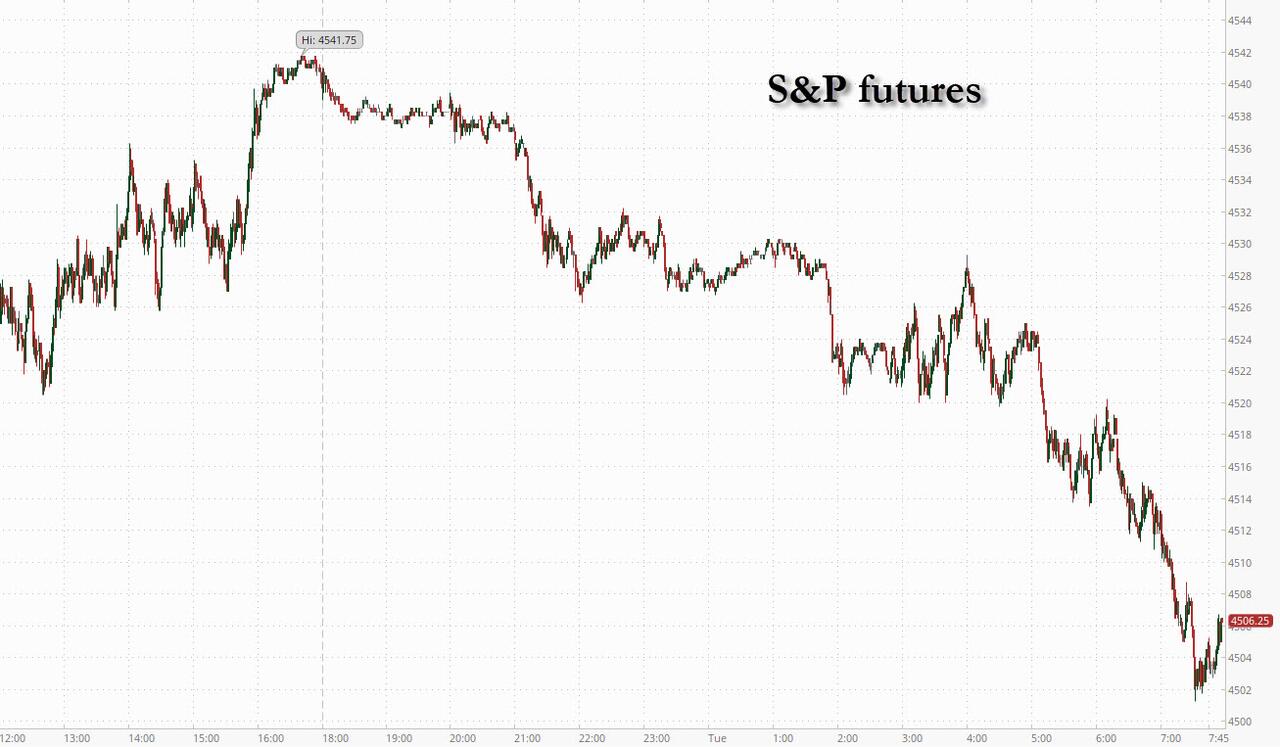
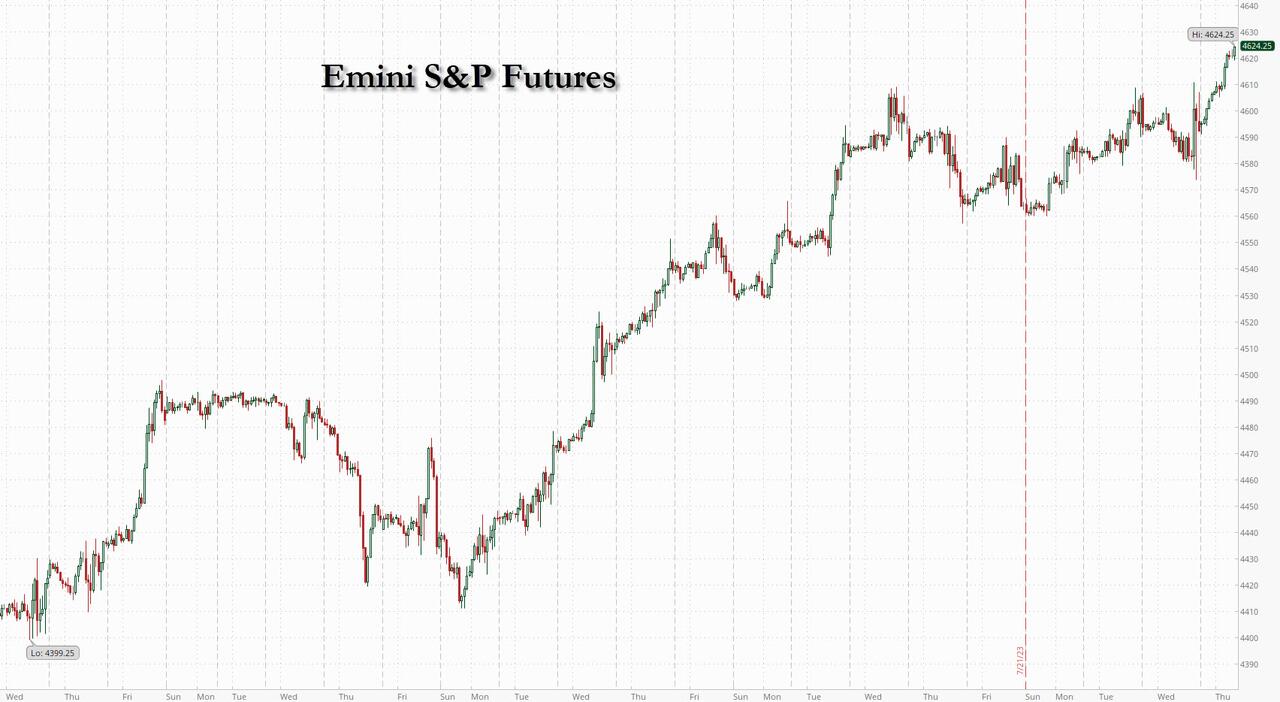
SPX futures rose to an overnight high of 4517.30, nearly matching Monday’s high at 4519.84 and completing an expanded flat correction.  It has since pulled back to the Max Pain zone.  The Cycles Model indicates a probable change in the hourly Cycles, suggesting a panic decline may have begun.  Indications are that the decline may accelerate into the monthly options expiration.  The initial target may be the March 13 low at 3808.86.

Today’s op-ex shows Max Pain at 4500.00, which is hotly contested with 4854 calls and 5115 put contracts.  Long gamma starts at 4530.00 while short gamma triggers at 4490.00 and remains strong down to 4380.00.  Today may be dominated by short gamma.

ZeroHedge reports, “S&P futures point to a higher open after China officially entered into deflation with -0.4% CPI print, continuing the buying momentum from the second half of yesterday’s session while European stocks rebound sharply from yesterday’s rout led by a rebound in Italian banks after the government backtracked on part of its new windfall tax on lenders. As of 7:45am ET, both S&P and Nasdaq 100 futures are 0.2% higher with other global markets also in risk-on mode, with the euro strengthening, copper rebounding, 10Y TSY yields rising to 4.03% ahead of another closely watched bond auction later today (US government is selling $38 billion of new 10-year notes, $3 billion larger than the last 10-year note debut in May) and oil rising by $1, just inches away from 2023 highs. Rice in Asia soared to its highest level since 2008.”


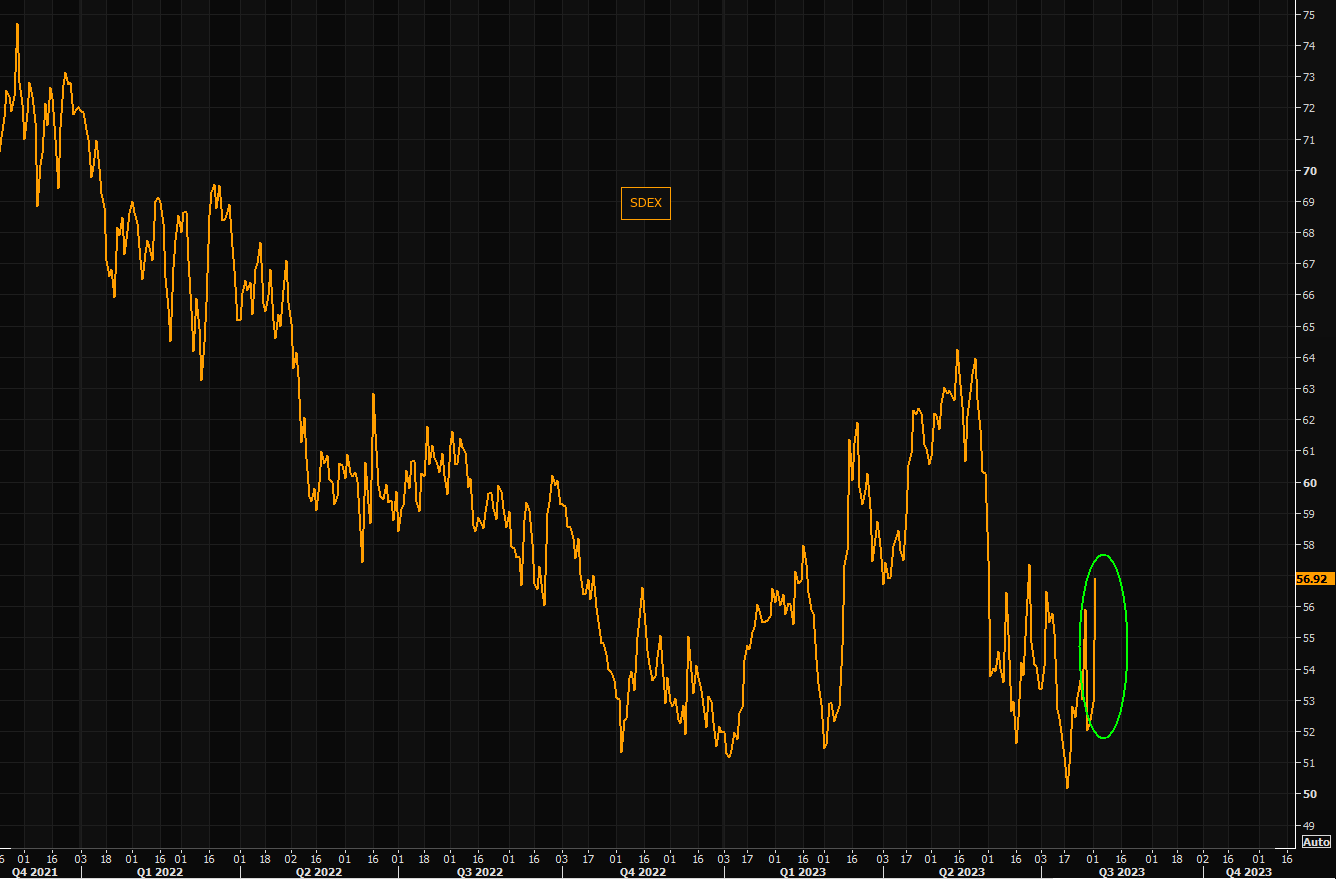
ZeroHedge warns, “We just had a long period of calm in the market, but now it is as or more important than ever this year to be monitoring market gamma levels.

We just had the first negative market gamma reading of the quarter on Thursday, and then an even stronger negative market gamma reading on Friday.

The longer the market remains trapped in negative market gamma territory, the more dangerous it gets because there is more opportunity for fragility (from declining liquidity and shock absorbing gamma) to meet a burst of systematic market risk or other kind of momentum event.”


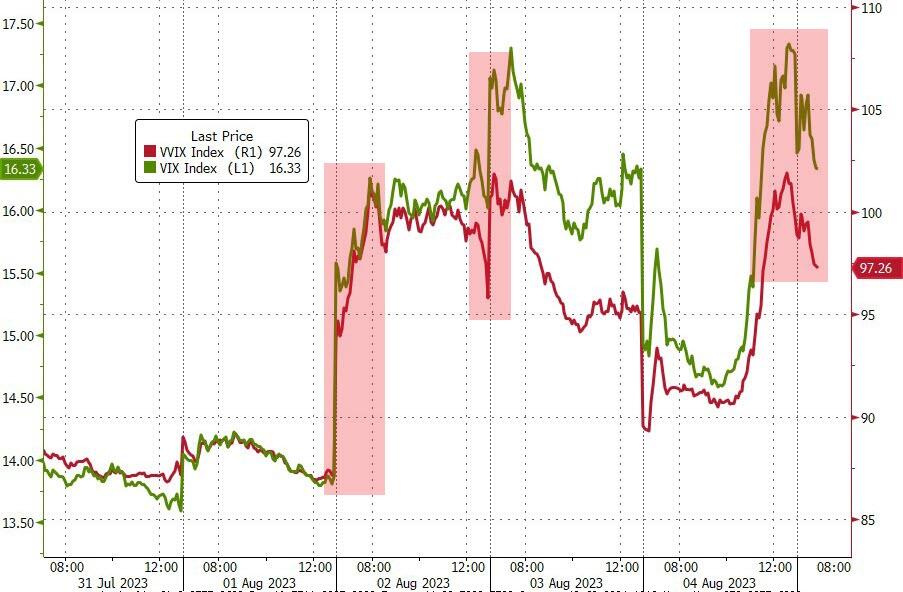
VIX futures declined further in the overnight market to 15.47, completing an expanded flat correction.  Yesterday’s breach of the trendline at 18.00 has put it on a confirmed buy signal.  Next Wednesday’s monthly op-ex has special significance and may give us a new high not seen since March.

ZeroHedge announces, “Welcome to fear

Regular readers of TME are familiar with one of our favorite “under the hood” stress indicators, the VIX 2/8 months spread. This one is moving into fear territory…

Source: Refinitiv

Last time…

…VIX was here, the SPX traded close to 4250. You do not compare mean reverting assets to trending assets over longer time periods, but shorter term “gaps” are not to be dismissed.


TNX bounced back above 40.00 and may threaten to make a new high.  Usually corrections stay within the limits of the previous high or low.  However, there are expanded corrections that may probe a new high and still be corrective, as the Cycle may end back down at the low.  This may be such an event.

A more likely explanation is that Wave 5 may be expanding.  The reason is that the new Master Cycle runs to mid-September.  If so, we may see TNX reach 45.00-50.00 within this Master Cycle.

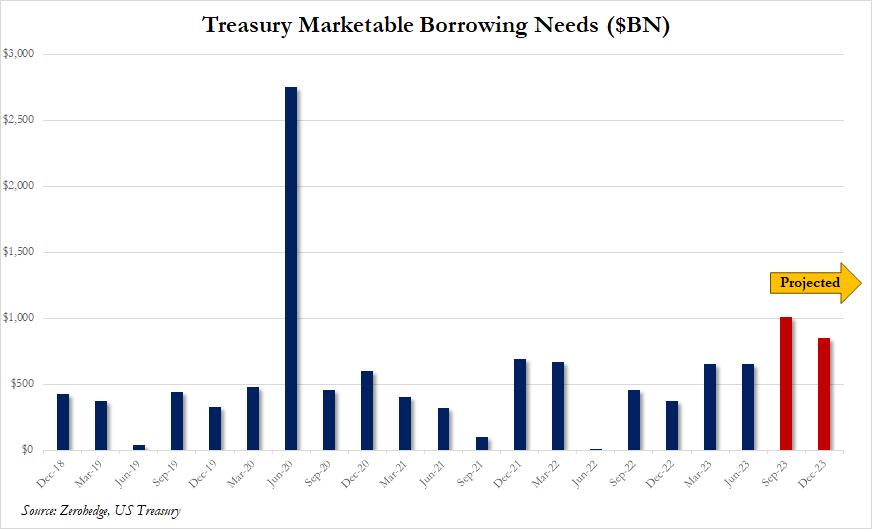
ZeroHedge reports, “Amid all the recent worries about demand for US paper, between the Fitch downgrade, the $1 trillion planned issuance in Q3, the doomsday language in last week’s TBAC refunding statement which warned of big increases in auction sizes in coming months and – of course – Ackman’s latest melodrama, some were worried that today’s 3Y auction would be a dud. It wasn’t, and in fact today’s 3Y auction was nothing short of spectacular.

The high yield of 4.398% was below last month’s 4.534% and also stopped through the When Issued 4.416% by 1.8bps, the second consecutive stop through auction and 5th of the last 6.”


USD futures are consolidating, testing the 50-day support.  The Cycles Model suggests the new Master Cycle may run until the end of August.  There are conflicting views on what happens next.  USD is setting up for a very large move higher.  However, it may have some downside work to finish before the move to higher ground.  I remain neutral at this time until further developments.


Posted in Published | 13 Comments

August 8, 2023

10:35 am

SPX continues to challenge Intermediate support at 4477.00.  It is in short gamma territory with a very large contingent of short contracts (4781 puts) at 4450.00.  Breaking through that level may produce a gamma-driven panic.  However, should there be an intervention beforehand, we may see a very quick spike to 4530.00 to relax the hold of the short gamma for today.

3:30 pm

The spike at the end of the day rose to the Max Pain level near 4500.00.  There are two implications:  First is that sentiment has taken a nosedive, evidenced by the weakness of the bounce.  Second, the next phase of the Cycle may have begun, dominated by negative gamma, especially beneath 4450.00.  This may be a clear signal to sell/short the market.

ZeroHedge observes, “and they are very long

Global CTA equity exposure pushing new highs…same goes for US CTA exposure.

Source: GS


Source: GS


CTA and the massive downside convexity

CTAs risk having to puke huge size in a big down scenario. This is the biggest projection on record in a big down scenario according to GS.


9:51 am

BKX finally broke down, declining toward the 50-day Moving Average at 84.12.  While it is currently on an aggressive sell signal generated by the Cycles Model, it may change to a confirmed sell beneath the 50-day.  The Cycles Model suggests the decline may last through the month of August.  What the Feds tried to obfuscate last Friday is coming to light.  The immediate downside target  may be 65.00-70.00.

ZeroHedge observes, “Higher funding costs, potential regulatory capital weaknesses and rising risks tied to commercial real estate loans amid weakening demand for office space were the triple whammy of factors that prompted Moody’s to lower credit ratings for 10 small and midsize US banks; and noted in a slew of notes that it may downgrade major lenders.

“Collectively, these three developments have lowered the credit profile of a number of US banks, though not all banks equally,” the ratings agency wrote in some of the assessments.”


8:00 am

Good Morning!

NDX futures declined in the overnight market to a low of 15270.80, challenging Intermediate support at 15312.29.  Should the decline continue beneath yesterday’s low, NDX may be in the midst of a panic decline.  However, the Cycles Model suggests another bounce above 15500.00 may be in order before the panic.  Be prepared for higher volatility accompanied by wider moves in both directions.

Today’s options expiration shows Maximum investor pain (Max Pain) at 15420.00.  Long gamma starts at 15520.00 while short gamma may begin at 15400.00.

ZeroHedge remarks, “Pain in a pic

HF VIP stocks vs the most shorted basket at extremely “painful” levels.

Source: GS


Bear steepening pain

More of the same. The US 2/30 year continues the latest explosive move….”


SPX futures declined to Intermediate support at 4475.00 in the overnight session and bounced.  This suggests another bounce to the Head & Shoulders neckline at 4530.00 by the end of the day.  Once the neckline is retested we may see the beginning of a panic decline that may test (and likely succeed), breaking through the 50-day Moving Average at 4403.96.

Today’s op-ex shows Max Pain at 4505.00.  Long gamma starts at 4540.00 while short gamma may begin at 4490.00.  Today may be a test of both long and short gamma as SPX prepares for the next big move.

ZeroHedge reports, “Global stocks slid, US equity futures slumped and bond yields tumbled as a raft of news on collapsing Chinese trade, Italian banks hit with an unexpected windfall tax, and a downgrade of US banks by Moodys (on increasing funding costs/CRE exposure) sparked a fresh round of fears about the financial system and global economy.  At 7:45am, S&P futures were down 0.7% trading as low as 4,502 while Nasdaq futures dropped 0.8% amid a broad flight to safety across markets which sent yields on the 10-year Treasury 10 basis points lower and the equivalent rates in Germany fell 15 basis points. The Bloomberg dollar index climbed 0.5% while oil resumed its slide following ugly oil import data by China. Today’s macro data includes Small Biz Optimism, Trade Balance, and Wholesales Sales/Inventories … nothing market-moving as we await Thursday’s CPI print.”


VIX futures rose to 17.31 this morning.  The daily swings in the VIX are becoming wider, in anticipation of a potential breakout and explosive move higher.  But first VIX may retest the 50-day Moving Average at 14.48 before the rocket launch.

Tomorrow’s op-ex shows Max Pain for options investors at 17.00.  Short gamma maxes out at 14.50 and may dictate today’s move.  Long gamma may begin at 19.00, but is sparsely populated.

ZeroHedge remarks, “We warned Friday, ahead of the payrolls print, that the data could be the catalyst that finally shakes the VIX from its mid-summer slumber.

And so it should not be a huge surprised that the VIX complex is increasingly acting the way we’ve anticipated – what Nomura’s Charlie McElligott calls “nervous and squeezy”.”


TNX dipped below 40.00 this morning as it declines toward critical support.  The Cycles Model suggests the correction may last until mid-September as money flows out of stocks and into bonds.  The most likely target may be the 50-day Moving Average.  However, the trendline at 38.00 may be challenged.  Heaven help those who stay too long…


USD futures rose above the 50-day Moving Average at 102.22 this morning.  The Master Cycle high may have been made on Thursday, on day 261.  However, there is the possibility of an extension to mid-Cycle resistance at 103.07.  The USD may be in a correction phase that allows it to revisit the trendline at 100.00 over the next three weeks.   An alternate view is that the USD may make a new low in the same period.  Both views may agree with lower bond rates over the same period of time.


Posted in Published | 14 Comments

August 7, 2023

11:41 am

The Ag Index is hovering just above the July 13 low.  Despite the deteriorating conditions overseas, the U.S. markets are still sanguine and likely affected by declining liquidity and slower consumer demand.  The Cycles Model suggests the decline may persist another 2-3 weeks.  There are several downside targets.  The first is the 61.8% retracement level at 387.76.  The second is the Wave (4) low at 380.54.  The third is the Cycle Bottom at 366.52.  Investors should consider accumulating agriculture-related shares over the next few weeks, as the reversal may be sharp and strong.

ZeroHedge observes, “Global food prices increased the most in 1.5 years as trade disruptions from the El Nino weather phenomenon battered agricultural-producing countries, and Russia’s exit from a crucial UN-backed agriculture deal stoked supply concerns.

The Food and Agriculture Organization of the United Nations (FAO) reported Friday that the global food index, which tracks monthly changes in the international prices of globally-traded food commodities, averaged 123.9 in July, up 1.3% from the previous month.”


11:28 am

BKX is hovering in a neutral Wave structure.  Should it rise above 90.00 it may probe to the mid-Cycle resistance and Head & Shoulders neckline at 92.38.  A decline beneath 86.37  may spark a panic decline.  While the Elliott Wave structure may be neutral, the Cycles indicate a decline may be more likely through the end of August.  There may be some skullduggery involved in keeping the  neutral structure.  Read below.

ZeroHedge comments, “Usage of The Fed’s emergency bailout facility rose to a new record high last week and money-market funds saw further inflows, all eyes are once again on bank deposits

Seasonally-adjusted, total deposits rose by a de minimus $3.3 billion last week (the 2nd straight week on SA inflows)…

Source: Bloomberg

However, and not at all surprisingly, non-seasonally-adjusted total deposits tumbled $30 billion last week (the 3rd straight week of NSA deposit outflows)…


8:10 am

Good Morning!

NDX futures rose to 15388.60, a 49% retracement of Friday’s decline.  NDX may have unfinished business to the downside.  If so, the most likely route may be a decline to or beneath the 50-day Moving Average at 14991.57.  Allow me to point out the Ending Diagonal formation that, when broken, may retrace the entire rally from the March low.  In addition, Intermediate support at 15302.76 has been broken, giving a confirmed sell signal.

Today’s options expiration shows Maximum investor pain (Max Pain) at 15270.00.  Long gamma begins at 15300.00 while short gamma starts at 15250.00.

ZeroHedge remarks, “Sharp rates moves triggered violent equity sell off, as short squeeze dynamics fade and selling pressure intensifies on long duration and credit sensitive assets.

Fading the chase: Bears are pressing shorts again. The short covering dynamics appear to have come to its natural end after two months of aggressive risk unwind. HF Net exposure has reset back to 5y median from 10th %ile in May, with Gross still at highs, speaking of the magnitude of bear capitulation. Equities entered the week with over 90% of SPX constituents trading above 50d moving average, the 2m return spread between HF VIP GSTHHVIP stocks and most shorted names GSXUMSAL at 5y highs, and our beta factor pair GSPUBETA rallied +25% since May (99th %ile) – all pointing at downside asymmetry. This week’s reversal was sharp, with CTA thresholds getting hit and forecasted $32bn for sale on a flat tape in the next week and gamma positioning adding pressures on down moves.


SPX futures rose to 4502.90, a 43% retracement of Friday’s decline.  The Wave structure is conductive to further decline.  Should the SPX fall beneath Intermediate support at 4472.25, it may upgrade the aggressive sell signal to a confirmed sell signal.  The Cycles Model suggests the decline may last to the end of August.

Today’s op-ex shows Max Pain at 4535.00.  Long gamma may begin at 4550 while short gamma may start as high as 4525.00 and intensify at 4500.00.   In other words, short gamma may be in control.

ZeroHedge reports, “A selloff in treasuries and global government bonds returned with a vengeance on Monday as the threat of further rate hikes unsettled traders. With 10Y TSY yields jumping as much as 9bps from 4.03% to 4.12% overnight, the yield on 30-year German bonds surged nine basis points to 2.72%, the highest since early 2014. However, unlike Friday when stocks tumbled as yields spiked to a fresh 2023 high, on Monday US equity futures rose modestly – at least for now – alongside yields in subdued, listless trading, signaling a rebound from Friday’s rout. At 7:45am ET, S&P futures higher by about 0.2% although European stocks were in the red, following softer-than-expected German June industrial production data, and Asia was mixed. The dollar was a little stronger against G10 currencies while oil and iron ore prices are lower, despite a Ukraine drone attack on a Russian oil tanker, the first of many.”


VIX futures consolidated in a narrow range over the weekend and may open flat today.  However, should it rise above the trendline, the Cup with Handle formation suggests a rally to 22.00 may follow.

Wednesday’s op-ex shows Max Pain at 16.00.   While short gamma stretches from 15.00 to 13.00, long gamma  hardly exists up to 37.00.  Hedging through the VIX appears to be very cheap.


TNX may be consolidating near the Cycle  Top at 40.71 this morning.   Should it decline decisively,  TNX may decline over the next few weeks to the 50-day Moving Average at 38.35.  Strength may come back later this week.

ZeroHedge observes, “Friday’s jobs data sparked a relief rally in bonds and a flatter yield curve, but the pain trade is still for higher yields and a steeper curve – the lesser-spotted bear steepener – with this week’s CPI a potential catalyst.

Last week was a turbulent one for bonds, but the continued softening in payrolls data served to remind the market that supply and fiscal-profligacy fears have to be counter-balanced with an economy that’s in its late-cycle stages.

After the data, 10-year yields took the elevator back down to sub-4.05% after briefly going above 4.20%. They have since clambered back to 4.12%, but their next cue is likely to come from Thursday’s CPI report. Headline is expected to nudge back up to 3.3% (from 3% last month), mainly due to base effects, and core is expected to hold steady at 4.8%.”


Posted in Published | 21 Comments

August 4, 2023

10:15 am

SPX bumped up against 4530.00 and pulled back, creating a potential Head & Shoulders formation.  Provided the neckline remains intact, we may see a decline to the target and probably lower.  The next support may be the 50-day Moving Average at 4386.95.

ZeroHedge observes, “In an unusually urgent note from Goldman Sachs’ Scott Rubner, the flows guru warns that “things are changing fast,” and advises clients to “fade the green.”

With yields tumbling, US equity markets are bouncing in early trading…

But Rubner warns that the market technical flow-of-funds have seen a significant deterioration heading into the worst two week liquid period of the year.”


8:155 am

Good Morning!

NDX futures rose to an overnight high of 15476.50 before easing back down to the flat line.  It remained beneath Intermediate resistance at 15582.23 and may resume its decline beneath the Ending Diagonal trendline and mid-Cycle support at 15304.67.  It is hovering pending the monthly Employment Situation Survey from the DOL due at 8:30 am.

Today’s op-ex shows Maximum investor pain at 15360.00.  Long gamma begins at 15400.00 while short gamma reigns beneath 15340.00.


SPX futures sank to an overnight low at 4494.70, then bounced to a morning high of 4526+.50.  It may retest the Cycle Top resistance at 4529.17.

Today’s op-ex shows Max Pain at 4520.00.  Long gamma may begin a 4525.00, but short gamma awaits beneath 4515.00.  A drop beneath 4500.00 may be the beginning of a precipitous decline.

ZeroHedge reports, “An earlier rally in US equity futures fizzled and Treasuries steadied after days of sharp losses as Apple sunk to session lows, while traders awaited employment data for clues on the path for Federal Reserve interest rates. As of 7:45am ET S&P futures were fractionally in the red at 4,520 erasing a earlier gain of 0.3% and set to extend their biggest weekly decline since March; meanwhile Nasdaq futures were still in the green, up 0.2% thanks to Amazon.com surging 9% in premarket trading after revenue at the world’s largest e-commerce and cloud services company beat estimates. Europe’s Stoxx 600 index turned lower while Asian stocks rose, trimming their weekly decline, on pockets of good news in China and shreds of optimism that the spike in bond yields won’t last. The Bloomberg dollar index rose 0.1% while 10Y TSY yields added one basis point to trade at 4.19%.”


VIX futures receded to 15.28 in the morning session.  Should it not decline beneath 15.02, it may rise to overcome the trendline at 18.00 in its next probe higher.  Today may be a day of trending strength, according to the Cycles Model.

Wednesday’s op-ex shows Max Pain at 16.00.  Short  gamma begins at 14.50 but fades beneath it.  Long gamma may start at 17.00, but without a lot of conviction beyond that.

ZeroHedge remarks, “Jumpy yields are prone to rising further if jobs data out later today is much better than expected, taking stocks lower and boosting higher a recently resurgent VIX.

This week has brought focus on US fiscal profligacy. Large and persistent fiscal deficits, the hallmark of the Treasury put, are inflationary.

Inflation expectations have been rising for some time now, and reflecting this term premium is beginning to rise, taking yields higher with it.”


TNX futures rose to a new high at 42.36 this morning, possibly capping the current Master Cycle on day 261.  Should TNX decline beneath the neckline at 40.95, a 2-3 week correction may be underway to retest the 50-day Moving Average at 38.30.  The rally in bonds may be triggered by a sell-off in stocks.


Posted in Published | 30 Comments

August 3, 2023

12:00 pm

The bounce came a little sooner than expected, suggesting investors are buying the dip.  Should SPX bounce to 4530.00 or higher, then SPX may rise to the trendline near 4580.00.  However, should the bounce fail to overlap Thursday’s decline, that may take the SPX down to test 4400.00 or  the 50-day Moving Average at 4381.49.


8:00 am

Good Morning!

NDX futures declined to 15249.60 this morning, crossing beneath Intermediate support at 15289.90.  NDX is now on a confirmed sell signal.  The next level of support and a potential bounce is the 50-day Moving Average at 14934.07.  The Cycles Model suggests a decline which may last to the end of August.

Today’s op-rx shows Maximum Pain for options investors at 15475.00.  Long gamma begins at 15500.00 while short gamma starts at 15420.00 and runs to 15000.00.

ZeroHedge remarks, “Two weeks ago, we were the first to point out something deeply concerning: while the Biden admin was poundings its chest, pointing to the surging S&P500 (not to mention seasonally-adjusted jobs and GDP numbers) which is just 5% from all time highs and at levels not seen in over a year, an index that was a proxy of hedge fund exposure (long the hedge fund VIP basket of companies and short the most popular shorts) had just suffered staggering losses after reaching a level that was identical to the pre-Covid crash.

Coming at a time when, contrary to what one would assume is pervasive euphoria as a result of the surge in the S&P, L/S managers “had experienced 9 consecutive days of negative alpha, the longest period since Jan 2017” and July was on course “to be the worst month in terms of alpha since May last year”…”


SPX futures made a morning low of 4488.10, above Intermediate support at 4468.92.  It remains on an aggressive sell signal, but soon may change to a confirmed sell signal beneath Intermediate support.  Beneath that lies the 50-day Moving Average at 4386.35 which is commonly looked upon as a market sell signal when breached.  This is a very difficult market for many to sell into, because it is so extended.  The Cycles Model does not indicate trending strength through the month of August.  However, monthly options expiration (August 18) shows increased hedging which may propel the decline faster and with more volatility than most would expect.

Today’s op-ex shows Max Pain at 4535.00.  Long gamma may begin at 4575.00 while short gamma starts at 4500.00.

ZeroHedge reports, “US equity futures are weaker for a second day amid a global stock sell-off sparked by a rout in US Treasuries which  accelerated overnight when the BOJ “unexpectedly” stepped in with unlimited bond buying for a second time this week after the benchmark 10-year note yield touched a fresh nine-year high of 0.65%, confusing markets about what it wants to do: keep a cap on yields or strengthen the collapsing yen. European stocks fell 0.6% and Asian markets suffered their worst two-day drop since February  as the S&P 500 was set to extend yesterday’s losses. As of 7:45am ET, S&P futures were down 0.3% while Nasdaq futures dropped 0.4% after several very disappointing earnings after the close yesterday. Tech gigacaps were mixed pre-mkt ahead of AAPL (-38bps) and AMZN (+34bps) earnings. ”


VIX futures climbed to a morning high of 17.42, breaking above the July 6 high as it may seek to overcome the trendline at 18.00.  VIX is on a confirmed sell signal as it probes higher.  The apex of this month’s moves may be near the monthly options expiration.

Wednesday’s op-ex sows Max Pain at 15.00.  There is a last remnant of short gamma at 14.50.  Long gamma starts at 19.00 and reaches to 40.00.  However, long gamma is not well populated.  That may soo change.

ZeroHedge observes, Stressed VIX futures

Regular readers of TME are familiar with the VIX 2/8 months futures spread. In times of “stress”, most investors go for the shorter term maturities in order to hedge “quickly”, leading to the spread between shorter and longer dated maturities spiking. We are seeing the VIX 2/8 months futures spread moving sharply higher today again…showing increased stress.

Source: Refinitiv

The bid for downside

The crowd continues to pay up for protection after moves kick in. If the sell off today is the start of something bigger is to be seen, but the SDEX index is spiking big today.”


TNX futures ventured to a morning high of 41.82, while the cash market remains just beneath it.  It has breached the neckline of the Head & Shoulders formation on day 260 of its Master Cycle.  The Model shows today as a possible day of strength with a possible pivot later today.  Should TNX turn down, it may revisit the trendline near 38.00.


USD futures have risen to 102.65, above the 50-day Moving Average at 102.29.  While many would consider this a buy signal, today is day 261 in the Master Cycle.  The Model shows a possible day of strength on Friday with a potential pivot, as well.  These items would negate any signal.


Posted in Published | 11 Comments

August 2, 2023

12:16 pm

BKX made its Master Cycle high Thursday, on day 258.  It may be in decline toward its 50-day Moving Average at 83.38, where it may bounce.  I had commented earlier on a possible probe higher, but the odds of that are dramatically diminished.  Investors may sell/short WTI or wait for the bounce to take action.


11:55 am

TNX may have reached its Master Cycle high today on day 259.  The cash market high is 41.26 (futures high is 41.29).  This is a confirmation of my trendline analysis, suggesting that 50.00 may be reached by mid-October.

ZeroHedge reports, “We gave a big picture preview of the debt flood (and fiscal crisis) that is coming to the US this past Monday when, looking at the latest Treasury debt estimates, we showed that the US predicted a near-record $1 trillion in debt sales in the current quarter (up from $$733BN forecast previously) and $852 billion in Oct-Dec quarter, numbers so staggering they are usually associated with economic crises

… but in this case a surge in debt issuance meant to sustain the illusion of the deficit-busting Bidenomics, which has managed to keep the US economy from imploding only thanks to massive new debt and deficit spending, or what BofA’s Michael Hartnett called “The Era Of Fiscal Excess”, something which Fitch finally realized last on Tuesday when it became only the second rating agency in history to downgrade the US AAA rating.”


10:17 am

GKX has broken its lower trendline, implying more decline is to come.  The Master Cycle has another three weeks to complete it.  The two possible targets are  the 61.8% retracement at 387.76 and the Intermediate Cycle Wave (4) low at 380.54.  While decreasing liquidity may be causing all asset classes to decline, the Ag Indes is the most likely to be the first to recover.  It may be time to start accumulating shares of Ag-related commodities and businesses, even while the decline is in progress.

ZeroHedge observes, “In February of last year, the International Journal of General Medicine published a study that was easy to miss, as no major media publication reported on “Total Meat Intake is Associated with Life Expectancy: A Cross-Sectional Data Analysis of 175 Contemporary Populations,” by Wenpeng You and his team of researchers.

For years we have heard that the secret to a long life is to cut back on meat consumption and increase our intake of carbs—advice that is enshrined in the USDA’s Dietary Guidelines for Americans. But that’s not what these researchers found.”

ZeroHedge further reports, “Wednesday has witnessed major airstrikes on Ukrainian ports and the war-ravaged country’s food export infrastructure, which comes in the wake of Russia refusing to renew the UN-brokered Black Sea grain initiative at the end of last month.

Drones hit several sites before sunrise and through the early morning hours on Wednesday, including a major attack on Ukraine’s Danube port, sending global grain prices higher. A large fire engulfed some 40,000 tonnes of grain at the Danube location, according to Ukraine government sources.”


8:15 am

Good Morning!

NDX futures declined down to 15497.30 this morning, breaking beneath its 4-month trendline near 15700.00 and now being supported by Intermediate support at 15276.08.  It remains on an aggressive sell signal with a confirmed sell signal Intermediate support.  Most analysts consider a decline beneath the 50-day Moving Average at 14899.81 as a sell signal.  The Cycles Model gives a higher confidence in an “earlier” signal.

Today’s op-ex shows Maximum Pain for options investors at 15760.00 with short gamma beginning at 15750.00.  long gamma is fading fast.  Sentiment has finally turned berish in the options market.

RealInvestmentAdvice observes, ““Bullish measures are getting really bullish.”

This is an interesting statement, given how “bearish” sentiment was in 2022. As I noted then:

“Investor sentiment has become so bearish that it’s bullish.

One of the hardest things to do is go “against” the prevailing bias regarding investing. Such is known as contrarian investing. One of the most famous contrarian investors is Howard Marks, who once stated:

Resisting – and thereby achieving success as a contrarian – isn’t easy. Things combine to make it difficult; including natural herd tendencies and the pain imposed by being out of step, particularly when momentum invariably makes pro-cyclical actions look correct for a while.”


SPX futures dov to a morning low of 4529.20, beneath the 2-month trendline, but still above the Cycle Top support at 4519.96.  Declining through the trendline puts SPX on an aggressive sell signal with further signal confidence beneath the Cycle Top.   A confirmed sell signal lies beneath Intermediate support at 4462.67.  The final Master Cycle high was on July 27 and day 266.

Today’s op-ex shows Max Pain at 4580.00 with long gamma beginning at 4600.00.  Short gamma may start at 4575.00 while shorts are well populated beneath that level.  Short gamma dominates beneath 4530.00.

ZeroHedge reports, “US futures slumped as part of a global risk-off tone (but were well off their lows, which were down as much as 1%), after the US was stripped of its AAA top-tier credit rating by Fitch (which joined S&P in doing so back in 2011), due to growing fiscal deficits and an “erosion of governance” even as Treasuries yields and the Dollar were steady. And in a complete coincidence, at the exact same time, Donald Trump was indicted for a record third time on federal charges over his efforts to overturn the 2020 presidential election, and has a court date set for Thursday.

As of 7:45am, emini S&P futures were down 0.5%, while Nasdaq 100 futures slid 0.8%, signaling a pullback later Wednesday for a market that has surged 44% in 2023. Broad losses in Europe dragged all industry groups in the benchmark regional index into the red. Asian and European stocks slumped, while the Treasury curve steepened with two-year TSY yields falling 4bps to 4.86%; the Bloomberg Dollar Spot Index was barely changed, up 0.1%.”


VIX futures vaulted to a morning high of 16.23 as it confirms its buy signal.  The next resistance is the long-term trendline where it will celebrate its 5-year anniversary this weekend.  Trendlines are ubiquitous.  Their presence often defines upper and lower boundaries for market movement.  A broken trendline may imply a change of trend or the presence of unusual activity, such as the recent liquidity injections by the Fed and the Bank of Japan.


TNX is challenging its Cycle Top resistance at 40.76 this morning.  That gives the 10-year yield a better-than-even chance of going higher, potentially breaking out above the July 3 high at 40.94.  Today is day 259 of the Master Cycle.  However, it is also a day of trending strength.  The outcry about the Fitch rating downgrade being “unfair” is growing, but may be silenced as the 10-year yield may exceed 5% in the next 2-3 months.

ZeroHedge remarks, “Treasury Secretary Yellen is pissed, calling the downgrade “arbitrary” and “outdated.”!

I strongly disagree with Fitch Ratings’ decision. The change by Fitch Ratings announced today is arbitrary and based on outdated data. Fitch’s quantitative ratings model declined markedly between 2018 and 2020 – and yet Fitch is announcing its change now, despite the progress that we see in many of the indicators that Fitch relies on for its decision. Many of these measures, including those related to governance, have shown improvement over the course of this Administration, with the passage of bipartisan legislation to address the debt limit, invest in infrastructure, and make other investments in America’s competitiveness.

Fitch’s decision does not change what Americans, investors, and people all around the world already know: that Treasury securities remain the world’s preeminent safe and liquid asset, and that the American economy is fundamentally strong.”


USD futures are up to 102.30, challenging the 50-day Moving Average at 102.29.  This suggests that USD may go higher, but today is day 260 in the Master Cycle, so we must assume the breakout may be on borrowed time.  Should the Master Cycle end today, USD may fall back to its trendline at 100.00 before advancing higher.  The alternate view is that the Master Cycle may have made its low on July 18.


Crude Oil futures are pulling away from their Master Cycle high on day 266 as it begins the last decline of its correction from its low over 3 years ago.  There are two possible targets given in the weekly chart.  The first is the Cycle Bottom at 56.48, while the second is the 61.8% Fibonacci retracement at 53.82.  Take your pick.  The final decline may last until mid-October.  Oil investors may not be happy campers during the coming liquidity crisis.  And to think that hedge funds have liquidated their short holdings in July…

ZeroHedge remarks, “Benchmark crude oil prices have risen to the highest level for three months after the extension of production cuts by Saudi Arabia and its allies in OPEC+ sparked a rush to cover bearish short positions by investors.

Hedge funds and other money managers purchased the equivalent of 52 million barrels in the six most important petroleum futures and options contracts over the seven days ending on July 25.”

ZeroHedge updates, “Oil prices jumped overnight (near YTD highs) after API reported a massive (record) crude inventory drawdown, but have tumbled this morning as the dollar rallies and bonds & stocks are dumped.

“The OPEC+ Joint Ministerial Monitoring Committee will meet online on Friday, providing Saudi Arabia an excellent opportunity to roll its voluntary 1 million bpd production cut announced on June 3 for July production for another month to September. It would be the second time the Saudis have extended the voluntary 1 million bpd production cut. There is speculation that another 1 million roll forward could slow the global war on inflation, and kill the “golden goose,” especially heading into the end of summer driving season, and the beginning of shoulder season,” Robert Yawger, executive director of energy futures at Mizuho Securities USA, wrote in a Monday note.”


Posted in Published | 6 Comments

August 1, 2023

8:00 am

Good Morning!

NDX futures declined to 15670.40.  It is on an early aggressive sell with key support at 15500.00.  NDX is extremely extended with common recognition of support at the 50-day Moving Average at 14855.73.  While the NDX has not exceeded its July 19 high, the majority of investors are very bullish.

Today’s op-ex shows Maximum Pain for options investors at 15700.00.  Long gamma begins at 15720.00 while short gamma may start at 15650.00.  The  bullish impulse is weakening.

ZeroHedge remarks, “King of flows says

Scott Rubner, the guru of flows, says we are there…He writes: “I am so bullish, that I am actually bearish now for August. I am looking for a small-ish equity market correction in August. My core behavioral view is that I no longer speak to any “macro” bears. Positioning and sentiment is no longer Pessimistic, it is Euphoric.” His key chart is the one showing “… stocks beating consensus expectations underperformed by a greater amount than almost any time (i.e removing Covid) during the past 18 years.””


SPX futures declined to 4574.10 this morning.  It is caught between the 1987 trendline (see yesterday’s post) and lesser trendline support at 4550.00.  While it made a key reversal last Thursday, there has been no follow-through since then, either up or down.   An aggressive sell signal awaits beneath 4550.00 with Cycle Top support at 4512.93 and Intermediate support at 4465.68 adding further confirmation as they are broken.  The commonly held support and sell signal lies at the 50-day Moving Average at 4370.56.

Today’s op-ex shows the strike at 4575.00 to be hotly contested and the Max Pain strike.  Long gamma begins at 4600.00 while short gamma starts at 4550.00.

ZeroHedge reports, “S&P futures are are weaker to start the new month with bond yields flat and Bloomberg Dollar Spot Index climbed to session highs, dragging down all Group-of-10 currencies, as the rally that sent the S&P 500 to a 16-month high in July lost momentum after a flurry of companies reported disappointing earnings. Commodities are mixed as China’s Caixin PMI-Mfg prints 49.2, down from 50.5 and missing the est. 50.1.

As of 7:40am, S&P futures traded down 0.3% to 4,600 as the bizarre last minute spike in the S&P yesterday melted away, while Nasdaq 100 futures traded down 0.4%. Europe’s Estoxx 50 drops almost 1% with Asian stocks also lower. The US Dollar was boosted by weak Chinese data as well as the surprise RBA decision to leave rates unchanged. Treasury yields were little changed, while UK and Europe bond markets are similarly listless. Gold and oil fell, while Bitcoin slid nearly 1% and headed for a third straight day of losses. WTI futures fall less than 0.5%. A quick look at seasonals: August/Sept are typically the weakest 2 months of the year, so we may see increasing calls for a pullback, before resuming the squeeze higher. Keep an eye on oil, bond yields, and vol as we await macro data, Jackson Hole, and the Sept Fed meeting. Today’s macro data focus includes ISM-Mfg, JOLTS, Construction Spending, and Regional Fed data.


VIX futures traded u to 14.19 this morning as it may retest the 50-day Moving Average at 14.68.  VIX is in an accumulation phase, having made its Master Cycle low on June 22 and retesting it last Wednesday.

Tomorrow’s op-ex shows Maximum investor pain at 14.50.  There is no short gamma, while long gamma starts at 15.00 and remains strong to 34.00.

ZeroHedge observes, “The early-month exuberance in the S&P 500 has faltered into a sideways market for the last week or so (albeit with the BoJ-rumor-driven plunge mixed in)….

Still, the de-grossing regime-shift that we highlighted 10 days ago has continued as Goldman’s Prime Desk notes that, from a trading activity standpoint based on Prime data, July is tracking to be one of the largest active de-grossing months for hedge funds in recent years (92nd percentile on a 10-year lookback), driven by short covers and to a lesser extent long sales (~3 to 1). The overall Prime book has seen de-grossing activity in 12 of the past 14 sessions.


TNX  rose this morning, exceeding last Thursday’s high at 40.22.  The likelihood of the yield exceeding the July 7 high is strong in the next two days.  A pullback may follow  to retest the 50-day Moving Average at 38.01.  Using the trendline as a guide, TNX may exceed 5% by the end of October.  It may happen sooner…

ZeroHedge remarks, “After nearly reaching $0 during the latest season of the debt ceiling tragicomedy, which saw Republicans fold – as they always do – like cheap lawn chairs, assuring that the US is now on a path to fiscal self destruction…

… and $1 trillion in annual interest payments

… all to fund the exploding US budget deficit (the federal deficit hit $1.39 trillion for the first nine months of the current fiscal year, up some 170% from the same period the year before, showcasing the Treasury’s exploding funding needs to keep the illusion of Bidenomics alive, discussed here “Here Is The $1 Trillion “Stealth Stimulus” Behind Bidenomics“)…”


USD futures have risen above Intermediate-term resistance at 101.61 and may be testing the 50-day Moving Average at 102.30.  Today is day 259 of the Master Cycle, suggesting a pullback may be imminent.  While today’s action may trigger a buy signal, one may wish to buy on the pullback.


Posted in Published | 11 Comments

July 31, 2023

1020 am

I have had some questions from readers about the “Long View” in the SPX.   I actually became aware of this trendline in 1987, as the SPX found support on it at the October 22 low.  That gave me confidence to trust the rally as it rose to the 2000 high.  This final rally has surprised me, as I had judged that the August retracement had met the retest requirement that trendlines often have (observe the BKX, below).   However, this trendline is persistent, approaching 50 years.


9:34 am

The Master Cycle may have completed last Thursday at 90.54 on day 258.  However, the reluctance to decline and certain irregularities in the structure imply there may yet be another probe higher.  The Cycles Model often has Wave (2) terminate at the mid-Cycle resistance at 92.80.  Doing so may clear up all of the irregularities.


7:45 am

Good Morning!

NDX futures rose to 15800.80 over the weekend, but receded back to flat this morning.  The Master Cycle high remains on July 19.  However, today is day 258 of the Master Cycle and there is a high probability of a probe to 16000.00 as the structure may not be complete.  In addition, there is considerable pressure to end the second quarter on a high note.

Today’s op-ex shows long gamma from 15650.00 with pockets of strength up to 16000.00.

ZeroHedge remarks, “Investors have now gone “all in” on the soft landing narrative, just like they did in 1989, 2000 and 2007.”


SPX futures have risen to a weekend high of 4592.40 as it approaches the 1987 trendline for a retest.  The trendline may have begun as early as 1974.  My records show that the trendline held the August 1981 low, so the “1987” label may be a misnomer, although it defined the 1987 low.

There are very few analysts who take the long view.  The trendline held support until the decline in 2008, when it became overhead resistance.  SPX then remained beneath the trendline until January 2021 when it emerged above the trendline again until May 2022.  The trendline stopped the summer rally in August 2022.  This test of the trendline may be the final one.  today is day 258 of the Master Cycle.  The end may be hours away.

Today’s op-ex shows Max Pain at 4570.00.  Long gamma begins at 4600.00, but thins out quickly above it.  Short gamma may lie at 4565.00 and is well populated beneath it.

ZeroHedge reports, “Global stocks markets struggled for direction and US equity futures were flat in Monday’s quiet session following a rally Friday that pushed the Nasdaq 100 nearly 2% higher amid optimism that a soft landing for the world’s biggest economy is within reach. Sentiment was shaken by early weakness in Treasuries – which briefly pushed the 10Y yield to 4.0% after the BOJ was forced to intervene unexpectedly in the bond market one day after “tweaking” its YCC – continued strength in the USD (which sent the yen tumbling contrary to what virtually all so-called experts predicted), and a rally in commodities, and especially oil (and gasoline) which has soared in recent days.

As of 7:30am, US equity futures were 0.1% higher at 4,612 while Nasdaq futures were largely unchanged. Treasury yields edged higher, mirroring moves in UK and European bond markets. Gold drifted lower, while Brent climbed over $85 and to a level where markets will soon realize that headline inflation is about to storm right back; Bitcoin rose 0.3%. Apple and Amazon.com are among companies reporting earnings in the coming days.


VIX futures rose to 13.98 before pulling back a bit to a low of 13.77.  VIX is in its “accumulation” stage and may be poised to launch above the 50-day Moving Average and its 5-year trendline.

Wednesday’s op-ex shows Max Pain at 14.00.  Short gamma is in short supply.  Long gamma may begin at 15.00 and stretches to 34.00.


TNX futures rallied to 40.06 this weekend, but has pulled back with the cash market high of 39.67.  There is a substantial risk that TNX may break out above the early July high, but may not last more than a few days, as today is day 257 in the Master Cycle.

ZeroHedge remarks, “Yield curves around the world over the last month have shown early signs of steepening. But it’s a re-steepening in real yield-curves that investors should be alert for, as this would be a negative signal for liquidity and thus risk assets.

Never underestimate the BOJ’s propensity to surprise. After giving the impression policy would be unaltered, at its meeting last week the BOJ shifted their ceiling for 10y rates from 0.5% to 1%, and introduced greater flexibility in its yield-curve control policy. 10y yields broke through 50 bps, and currently trade at just over 60 bps (with the BOJ buying bonds this morning), while USDJPY whipsawed around and closed higher on the day by 1.2%.”


USD futures have pulled back from Friday’s high, which may have ended the Master Cycle on day 255.  There may be a few more days to test this observation.  Once the Master Cycle has been finished, the USD may find support at 100.00 before moving higher.  The alternate view is that the July 19 low may be the terminus.  A second alternate view may show a retest of the Cycle Bottom at 98.87 sometime this week.  The structure appears to be irregular and may need amending.


Posted in Published | 13 Comments

July 28, 2023

7:50 am

Good Morning!

NDX futures bounced from its 3-month trendline at 15425.00 to make a partial retracement to 15617.50, beneath the Cycle Top resistance at 15648.95.  It remains on an aggressive sell signal.   The Master Cycle high remains on July 19.  The Cycles Model suggests the decline may last through the end of August.

In today’s op-ex, Maximum Pain for options investors is at 15480.00.  Long gamma remains strong above 15500.00, while sort gamma begins at 15400.00 and strengthens at 15350.00.

ZeroHedge observes, “Optimism, not complacency

We are seeing a turn in psychology, but this is not complacency according to BofA. Their Global Equity Risk-Love indicator has surged from near-panic levels in March to the 78th percentile currently. They write that “everything” is optimistic but positioning. Such sentiment uplift, especially after a long stint in the panic zone, often suggests a shift in investor psychology, rather than complacency…You decide what to call it.

Source: BofA

Lot of “optimism”…

…or is this exuberant enough?


SPX futures rose to a morning high of 4565.60, just beneath its 2-month trendline at 4570.00.    The next lower support is the Cycle Top at 4495.58 where the aggressive sell is reinforced.  An aggressive sell is generated by a reversal/loss of supports within the current uptrend.  A widely used sell signal is usually generated after a decline beneath the 50-day Moving Average at 4353.00.

Today’s op-ex shows Max Pain at 4560.00.  Long gamma may start at 4570.00 while short gamma erupts at 4555.00.  Any slip may result in the SPX being dominated by short gamma.

ZeroHedge reports, “US equity futures reversed an earlier loss and traded at session highs even as bonds around the world fell, briefly sending the 10Y Treasury to 4.04% and JGBs to 0.57%, well above the previous 0.5% cap and the highest since 2014, after the Bank of Japan – the only major central bank not to have begun reversing ultra-easy monetary policy – surprised investors by tweaking its control of market rates, in a market test to how far it can go without explicitly starting normalization. But in the end, the tweak ended up being less hawkish than some feared and as a result, futures are now reversing much of yesterday’s sharpo losses.

Having previously capped bond yields at 0.5% in a bid to stoke borrowing and its economy, the central bank said today it now regarded that level as a reference point rather than a rigid limit, and instead of intervening to keep rates capped at 0.5% it would only do so firmly at 1.0%, while deciding whether and where to intervene in the 0.5% to 1.0% band (the BOJ graphic explaining the change is below).”


VIX futures regressed to 13.71 this morning, near its 30-day average.  Yesterday’s action broke above the 50-day Moving Average at 14.84, triggering a buy signal.  This morning’s pullback gives an opportunity to hedge one’s portfolio.  The Cycles Model suggests that the current Master Cycle may reach a crescendo during options expiration in August.


TNX has pulled back under 40.00 this morning, but may resume its rally for a few more days.  The risk is that TNX may stage another breakout above the July 7 high.  Doing so would solidify the uptrend for months to come.  The Cycles Model suggests the uptrend may persist at least until mid-September.  The view that the Fed is “effectively done hiking” is erroneous and soon to be challenged.

Yesterday ZeroHedge reported, “Moments ago, the Treasury conducted the week’s final coupon auction when it sold $35BN in 7 Year paper in what was another mediocre auction following this week’s just as medicore sales of 3Y and 5Y paper.

The auction stopped at a high yield of 4.087% which was the highest yield in the history of the 7Y auction; it also tailed the When Issued 4.074% by 1.3bps, the 7th tail in the past 10 auctions.

The bid to cover of 2.479 was below last month’s 2.653 and also below the six-auction average of 2.542, if smack in the middle of the long-term range over the past decade which has been between 2.25 and 2.75. ”


USD futures pulled back to 101.10 this morning after yesterday’s spike higher.  The pullback may persist through the end of the day.  However, the uptrend may resume (with strength) next week.


Posted in Published | 2 Comments

July 27, 2023

2:28 pm

SPX finally gave an aggressive sell signal, falling beneath the two-month trendline at 4565.00-4570.00.  Today is day 266 of the Master Cycle, so the chances of new highs has declined.  SPX is still finding its new direction, so be prepared for volatility as it bounces between supports.  Most traders will wait for a decline beneath the 50-day Moving Average at 4353.00 for a sell signal.  The BOJ may not be as supportive of the rally now.

Good luck and good trading!

ZeroHedge remarks, “As we observed earlier this week, the yen has seen a surge in volatility and been on a rollercoaster ride in recent weeks following a rise in speculation that – as a result of spiking transitory inflation – the BOJ may tweak its Yield Curve Control beyond the current +/- 0.50bps band on the 10Y (everyone still remembers the catastrophic consequences of the last such “tweak” when the BOJ had to spend hundreds of billions in US dollars to avoid a collapse in the JGB market).”


8:15 am

Good Morning!

SPX futures rose to 4599.20 thus far this morning.  Failure to break through trendline support left the SPX the capability to go toward 4650.00.  Yesterday I had warned that trending strength may return before the reversal.  The result appears to be a blow-out top.  Today is day 266 of the Master Cycle.  The next potential pivot day occurs over the weekend, but may occur sooner.

Today’s op-ex shows Maximum Pain for options investors at 4555.00.  Options are tightly packed, with short gamma beginning at 4550.00 and long gamma starting at 4560.00.

ZeroHedge reports, “US futures and global stocks soared, and the dollar slumped as investors wagered that the Fed has reached the end of its 16-month long policy-tightening cycle. A barrage of earnings beats (sorry Mike Wilson) from high-profile companies added to the bullish momentum, propelling the Stoxx Europe 600 index 1% higher to a two-month high, while US futures pointed to a strong Wall Street session after Fed Chair Powell failed to dent market optimism during his press conference. At 7:30am Nasdaq 100 futures were up 1.3%, led by an 9% premarket surge in Facebook parent Meta Platforms which reported blowout guidance for Q3; S&P futures rose 0.6% to a fresh 2023 high at 4,623. Treasury yields dropped on the short end, while the dollar pushed lower. Oil and gold prices are up. Iron ore, meanwhile, is trading lower. Today, we will receive a slew of growth and inflation data. As Fed staff now dropped US recession forecast, today’s growth data will be important to assess the soft-landing scenario. Keep an eye on banks stocks as Fed will hold meeting at 1pm ET today to implement Basel 3 endgame agreement.”


VIX futures have fallen to 12.74, just above the June 22 low of 12.73.  The Cycles Model does not register today as a lower low, while the Elliott Wave structure may allow it (shown in the chart).  We may know the final result by the end of the day.


TNX remains above Intermediate support at 38.26 on day 253 of its Master Cycle.  The anticipated master Cycle low may have been made on July 20.  But, being early, is taken with a grin of salt.  The Master Cycle may allow another retest of underlying supports by early next week.


USD futures may have tested the trendline near 100.00 and bounced, rising to a morning high of 101.07.  The Cycles MOdel suggests the uptrend may continue through the end of August.


Posted in Published | Comments Off on July 27, 2023