July 12, 2023

8:00 am

Good Morning!

NDX futures have risen to 15176.40 this morning, riding above the Cycle Top support at 15078.82.  The Cycle Top is 2 standard deviations from the mid-Cycle support at 12560.06.  After two months above the Cycle Top, a reversion to the mean may also suggest a decline well below the mid-Cycle value.  The Cycles Model suggests the current Cycle interval may last until monthly options expiration on July 21.  Thus far it is directionless.

Today’s op-ex shows 15120.00 being hotly contested.  Long gamma starts at 15150.00.   Short gamma begins at 15000.00.

RealInvestmentAdvice comments, “Does stock risk decline the longer the holding period is? It’s a great question and something I received a comment about.

Blaise Pascal, a brilliant 17th-century mathematician, famously argued that if God exists, belief would lead to infinite joy in heaven, while disbelief would lead to infinite damnation in hell. But, if God doesn’t exist, belief would have a finite cost, and disbelief would only have, at best a finite benefit.

Pascal concluded that given that we can never prove whether or not God exists, it’s probably wiser to assume he exists because infinite damnation is much worse than a finite cost.

When it comes to investing, Pascal’s argument applies as well. ”


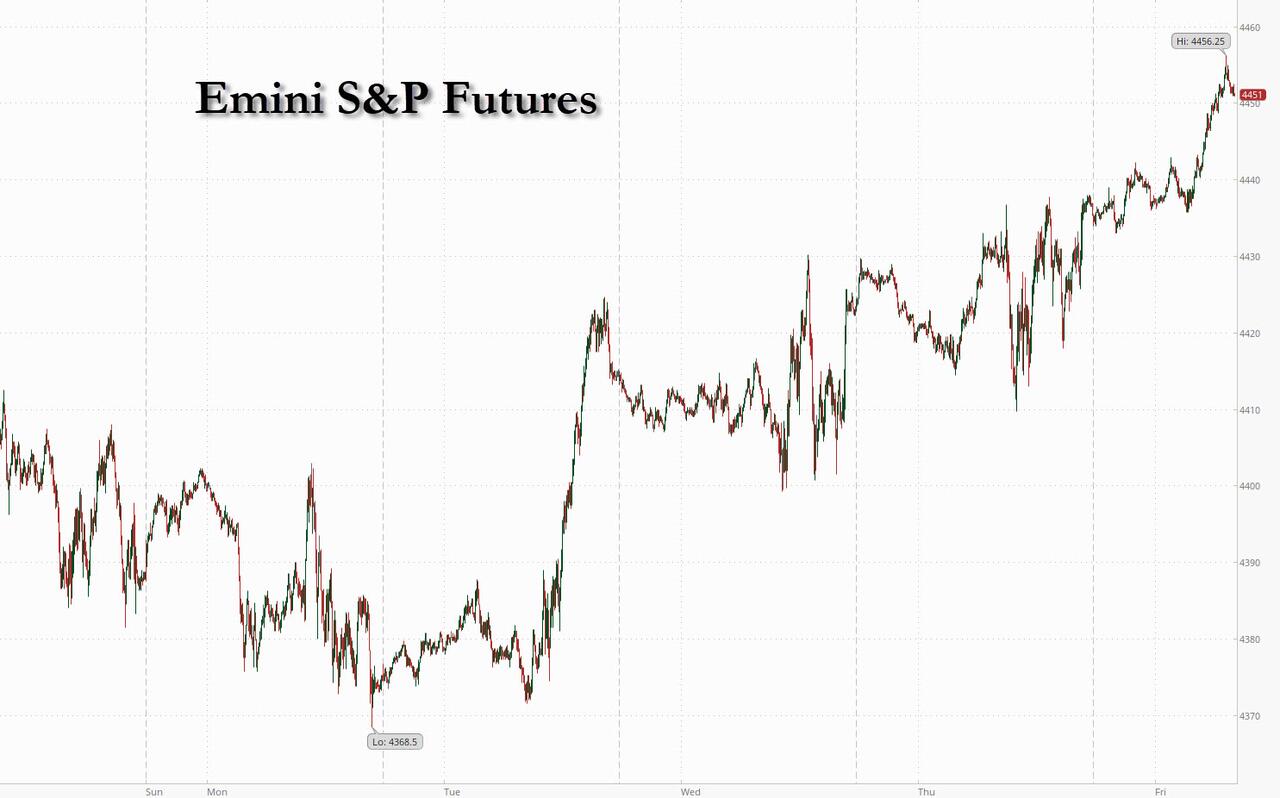
SPX futures rose to 4452.00, testing the June 30 high at 4458.48.  However, the CPI is due at 8:30 and may either boost SPX to a higher peak or take the steam out of the rally.  The Cycles Model suggests the current Cyclical interval may last until monthly options expiration.

8:35 am

SPX futures have reached a new high at 4475.40.  The CPI was up .2% for the month of June.

Today’s op-ex shows Max Pain at 4415.00.  Long gamma starts at 4425.00 while short gamma begins at 4400.00.

ZeroHedge reports, “US equity futures are trading near session highs boosted by a global risk-on mood ahead of a US CPI report for the month of June which JPM said is “more likely to print dovish than hawkish” and is expected to show annual US headline inflation falling almost 1% to 3.1% Y/Y while core CPI is seen dipping less, to 5.0% YoY, which according to the market will erode the case for more rate hikes. Dovish sentiment pushed the dollar lower for a 4th straight day, sending the Bloomberg dollar index to the lowest since April, while also depressing Treasury yields.

As of 7:30am, following Monday’s solid gains, S&P futures traded higher 0.3% to 4,485 led by small-caps as bond yields and the USD move lower. Nasdaq 100 futures also rose 0.3%. Commodities are higher while gold, oil, and iron ore prices all higher amid increasing calls for fiscal stimulus from China; ags are also higher driven by next week’s expiration of the Black Sea Grain Initiative.”


ZeroHedge reports, “Expectations for this morning’s headline CPI print were for a plunge from 4.0% YoY to 3.1% YoY (due to shelter, used-cars, and seasonals); however, what The Fed will be watching for is Core Services CPI Ex-Shelter, which fell to +3.93% YoY – the lowest since Jan 2022…
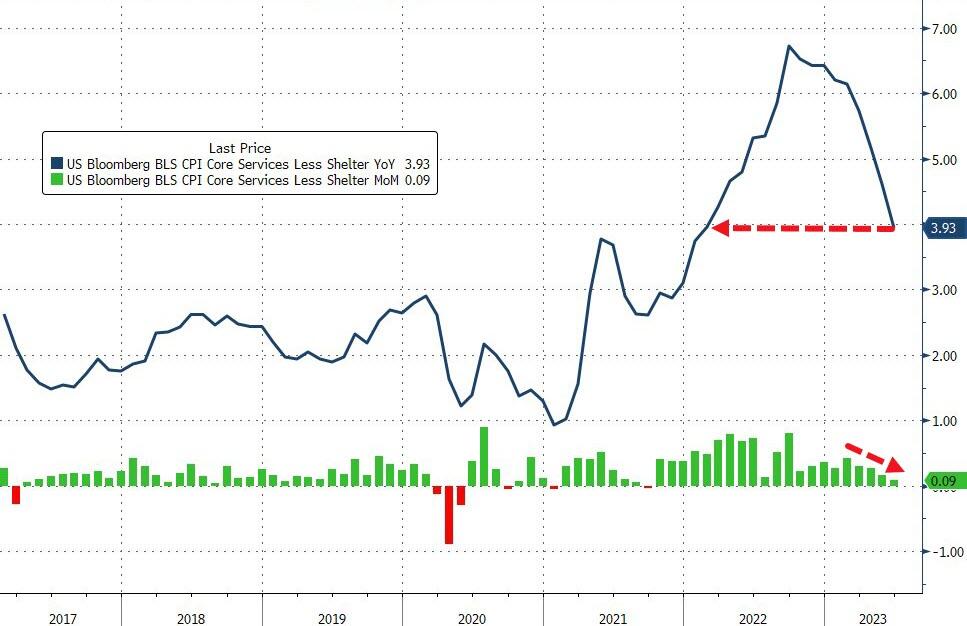
Source: Bloomberg

The headline CPI rose just 0.2% MoM (below the 0.3% MoM expected) which dragged the headline down to +3.0% YoY (cooler than expected) – the lowest since March 2021..”


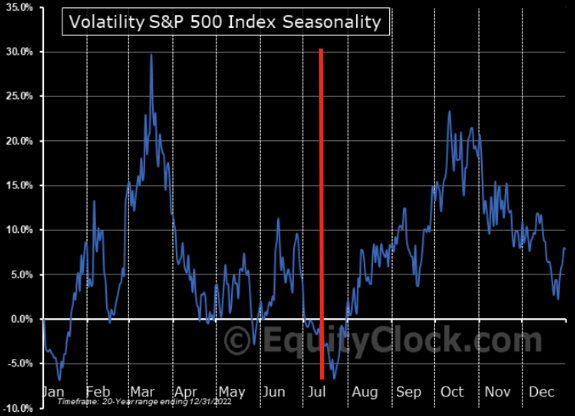
VIX futures plunged to 14.03 this morning on the CPI report.

Today’s op-ex shows Max Pain at 13.50.  There is no short gamma.  Long gamma begins at 16.00.  Next week’s monthly op-ex shows Max Pain rising to 17.00.  Short gamma makes a comeback beneath 16..00 while long gamma takes a strong position at 20.00 to 35.00.


TNX futures declined to 38.85 this morning.  The correction in TNX may last to the end of the month.

ZeroHedge reports, “If there were some concerns that the week’s first coupon auction would be a disappointment due to today’s risk-on sentiment and lack of concessions into the 1pm auction block, they were promptly blown away moments ago when the Treasury announced results from today’s sale of $40BN in three year paper, which were nothing short of stellar.

Stopping at a high yield of 4.534%, this was more than 30bps higher than last month’s 4.202% and not far below the current cycle high of 4.641% reached in March (just before yields collapsed following the March banking crisis). The auction also stopped through the When Issued 4.536% by 0.2bps, the 4th stop through in the past five auctions (last month the auction tailed by 0.2bps).

The Bid to Cover jumped to 2.882 from 2.696, and was also above the 6-auction average of 2.686.”


Posted in Published | 1 Comment

July 11, 2023

10:35 am

The Ag Index is testing its lower trendline prior to a final plunge to its 61.8% retracement low at 387.76 or, its Wave (4) technical support at 380.54.  The Cycles Model suggests this may take place in the next week or so.  While this has been a steep decline, it has been a seasonal feature for this time of year for the past three years, due to the start of the harvest season.  The lower prices at the field have not trickled down to the consumer.

ZeroHedge reports, “Despite the Biden administration’s cheerleading that ‘Bidenomics’ is the economic savior of the middle class — most Americans will disagree there has been an economic revival amid the worst inflation storm in a generation that has sent negative real wage growth negative for more than two years, forcing consumers to deplete personal savings and rack up record amounts of credit card debt in a high-interest rate environment.

We have shown many households are in rough financial shape. Dollar Tree executives confirmed weeks ago that mid/low-tier consumers are trading down from other more expensive retailers to their stores for groceries. This means Walmart has become too expensive for some consumers. ”


10:15 am

BKX is attempting to make a new retracement high and extend the Master Cycle above the July 3 high at 82.12.  It must do so immediately in order to succeed, as today is day 271 in the (former) Master cycle.  The probability is slim, but must be allowed under these circumstances.  Once BKX declines back down beneath Intermediate-term support at 79.92, then all bets for an extended rally are off.

ZeroHedge comments, “Last month, when both revolving credit (i.e., credit card debt) and interest charged on credit cards hit a record high, we said that this trajectory was unsustainable and it was only a matter of time before the debt-funded US consumer hit a brick wall. One month later, the brick wall is finally here, because according to the Fed’s just released consumer credit reportin May US consumer credit grew by a paltry $7.24BN, down more than 50% from the downward revised $20.3BN in April

…. and a huge miss to the consensus forecast of $20 billion. In fact, this was the 4th miss in the past 6 months.”

ZeroHedge now states, “After a ‘holistic review’ of capital for large banks “to enhance their resilience and ability to serve communities, households, and businesses,” Fed Vice-Chair of Supervision, Michael Barr said in a report this morning that he’s leading a multi-year effort to increase capital requirements for banks.

Barr managed expectations by explaining that the focus of the review was on building resilience rather than attempting to address every conceivable risk, as the financial system is complex and constantly evolving.

“The proposed rules would end the practice of relying on banks’ own individual estimates of their own risk and instead use a more transparent and consistent approach,” he said.”


8:00 am

Good Morning!

NDX futures are backing away from an overnight high at 15095.00 this morning.  It is challenging its Cycle Top resistance at 15040.00.  Should it go higher, the next probable resistance is at 15210.00.  The next period of strength hovers around monthly options expiration on July 21.  The current Master Cycle also ends there and it isn’t giving any indication of direction.  Today’s action may give resolution to that issue.

Today’s op-ex shows 15050.00 (Max Pain for investors) hotly contested.  Long gamma begins at 15075.00 while short gamma at 15000.00.  The monthly op-ex shows Max Pain drifting down to 15000.00 with massive call interest at 15100.00 and above.  There is currently little short interest on that expiration.

ZeroHedge observes, “In a day when the S&P rose and non-profitable (small cap) tech companies soared yet megacap tech companies sank (partially answering the question we posed last week)…

… Goldman trader Mike Washington writes that there was a lot of client focus on the Nasdaq 100 special rebalance which was announced late last week on the back the “magnificent seven” dominance, and which plans to address overconcentration in the index by redistributing the weights (no adds/deletes) on Friday (7/21) after the close, effective prior to open Monday, July 24th.”


SPX futures are trading in a range from 4404.00 to 4421.00.  The Cycle Top is at 4407.00 with an aggressive sell signal beneath it.  The next FOMC meeting is on July 25-26, shortly after the monthly op-ex on July 21.  There is a high probability of a flat market until the op-ex as SPX hovers near its Cycle Top.

Today’s op-ex shows Max Pain for investors near 4400.00.  Long gamma starts at 4425.00 while short gamma may begin at 4370.00.

ZeroHedge reports, “For the second day in a row, S&P futures are largely unchanged following a muted overnight session, reversing an earlier loss around the start of the European session and trading around session highs. In a reversal of yesterday’s tech/small cap drubbing sparked by fears about the upcoming Nasdaq special rebalance (see here). As of 7:30am, S&P futures were up 0.2%, trading at 4,450, and building on Monday’s modest gains with sentiment boosted after China signaled that more economic aid measures will come to support its ailing property market along with measures to boost business confidence; Nasdaq futures were also in the green as tech stocks see a lift while bond yields fall ahead of growing expectation that tomorrow’s CPI will surprise dovishly (in large part on the back of yesterday’s Manheim used car index collapse).”


VIX futures drifter lower, to 14.87 this morning.  Support may be found at Friday’s low of 14.33.  Unlike the SPX, which anticipates an ending Master Cycle on or around July 21, the VIX is merely showing a period of strength.  One may infer a possible new low in the SPX, while the VIX forges higher.

Wednesday’s op-ex shows a grey area between 14.00-15.00, possible the Max Pain area.  Short gamma is practically non-existent, while long gamma may occupy the area from 16.00 to 33.00.  On the other hand, the Monthly op-ex on July 19 shows Max Pain at 17.00 with massive short gamma below that level and massive long gamma above that level to 35.00.  It promises to be a volatile op-ex week.


TNX has dropped beneath 40.00 as it retraces the previous Cycle high.  The breakout is real, but typically a three-week retracement/consolidation follows.  The Cycles Model suggests TNX may go lower until the first week of August.  Presently, the trendline or possibly the 50-day Moving Average at 36.96 may be the target for the pullback.  However, it would not be beyond the range of possibility tha the Cycle Bottom at 32.56 may be the ultimate target.

ZeroHedge remarks, “Fixed-income traders may be considerably underestimating how long price pressures will persist in the developed economies.

The breakeven curve in the US has gone from being inverted six months ago to pretty flat now. The change in the slope of the line isn’t as much a surprise as is the level of the points on the curvature: to the extent a central bank tightens policy and restores market confidence that it is acting decisively on inflation, the curve would “normalize”.

ZeroHedge explains, “It is rare to have an indicator that works every single time; this is one of those rare instances.

That is the warning from Bank of America’s HY Credit team as rates surged back into play in a big way last week.

Specifically, the 10yr UST back over 4% for the first time since Feb; the 2yr touched on 5.12% – the highest level since June 2007. In the UK, the 10yr has breached 4.64% level – the peak achieved during the LDI crisis last Oct.

The rate risk is back as the front and center driver of volatility in credit… and as goes credit, so goes the rest of the market.

BofA’s core view here remains that the full extent of damage from tight monetary policy is unknown until the peak in policy tightening is behind us.

We are clearly not at that point yet.”


Posted in Published | Comments Off on July 11, 2023

July 10, 2023

9:00 am

Good Morning!

SPX futures are flat this morning, trading beneath its Cycle Top resistance at 4404.2.  It remains on an aggressive sell signal on day 270 of the Master Cycle.  The high at 4458.48 was made on June 30, day 260 and is likely to be recorded as such.  The next Master Cycle is due in a bout 10 days.  The next level of support is at the Intermediate-term at 4310.00, while the final support is the 50-day Moving Average at 4245.21.  Beneath that is a confirmed sell signal.

Today’s op-ex shows Maximum Pain at 4410.00.  Long gamma may start at 4425.00 while short gamma may start at 4375.00.

ZeroHedge reports, “After Friday’s downbeat market close, futures are again weaker to start the weak, if off the worst levels of the day, as we enter a heavy macro week highlighted by CPI, 8 Fed speakers, and the kick off of earnings season. Risk appetite also took a hit as focus turned to the threat of deflation in China: June CPI was flat – on the verge of deflation – while producer prices slumped 5.4% from a year earlier, the sharpest slide since December 2015.

As of 7:30am ET, S&P futures were down fractinally, erasing an earlier loss of 0.5%, with Nasdaq 100 futures lagging and down 0.2%. Bond yields are lower, the USD flat also erasing an earlier drop amid broad commodity weakness (as a reminder, the Black Sea Grain Initiative expires next week; keep an eye on Ags prices). Yellen’s China trip attempted to thaw US/China relations and while dialogue remains open there are no actionable plans for further step.”


VIX futures are challenging the 50-day Moving Average at 15.83, having reached a morning high at 16.21. VIX has made a confirmed buy signal and should be accumulated on any pullback.  The next Master Cycle is due near mid-August, but may be extended to the end of August.


TNX futures made a morning high at 40.92, leaving Friday’s high at 40.94 as the potential Master Cycle high on day 259.  Should that high remain, the new Master Cycle may last through the end of July with a potential target at the trendline and Intermediate-term support at 37.77.  Contrary to popular opinion, there may be a nother rate hike in August.

ZeroHedge remarks, “10-year US Treasury yields eclipsed 4% this past week for the second time this year and the third time since 2008. The most recent move began in mid-May from a level 70bp lower than current market yields. The yield on 2-year US Treasury notes rose more than 100bp during the same period – sending the 2s10s yield curve back to its most inverted levels of the hiking cycle.

Despite these large moves, US Treasury yields rose less since mid-May than the yields on UK, Canadian, and Australian government bonds. UK gilt yields were up the most since mid-May, with 10-year yields higher by almost 100bp and 2-year yields by 175bp. What common denominator could explain these moves? The repricing of market-implied central bank policy paths.”


USD futures are higher this morning, consistent with the current Master Cycle, due for a potential high in mid-August.  USD may see Trending Strength carry it along through the end of July.


Posted in Published | Comments Off on July 10, 2023

July 7, 2023

8:00 am

Good Morning!

US Tech futures hovered just above 15000.00 this morning as they await the monthly Employment Situation Summary due at 8:30 am.  The NDX tested the Cycle Top support at 14963.00, but did not decline beneath it.  An aggressive sell signal awaits the decline crossing the Cycle Top.  The next level of support is the Intermediate level at 14578.57 and the Ending Diagonal trendline jsut beneath it.

Today’s op-ex shows Max Pain at 15050.00.  Long gamma begins at 15150.00.  Short gamma may begin beneath 15000.00.

ZeroHedge comments, “Unprofitable tech and rates

We have seen a lot of commentary that big tech is immune to surging rates. You decide if you buy that argument, but what about unprofitable tech? There has been a lot of buying, mainly short covering, in unprofitable tech since May according to GS. The great chart needs little commenting…

Source: GS/Bloomberg

Surging rates is a problem

You do not compare trending assets to mean reverting assets, but the US 10 year vs VIX chart shows that surging rates is a problem for equities, despite the fact so many people tell you other stories.


SPX futures are hovering just above the Cycle Top support at 4401.54 after challenging that level yesterday.  thus far, the Cycle Top is at the June 30 high at 4458.48 on day 260 of the Master Cycle.  The Department of Labor’s monthly jobs report is due momentarily.

Today’s op-ex shows Max Pain at 4410.00.  Long gamma starts at 4450.00 while short gamma begins at 4400.00.

ZeroHedge reports, “Stocks were subdued as investors prepared for the June jobs report to gauge if they will confirm the blowout ADP print and back new bets for more Fed interest rate hikes which sent yields soaring on Thursday, slamming risk assets. US equity futures reversed earlier losses and traded unchanged after Thursday’s losses in the S&P 500 and Nasdaq 100 benchmarks sparked by stronger-than-expected ADP private payrolls data. As of 6:30am, emini S&P futures were down 0.1% while Nasdaq 100 futs dropped 0.2%. European stocks erased earlier declines of as much as 0.5% to trade flat, but were still on course for their worst week since the middle of March. MSCI Asia Pacific Index declined 1.6% to the lowest since June 2, as strong hiring data in the US renewed monetary tightening worries and investors awaited major stimulus measures from China. Treasury yields extended their ascent, with the 2Y rising back over 5.00% after nearly hitting 5.10% on Thursday while 10Y yields traded around 4.06%, after yesterday’s jobs data sent a gauge of global bond yields soaring to the highest since 2008.”


VIX futures are hovering near the 50-day MOving Average after having broken through it yesterday.  It is on a buy signal and pullbacks may be used to add longs or reduce short exposure.  The Cycles MOdel infers an uptrend through mid-August, with rising volatility.

Wednesday’s  op-ex shows Max pain at 16.00.  Short gamma is still strong, while long gamma appears weak.


TNX is hovering near its high made yesterday.  Today is day 259 of the current Master Cycle and may be the final high of this Cycle.

9:15 am

The anticipated breakout has occurred this morning.  The high thus far is 40.94, overcoming the February high at 40.91.  The Cycle Top at 41.34 awaits a possible test before a short-term reversal.

ZeroHedge comments, “BS break down

Fed’s BS printed another new recent low. The SBV “juice” is all gone. Note we haven’t “printed” these levels since Q3 2021.

Source: Refinitiv

Why bond yields are up

Liquidity drain over the past 2 weeks driving the bond move. Note another $1tn drain is expected in the upcoming couple of months.


USD futures are pulling back, challenging the 50-day Moving Average at 102.56.  The Cycles Model suggests the uptrend may continue through mid-August.


Posted in Published | Comments Off on July 7, 2023

July 6, 2023

11:56 am

VIX has given us an unambiguous buy signal as it rallied above the 50-day Moving Average at 15.94.  Trending strength has finally arrived and may help propel the VIX higher over the next tow months.


11:46 am

SPX may have issued its first aggressive sell signal by crossing the lower trendline of its most recent 2-month rally.   It has bounced from short-term support at 4382.94 and may retest the trendline.  The Cycles Model calls for two more weeks of decline with a potential target at the 2-hour Cycle Bottom at 4090.10.


11:29 am

BKX has declined through its Intermediate-term support at 79.64 and its 50-day Moving Average at 78.88, creating a confirmed sell signal.  Liquidity is draining out of our economy.  One absolute way to make liquidity disappear is through bankruptcies.  Liquidity increases through the issuance of debt.  However, bankruptcies and insolvencies have the opposite effect and may cause the economy to contract.

July 3 (Reuters) – U.S. Chapter 11 bankruptcy filings jumped 68% in the first half of 2023 from a year earlier, Epiq Bankruptcy, a provider of U.S. bankruptcy filing data, said on Monday.

SVB Financial Group, Envision Healthcare Corp, Bed Bath & Beyond, Party City Holdco, Lordstown Motors and Kidde-Fenwal were among some casualties of decades-high interest rates and sticky inflation as the era of easy money drew to a close.

ZeroHedge inquires, “The Federal Reserve has hiked interest rates to levels not seen since before the financial crisis in 2008. The money supply had contracted at a rapid rate. This should cause the economy to slow down. Yet month after month, we get strong job numbers, rosy economic headlines, and assurances that the economy remains robust.

What exactly is going on here? Why hasn’t the predicted recession materialized yet?


8:15 am

Good Morning!

NDX futures are sliding lower from their double top to a low of 15104.00.  The Cycle Top support is at 14920.78.  Beneath that may be an aggressive sell signal.  Most articles on tech are retrospective, as if by looking backwards you will know where you are going.

Today’s op-ex shows Max Pain at 15225.00.  Long gamma may start at 15300.00 while short gamma may begin at 15200.00.

ZeroHedge notes, “Highest since the SBV collapse

The US 10 year is trading at 3.92% as of writing. A level last seen when SBV hit the world. Note the 50 day crossing the 100 day moving average here. Previous big crosses saw yields move sharply higher…

Source: Refinitiv

Pushing it

Will they push tech to a new all time high as a share of sector fund assets? Big tech has decoupled from rates. GS writes: “Tech has had a tremendous rally despite higher rates, so on a scenario of lower rates I think this cohort has another leg higher”.


SPX futures have declined to a morning low of 4405.40 thus far, soon to reach or power through the Cycle Top support at 4397.62.  An aggressive sell signal may await beneath that level.  The Cycles Model shows a potential low during options week, where trending strength may increase.

Today’s op-ex shows Max Pain at 4440.00.  Long gamma may begin at 4455.00 while short gamma starts at 4425.00.

ZeroHedge reports, “US futures extended losses as markets finally noticed the recent surge in Treasury yields across the globe, sparking fears of stagflation and following recent remarks from the Federal Reserve that were more hawkish than anticipated. Sentiment was also cautious ahead of fresh employment data. Stocks have struggled as a result, with the Stoxx 600 down 1.2% and on course for its largest fall in six weeks. As of 8:00am, ET, S&P 500 and Nasdaq 100 futures lose 0.6%. Treasury yields rose across the curve, adding to gains on Wednesday spurred by the Fed minutes. The policy sensitive two-year rate inched up to 4.96%. The dollar initially dropped but then spiked after a blow out ADP report.”


VIX futures have risen to a morning high at 15.63, breaking out above a previous high at 14.93 and approaching the 50-day Moving Average at 15.94.  An Aggressive buy signal may be made at either level.  Trending strength has kicked in and may last the rest of this week.

ZeroHedge remarks, “VIX seasonality

Use the summer vacations wisely…

Source: Equity Clock

Some fear has moved sharply higher

European “VIX”, the V2X, has moved sharply to the upside. The index has not closed here since early June. The gap vs VIX is very wide.”


TNX surges higher this morning, nearly taking out the March high at 40.91 and possibly aiming for the Cycle Top resistance at 41.31.  As you can see, the Master Cycle is nearing its end and may be over by the end of the week.  While TNX is due for a pullback, the message may be clear.  Higher rates are on their way.

ZeroHedge remarks, “The effects of Fed rate rises will be increasingly amplified as households’ duration risk rises, strengthening the hand of those in the FOMC who would prefer a “wait-and-see” approach to further tightening.

Five hundred basis points of rate rises in a little over a year would normally be expected to cause some damage. While there have been a few casualties along the way, and growth has taken a hit, it’s remarkable how resilient the economy has been.

Yet this rate-hiking cycle has been different from others in that the Fed has had a large amount, over $5 trillion, of the market’s duration risk sitting on its balance sheet, shielding the economy from the worst of the effects of rate rises.”


Posted in Published | Comments Off on July 6, 2023

July 5, 2023

12:20 pm

The rally in the BKX appears to have fizzled on June 13 as the knock-on effect appears to be the narrowing of leadership in all the other indices.  The NDX and SPX only have 5 companies on which they can base their rally.  Liquidity may be about to take another nosedive as the Cycles Model points down for the next two months.   To make matters worse, the Fed releases the minutes to the June 14 meeting.

ZeroHedge observes, “A rise in bankruptcy filings points to increasing bankruptcies, loan charge-off rates and delinquencies, suggesting credit spreads are not reflective of the underlying credit backdrop.

A chart of bankruptcy filings (using weekly data from Bloomberg’s BCY function) and credit spreads I used in last Thursday’s MacroScope column generated a lot of reader interest. This chart, below, shows that filings for bankruptcies have risen sharply despite credit spreads idling for most of this year. Previous rapid rises in filings have been preceded by a widening in credit spreads.”


7:45 am

Good Morning!

I am revisiting the DJIA this morning to highlight some important characteristics about Cycles.  First, there are Cycles at multiple units of measurement.  For example, the Master Cycle has an average duration of 258 days.  It may be considered the most basic Cycle.  However, Monthly Cycles also exist that may consist or multiples of the Master Cycle.  And, in some cases, may not coincide exactly with their brethren.  This may be a case in point, where we have a double top, two weeks apart.  Last Friday’s high was 260 days from the October 13 low, a typical Master Cycle.

The DJIA is being highlighted for another reason.  It’s retracement high was on December 13 at 34712.48.  It has not exceeded that high, even at this double top.  There may be a final attempt to go higher, but time is running out and, should it do so, it must be very soon.

This morning’s INDU futures have declined to 34228.00 thus far.   Should the INDU decline beneath the 50-day Moving Average at 33644.00, it will have created an aggressive sell signal.


NDX futures have declined to 15103.40 thus far this morning, leaving a double top.  Time may be running out for another attempt to probe higher.

The NDX gives us another example of a double top, where June 13 marked the top of an 18.5-month Cycle, coinciding with the 17.2-month Cycle in the Blue Chips.   Friday’s Master Cycle high also agrees with the Master Cycle high in the SPX.  Cycle Top support lies at 14871.48 where an aggressive sell signal awaits.

ZeroHedge notes, “It would be (almost) perfect

NASDAQ started front running the 1999 analogy a while ago. Is a pullback to be expected…followed by a furious melt up later this autumn? Nothing is impossible…

Source: Refinitiv

Tech’s rates dislocation

Big tech continues driving the main narrative, and rates seem to not matter for this mighty sector, despite the 10 year trading at highest levels in months. NASDAQ vs US 10 year inverted gap at very wide levels.


SPX futures have declined to 4429.40 thus far this morning, nearing its Cycle Top support at 4390.98.  Beneath that level an aggressive sell signal may be assumed.  Of all the major indices, the SPX alone has made a new retracement high as well as a double top.  Should SPX (or any of the other stock indices) go higher, time to make new retracement highs would be limited.

ZeroHedge reports, ” One day after a solid start to the new quarter, and after the US took a day off for Independence Day, sentiment has reversed for the worse and US equity futures and European stocks followed Asian shares lower, while bonds declined after the latest China services PMI print from China came well below expectations (53.9 VS 56.2 expected) and raised fresh concerns about the outlook for the global economy. At 7:45am ET, S&P 500 and Nasdaq 100 futures both fell more than 0.5%, indicating US stocks will open lower when trading resumes after the Independence Day holiday. The yield on 2Y Treasuries drifted about five basis points lower to 4.89%. The China-driven weakness was broad based with Japan’s NKY down -40bps, China’s Shcomp sliding -60bps and the HSI -1.5%. The Stoxx Europe 600 Index slid about 0.6% after soft euro-zone May PPI data, with miners leading the retreat on concern about waning minerals demand from China. Most commodities were lower with copper -70bps, oil -50bps and iron ore -40bps. The Bloomberg dollar index is higher, gold is climbing, and oil is also edging higher.”


VIX futures rose this morning to 14.74 before easing.  A potential breakout lies above 14.90, while the 50-day Moving Average is at 15.99.  Should the VIX go above the first level, it may create an aggressive buy signal.  Above the 50-day May create a confirmed but signal.  The extended tail of the Triangle formation may cause a slingshot effect above the long-term trendline at 18.00.  The Cycles Model suggests trending strength may have resumed with possible knock-on consequences.


TNX is challenging its breakout occurring last week.  Today is day 257 in the Master Cycle, suggesting the balance of this week may show higher rates.

ZeroHedge observes, “A note recently published by two Federal Reserve economists reveals a looming catastrophe…

The Fed’s interest rate hikes have already precipitated a financial crisis. The central bank managed to paper over that problem and get it out of the headlines with a bailout program. But it didn’t solve the problems. Banks continue to tap into the bailout loans as they struggle in this high-interest-rate environment.

And there are even bigger problems on the horizon.”


Posted in Published | Comments Off on July 5, 2023

June 30, 2023

10:30 am

The Banking Index may have reached another Master Cycle high this morning as it may have completed a 70% retracement of its decline from its June 14 high at 83.38.  The Cycles Model now suggests a 2-month decline that may fulfill the Head & Shoulders target despite Fed reassurances that banks have passed their stress tests. 

In fact, hedge funds have never been more bearish on banks, despite the Fed rassurances.   The Fed waited until the market close to announce that the emergency bank bailout facility usage hit a new record high.


8:00 am

Good Morning!

SPX futures rose this morning over it 61.8% Fibonacci retracement at 4401.00 after a 6-day decline and a 3-day rally (thus far).  Cyclically and technically the retracement may be over today, but pressures are on for a strong end-of-quarter.  After the 4-day holiday coming up, the emphasis may be on the downside.

In today’s op-ex, there is a huge collar put on SPX starting at 4320.00 with a heavy population of calls going to 4400.00.  It is likely that SPX may close today in the upper range of this collar.

ZeroHedge reports, “The second quarter – and first half – of 2023 is coming to a close on an upbeat note, as US equity futures are higher, led by megacap tech, and especially Apple, which is set to open with a market cap over $3 trillion following a bizarre initiation report from Citi yesterday late, which set a $240 price target on the world’s biggest company, just in time to catch its all time high. As of 7:45am ET, S&P futures were 0.4% higher, set to close out a third straight quarterly gain…

… while Nasdaq futures rose 0.5%, indicating the index is set to extend its 37% surge since the start of the year, its best start to the year since 1982.”


NDX futures just crossed above the 61.8% Fib retracement at 15056.00 this morning.  Quarter end dictates that id may stay at or above that level for the remainder of the day.  An aggressive sell signal lies beneath the Cycle Top support, currently at 14709.60.

In today’s op-ex Max Pain lies near 14950.00.  Long gamma lies above 15000.00, while short gamma lies beneath 14900.00.  Both long and short open interest falls off dramatically after the holiday.


VIX futures revisited but did not go lower than the June 22 low at 12.73 overnight.  The bearishness has been wrung out of the VIX.  A breakout above the June 26 high at 14.33 mayu  provide an aggressive buy signal.

the July 5 op-ex shows Max Pain at 17.00.  Short gamma begins at 16.00, while long gamma comes in at 17.00.

ZeroHedge inquires, “The VIX has continued its remarkable descent last week despite downward pressure on US equities, falling below 13 to as low as 12.73 intraday on June 22, its lowest levels since Jan-20, before recovering to 13.54.

And while investors – most of whom are still skeptical about the current rally – might be in different “stages of grief” about the equity vol crush, according to BofA’s derivatives gurus Nitin Saksena and Benjamin Bowler, they can all agree on the key questions: what’s driving it; when will the VIX base; and how low can it stay?”


TNX broke out above its May 26 high at 38.59 on day 252 of its current Master Cycle.  However, it has made an immediate reversal and may revisit Intermediate-term support at 37.14 or the mid-Cycle support at 38.93, prolonging the Master Cycle and positioning it at the low.  The jury is out for another week to determine the true intent of the Cycles Model.


USD futures declined to a morning low at 102.52, just above the 50-day Moving Average at 102.47.  The decline may not last since the Cycles Model shows (up) trending strength coming back next week.  In fact, the may rally considerably higher through mid-August.


Posted in Published | 11 Comments

June 23, 2023

9:30 am

BKX just plunged beneath the 50-day Moving Average at 79.15 and Intermediate-term support at 78.25 to confirm a sell signal.  Something may emerge in the Banking Sector that constricts liquidity.  The Head & Shoulder target is still valid.


9:20 am

Prepare for a gap down beneath 4350.00 in the SPX and an aggressive sell signal.


7:40 am

Good Morning!

PLEASE NOTE:  i will be out of town until Thursday.  Commentary may resume on Friday.

NDX futures are down this morning after making a 51% retracement.  The Cycle dynamics have changed, with 3 days down and only one day of retracement.  This compares to last year’s 2 to 1 ratio.  Keep that in mind as we launch a vicious decline that may last up to 4 weeks.  Short covering may be brutal, but the decline may be much worse.

In today’s op-ex, 14950.00 is hotly contested.  Long gamma may begin at 15000.00 while short gamma gains ascendancy beneath 14900.00.


SPX futures are testing Cycle Top support at 4356.00 this morning after a less-than-Fibonacci retracement of 32%.  There is an outside chance of a quick recovery to make a higher retracement, but once beneath 4350.00 the decline resumes under an aggressive sell signal.  The sell signal is confirmed beneath Intermediate-term support, currently at 4229.74

Today’s op-ex shows the strike at 4375 may be hotly contested Max Pain.  Long gamma begins at 4400.00 while short gamma takes over at 4350.00.

ZeroHedge reports, “One week after S&P futures hit a 52-week high, sentiment has turned increasingly ugly and US equities are set to open lower for the 4th of the past 5 days, with global stocks also sliding, after the latest set of dismal European PMIs revealed that economic momentum in the euro area almost came to a halt in June, signaling an end to the revival the bloc demonstrated since its winter downturn (and good news for the ECB which has been desperate to spark a recession). As of 7:45am ET, emini S&P futures were down 0.5%, trading just over 4,400, almost 100 points below the YTD highs hit last Friday; Nasdaq futures were also down half a percent, as investors fled into the safety of bonds amid a return of fears that weak euro-area activity data together with aggressive central bank rate hikes will tip economies into recession. The Bloomberg dollar index traded near the day’s highs, pressuring all Group-of-10 currencies. Treasury yields fell across the board, following pullbacks in the UK and Europe. Gold advanced, Brent crude slid more than 1.5% and Bitcoin fell for the first time in five days. Today’s macro data focus is PMIs releases: the street expects another contractionary print from the US Mfg PMI at 48.5, while services are expected to dip to at 54.0 from 54.9.”


VIX futures rose to 13.55 this morning after a likely bottom made yesterday on day 267.  While an 8.6-day extension is allowed in the Master Cycle, there is no explanation where the selling originates.   Was the VIX decline meant to curb the decline in stocks in a tail-wags-the-dog fashion?

A look at the VIX op-ex next Wednesday shows Max Pain at 13.50.  There is no short gamma, while long gamma takes of at 16.00.


TNX was beaten back to the mid-cycle support and trendline at 36.80 this morning.  It remains in a consolidation as it gathers strength for the next probe higher.  The target for the next two weeks appears to be the Cycle Top resistance at 41.22.


USD futures rose to an overnight high of 102.78, probing above the 50-day Moving Average at 102.26 and issuing a buy signal.  This action may launch a 2-month rally in the USD.  Analysts who are trash talking the USD fail to see the worsening conditions elsewhere, especially in Europe.

ZeroHedge reports, “Hope for a rebound from Europe’s economic ‘winter’ were dashed this morning as PMIs signaled a renewed downturn.

S&P Global EU PMI fell to a 5-month low of 50.3 (barely in expansion). The decrease in the composite index was broad-based across sectors but skewed towards services, although the services index, unlike the manufacturing output index, remains in expansionary territory.

The composition of the June report showed a broad-based moderation across new orders, employment, new export orders, and backlogs. Firms’ future output expectations declined further as well.”


Posted in Published | 11 Comments

June 22, 2023

12:38 pm

SPX has completed an impulsive decline and is due for a retracement.  The 50% retracement value is very near 4400.00, as is other overhead resistance.  Should that be the retracement target, we may see the rally continue another 24 hours in an attempt to take back this week’s losses.  However, the 0-DTE options trades are favoring the puts with the 4350.00 strike gaining strength.  Should SPX decline beneath 4350.00, the decline may resume sooner.


10:07 am

The Ag Index was repelled by the upper trendline of its 8.6-month declining trading channel.  The Cycles Model suggests another 4 weeks to the end of the new Master Cycle.  Should support at the 50-day Moving Average at 437.20 hold, we may see it break out of the channel in the next week.  Trending strength makes a comeback starting tomorrow and may last through mid-July.


9:50 am

An update on the BKX shows it challenging Intermediate-term support at 79.24.  It is now on a confirmed sell signal with a decline to the end of the month.  Normally I would suggest a target at the Cycle Bottom.  However, the potential for a panic decline is significant next week.


8:00 am

Good Morning!

NDX futures are lower this morning, down to 14796.90.  NDX is on an aggressive  sell signal beneath 15000.00 with further reinforcement at the Cycle Top at 14500.08.  A confirmed sell signal lies at the lower trendline of the Ending Diagonal and Intermediate-term support at 14054.67.   Most analysts still believe that the uptrend is still in force.  A few are now timidly calling for a small pullback.  The Cycles Model calls for a panic Cycle to emerge over the next week until the end of the month.

Today’s op-ex shows Max Pain at 14975.00.  Long gamma starts at 15000.00 while short gamma begins at 14950.00.  The short gamma trend appears to be accelerating.

ZeroHedge remarks, “Now that we know that hedge funds have been quietly but persistently derisking for the past 9 days, a move which now appears to be spreading to institutions and high net worth retail, it makes sense why today was the third consecutive day of the market giving back.

As Goldman trader Mike Washington notes in his EOD summary, it was a relatively light volume session with semis + MAGMAN + software + retail favorites all selling off in tandem; the bank’s trading desk was “peppered with questions on the move lower but there wasn’t much to point to other than froth coming out of lower quality sleeves of the mkt.” The desk also saw an uptick in selling in more speculative complexes like growth software on the way down from not just the hedge fund community but also institutional long-onlies (who had been piling in while HFs were selling) reducing length, as well as a defensive bid for value. As an aside, Powell’s testimony was largely in line with a slightly hawkish tilt, reiterating that we are ‘very far’ from the 2% inflation target and rates will be ‘somewhat’ higher by year end (fed fund futs now pricing in a ~70% probability for a July hike).

This brings us, or rather Goldman, to ask we first said on Monday is the only question that matters: Is the rally about to sizzle or broaden out?”


SPX futures are challenging the Cycle Top support at 4351.70.  Beneath it lies an aggressive sell signal.  Other reinforcements lie at the upper trendline of the Ending Diagonal at 4250.00, while a confirmed sell signal lies beneath the 50-day Moving Average and lower trendline at 4188.40.

In today’s op-ex Max Pain lies at 4375.00.   Long gamma begins at 4400.00 while short gamma starts at 4350.00.  It appears that short gamma may dominate the day.

ZeroHedge reports, “US equity futures and global markets slumped for a 4th day as policy tightening fears from the US to Norway to Switzerland to the UK hobbled the recent bull run which sent US stocks to a 52-week high last Friday. At 7:45am, S&P 500 and Nasdaq futures were down 0.3% following a selloff on Wall Street on hawkish warnings by Fed Chair Jerome Powell in testimony to Congress. The Bloomberg dollar index was higher with the Norwegian krone outperforming among Group-of-10 currencies. Treasury yields edged higher across the curve, mirroring mild increases in the UK and Europe. Brent crude slid nearly 1%, gold fell and Bitcoin topped $30k amid optimism over ETFs related to the token but has since reversed back under after today’s tightening barrage. Today’s macro data focus includes Jobless data, Home Sales, regional mfg activity, and the leading index. Powell speaks at 10am and there are 4x other Fedspeakers.”


VIX futures hit a morning high at 13.98 as it rose from an extended Master Cycle low on day 266.  The Cycles Model suggests an uptrend in VIX that may last through mid-August.  I have been advocating accumulating shares, long options and ETFs for the past two weeks and now our patience may be rewarded.

Wednesday’s op-ex shows long gamma above 13.00. with no short gamma  The heavy short gamma positions held until yesterday’s expiration have all disappeared.


TNX may resume its rally today after finding support at the trendline and mid-Cycle level at 36.82.  Most analysts consider the bond market to be flat since March.  However it has only ventures beneath the uptrend line three times in the past three months.  The current Master Cycle is due to end in early July.

ZeroHedge reports, “An otherwise boring day in which everyone pretends to be listening to Powell but is really playing wordle was broken up momentarily by some bond market action when 1 minute after 1pm ET, the Treasury announced results from today’s 19-Year 11-Month reopening auction of 20Y paper, which saw nothing less than stellar demand.

Stopping at a high yield of 4.010%, this was a 6bps increase compared to May and the first 4-handle auction since November; more notably, it stopped through the 4.028% When Issued, a 1.8bps stop through, which was the highest since January.

The bid to cover was even more impressive: printing at 2.87, it was more than 30bps higher compared to May and was also the highest on record since the return of the 20Y tenor after it was put on hiatus in 1986.”


USD futures are rising out of their June 16 master Cycle low.  The Cycles Model implies that the new Master Cycle may extend beyond mid-August.


Posted in Published | 7 Comments

June 21, 2023

7:45 am

Good Morning!

NDX futures are approaching 15000.00 in their decline.  A decline beneath this may reinforce the aggressive sell signal given by the Cycles Model.  Further bolstering of the aggressive sell lies beneath the Cycle Top at 14462.55.  A confirmed sell signal may not be given until NDX declines beneath the Intermediate=term support at 14013.09.  Aggressive signals are often subject to push back, but may lead to better positioning at the Cycle turns.  Each layer of support/resistance gives a higher probability of success.

Today’s op-ex shows Maximum investor pain at 15075 (Wouldn’t you know?).  Long gamma begins at 15100.00 while short gamma lies beneath 15000.00.

ZeroHedge remarks, “With prescient flare, in 2012 our long-time friend Josh Brown, better known as the “Reformed Broker”, wrote a piece called the relentless bid. He explained that mammoth asset managers like Merrill Lynch and Morgan Stanley are constantly buying stocks and holding on to them as opposed to trading in and out as fees-based accounts replaced transaction-based accounts. Josh has a good sniffer, this was the early stage of the passive investing torrent.

These days there are even larger forces at work that are putting a constant bid under the market. This is the interplay between the $11 Trillion of passive investments and the 0DTE index options, but it has created a ticking time bomb. There are alarming unintended consequences of mechanical buying by passives and the surging options volumes. Both work together in a self-reinforcing feedback loop to artificially distort risk indicators by suppressing volatility. Once again this is causing a massive buildup of one-sided, overcrowded long positions. In the past, this has led to vicious, almost disorderly sell-offs from time to time and it is bound to happen again.”


SPX futures are consolidating in a narrow range.  A decline beneath the Cycle Top support gives an aggressive sell signal.  A further decline beneath the Ending Diagonal trendline and the 50-day Moving Average at 4163.17 confirms the sell signal.  SPX has completed a 17.2-month top-to-top Cycle and is due to end its Master Cycle, currently shown as completing at the high on day 246.  Still unresolved is the possibility that the Master Cycle may actually terminate at a low in the next two weeks.

Today’s op-ex shows Max Pain at 4385.00.  Long gamma may begin at 4400.00, whils short gamma starts at 4350.00.

ZeroHedge reports, “US equity futures are flat and global markets grind lower, as bond yields and breakevens rise in reaction to the latest “shockingly” hot UK inflation data (May U.K. CPI unchanged at 8.7% vs. exp. of  a drop to 8.4% y/y ) which saw the odds of a 50 bps BOE hike tomorrow jump to 50%. At 7:30am, S&P futures were down -0.1%, flipping between modest gains and losses after trading in a narrow range after the S&P index notched its first back-to-back losses in nearly four weeks. Economic bellwether FedEx Corp. tumbled 3% in premarket trading after its outlook fell short of analyst consensus estimates on weakened demand. The Bloomberg gauge of the dollar moved higher and Group-of-10 currencies were mixed, with the pound the worst performer. Treasury yields drifted higher across the curve, following their UK counterparts. Gold and oil were little changed, while Bitcoin climbed for a third-straight day. BBG reports that Equity ETFs have seen $102BN in inflows vs. $93bn for FICC ETFs; if ECM and M&A turn back on, could flow outperformance increase.”


VIX futures revisited their low at 13.48 last night.  A hawkish Powell speech may jolt the VIX back above the 50-day Moving Average.  It’s time to accumulate VIX shares, Options, ETFs.

Today’s op-ex shows Max Pain at 21.00, which is heavily contested.  Short gamma is strong beneath that strike down to 13.00.  Long gamma begins at 23.00 and is strong to 50.00-60.00.


TNX is bouncing off mid-Cycle support as it may be due for a double dose of trending strength.  The next resistance is the Cycle Top at 41.27.  The Cycles Model shows growing strength into the first week of July.

ZeroHedge observes, “The market has slide in overnight trading ahead of Fed Chair Jerome Powell’s monetary policy testimony to Congress.

According to just released prepared remarks, he will tell lawmakers on Wednesday there is still “a long way to go” to cool inflation and interest rates are expected to rise further this year, reiterating his comments from last week.

“[I]nflation pressures continue to run high, and the process of getting inflation back down to 2 percent has a long way to go,” Powell’s prepared remarks state.

“Nearly all [officials] expect that it will be appropriate to raise interest rates somewhat further by the end of the year,” he added.”


USD futures are hovering beneath the 50-day Moving Average at 102.36.  A move above that level gives a buy signal for the USD.  The Cycles Model suggests a rising USD through mid August.


Gold futures jus broke down beneath the May 26 low at 1936.00, hitting a low at 1929.75. The Cycles Model suggests a continued decline to the  end of July.  Initial support lies at the mid-Cycle at 1864.23.  However, the decline is likely to go to the Cycle Bottom at 1619.20.


Posted in Published | 9 Comments