October 19, 2023

1:30 pm

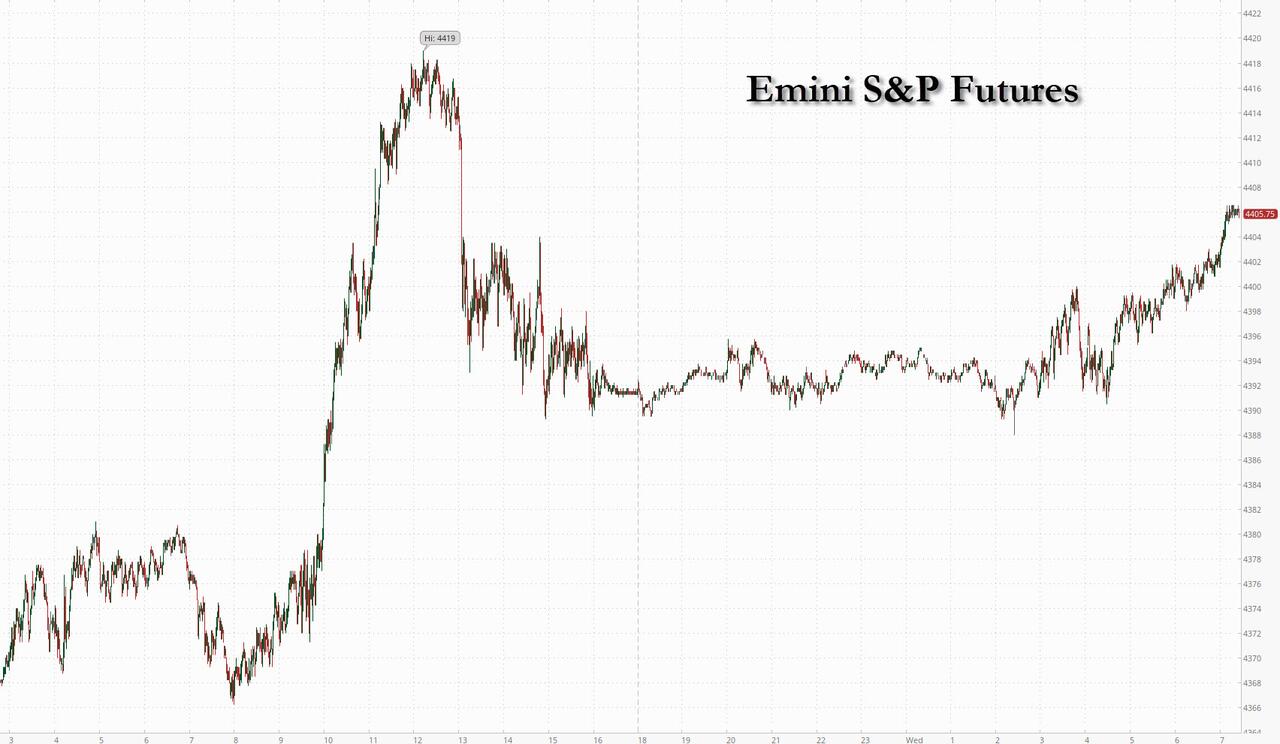
SPX may have been stopped by the trendline at 4339.50,a 47% retracement VS. a 61.8% Fibonacci retracement mentioned this morning.  The decline may be resuming.


8:00 am

Good Morning!

NDX futures made a new low at 14828.00, then bounced back above the close.  The Cycles Model suggests another 3-4 weeks of decline before a possible correction.  NDX is on a sell signal beneath the 50-day Moving Average at 15059.00.

Today’s options expiation shows Maximum investor pain at 14940.00.  Long gamma starts at 14975.00, while short gamma begins at 16930.00 with a put wall at 14900.00.

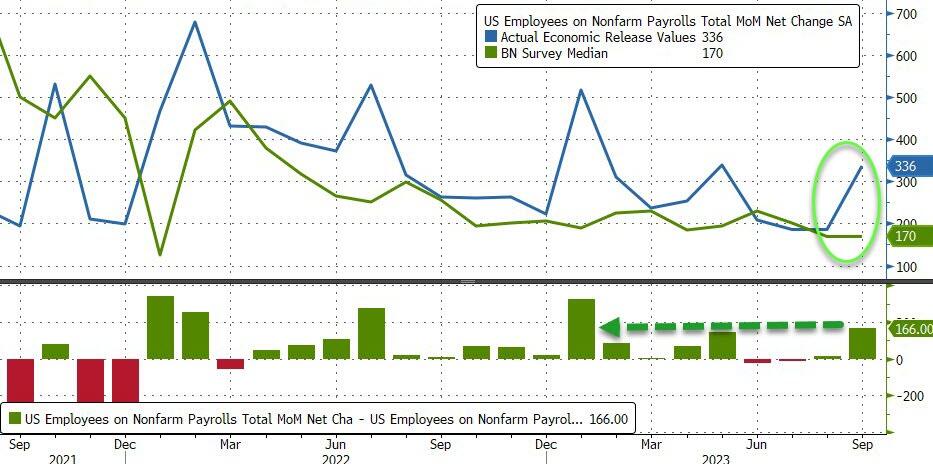
ZeroHedge notes,”Stock investors had looked pretty impervious to risk aversion until recently.

But with yields pushing higher, they have started making an about-turn. An escalation of the conflict in the Middle East may just be what sends indexes back to fair value, and that would mean a drop of 14% for the Nasdaq 100.”


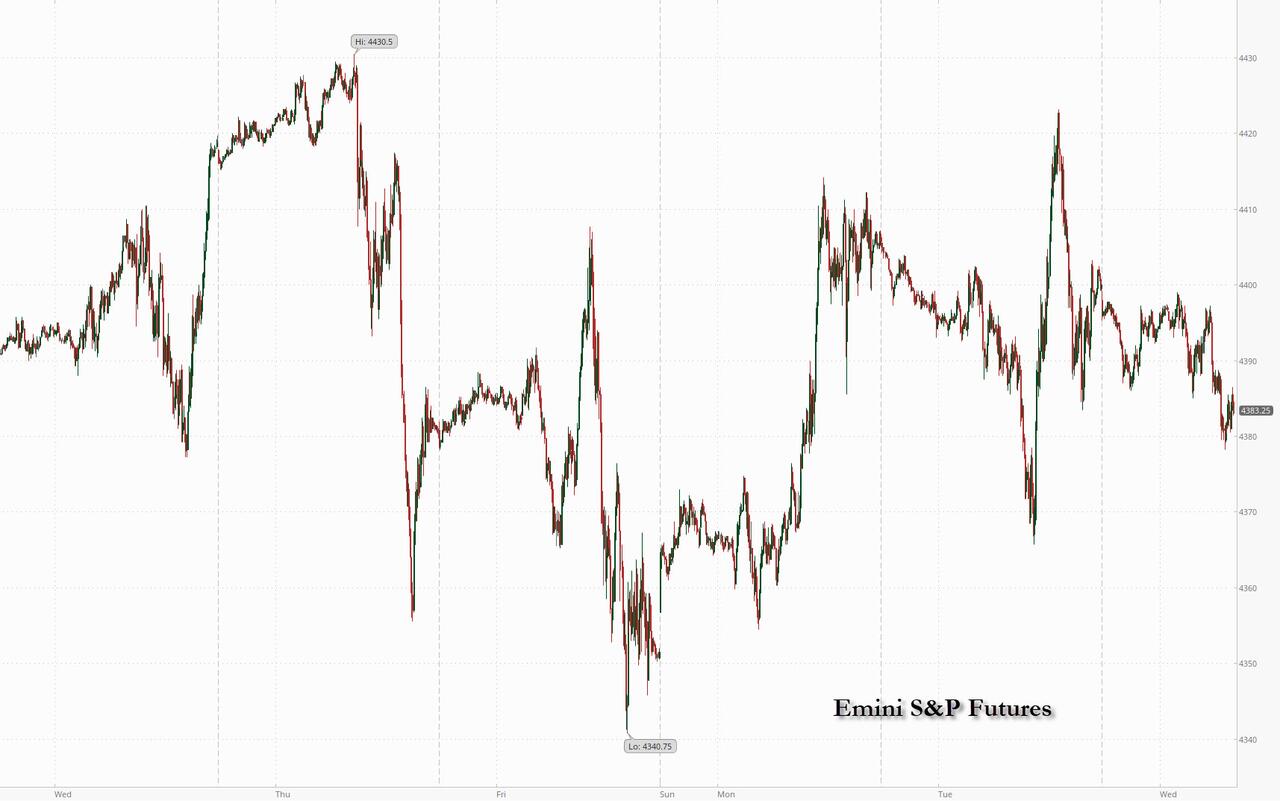
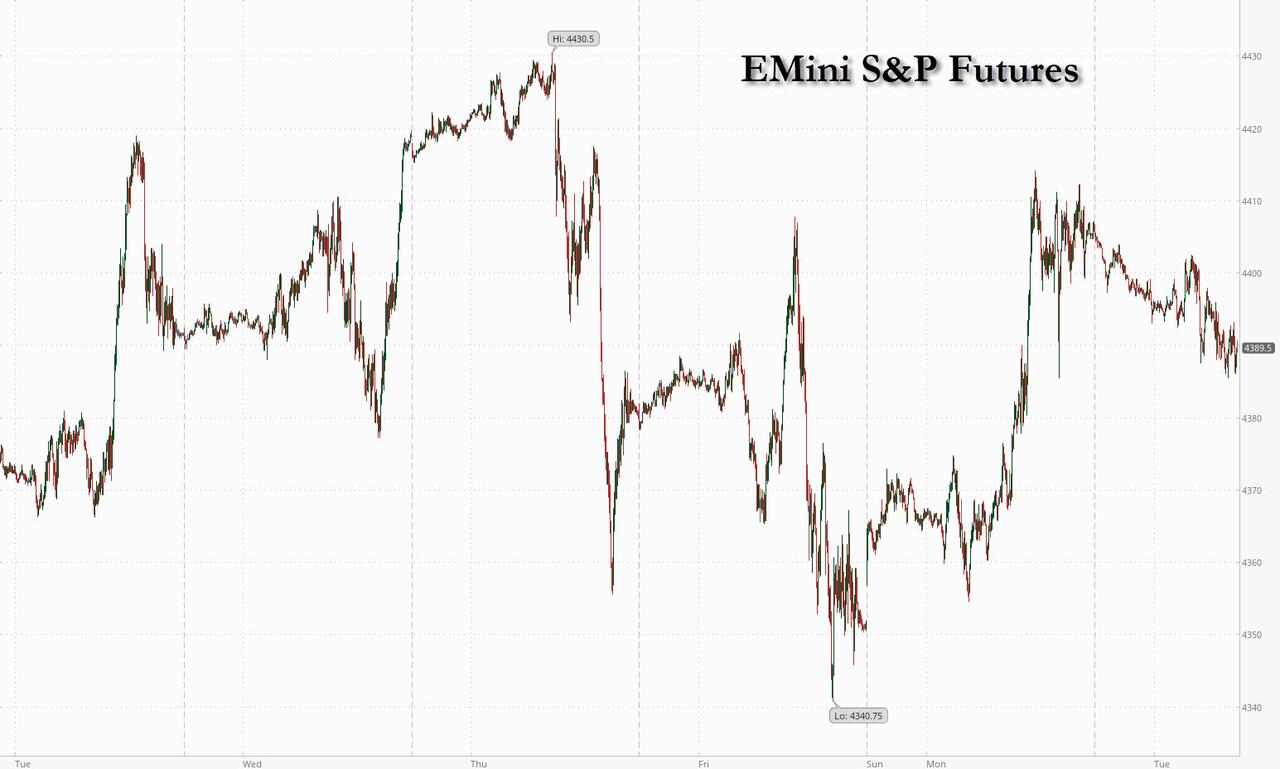
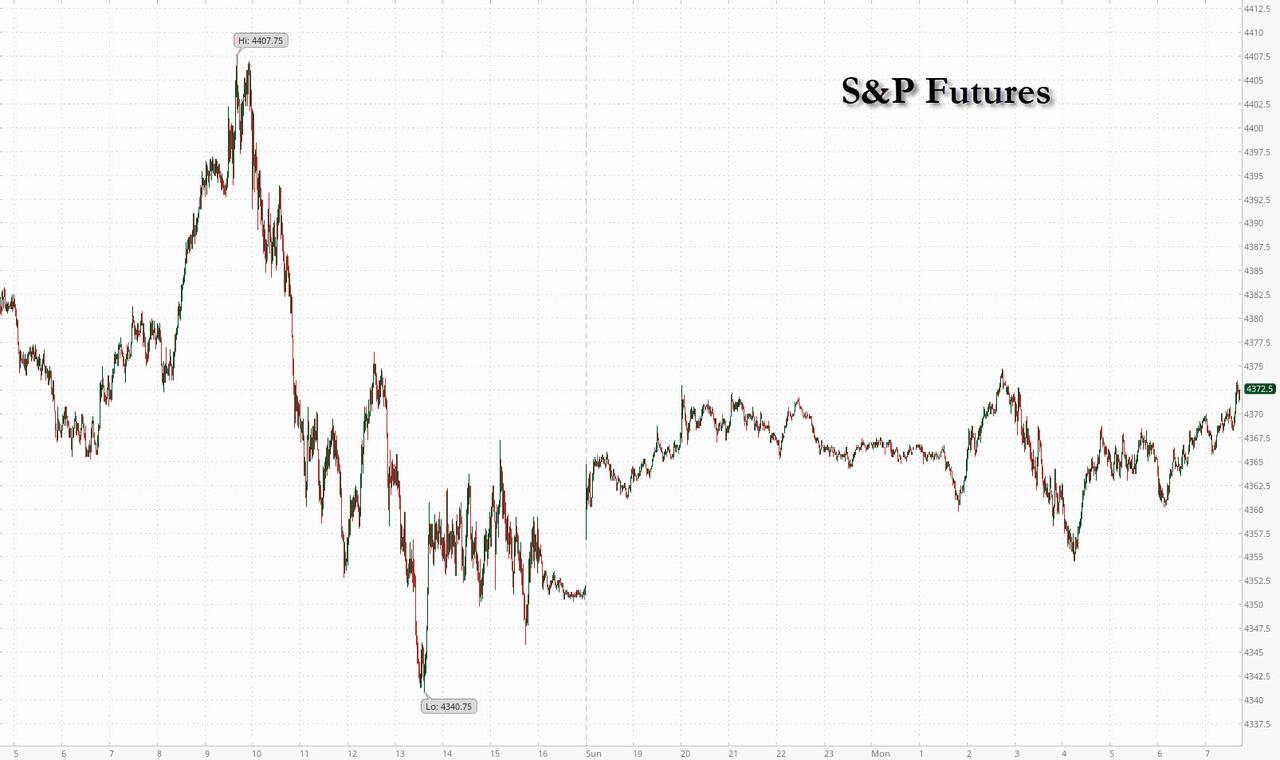
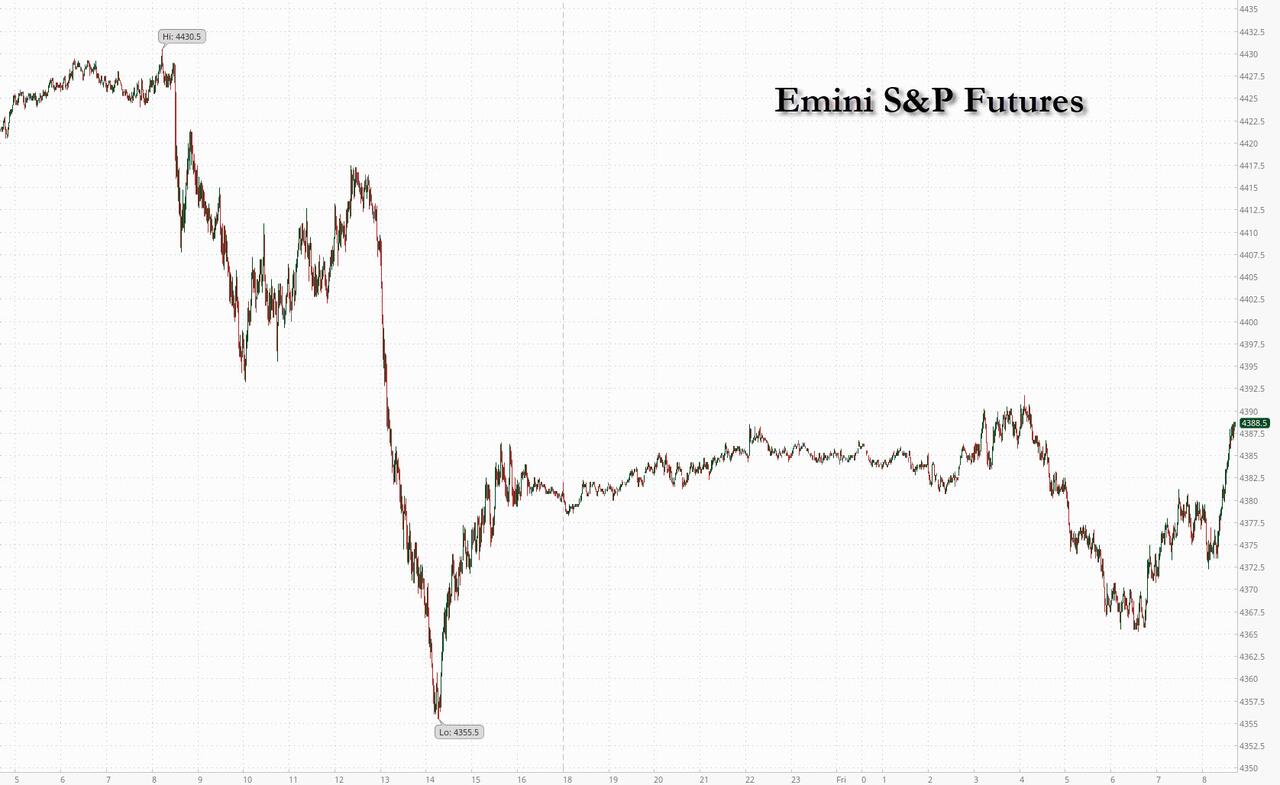
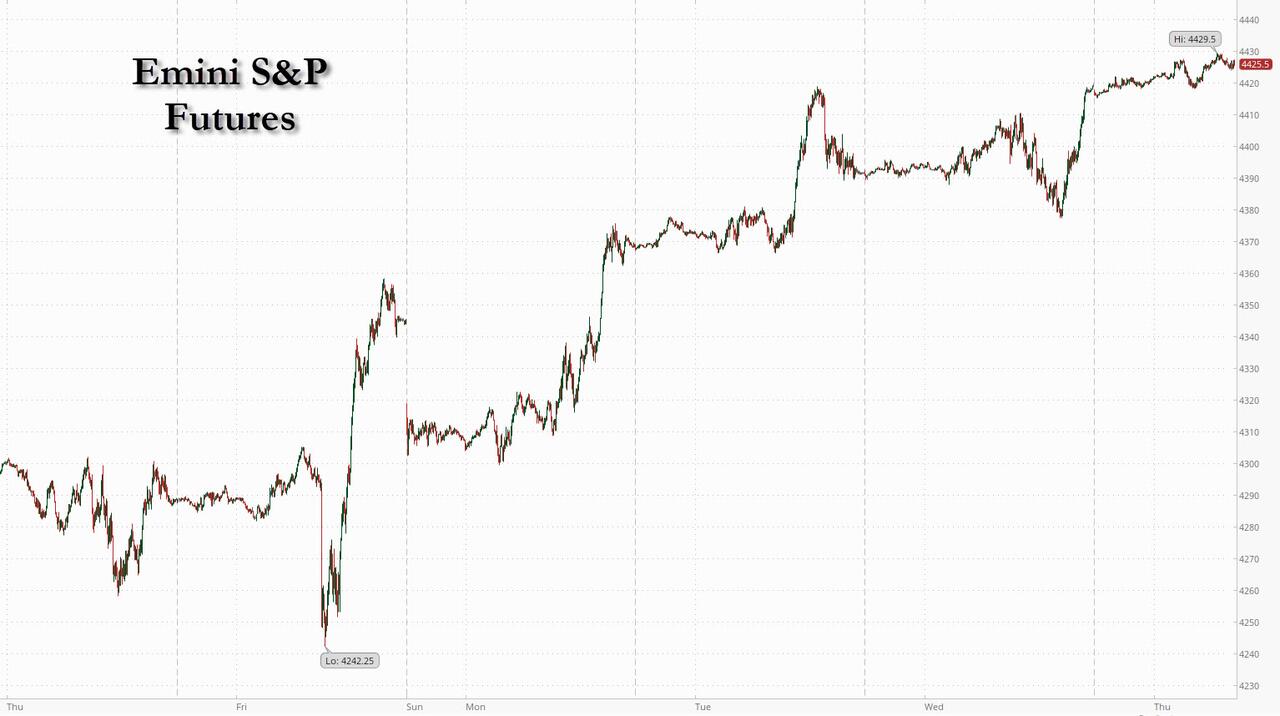
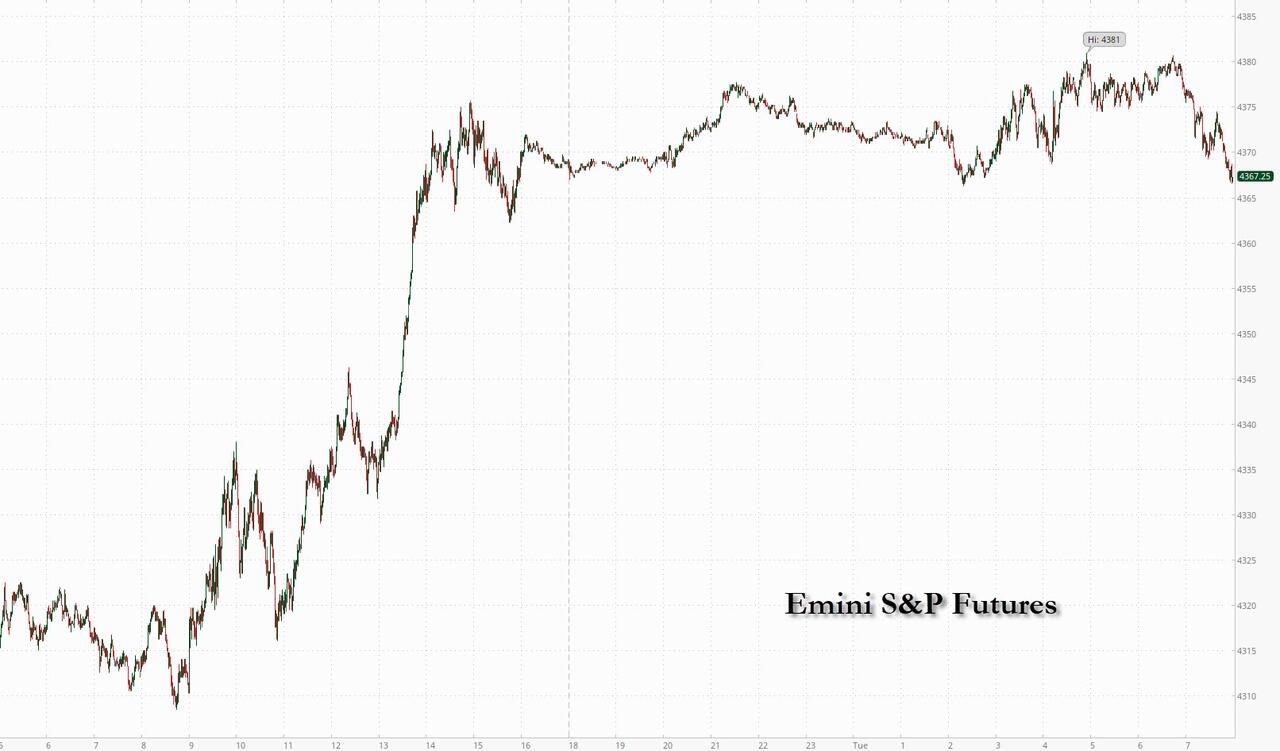
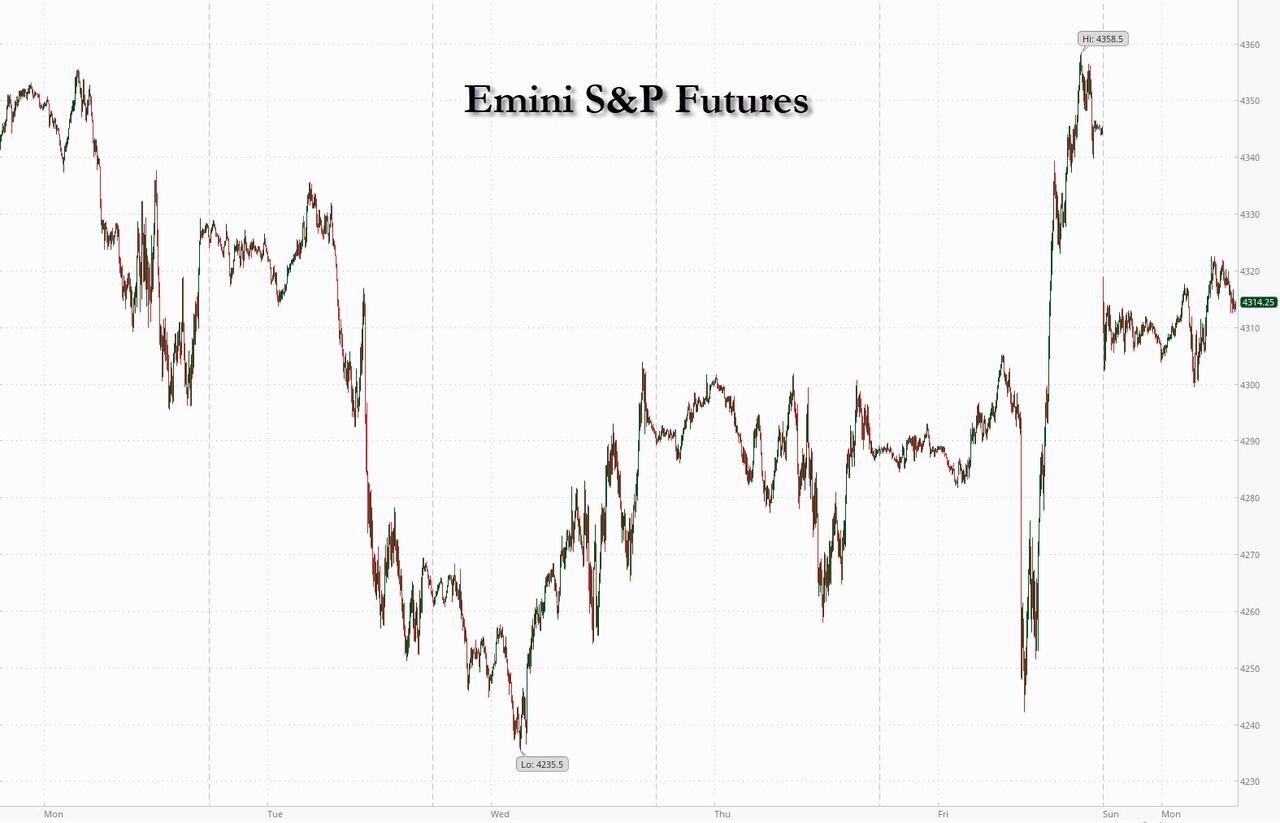
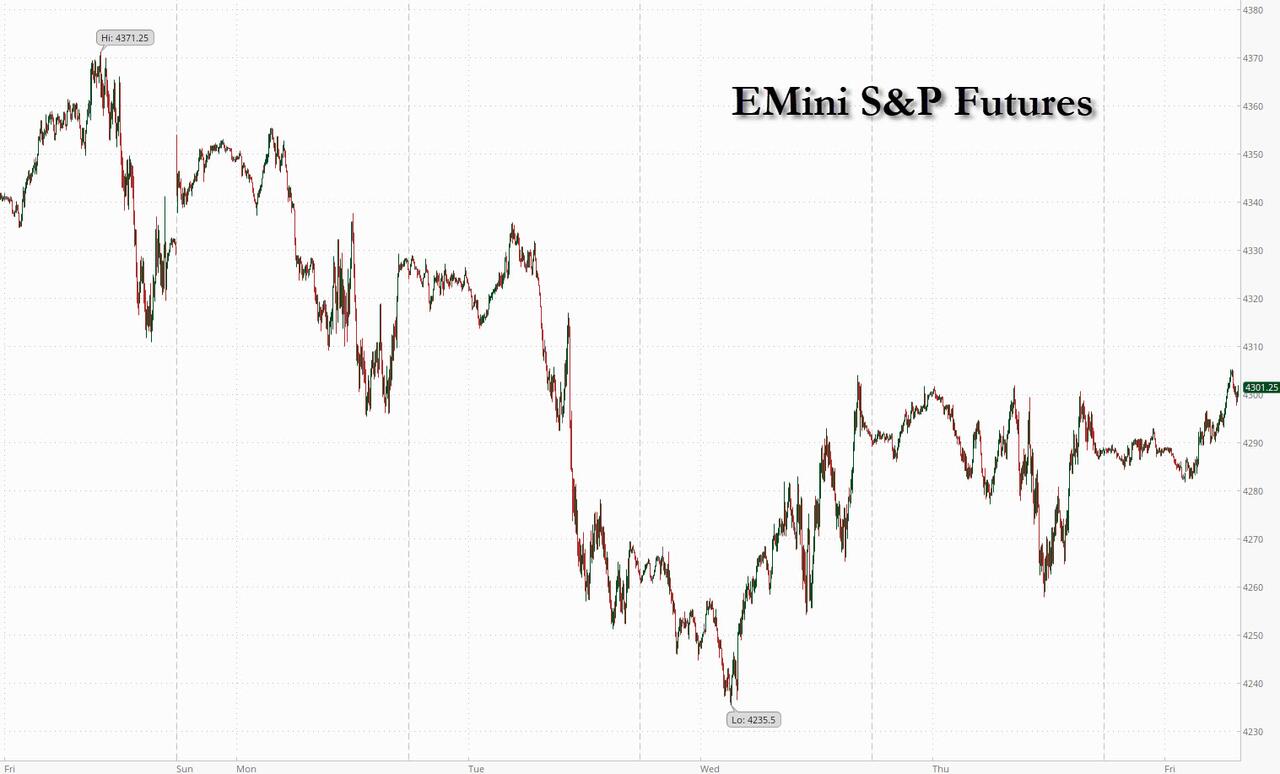
SPX futures continued their decline to 4294.00 before making a bounce.  This may be a typical retracement to 4355.00 which may lend an opportunity to sell/short the bounce.  The Intermediate resistance is at 4377.00 as an alternate target.

Today’s op-ex shows Max Pain at 4345.   Long gamma begins at 4350.00 while short gamma starts at 4320.00.  The dealers’ game is to keep SPX between long and short gamma with a close at or near Max Pain.

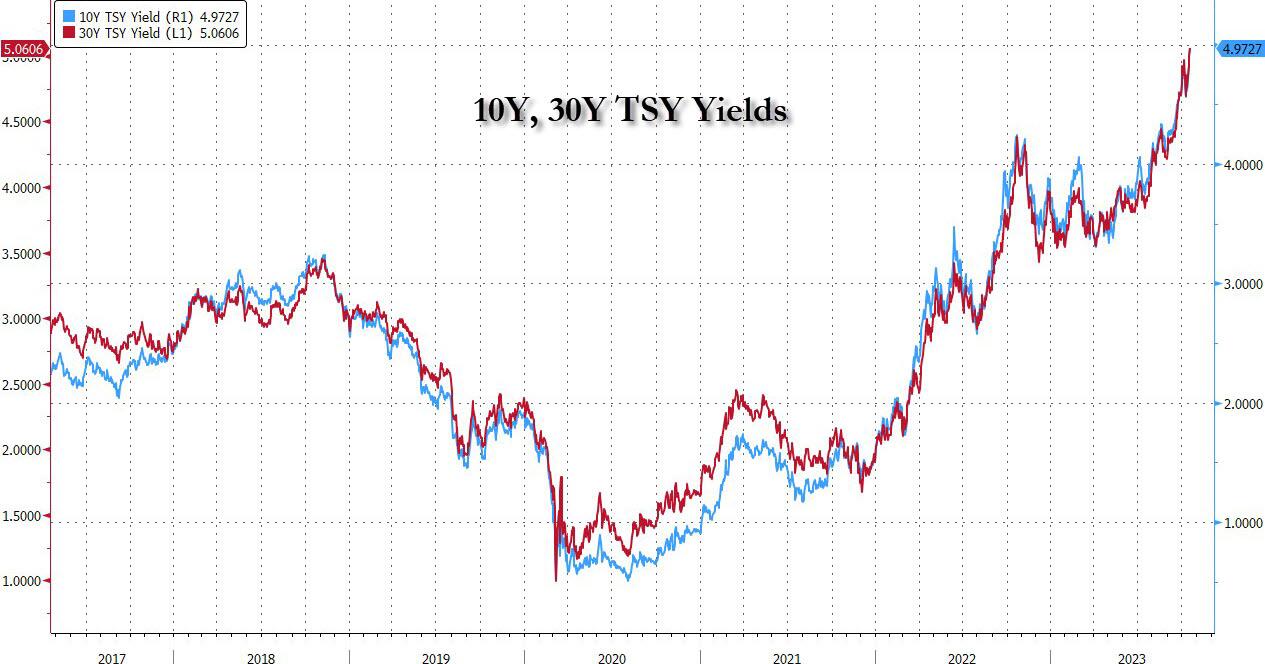
ZeroHedge reports, “Futures dropped and global markets slumped again after treasury yields continued their relentless march higher (until something breaks), draining appetite for stocks as traders tracked earnings news and an intensifying diplomatic push to contain the Israel-Hamas war. Yields on 10-year US government bonds gained for a fourth day, pushing them just shy of 5% for the first time since 2007, while 30Y yields are well above 5% now. Many potential drivers for price action Thursday include weekly jobless claims data and a packed Fed speaker slate headed by Chair Powell at 12pm New York time…

… while the ridiculous explosion in US debt which has increased by over $600 billion in one month, or about $20 billion per day, is not helping.


VIX futures rose overnight to 20.29 before a pullback.  Support may be found at the mid-Cycle support at 17.17.  VIX is on a buy signal and any pullback offers an opportunity to accumulate shares.

Next Wednesday’s op-ex  shows Max Pain at 18.00.  Short gamma has virtually disappeared, while long gamma begins at 20.00.  Pockets of longs extend to 50.00 as sentiment gradually changes.

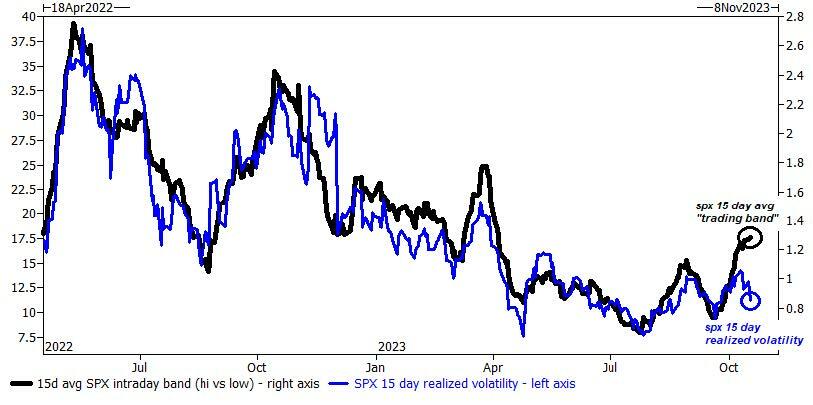
ZeroHedge remarks, “In a market where trader exhaustion is now pervasive and palpable and certainly far greater than the subdued level of the VIX would indicated because, as noted earlier, the gap between the intraday VIX (thanks 0DTE) and the close-to-close VIX has never been greater…”


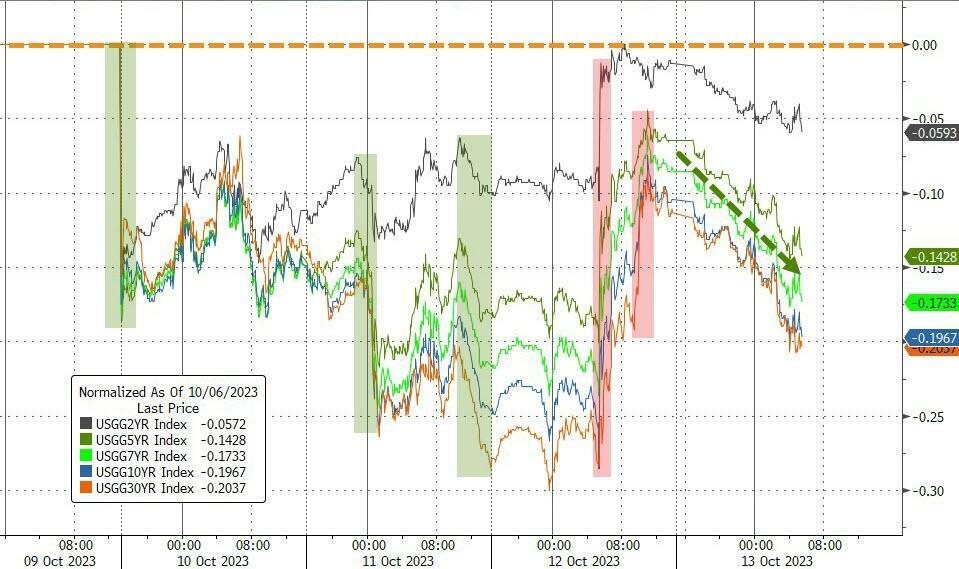
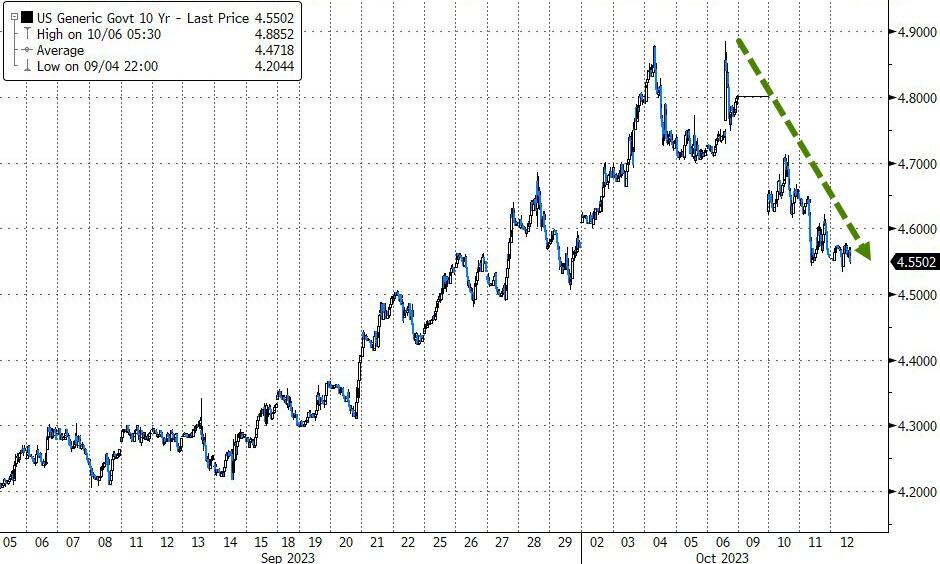
TNX futures surged to an overnight high of 49.87, nearly making the Head & Shoulders target.  This formation was first noted in early August when TNX broke above the neckline.  This trend may continue for another 4-6 weeks, according to the Cycles Model.  US government debt is crowding out all other avenues of financing.

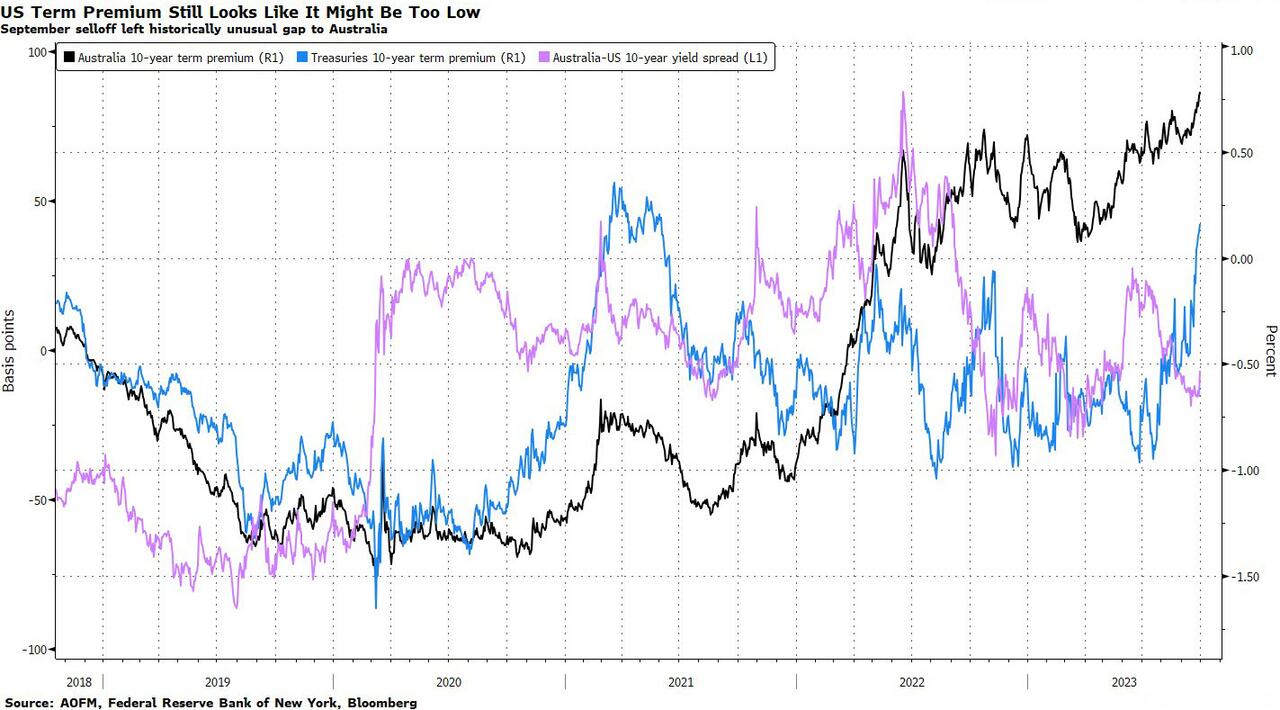
ZeroHedge remarks, “The US government is the only sector to have notably borrowed on a net basis over the last five years. The market sees that as inflationary, driving yields higher.

The pandemic saw an increase in the borrowing of all sectors. But it was the government that saw the biggest rise in GDP terms, and it is the government whose debt is still considerably higher than it was before the pandemic – the debt-to-GDP ratio is up 16 percentage points over the last five years.

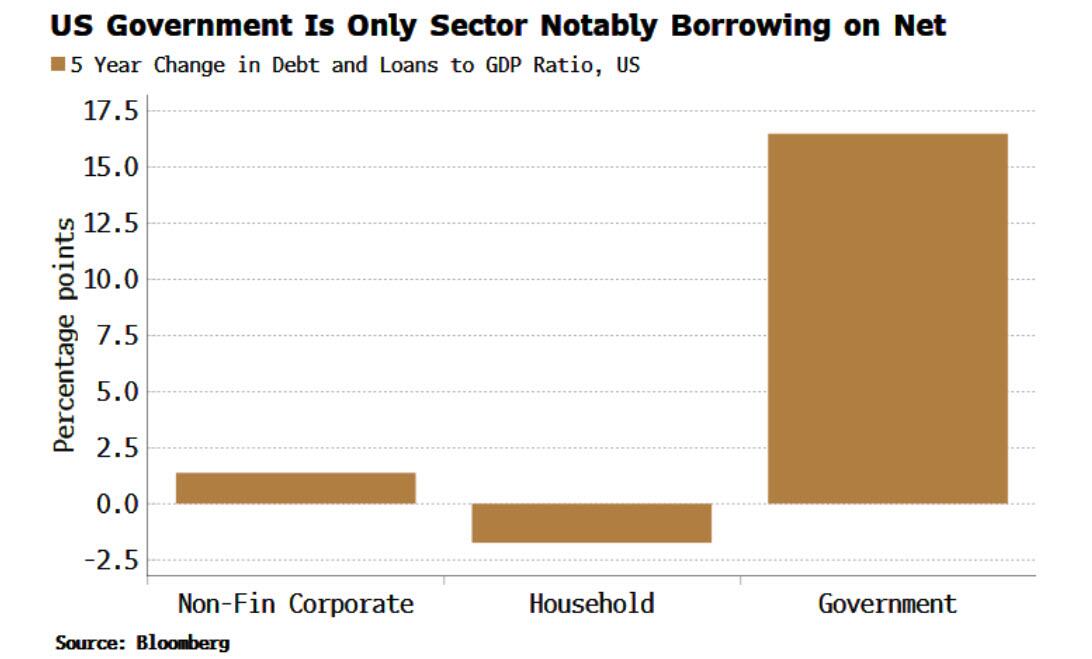
In contrast, the household sector’s leverage is now lower than it was pre-pandemic, while the corporate sector’s is only marginally higher. The US government has become the borrower of first as well as last resort.

The market is picking up on this and is pricing accordingly. We can decompose nominal yields into a sum of expected short rate + real term premium + expected inflation + inflation term premium (see here for more).”

ZeroHedge further elaborates, “$1.2bn per hour

“….US debt adding around $28.5bn per day for 18 days in a row….or put a different way increasing that debt burden by $1.2bn per hour and likely to increase that total debt bill by around $1 trillion in around 6 weeks” (GS trading desk)

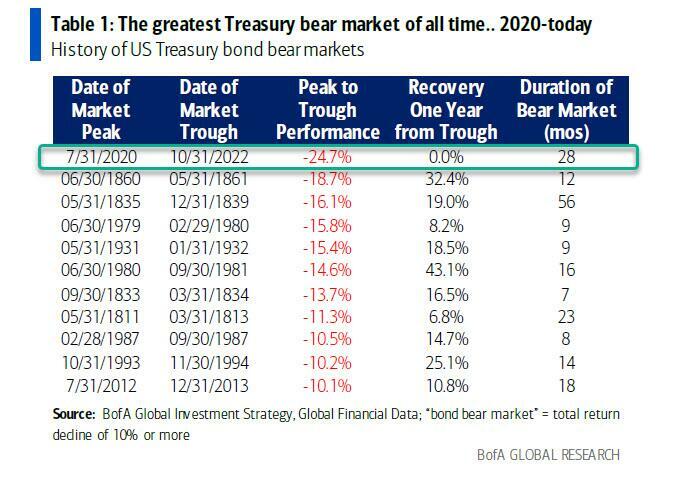
Bonds down 3 years in a row

Looks like it at least… The 10-Yr Treasury bond is down 5% this year, on pace for its 3rd consecutive annual decline. With data going back to 1928, that’s never happened before. The worst 3-year period for bonds prior to now was 1978-1980 w/ a 3% loss for the 10-Yr. What’s the 2021-23 decline? -26%. (Bilello)”


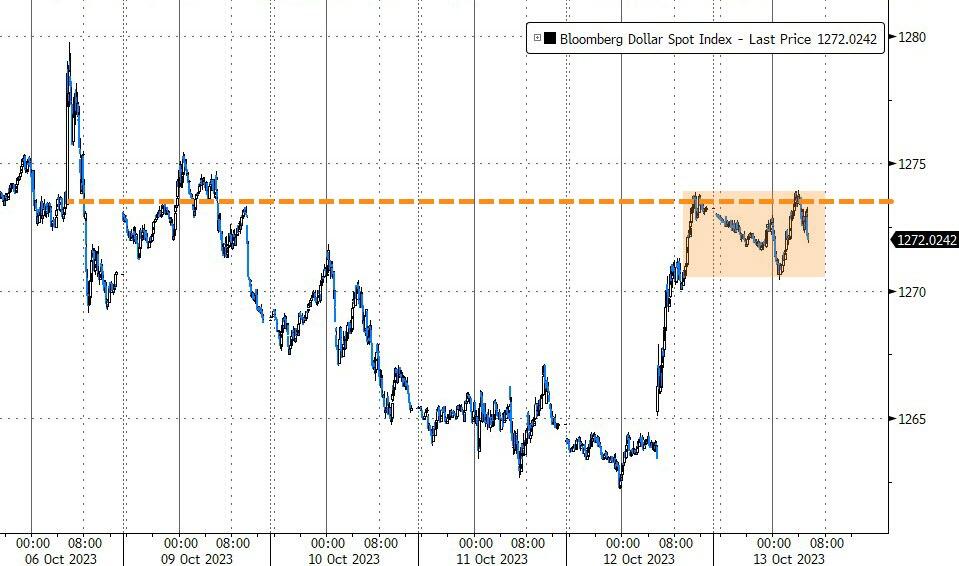
USD futures declined to an overnight low at 106.11, which is beneath the Cycle Top at 106.48.  This may be an indication of a further decline to the 50-day Moving Average at 104.78 to complete the correction in the next few days.


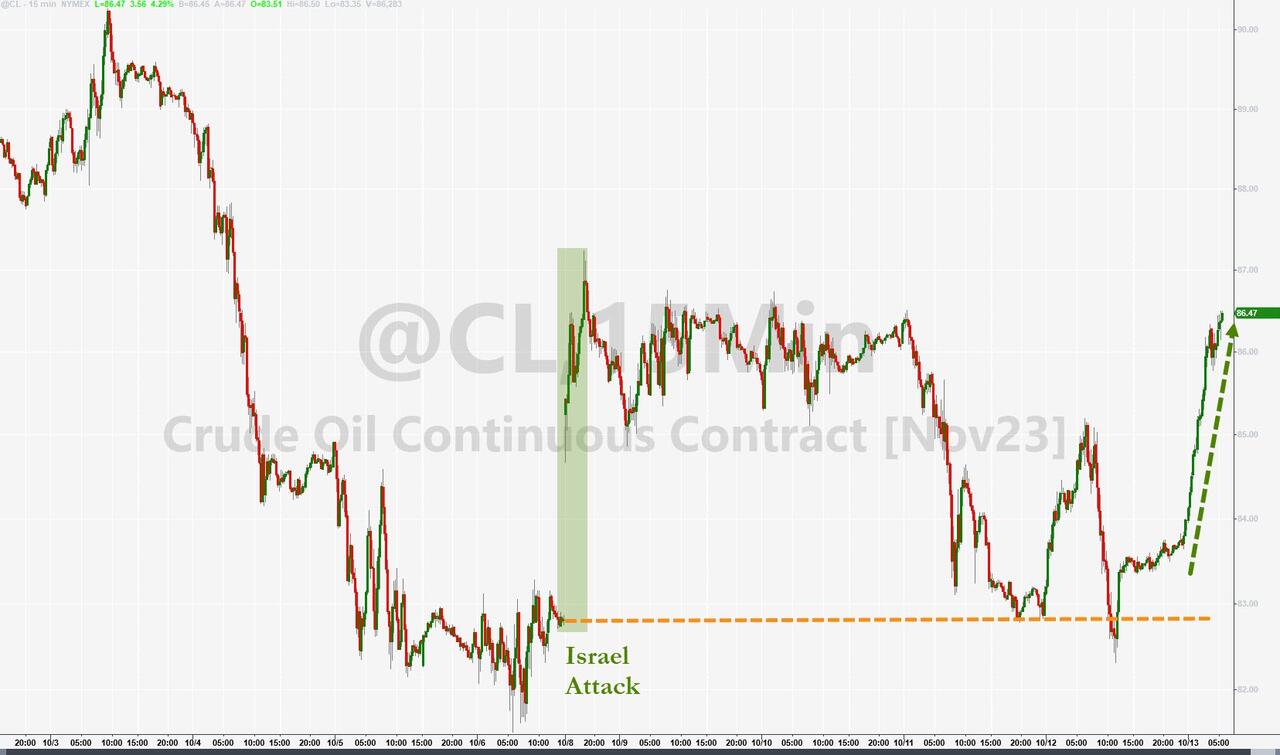
Crude oil futures declined to an overnight low of 85.50, testing the 50-day Moving Average at 85.41.  There may be a final attempt to test the Cycle Top at 90.44.  A failure to overcome this resistance may result in the resumption of the decline.  A confirmed sell signal lies beneath the 50-day at 85.41.

ZeroHedge remarks, “A panicking Joe Biden has realized that his best friends, now that oil prices are soaring again and the SPR remains largely drained, are tinpot banana-republic “dictators” (in the White House’s own words) like Venezuela’s Nicolas Maduro, and on Wednesday the White House suspended sanctions on Venezuelan oil, gas and gold production. But since it would be too corrupt even for Biden to drop sanctions on Maduro in exchange for just a few barrels oil and nothing else, the White House pretended that the deal was in exchange for “promoting democracy”,  and In return the Nicolas Maduro government promised a deal with the opposition that could see elections held next year. Which likely means 100% mail-in ballots and Dominion machines to “count” them.”


Posted in Published | Comments Off on October 19, 2023

October 18, 2023

9:45 am

BKX may have made its reversal today, on day 258 of the Master Cycle.   It was repelled by Intermediate resistance at 78.89 yesterday, giving the BKX an aggressive sell signal.  A further decline beneath support at 75.50 confirms the sell signal.  The Cycles Model suggests a decline lasting up to seven weeks.  This is not a sector to own.

ZeroHedge breaks the first bad news, “Morgan Stanley reported Q3 earnings of $1.38 per share on net revenue of $13.3 bn (better than the $1.22 and $13.2 bn that were expected).

However, while the numbers beat on the top and bottom lines, wealth management revenue disappointed at $6.40 bn versus $6.58 bn expected”


8:00 am

Good Morning!

NDX futures declined to a morning low of 15021.20, beneath both the 50-day and 100-day Moving Averages at 15066.00.  This gives the NDX its sell signal.  Today the 50-day Moving Average makes its bearish cross beneath the 100-day Moving Average.  Today is day 258 in the old Master Cycle.  While the NDX may make a new high in the next few days, the chances become less likely as time passes.  The Cycles Model projects an approximate month of decline.

Today’s options expiration shows Maximum Investor Pain at 15175.00.  Long gamma starts at 15200.00 while short gamma begins at 15160.00, beneath the 50-day Moving Average.

ZeroHedge reports, “In a world where dealer gamma, 0DTE derivatives, positioning, technicals, and liquidity regularly eclipse fundamentals, here are the most important market levels, according to Goldman trader Cullen Morgan (full note available to pro subs).

Summary:

  1. CTA Corner: Goldman has CTAs modeled short -$82bn of global equities (8th %tile). In the US, CTAs are short -$30bn of equities after buying $16bn last week. Per GS model, the CTAs are now buyers of SPX in every scenario over the next week.
  2. GS PB: The GS Equity Fundamental L/S Performance Estimate rose +0.80% between 10/6 and 10/12 (vs MSCI World TR +2.42%), driven by beta of +1.11% (from market exposure and market sensitivity combined) partially offset by alpha of -0.32% on the back of long side losses (link).
  3. Buybacks: This is the final week of the estimated blackout window. As companies have started releasing earnings, we will start to see them enter their open window period. We estimate companies typically enter open window 1-2 days post earnings release. This next open window period is estimated to be 10/23/23 – 12/08/23 (link).
  4. Charts in Focus: Sentiment Indicator, SPX vs. Singles Skew, Call Skew vs. Put Skew, S&P Futures Liquidity, Funding Spreads vs. S&P 500, VIX call volume.”


SPX futures declined to a morning low of 4350.70 thus far.  SPX has not been able to overcome the  50-day and 100-day Moving Averages.  However, it has rose above Intermediate resistance at 4383.76, then declined beneath it, creating an aggressive sell signal.  A decline through the next support at 4337.00 confirms the sell signal.   The Master Cycle high may have been made yesterday at 4393.57 on day 257.  Should that be accurate, the new Master Cycle allows an approximate month of decline.

Today’s op-ex shows Max Pain at 4355.00.  Long gamma begins at 4370.00 while short gamma may begin at 4350.00.  There are over 6000 put contracts at 4300.00, a level to watch closely.

ZeroHedge reports, “US equity futures and global markets dropped, while gold surged and crude oil futures spiked as much as 3% to fresh weekly highs as the conflict in the Middle East escalated sharply despite Biden’s visit to Israel seeking a normalization in tensions, as Arab leaders canceled a summit with US President Biden and as Iran intensified its war of words against Israel. As of 7:45am, S&P 500 and Nasdaq 100 futures lost more than 0.4%, after yesterday’s flat close. Crude’s surged after the foreign minister of Iran, a major oil exporter albeit embargoed, called for an embargo against Israel. Gold prices rose as investors snapped up haven assets.”


VIX futures rose to 18.55 this morning, just beneath the trendline.  VIX is on a buy signal which may be reinforced above the trendline at 18.60.  The Cycles Model suggests the VIX may rally from one month to six weeks.

Today is monthly options expiration in the VIX.  Maximum investor pain is at 19.00.  Short gamma extends from 18.00 down to 14.00.  Long gamma begins at 20.00 and extends to 47.50.


USD futures continue to consolidate beneath the Cycle Top resistance at 106.35.  All indications are that the Master Cycle made a low on October 13.  Should that be correct, the rally may resume imminently, as trending strength resumes by the weekend.


TNX surged to a new high this morning, challenging the October 6 high at 48.87.  Today is day 258 of the (old) Master Cycle.  There is an outside chance of a brief reversal here before resuming the rally.  In either event, the probability of a new high today is large due to trending strength.

RealInvestmentAdvice gives the bullish case for bonds, “Treasury yield levels are overwhelmingly a function of inflation. However, in the short run, a plethora of influences can explain deviations between yields and inflation. These factors, which we call noise, are significant for short-term traders but can hide tremendous opportunities for long-term investors.

As we witness, bond market noise can be deafening. The horror-ridden narratives explaining the sudden rise in yields are compelling. They can steer even the best traders away from a golden opportunity.

For those bullish on bonds, separating the noise from the signal is difficult. But, doing so allows you to alleviate short-term stress when bond prices move adversely. Additionally, it helps maintain confidence in long-term fundamental prognostications. ”


Crude oil futures rose to 88.57 in the overnight market as it probed toward its Cycle Top at 90.33.  The corrective swings are wide and have moved back beneath Intermediate support at 87.55.  There is a probability of yet another probe at the Cycle Top resistance.  However, a sell signal may be generated beneath the 50-day Moving Average at 85.44.

ZeroHedge observes, “Oil prices spiked on Wednesday morning after Iran called for an oil embargo against Israel over its air strikes on Gaza.  Iranian Foreign Minister Hossein Amirabdollahian said there should be an “an immediate and complete embargo on the Zionist regime by Islamic countries, an oil embargo against the regime,” Bloomberg reported citing a ministry statement on Telegram. He also urged Muslim countries to expel Israeli ambassadors.

Amirabdollahian made the comments in Saudi Arabia at a summit of the Organisation of Islamic Cooperation, called to discuss the Israel-Hamas war. The comments came as US President Joe Biden arrived in Tel Aviv in a bid to calm regional tensions and support Israel.

Oil traders are increasingly concerned that Israel’s war on Hamas will spread and potentially draw in Iran and its allies such as Hezbollah in Lebanon.”


Posted in Published | Comments Off on October 18, 2023

October 17, 2023

3:15 pm


SPX exceeded Intermediate resistance at 4383.75 while making an attempt to test the 50-day Moving Average at 4402.75, but fell short of that target.    This has all the earmarks of a final probe in the Master Cycle on day 257.  A reversal beneath Intermediate support/resistance may produce a an aggressive sell signal.  The rally may simply be running out of time.

ZeroHedge comments, “American investors have been taken for a trillion-dollar ride by naked short sellers, in what could turn out to be the biggest financial regulatory scandal in North American history.

While what is now an all-out war on naked short sellers intensifies, there is a new flashpoint on the front line–a potentially devastating ruling targeting those who are alleged to make illegal naked short selling possible: The Facilitators: bankers and brokers.”


9:52 am

BKX, our liquidity proxy, remains persistently elevated primarily due to the healthier. larger banks’ positive earnings reports, thanks to the Fed allowing the money center banks to pick and choose which assets they will assume from failed banks.  While the large banks are staying afloat with burgeoning held-to-maturity (HTM) loans, smaller banks do not have that capability.  In addition, long-term yields are resuming their rally, compounding the problem.  The Cycles Model and associated technical markers imply a waterfall event in the making.

ZeroHedge observes, “Bank of America, the second largest US bank, was the latest big money-center bank to report earnings this morning, and in keeping the trend started by JPM, Wells and Citi last Friday, it not only beat expectations, but reported Q3 numbers that were the strongest in at least seven years as net interest income topped analysts’ estimates as the lender continues to reap the benefits of Federal Reserve interest-rate hikes and market swings.

Here are the highlights:

  • Q3 revenue $25.17BN, up 3% YoY from $24.5BN and beating exp. of $24.94BN
  • Q3 EPS $0.90, up 11% YoY from $0.81, and beating exp. of $0.82


8:20 am

Good Morning!

SPX futures have declined to 4356.50 thus far on day 257 (of a potential 258 day Cycle).  Thus far, three attempted probes higher have been stopped by Intermediate resistance  now at 4387.52.  The 50-day Moving Average at 4405.41 provides additional resistance, should a final attempt be made to break through.

Today’s options expiration shows 4365 gives Maximum Pain to options investors.  Long gamma starts at 4375.00 while short gamma begins at 4340.00.

ZeroHedge reports, “US index futures slid and global markets dropped as yields rose to session highs as complacent investors once again pressed hopes that the Israel-Hamas war could be resolved diplomatically, after Joe Biden said he will travel to Israel to “show his support”, which in turn shifted attention back to the untenable US fiscal situation which meant the blowout in yields would continue. At 8:15am S&P futures dropped 0.3% as traders assessed a flurry of major earnings. 10Y TSY yields rose to a high of 4.76%, spiking 20bps in the past two days and undoing much of the “flight to safety” after the Israel war. The dollar steadied, while the pound fell after cooling UK wage growth reduced pressure on the Bank of England to raise interest rates further. Israel’s shekel gained after weakening past 4 against the greenback on Monday. Brent crude oil traded near $90 a barrel.”


VIX futures have risen to a morning high of 17.98 thus far.  It is on a buy signal (accumulation phase).  The probability of a deeper low is diminishing by the day after a near-Fibonacci retracement of 61.8%.

Tomorrow’s op-ex shows 19.00 heavily subscribed by both puts and calls and may be the Max Pain position.  Short gamma occupies a wide swath between 14.00 and 18.00.  Long gamma begins at 20.00 and is heavily subscribed to 47.50.  This has the potential of a runaway train.

ZeroHedge comments, “The rising wall of corporate loans and debt to be refinanced will increasingly stress company balance sheets, leading to a secular rise in equity volatility.

Tensions in the Middle East are adding uncertainty to the outlook. What does that mean for volatility? So far it has led to at least a temporary rise in equity-market volatility, but in recent years any increase has been fairly short lived, despite the sort of catalysts that would be expected to keep it persistently elevated.

Greater uncertainty, therefore, does not necessarily lead to greater volatility. However, a much surer reason why it is destined to see a structural rise in the coming quarters is mounting evidence that the credit cycle is nearing its late stages.”


TNX has risen to a morning high of 48.13 thus far and may be testing the October 6 high today.  TNX may have made its Master Cycle low on October 12.  Today is a high trending strength day, giving it the ability to break out of any resistance.

ZeroHedge comments, “Treasuries’ recent slump owed plenty to the return of the so-called term premium as investors became more concerned about the risks of holding longer-dated debt. Even as US bonds get some help from geopolitical uncertainty, there’s plenty of scope for yields to march considerably higher on the same dynamics that helped drive September’s spike.

For one thing there’s little chance that the supply outlook is going to improve noticeably, no matter how the Middle East conflict and the US House speaker situation are resolved. For another, an examination of the relative yields for Australian and US debt signals there’s potential that US term premiums have further to go to.”


USD futures emerged from a morning low of 105.90 and surged to a morning high of 106.31 thus far.  A Master Cycle low may have appeared on October 12, day 253 of the master Cycle.


Crude oil futures have declined to a morning low of 84.75, having declined beneath the 50-day Moving Average at 85.25 and confirmed its sell signal.  The Cycles Model suggests a possible 5-week decline in crude prices while analysts predict oil rising to $150.00.

OilPrice.com reports, “Oil is on track to be the largest export item for the United States this year for the first time in history, highlighting the growing influence of U.S. oil production and exports on the global oil market.

Rising U.S. crude oil production in recent years and growing exports after the ban was lifted in 2015 have made U.S. oil an increasingly important commodity on the market, especially after the Russian invasion of Ukraine and the ban and sanctions on Russian crude in the West. ”


Gold futures are challenging the October 13 high at 1944.30.  Today is day 257 of the (former) Master Cycle.  Chances of making a nominal new high are slim.  Should the reversal get underway, a decline to the end of the year is forecast by the Cycles Model.


Posted in Published | 1 Comment

October 16, 2023

10:25 am

The Ag Index may be pulling back after testing the 50-day Moving Average at 399.18.  A probe above the 50-day reinforces the existing buy signal given off the trendline.  This is an indication to accumulate shares of agricultural products and companies.


10:10 am

BKX remains upbeat on day 256 of the Master Cycle, suggesting another probe higher, possible to Intermediate resistance at 79.09 or the 50-day Moving Average at 80.72.  Expect to see a waterfall event to follow.  The decline may continue through the first week of December.

ZeroHedge reports, (after Friday’s close), “Retail money-market funds inflows continued this week, and more troubling (ahead of the coming regional bank earnings), usage of The Fed’s emergency funding facility jumped to a new record high over $109BN. Big banks had a good day today on earnings.

That’s the not-so-rosy picture ahead of tonight’s bank deposit data debacle from The Fed.

On a seasonally-adjusted basis, total deposits declined by $12.4BN (after two big weekly deposit inflows)…


8:00 am

Good Morning!

NDX futures rose to a weekend high of 15066.40, remaining beneath the 50-day Moving Average at 15074.41 and on a sell signal.  Thursday’s high at 15333.98 may have been the Master Cycle high, on day 252.  Should that be the case, we may see the decline gain momentum by Wednesday.  Today is day 256 of the (former) Master Cycle.  A new Master Cycle may have begun that may last up to six weeks.

Today’s op-ex shows Maximum Investor Pain at 15010.00.  Long gamma may begin at 15025.00 while short gamma starts at 15010.00.

ZeroHedge observes, “Apple shares fell in premarketing trading in New York following research indicating that iPhone 15 sales in China lagged behind its 2022 predecessor.

Bloomberg cited a new report from market tracker Counterpoint Research that showed iPhone 15 sales were down 3.5% compared with iPhone 14 over the first 17 days after launch.

Counterpoint said the new iPhone’s sales slump in China was due to a weakening economy. It noted that in the US, iPhone 15 sales were likely to see double-digit growth over the first nine days of sales in 2022 for the iPhone 14.”


SPX futures reached a weekend high of 4347.30 thus far, staying well beneath the 100-day Moving Average at 4392.15.  In addition, not only has the Intermediate support/resistance fallen beneath the 100-day, but the 50 day Moving Average is at 4408.00 and threatens to decline beneath the 100-day in a bearish cross, as well.  This may be a basis for a sell signal in the SPX.  Note that there may be a brief foray to the 50-day Moving Average in the next few days before turning down.  Should this take place, it may set up a clean sell signal.

Today’s op-ex shows Max Pain at 4330.00.  This is a tightly wound options market, with long gamma beginning at 4335.00 and short gamma starting at 4325.00.

ZeroHedge reports, ” US index futures are European bourses reversed earlier losses and traded higher, led by small-caps, as Treasuries resumed their slide after Friday’s gains while oil dropped on hopes that a diplomatic solution may emerge to the Israel-Hamas conflict: Secretary of State Blinken has returned to Israel and Joe Biden could follow on Wednesday or Thursday according to unconfirmed reports, as they seek to avoid an escalation. As of 7:45am, S&P futures were 0.3% higher while Nasdaq 100 futs gained 0.1% after declines on Wall Street at the end of last week. The US Dollar started the session lower and commodities came for sale across all three complexes.  Brent crude oil held near $91 a barrel, after surging almost 6% on Friday. Gold fell but bitcoin surged.”


VIX futures declined to 18.52 over the weekend, remaining above the trendline thus far.  However, it may decline further to 17.50, giving another opportunity to buy the dip.  VIX remains on a buy signal and may remain there until the end of November.

Wednesday’s op-ex shows Max Pain at 19.00.  Short gamma exists between 18.00 and 14.00.  Long gamma starts at 20.00 and extends to 47.50 in six-figure holdings.

ZeroHedge observes,”The geopolitics hedge

Oil volatility is the outperformer on the Mid East situation, although gold volatility is not far behind. Chart shows oil volatility (OVX), bond volatility (MOVE), gold volatility (GVZ) and VIX since September 11.

Source: Refinitiv

Do we see a close above 20?

VIX continues working on the most recent track record. It hasn’t closed above 20 in 102 consecutive sessions…


TNX futures rose to a new weekend high at 47.10 before pulling back.  Thus far, Thursday’s low at 46.32 appears to be the Master Cycle low.  However, today is day 256, leaving a few more days to verify that event.  There is an outside chance for TNX to decline further to Intermediate support at 44.60 or the 50-day Moving Average at 43.66 in the next few days, so stay alert.

ZeroHedge remarks, “Poor liquidity in the Treasury market is contributing to a rise in implied and realized fixed-income volatility. A re-increase in inflation volatility means this dynamic is likely to persist.

Despite being one of the deepest markets in the world, the market for Treasuries has seen liquidity deteriorate in the years since the pandemic. On several measures – bid/offer spread, order-book depth, price impact of a trade – the Treasury market has shown marked signs of a decline in liquidity in recent years.

Bloomberg’s US Treasury Liquidity Index measures liquidity by comparing where yields are to where they “should” be based off a fitted curve. The greater the average of the yield errors across the curve, the worse liquidity is likely to be.”


USD futures have declined to a weekend low at 106.12, beneath the Cycle Top support at 106.28.  This suggests another move lower, perhaps to the 50-day Moving Average at 104.54.  Today is day 257 in the Master Cycle, running it close to the end.  The Cycles Model suggests the new Master Cycle may be running strong by the weekend.


Crude oil futures dropped to a weekend low of 85.67, balling beneath Intermediate support at 87.23.  This puts investors on high alert for a sell signal, to be confirmed beneath the 50-day Moving Average at 85.12.  The Cycles Model infers that the decline may last to the end of November.


Posted in Published | 5 Comments

October 13, 2023

11:02 am

SPX is probing lower today.  A potential sell signal awaits beneath Wednesday’s low at 4325.43.  TNX is recovering after testing its Cycle Top support, which suggests we may see higher yields today.  The market may fall apart as the day progresses.


10:08 am

The Ag Index may be reiterating its buy signal by exceeding its 50-day Moving Average at 391.33.   I have been advocating “accumulating” shares of agriculture products and companies for the past two months, as they may be a long-term buy.

KSAL.com reports, “A former U.S. ambassador who helped to negotiate an iconic agricultural trade agreement with China said that America’s farmers have a bright future if the industry can capitalize on available opportunities for exports, technology and value-added products.

But Gregg Doud – currently the president and Chief Executive Officer of the National Milk Producer’s Federation – said each has its own set of challenges as the U.S. balances world politics and intense competition in the global food market.

“You live in a world today, folks, where total U.S. agricultural exports to the world are about the same as China’s total food imports from the world,” said Doud, in remarks as the 10th speaker in Kansas State University’s Henry C. Gardiner Global Food Systems lecture series on Oct. 9.”


9:55 am

BKX, our liquidity proxy, is on the cusp of a severe decline, larger than that seen in March.  The “good stuff” has been announced in JPM’s stellar earnings.  This may be followed by the “less good” announcements during the remaining market hours and the horrible announcements after hours.   The following article is worth a read in its entirety.

ZeroHedge reports, ”  As happens every quarter, moments ago JPM – the largest US bank – officially fired the starting gun on Q3 earnings season when it reported earnings which – courtesy of the bank’s taxpayer-funded g(r)ift of First Republic earlier this year – were stellar, beating on the top and bottom line, and despite some weakness (in equity sales and trading) and some gloomy comments from CEO Jamie Dimon, were well received by the market: it is the other US banks, and especially the smaller ones, that are a far more concerning prospect, while JPM once again validates its “fortress balance sheet” especially with the benefit of the recent taxpayer-funded fortressization in the form of acquiring all First Republic good assets.”


8:05 am

Good Morning!

NDX futures slipped down to 15092.00 this morning as the rally loses its grip.  Key support lies at the 50-day at 15088.33, below which a sell signal is generated.  While the NDX may keep some equilibrium today, the Cycles Model suggests a likely downdraft generated over the weekend.  This implies market-moving announcements may be released after hours.

Today’s options expiration shows Maximum Investor Pain at 15125.00.  Long gamma may prevail above 15150.00 while short gamma begins at 15100.00.

ZeroHedge remarks, “Rates are back

Massive up candle in the 30 year as rates spike even higher post the latest auction. Today’s candle is much bigger than yesterday’s down candle. Note we almost touched the 21 day earlier today.

Source: Refinitiv

Rates stress remains intact

The gap between the VXTLT and the VIX stays wide. Looks like rates stress has decided to follow the higher for longer path as well…”


SPX futures are consolidating this morning, currently at 4335.40.  SPX was turned back at the Intermediate resistance at 4391.47, indicting the significance of the overhead resistance cluster.  In addition, Intermediate resistance has made a death cross with the 100-dy Moving Average, signifying downside momentum.

Today’s op-ex shows Max Pain at 4330.00.   Long gamma begins at 4350.00, while short gamma starts at 4300.00.

ZeroHedge reports, “US equity futures reverased earlier losses, thanks to solid results from JPM and Citi…

… while treasuries rallied with 10Y yields tumbling more than 10 basis point to session lows below 4.59% and paring almost all of Thursday’s sharp rise in the wake of hotter-than-expected US consumer price data.


VIX futures rose above the mid-Cycle support/resistance at 17.20, reinstating its buy signal.  The Cycles Model implies a period of strength may begin today and may influence the VIX over the next two weeks.

Next Wednesday’s op-ex shows Max Pain at 18.00.  Beneath that are massive sort holdings extending down to 14.00.  Long gamma begins at 20.00 and now extends in six-figure holdings to 45.00.


TNX is testing the Cycle Top support at 46.00 this morning after its blow-out rally yesterday.  Rate jitters are getting extreme, especially after yesterday’s “Horrific” 30-year auction.

ZeroHedge remarks, “After two ugly, Dealer-heavy auctions, moments ago the Treasury concluded the week’s coupon issuance with the sale of $20 billion in 30Y paper, and boy was it ugly.

The auction, a reopening of 29-Year 10-month cusip TT5, priced at a high yield of 4.837%, which was almost 50bps higher than just last month’s 30Y auction (which priced at 4.345%). This was not only the highest stop on a 30Y auction since August 2007, but it tailed the When Issued 4.800% by 3.7bps, the 4th consecutive tail and the biggest since Nov 2021 when we saw a record 5.1bps tail, and the 3rd biggest tail on record.

The bid to cover was ugly, coming at 2.349, the lowest since February. and well below the six-auction average of 2.44%.”


USD futures are currently testing the Cycle Top support at 103.20.  It may be breached in favor of the Intermediate support at 105.24 today.  However, the Cycles Model implies a higher high may be due in the next week.


Crude oil futures spiked higher today, testing Intermediate resistance at 87.00.  The Cycles Model is neutral in the short term.  However, normal retracements may allow a probe to the Cycle Top at 90.07 before reversing lower.

ZeroHedge reports, “While the dollar is relatively flat overnight, both gold and crude are soaring (and bonds bid) as fears of what lies ahead this weekend in Israel and Palestine spark risk-off around the world.

The dollar has gone nowhere since reaching last Friday’s pre-payrolls level…

The Israel-Hamas war hasn’t had any direct effect on global oil supplies and flows so far, but traders are wary that the conflict could disrupt transportation through vital chokepoints or lead to tougher restrictions on Iranian exports. Additionally, the US tightened sanctions on Russian crude exports, which exacerbated concerns about supplies…”


Gold futures punched higher to 1932.00 this morning, crossing the 50-day Moving Average at 1928.00.  Additional resistance lies at the mid-Cycle line at 1944.26.  The Cycles Model suggests that the rally may come to an abrupt end in the next few days, leading to  a possible decline to the end of the year.


Posted in Published | Comments Off on October 13, 2023

October 12, 2023

8:15 am

Good Morning!

SPX futures have now reached a high of 4395.00, testing overhead resistance.  In play are  Intermediate resistance at 4392.25 and possibly the 100-day Moving Average at 4399.22.  Above that lies the 50-day Moving Average at 4417.49 and the declining trading channel trendline at 4425.00, all of which may also be in play.  This has been a very nasty short squeeze that is throwing investors off-sides.   The point in fact is that the Cycles Model still indicates more downside going into monthly options expiration.

Today’s options expiration shows Maximum Investor Pain at 4365.00.  Long gamma begins at 4385.00 while short gamma may start at 4350.00.

ZeroHedge reports, “US equity futures climbed rose for a fifth consecutive session – the longest winning streak since August – ahead of the September CPI report that’s expected to show further slowing in US inflation, which should cement the market’s conviction that the Fed’s hiking cycle is over. As of 8:00am, S&P 500 futures are up 0.4% and above Wednesday’s highs, following almost 1% gain for Estoxx 50, Nasdaq futures rose 0.3%. Treasuries were flat trading at 4.55%, while the dollar is slightly weaker ahead of key US consumer prices data. WTI crude futures are higher by 0.8%, paring Wednesday’s drop as commodities catch a bid with all 3 segments higher.


VIX futures made a new low this morning at 15.85, challenging the 50-day Moving Average at 15.97.  This may end up being a “flat” correction, stopping near the prior low at 15.83, originally designated as the probable target for this correction and a near 61.8% retracement.

Next Wednesday’s monthly op-ex is massive.  Maximum Investor Pain is at 18.00.  Short gamma begins at 16.00, while long gamma begins massively at 20.00 with over 250,000 call contracts.  Six-figure call positions extend to 40.00.

ZeroHedge observes, “Longer term protection

VIX is not overly cheap at current levels as markets aren’t realizing much volatility, but what about the longer term view? Below are a few charts showing how “dislocated” VIX is from various fundamental inputs. Nothing for the short term trading mind, but worth a review.

VIX vs the yield curve

The yield curve offers a very long 30-month lead on volatility, as tight credit conditions slowly disseminate through the economy and markets. We are at the biting point (nominal yield curve), writes Variant Perception.”


TNX has begun to spike higher after the hotter-than-expected CPI report.  This may lead to a final probe to 50.00 or higher by  month’s end.

ZeroHedge shows how the market got it wrong, “Treasuries are liable to being squeezed higher after today’s US inflation data as CTA funds cover their short position.

Bonds have begun to rally off their lows.

10-year yields are over 30 bps off their recent highs, while the Bloomberg Treasury Index is 1.4% off its recent low.

The set-up favors the rally continuing as commodity trading advisors start to cover their bond shorts.”

ZeroHedge also reports on yesterday’s treasury auction, “It wasn’t quite as ugly as yesterday’s 3Y auction, but it certainly wasn’t pretty: moments ago the Treasury sold $35BN in a 10Y reopening (9Y-10M technically), which priced at another cycle high of 4.61%, above last month’s 4.289%, and the highest since August 2007. The auction also tailed then 4.592% When Issued by 1.8bps, which was not only the biggest 10Y auction tail since April, but was the 8th consecutive auction without a stop through (last month’s was on the screws).

The bid to cover printed at 2.50, down from 2.52 last month and the lowest since June.”


USD futures made a new low at 105.30 this morning before beginning a sharp bounce after the CPI announcement.  It quickly reached 105.91 and may be due to break above the Cycle Top resistance at 106.14.


Posted in Published | Comments Off on October 12, 2023

October 11, 2023

12:05 am

BKX (our liquidity proxy) may have made a reversal this morning as time runs out for the downside completion of the current Master Cycle.  The news may come fast a furious as earnings statements are due starting this week.  Regional banks start reporting on Thursday while large banks make their debut on Friday.  Among those reporting on Friday are JPM, Wells Fargo, PNC and Citigroup.


7:45 am

Good Morning!

NDX futures have consolidated beneath yesterday’s high, but have not declined beneath the 50-day Moving Average at 15109.13.  Such action would offer investors a probable sell signal.  The new labeling of the Elliott Waves calls into question whether the Head & Shoulders is still a valid technical structure.  Two reasons are that (1) It is too shallow, and (2) Overlapping Waves are not found in the H&S formations.  Suffice it to say that a resolution of the market direction may be at hand.

Today’s options expiration shows Maximum investor Pain at 15020.00.  Long gamma starts at 15030.00, while short gamma begins at 15000.00.

ZeroHedge comments, “10 year technicals

The US 10 year is down 32 bps since Friday highs as of writing. The 21 day moving average comes in slightly lower, the first support, although the bigger support area is down at the 50 day. This is where the trend line comes in as well, around the 4.35% level.

Source: Refinitiv

NASDAQ needs lower rates

The gap between the two remains short term wide post the latest squeeze in equities, but the move in rates is short term supportive…


SPX futures are higher this morning, but have not exceeded yesterday’s high at 4385.48.  The  bounce was repelled by the combination of the 100-day Moving Average and Intermediate resistance, both at 4393.99.  Note the second bearish cross of moving averages at yesterday’s peak.  This poses an inflection point at a critical Cycle interval allowing a reversal to take place.

Today’s op-ex shows Maximum Investor Pain at 4350.00.  Long gamma starts at 4375.00 while short gamma begins at 4325.00.

ZeroHedge reports, “US equity-index futures gained for a 4th day, rising above 4,400 and benefiting from a fall in Treasury yields which slipped as much as 10bps to 4.54%, the lowest since Sept 29, in a flight to safety move following a report that missiles were fired from Lebanon toward Israel; sentiment was also on edge ahead of the latest US PPI data that could show if investors are right to dial back bets on further policy tightening. As of 7:30am, S&P 500 futures rose 0.3% to 4,405 while Nasdaq futures rose 0.4%. The escalating conflict in Israel meant Treasuries held gains even after Federal Reserve Governor Michelle Bowman said higher rates may be needed to curb inflation. Germany’s 10-year yield dropped six basis points. The Bloomberg dollar index was little changed after five straight days of declines. Luxury giant LVMH dragged European luxury stocks lower.”


VIX futures consolidate within yesterday’s trading range.  The correction may be complete, which may lead to an explosive move higher.  An alternate view suggests the resumption of the rally may be postponed for a week because of monthly options expiration on October 18, which appears to be a ticking time bomb.

Today’s options expiration shows Max Pain at 18.00.  There is little short gamma, while long gamma begins at 19.00 and goes to 42.50.

Next week’s (monthly) op-ex show Max Pain at 18.00.  Short gamma is massive between 14.00 and 17.00.  Long gamma begins at 20.00 and extends to 47.50.


TNX may be bouncing off the Cycle Top support at 45.74 to complete its corrective action.  Having done so, it may resume the rally forthwith.  What may ensue is a rally lasting approximately a week that may met or exceed the Head & Shoulders target.  Whether the TNX reacts to an external event or simply completes its pattern, this move may shake the entire market.

ZeroHedge comments, “On October 5, 2023, Treasury Secretary Janet Yellen made a very telling statement about the future course of interest rates.

YELLEN SAYS DEBT SERVICE COSTS WILL BE 1% OF GDP FOR THE NEXT DECADE. – Reuters

Her statement implies that the economy will be strong and the government will run budget surpluses, or interest rates will be near zero for the next ten years.

Instead of guessing what she is pondering, we do some math and arrive at the only possible answer. ”


USD futures made a morning low of 105.35, just above Intermediate support at 105.10.  The Correction may be complete, or nearly so.  The Cycles Model suggests the USD may have at least another week of rally.


Crude oil futures declined to a morning low of 83.34, crossing beneath the 50-day Moving Average at 84.92.  The inability to hold at critical support reinstates the sell signal.  The Cycles Model suggests the decline may last up to 6 more weeks.  Despite the dynamice in the Middle East, this is not a time to be long oil.

OilPrice.com observes, “U.S. crude oil exports hit record highs in the first half of the year, averaging 3.99 million bpd—up nearly 20% from the first half of 2022, the EIA said on Tuesday.

The largest share of U.S. crude oil that is exported made its way to Europe, at 1.75 million barrels per day—mostly to the Netherlands and the United Kingdom. Asia was the second-largest destination 1.68 million bpd, with the largest portion heading to China and South Korea.

Despite its record, the United States remained a net crude oil importer in the first half of the year, according to EIA data, even with increasing domestic production, importing 8.836 million bpd in June—nearly half of which came from Canada. Refineries in the United States are geared to process heavy, sour crude oil, while most of the oil produced in the United States is light, sweet crude.”


.


Posted in Published | Comments Off on October 11, 2023

October 10, 2023

9:42 am

Today’s probe higher  in the BKX may be the final push in this correction.  The Head & Shoulders formation may be due to hit its target before the end of October.  The implications are enormous, should it come to pass.


8:15 am

Good Morning!

SPX futures rose to 4347.40 in the overnight session.  SPX finally hit the 4335.00 target, as discussed for the past two weeks.  The length of time to accomplish this is confusing many into thinking that the bear market is over.  It is not.  The Cycles Model calls for a possible two more weeks of decline.  Although treasuries have given some respite, their bear market is not over, either.  Finally, bank earnings reports are due starting later this week.  It could get very messy.  In the meantime, the short-term outlook contains a possible probe toward 4375.00 before a reversal may be made.  This dynamic may magnify the decline, with a high probability of reaching or exceeding the October low.

Today’s options expiration shows a closely matched contest between the puts and calls at 4300.00.  Long gamma may start at 4320.00-4335.00, while short gamma begins at 4280.00.

ZeroHedge reports, “Futures are modestly higher, but well off session highs, led by small-caps as bond yields fall 10ps in the long-end of the curve after dovish comments by Fed officials and reports of more economic stimulus from China brought some risk appetite back to markets while investors continue to evaluate the potential impact of the Israel-Hamas conflict. Asian and European shares also rallied. At 7:45am ET, futures on the S&P 500 and Nasdaq 100 rose about 0.1% after Monday’s solid gains on Wall Street which took place with the Treasury cash market closed.

BBG reported that China may use an additional $137bn in fiscal stimulus to achieve growth targets, although as usual the market balked at the number which it viewed as too little. Treasuries jumped, catching up with Monday’s global government bond rally, when cash trading in the US was closed. The yield on the policy-sensitive 2Y Treasury dropped by the most since the end of August, while the benchmark 10-year had its best day since March. The dollar was steady after four days of declines. Commodities are muted despite the bullish China news; the USD is weaker for the 4th day in a row as the market appears to disregard geopolitical risk. Today lacks any major macro data with PPI tomorrow and CPI Thursday, while bank earnings kick off later this week.”


VIX futures have remained remarkably resilient in the overnight session, declining to 17.52.  It remains above the mid-Cycle support at 17.26.  While it may retest that support again today, the uptrend is firmly in place for the VIX.


TNX futures bottomed at 46.20 late last night as bonds were due for a brief correction.  There are several factors suggesting higher yields are yet to come.  First, the technical outlook suggests that TNX may exceed 50.00 by the end of the month.  Second, banks may view this reprieve as an opportunity to sell duration.  Third, China remains a seller of treasuries.  Fourth, a yield-induced accident is overdue.  Fourth, expectations are that yields will be lower from here (see below).

ZeroHedge observes, “A new market survey of Deutsche Bank clients finds smart money anticipates economic trouble ahead as extreme hawkish policy by central banks could trigger a ‘bigger financial accident’ and or ‘serious financial stress.’

Deutsche Bank’s Jim Reid wrote in the note that a global financial market survey was conducted between Oct. 3-6 and had 410 client responses worldwide. He said, “We take a look at expectations of central bank policy error, US recession risks, and financial market forecasts.”

The first question in the survey asked, “From its current levels, will the next 100bps move in 10yr USTs be higher or lower? (yields averaged c.4.75% during the survey).”

Most respondents (75%) believe the next 100bps move in the US 10-year bond yield is down.”


USD futures have reached an overnight low at 105.53 and may test support at the Intermediate level at 105.06.  The Cycles Model suggests the current uptrend may last at least another week.


Crude oil futures have eased back from Intermediate resistance at 86.57.  Monday’s bounce was needed to relieve the oversold pressure as shorts either took profits or were stopped out.  There may be a few more days of consolidation before the next leg down.  A decline beneath the 50-day Moving Average at 84.60 reinstates the sell signal.

Oil-Price.com states, “The world needs $14 trillion in cumulative investments in the oil sector by 2045 to ensure market stability and avoid energy and economic chaos, OPEC said in its annual World Oil Outlook on Monday.

The annual investments need to be around $610 billion on average, the bulk of which should go to the upstream segment, the cartel said, rebuffing calls for a halt in investments in new supply.

The cumulative investments in the upstream need to be around $11.1 trillion by 2045 or an average of $480 billion per year. Downstream and midstream requirements are estimated at a total of $1.7 trillion and $1.2 trillion by 2045, respectively.”


Posted in Published | Comments Off on October 10, 2023

October 9, 2023

8:15 am

Good Morning!

SPX futures gave back roughly half of Friday’s gains over the weekend, making a low of 4267.50 before a bounce.  It has yet to probe the 200-day Moving Average at 4206.37 that may determine the nature of this decline.  The Cycles Model suggests another two weeks of decline should the 200-day be violated.

In today’s options expiration, 4300 is heavily contested, with 8,822 call contracts vs 6,358 put positions.  Long gamma may begin there with follow-through starting at 4310.00.  Short gamma begins at 4275.00 with reinforcements at 4250.00.

ZeroHedge reports, “US equity futures, Asian and European stock markets and bond yields all dropped while oil prices and the dollar jumped in a global rush for safety after the sudden war between Israel and Hamas raised fears of a wider conflict. Investors avoided traditionally risky assets such as stocks and instead bought gold, bonds and the dollar. As of 7:45am,S&P futures dropped 0.6% to 4314, after earlier trading as low as 4,300 and reversing much of Friday’s brutal squeeze higher, while Europe’s Stoxx 600 slipped 0.2%, having traded between gains and losses. West Texas Intermediate jumped 4% to almost $86 a barrel, after earlier surging more than 5%, spurring a rally among European energy producers while Defense stocks such as BAE Systems and Saab AB also rose. Gold climbed 1% and index of dollar strength added 0.3%. ”


VIX futures shot up higher, reaching 19.60 before settling above the trendline at 18.30.    There may be a risk that the VIX may probe lower to the 50-day Moving Average at 15.77 before resuming its uptrend.

Wednesday’s op-ex shows Max Pain at 18.00, with short gamma extending to 15.00.  Long gamma begins at 19.00 and has support to 42.50.


Treasury markets are closed today, but the early morning futures show a decline beneath  Friday’s close.  However, TNX is in the midst of a spurt of trending strength which may cause the rally to resume after the close of market hours.

ZeroHedge remarks, “There was a remarkable chart in the latest Flow Show note from BofA resident bear Michael Hartnett: after peaking in July 2020 and in the subsequent 28 months drawing down by a record 25%, this is now the single greatest bond bear market of all time!

Considering that BofA’s historical data goes back 236 years all the way to the founding of the republic, this is a jarring statistic, and a poignant reminder of the magnitude of the pain rippling through the financial world in the aftermath of an inflation shock and interest-rate surge that few saw coming… a shock which Deutsche Bank last week quantified as a $70 trillion Mark to Market hit to duration portfolios (while some may claim it’s not a loss unless you actually sell the bond, the truth is that any bond which is pledged as collateral in the repo markets or elsewhere is valued daily, and the cumulative haircut assuming all eligible duration was pledged is, drumroll, $70 trillion).”


USD futures probed lower to 105.89, venturing beneath the Cycle Top support at 106.04.  Should it remain above the October 6 low at 105.68, the rally may resume in strength.   However, there is the risk of a deeper retracement before the Cycle completes to the upside.  The lack of direction given by the closure of the Treasury market today may give a brief respite to the ongoing rally in USD.


Crude oil futures rallied to a weekend high of 87.23 before settling back down to the 50-day Moving Average at 84.66.  The bounce, at its extreme, retraced 43.5% of the decline.  This does not qualify as a change in trend, despite the magnitude of the move.

ZeroHedge notes, “Just days after the fastest drop in the price of oil in over a year (when mere days earlier Brent almost touched $100), the oil market is facing yet another potential kneejerk shock, this time in the opposite reaction.

In response to the sudden war between Israel and Hamas which could escalate and potentially drag in states such as Iran, Goldman’s commodity desk has laid out its thoughts on how the oil market may react. We excerpt the highlights below (full note available to pro subs).”


Gold futures rose to an overnight high of 1869.15 before consolidating.   The Cycles Model suggests a possible rally toward the Lip of the Cup with Handle formation near 1900.00.  There is approximately a week left in the current Master Cycle, reinforcing te idea that a further rally may be needed.


Posted in Published | 2 Comments

October 6, 2023

2:26 pm

Try as it might, BKX is having trouble making a normal retracement (79.77).  There are just a couple hours left.  The Cycles Model suggests all hell may break loose over the weekend.  Brace yourselves.


11:00 am

It is fascinating that the SPX sold off to the trading Cycle bottom at 4219.53, then rallied back up to a near round trip.  As indicated in the Cycles Model, the collapse may start in the next hour or two…

ZeroHedge observes, “Risk sentiment has been hit lately and while investors can find some green shoots of market stabilization in the past few days, it would be brave to call a bottom just yet.

Markets have been served a toxic cocktail of higher real and nominal yields, a strengthening US dollar and rising oil prices in combination with automated selling and forced de-risking of portfolios. This big multi-asset wave came at the wrong time for a stock market left vulnerable by summer weakness and low liquidity.

“What’s scary is that thematically, we are seeing cross-asset markets voting with their feet and lending credibility to the idea that the recent shock tightening move in US financial conditions is indeed going to accelerate hard landing risk,” notes Nomura strategist Charlie McElligott.”


7:55 am

Good Morning!

NDX futures are pressing at yesterday’s high at 14786.69.  Its intended target may be the 100-day Moving Average at 14949.25.  The Cycles Model suggests that time for this rally may be running out by mid-day, regardless whether it makes its intended target or not.  Don’t let the gradual glide path thus far fool you.  There is a potential for 2-3 limit down days in the next 2-3 weeks.

Today’s op-ex shows Maximum Investor Pain at 14720.00.  Long gamma starts at 14750.00, while short gamma begins at 14700.00.  There’s not a lot of room for error.

ZeroHedge remarks, “Investors are anticipating the Federal Reserve is close to the end of its tightening cycle.

Every surge in bond yields spurs fresh speculation the economy will break badly enough for policy makers to pivot rapidly away from their hawkish stance. That may set up bonds and stocks for a tough time even if Friday’s payrolls report comes in on the soft side.

That’s because even the recent rout in Treasuries only managed to push US financial conditions to a neutral level, based on a Bloomberg gauge, well short of the sort of restrictive impact the Fed would seem to be wanting to achieve. That also helps explain the still-resilient state of the economy — Bloomberg’s US data surprise index remains at elevated levels.”


SPX futures made a new retracement high at 272.20 as it probe toward the Head & Shoulders neckline.  The Cycles Model suggests the uptick may be over by noon today.  Be prepared for a possible waterfall event, with multiple “limit down” days due to surges in trending strength over the next 2-3 weeks.

Today’s op-ex shows Max Pain at 4255.00.  Long gamma starts at 4270.00 while short gamma erupts at 4250.00 and remains strong to 4050.00.  The market is on a tightrope with no nets.

ZeroHedge reports, “Global stocks and US index futures gained ahead of the September payrolls report (exp. payrolls 170K, unemp 3.7%, full preview here) that could potentially ease pressure on the Federal Reserve to raise interest rates again. At 7:45am ET, S&P futures rose 0.1%, after falling by a similar amount on Thursday while the tech-heavy Nasdaq 100 rose 0.2%, after slipping 0.4% the day before. Shares climbed in Asia and Europe, while mainland Chinese markets remain shut for a weeklong holiday. Treasury yields extended their advance, with the 10-year hovering around 4.74% after reaching 4.88% earlier this week. The Bloomberg dollar index was little changed. Oil was also little changed, halting its decline this week. All eyes on today’s NFP release at 8.30am, which is the near-term focus to set narrative: consensus expects NFP to print 170k and the unemployment rate to print 3.7%.”


VIX futures are consolidating this morning, poised to go in either direction.  A normal retracement may take the VIX down to 16.50, but the mid-Cycle support at 17.27 may hold, instead.  Expect to see a shock to the markets either today or early next week.

Next Wednesday’s op-ex shows Maximum Investor Pain at 18.00.  Short gamma is in short supply while long gamma reaches from 19.00 to 42.50.

ZeroHedge reports, “With everyone – even the most hardened bulls – expecting the September jobs report to be not only the weakest of 2023 but to presage a big drop in future payrolls data, moments ago the BLS reported that in September the US added a whopping 336K jobs, the highest monthly increase since January…

… and not only double the consensus estimate of 170K, but above the highest sellside estimate of 250K!”


TNX surged to a new high this morning on the monthly Employment Situation Survey.  The surge is likely to bring chaos to the markets.  Yields continue to rise as I report this event.

ZeroHedge speculates, “Can the system take it?

DB’s Jim Reid with a serious question, although the calculations are a bit simplified. Things that make you go hmmm: By H1 2023, global debt reached $307tn. Not all is tradable, with the Bloomberg Global Agg peaking at $70tn two years prior. Since then, it’s down 23%, indicating a $16tn global market value loss. Projecting this drop across all global debt hints at a $70tn loss. For context, global equities are worth $107tn, and the 2023 global economy is projected at $105tn. These estimates have caveats, but the scale of losses in the debt markets is historically unprecedented both in dollar terms and relative to GDP, raising questions about the system’s resilience.”


USD futures surged to 106.71 this morning on the Jobs Report.  More to come.


Posted in Published | Comments Off on October 6, 2023