November 6, 2023

11:13 am

BKX (refresh to update) may have begun its reversal after making a Master Cycle high on Friday.  The Cycles Model infers a month of decline lies ahead.

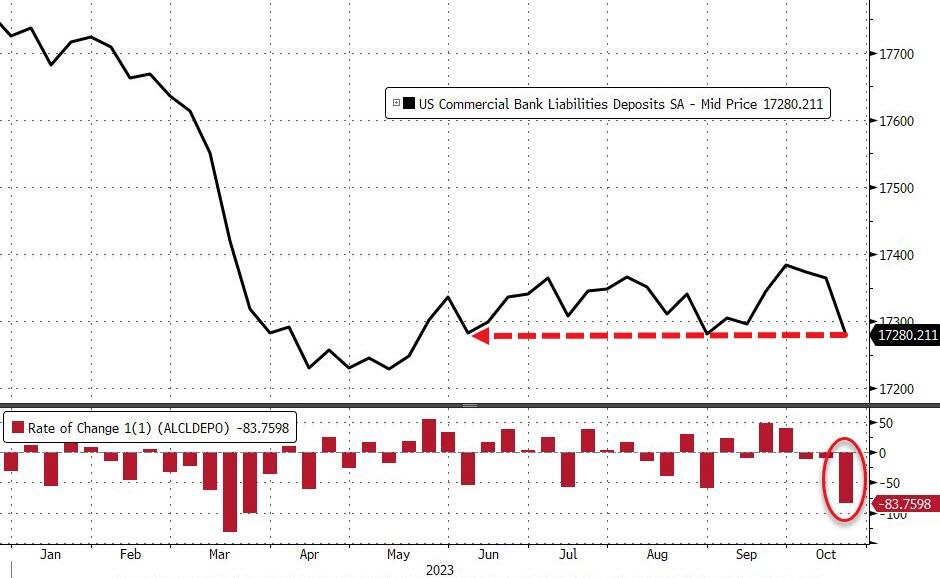
ZeroHedge remarks, “Bank stocks soared this week (along with everything else) despite another jump to a new record high for bank’s usage of The Fed’s emergency funding facility, and the massive deposit run the prior week.

Probably better not to show Bill Gross this chart…
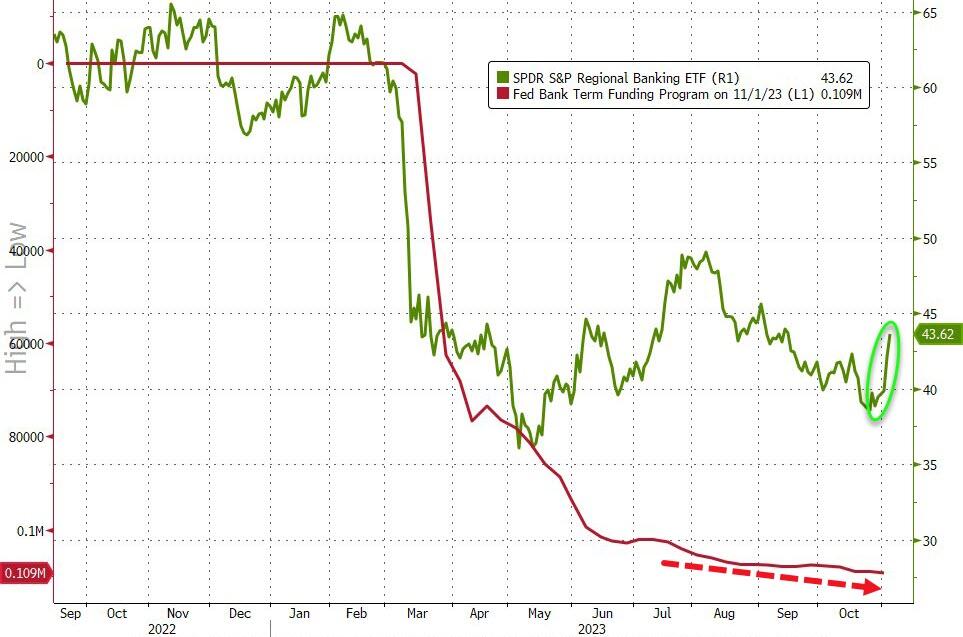
Source: Bloomberg

So, what fun and games will The Fed do this week to ‘adjust’ the data so we don’t panic about a sudden bank run?”


7:45 am

Good Morning!

NDX futures are consolidating just beneath Friday’s intra-day highs and trendline at 15150.00.  The 100-day Moving Average is at 15083.54.  A decline beneath that level creates an aggressive sell signal.  A further decline beneath the 50-day Moving Average at 14953.00 confirms the sell signal.  NDX is at maximum resistance.

Today’s options expiration shows Maximum Investor Pain at 14900.00.  Long gamma begins at 14975.00.  Short gamma starts at 14850.00.

ZeroHedge observes, “Easy tiger

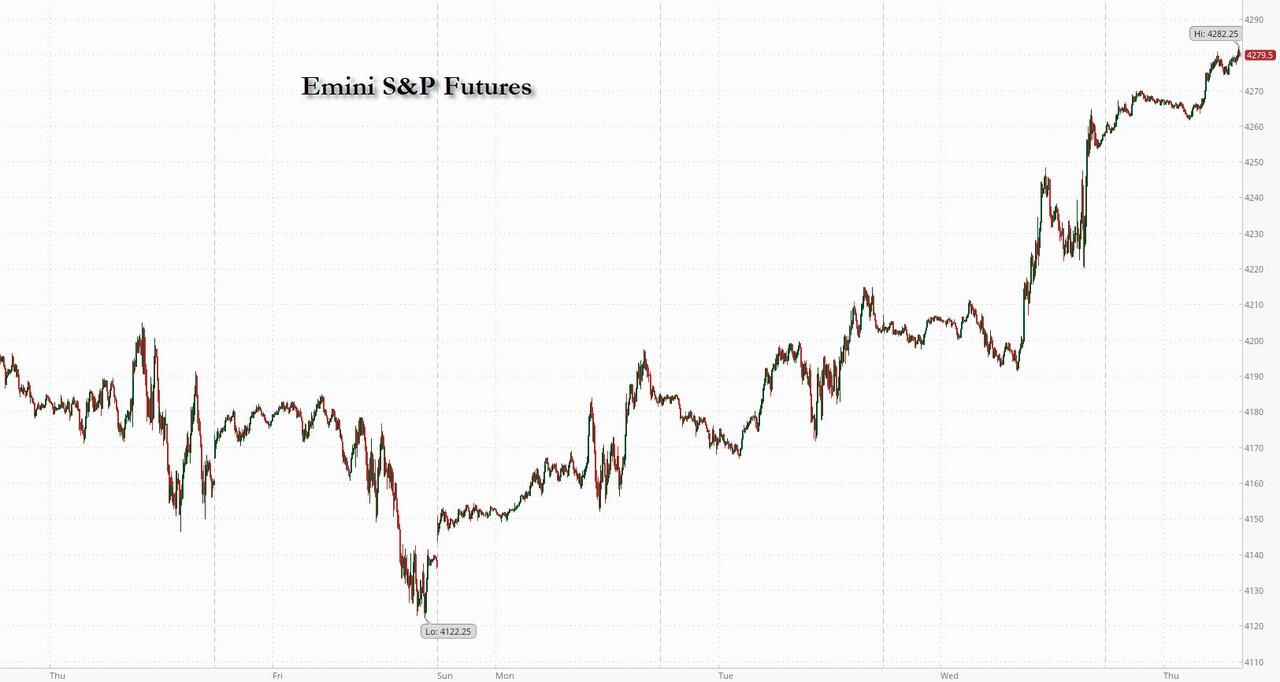
SPX’s perfect short term trend channel has stayed intact. The huge squeeze has taken the index back to channel highs. 4400, give or take, is a big resistance area. Note the 100 day coming in around 4425. The “easy” part of the “bounce” is over, now comes a much more tricky phase.

Source: Refinitiv

NASDAQ – show me the trend

NASDAQ is trading at the same levels we traded at in mid June. The index has actually been stuck in a range, with one bigger overshoot, and one bigger undershoot. We are right at the 100 day post the furious bounce.”


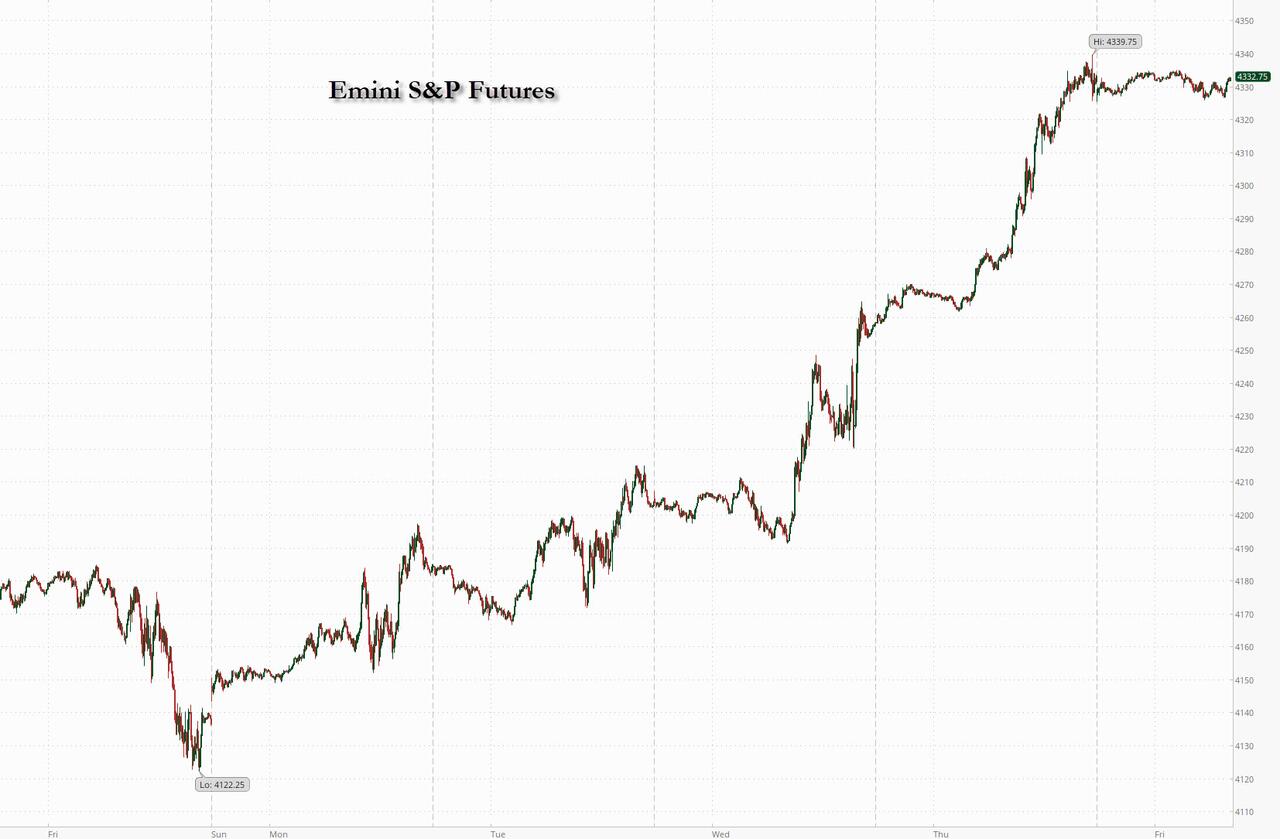
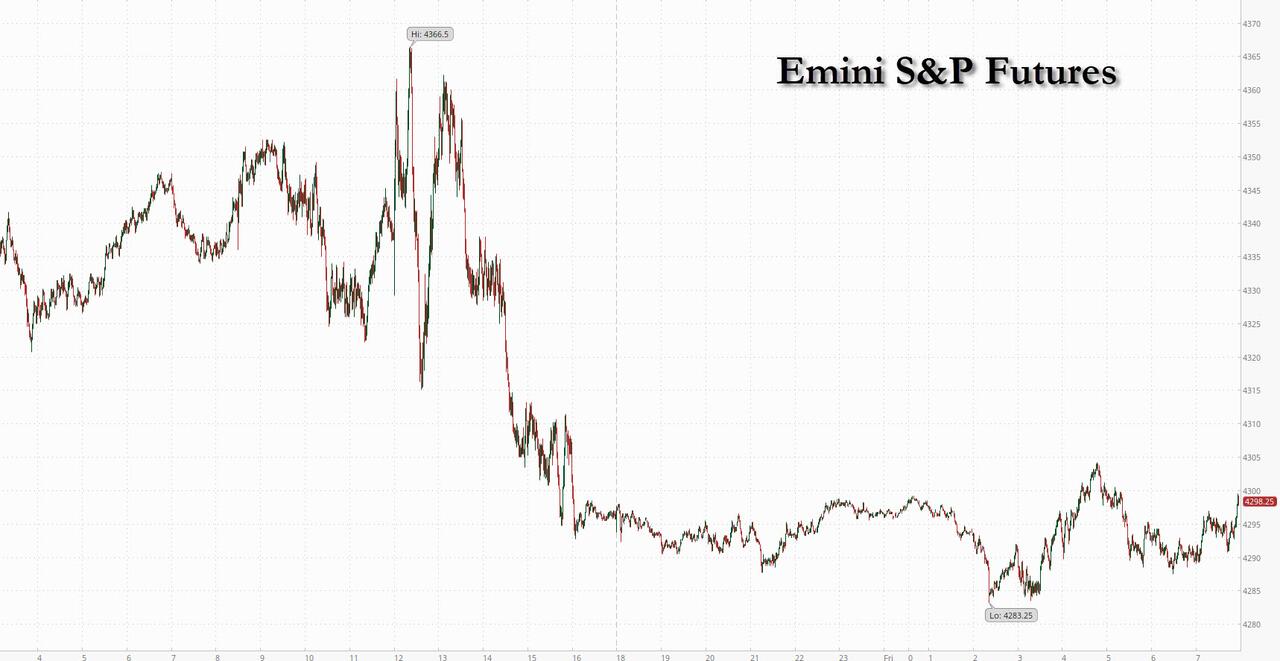
SPX futures are also consolidating just beneath the trendline at 4375.00.  You will notice that the last three Master Cycles ended at the upper trendline.  The current Master Cycle has nearly another month to go.  For the first time since March, it may end up at a new low.

Today’s op-ex shows Max Pain at 4350.00.  Long gamma may begin at 4370.00-4380.00 while short gamma may start at 4330.00.

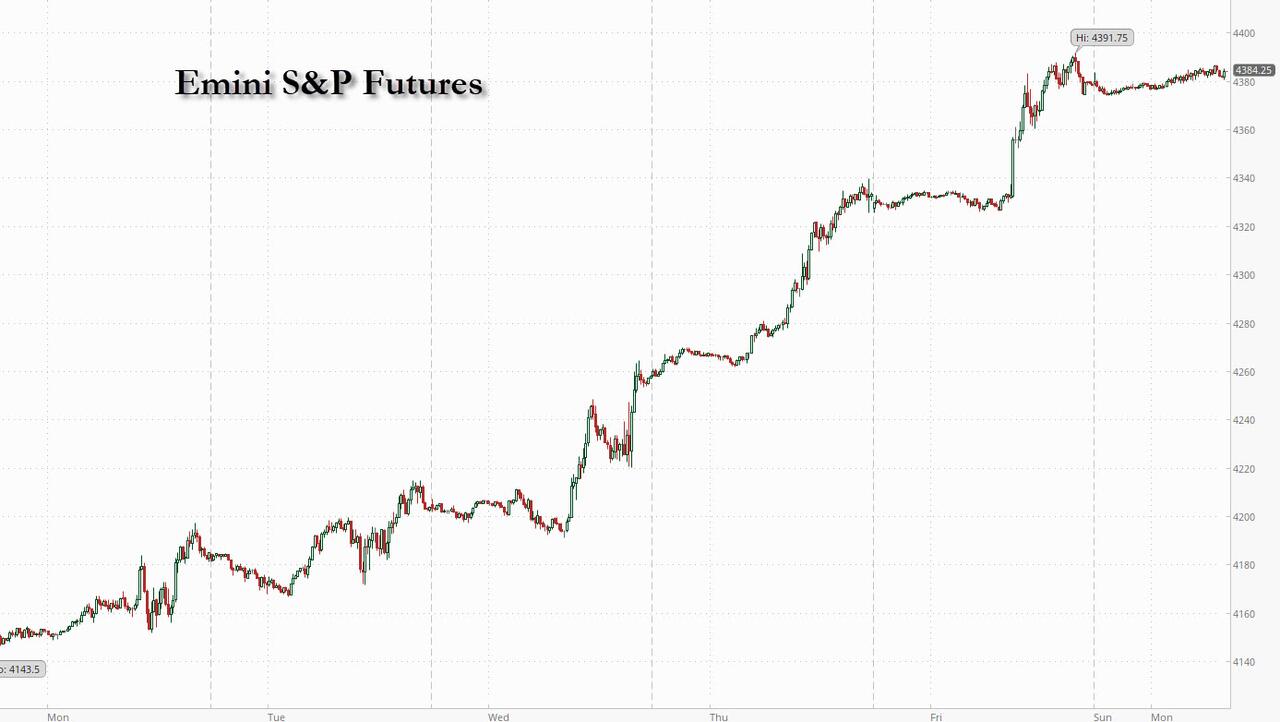
ZeroHedge reports, “US equity futures extended gains after last week’s blockbuster rally, the biggest of the year, despite some weakness in bonds, as traders remained optimistic that US and European central banks may start cutting interest rates as soon as next year. As of 7:40am, S&P emini futures were higher by 0.2%, near top of Friday’s range, while Europe’s Estoxx 600 dropped 0.2% with materials leading declines. South Korea’s Kospi soared more than 5% after regulators banned short selling. The dollar fell for a fourth day. Crude futures rose more than 1.5% after Saudi Arabia and Russia reaffirmed they will stick with their supply curbs through year-end. Bitcoin continued its ascent, last seen above $35K, with Ethereum rising above $1900. ”


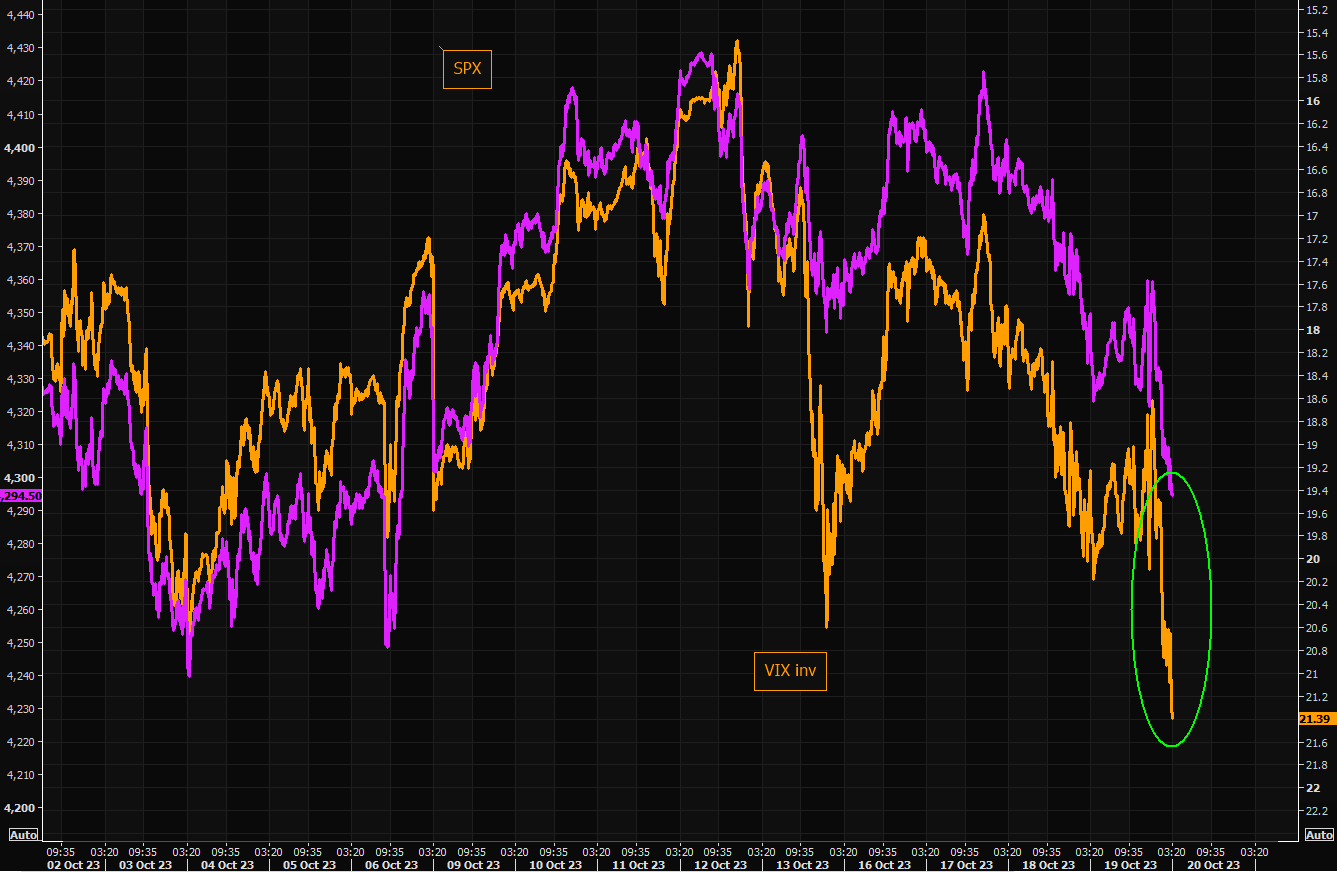
VIX futures are consolidating near their low.  While the Cycles Model only suggested a half-Trading Cycle low on Friday, the depth of the decline was unusual.  The Cycles are making a comeback with trending strength returning at the end of the week.

Wednesday’s op-ex shows Max Pain at 15.50.  There is no short gamma beneath 15.00.  Long gamma may start at 17.00 and extends to 50.00.


TNX has bounced from Friday’s low and is climbing as I write.  It is back above the 50-day Moving Average at 45.52 and is on a buy signal.  The Cycles Model shows a steady rally out of the low with strength returning next week.  A possible high at the end of November may be 53.00.

ZeroHedge comments, “The ‘smart’ money may not be…

Just before US Treasury bonds saw their best week of 2023 (with the last 3 days seeing yields crash at the fastest pace since the COVID lockdowns of March 2020), hedge funds decided to add to their TSY Futures shorts (to a new record high).
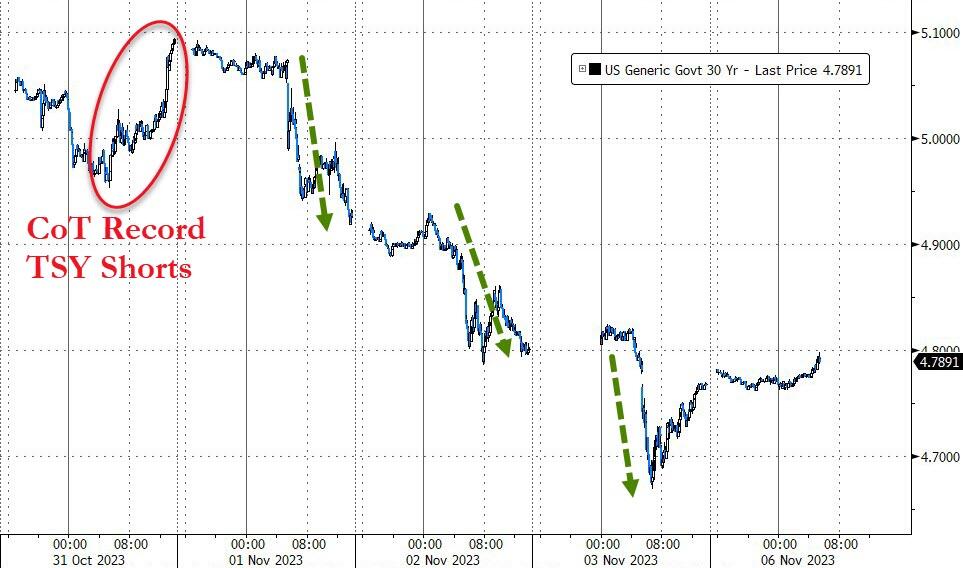
Source: Bloomberg

A trifecta of terrific news for treasuries – smaller-than-expected Treasury refunding, more dovish than expected Powell, weaker than expected jobs data – triggered three massive waves of buying in bond-land right as hedge funds ramped up their net short Treasury futures positions to the most in data going back to 2006, according to an aggregate of the latest CFTC as of Oct. 31.”


USD futures consolidated inside Friday’s trading range.  The 50-day Moving Average lies at 105.43 and presents a possible buy signal once it is overcome.


Posted in Published | 9 Comments

November 3, 2023

2:25 pm

SPX is meeting fierce resistance at the September 21 gap beginning at 4375.70 and open to 4401.30.  It spent two weeks trying to overcome it in October, but failed.  Unfilled gaps are powerful resistance points, due to their history of failure, as you can see.  One of the reasons is that most shorts were bought after the gap down, so short covering no longer provides the fuel for SPX to go higher.  On the other hand, you will know a rally has legs when gaps are filled.  That may not happen for a while.


10:50 am

SPX rallied above the 50-day Moving Average at 4350.00, then reversed.  A decline beneath the 50-day (may have already happened) produces an aggressive sell signal.  Confirmation may come beneath the mid-Cycle support at 4292.23.  The rally may have turned into a bull trap.


7:30 am

Good Morning!

NDX futures rose to 14890.70 this morning, but have recently reversed into the red.  There are two possible outcomes.  The first is to reach the 50-day Moving Average at 14949.30, prolonging the rally, or decline through Intermediate support at 14778.52, creating a possible sell signal.  The Cycles Model infers that the decline may resume imminently and continue to the last week of November.

Today’s op-ex shows Maximum Investor Pain at 14750.00  Long gamma starts at 14800.00 while short gamma begins at 14700.00.   The dealers have squeezed out the shorts.  Will the longs pick up the baton?

ZeroHedge speculates, “More legs to the squeeze?

As we have been highlighting in our past few emails, there are reasons to be tactically short term bullish:

1. Massive buybacks

2. Retail participation

3. CTAs can have to buy a lot

4. HFs generally low positioning

5. Technical picture better with SPX above its 200-day moving average

6. Earnings now coming in better after a somewhat weaker start”


SPX futures have stopped short at 4317.60 and consolidated above 4300.00.  A break beneath Intermediate support at 4291.00 may produce a sell signal.  The original retracement target at 4259.92 may provide confirmation of the reversal and sell signal.  The Cycles Model suggests a clear reversal may occur by mid-day.

Today’s op-ex shows possible Max Pain at 4290.00.  Long gamma begins at 4300.00 while short gamma starts at 4285.00.  4300.00 appears to be the line in the sand for this tug-of-war.

ZeroHedge reports, “Equity futures are pointing to a slight pullback in US stocks, which are on track for their best week in a year, as Apple’s disappointing outlook anmd weaker than expected China sales weighed on markets. At 7:40am, S&P 500 futures were down 0.1% but off the worst levels of the session while Nasdaq 100 futures lost 0.3%. The pullback follows US stocks’ best day since April in the wake of the Federal Reserve’s decision to hold rates steady. The subdued session is also due to nerves around the US nonfarm payroll data later today as traders look for further confirmation that the Federal Reserve’s tightening cycle is nearing an end.”


VIX futures are consolidating near the low end of its range.  The consolation is that VIX may have stopped its decline, or very nearly so.    After being out-of-sync with the SPX for some time, it appears to be ready to re-engage.

Next Wednesday’s op-ex reveals Max Pain at 17.00-18.00.  There is no short gamma.  Long gamma begins at 20.00 and extends to 50.00.

ZeroHedge comments, “Sell low buy high

GS Prime book was sold for the third straight month in October. Main reason is heavy shorting. GS notes: “…the combined net selling from August to October across global equities was the second largest over any three month period in the past 10 years (only Q1 ’22 was larger) and ranks in the 99th percentile.”

Good luck explaining to your boss you shorted the recent lows in size and intend to keep that into year end…”


9:04 am

TNX is probing its target (the 50-day and trend line) at 45.45 tis morning, in a likely completion of its retracement.  Should that be the case, we may see a reversal this morning to higher yields.

ZeroHedge remarks, “TLT – the break out

TLT closed “well” above the negative trend line for the first time since the TLT bear started in July. Note it also managed closing above the 21 day by a margin not seen in a very long time. The 50 day is still higher, not to mention the 200 day.

Source: Refinitiv

Not seen in “modern” times

We have not seen the VXTLT vs VIX ratio at these levels in “modern times”.

Source: Refinitiv

TLT panic in a pic

The crowd is piling into TLT calls. Yesterday was the largest TLT call volume ever.”


USD futures have declined to a new retracement low at 105.08 thus far this morning.    I am studying whether today May be the Master Cycle low instead of 10 days ago.  The Cycles Model suggests the USD will be higher by year-end.


Posted in Published | 1 Comment

November 2 2023 All Souls Day

1:03 pm

SPX has made a very irregular retracement, as shorts get squeezed mercilessly.  By most standards, the retracement should have ended yesterday.  The retracement has taken back 70% of the decline since October 17 thus far.  It may be on its final legs, but now that it has gone this far, the 50-day Moving Average at 4352.55 offers a challenge.  What’s not to like, especially when BofA and Goldman Sachs are cheerleading?  As I said multiple times, this Wave can be treacherous.

ZeroHedge pronounces, “Equities (and bonds) are extending gains this morning with a massive short-squeeze. ‘Most Shorted’ stocks are up over 5% for now, the biggest daily squeeze since February

Source: Bloomberg

And, as Goldman Sachs Partner, flow-trader John Flood warns, “this squeeze has momentum”.


8:10 am

Good Morning!

NDX futures have hit a morning high at 14811.50, on their way to the 61.8% Fibonacci retracement at 14945.00 or possibly the 50-day Moving Average at 14949.82.  Some traders and analysts have decided that the NDX isn’t bearish enough and is due for new highs.  The Cycles Model suggests the NDX may linger at the highs until mid-day, then resume its decline.

Today’s options expiration shows Maximum Investor Pain at 14725.00.  Short gamma begins strongly at 14710.00, while long gamma may take hold above 14800.00.  Long gamma does not have a lot of conviction, leaving the rally in a tenuous position.

ZeroHedge notes, ”  One week ago, BofA’s Michael Hartnett drew a lot of heat from the permabears when Wall Street’s most accurate strategist of the past decade predicted that a tactical rally was in the cards as one of his closely-followed buy signals had just been triggered. And while stocks did initially dip lower following his Oct 20 note as a result of aggressive mutual fund year-end tax loss selling, the S&P is now back to green from his reco following today’s “dovish at the margins” Fed statement (in Goldman’s words), which may have just given the green light for a year end rally.”


SPX futures have rallied to a morning high at 4269.80, thus far.  It has surpassed the mid-Cycle resistance at 4258.64 and may reach Intermediate resistance at 4295.00 or round number resistance at 4300.00.  Today may be a trading Cycle (60-day) high, a lesser inflection point that may be finished by mid-day.  If so, there may be a month of decline to follow.  As mentioned earlier, Wave Bs can be treacherous.

Today’s op-ex shows Max Pain at 4235.00.  Long gamma begins at 4270.00 while short gamma starts at 4200.00.

ZeroHedge reports, “US equity futures, and global stocks and bonds extended gains Thursday as traders bet the Federal Reserve is ending its historic tightening campaign, and that easing may not be too far behind. As of 8:00am, S&P 500 futures rose 0.5%, while Nasdaq 100 futures gained 0.7%. Both underlying indexes had jumped on Wednesday after the Fed held interest rates steady and the Treasury announced plans to slow the pace of increases in quarterly long-term securities sales. The dollar weakened and Treasuries steadied after sharp gains following Powell’s comments yesterday. In Asia, the yen extended its gains from Wednesday, while the South Korean won led emerging-market currencies higher. The 10-year TSY yield dipped two basis points after falling below 4.75% for the first time in two weeks. Elsewhere, the latest major company earnings also provided a dose of good news.Commodities are mixed with WTI adding 1.5% in the morning while base metals are for sale. Today, macro calendar is quieter: we have some second-tier labor data (Challenger Job Cuts, Nonfarm Productivity, ULC) and Factory Orders. We will receive AAPL’s earnings after the bell. All eyes on Friday’s NFP and ISM-Srvcs releases.”


VIX futures have declined to 16.12 this morning.  A further decline is possible to 15.44 to form an expanded flat formation.  The Cycles Model offers little short-term guidance.  However, the indications are that trending strength may come roaring back next week.

Next Wednesday’s op-ex shows Mas Pain at 18.00.  Short gamma has little advantage over long gamma beneath 18.00.  Long gamma starts at 20.00 an had high conviction to 40.00.


TNX plummeted beneath Intermediate support at 47.01 and may be destined to test the 50-day Moving Average at 45.39 by early  next week.  TNX may be due for a Trading Cycle low at that time.  The Cycles Model then suggests the resumption of the rally until the end of November.  A possible target at the end of November may be greater that 52.00.  By year-end, the 10-year yield may be in the range of 54.00-55.00.

ZeroHedge remarks, “In a clear sign we are reverting to a system where fiscal policy dominates monetary policy, the Treasury’s refunding announcement is probably more consequential than the Federal Reserve’s meeting today. An increased skew away from bill issuance is a headwind for liquidity and risk assets.

The refunding announcement is in focus due to the US’s huge fiscal deficit. It comes when rising yields – i.e. loose fiscal policy meets tight monetary policy – means the government’s interest-rate costs are soaring.

The rapid rise in US yields to ~5% points to the government’s annual interest-rate bill rising to 4.5-5% of debt outstanding in the next six months. That’s in the region of $1.7 trillion – or the GDP of Australia – each year.”


Posted in Published | 1 Comment

November 1, 2023 All Saints Day

10:30 am

The retracement of the BKX only amounts to 17%.  Yet, the correction may be complete, or nearly so.  This bounce is not to be trusted.

ZeroHedge notes, “Recent data from Edmunds reveals that an unprecedented 17% of American car purchasers now have monthly car payments of $1,000, a significant increase from just 7% three years ago. This trend highlights the extent to which consumers, despite being financially stretched, are willing to take on massive auto debt in these uncertain economic times as macroeconomic headwinds pile up.

New Google data, first revealed by X user CarDealershipGuy, shows Americans are searching “give car back” on the internet has soared to a record high.

CarDealershipGuy added, “For everyone DMing me: No, you can’t “give back” a car – That’s a repossession.”


9:52 am

TNX has slumped beneath the Cycle Top at 48.28, suggesting an extension of the pullback.   Should that be the case, the rally in yields may resume shortly.  It may also create a new buy signal at the re-crossing of the Cycle Top.

ZeroHedge observes, “We already knew – after its publication on Monday – that in the current quarter, the Treasury expected to issue $776BN in debt in the current quarter, or some $76BN below the previous forecast published last quarter, a welcome slowdown in debt issuance as a result of slightly higher than expected tax receipts in October.

Today’s Treasury Refunding Announcement gave the details of what the composition of this issuance would be, with a focus on Coupon vs Bill sales.”

9:41 am

SPX has breached the 4200.00 (Max Pain) level and is likely to continue to the 38.2% Fibonacci retracement value at 4215.00.  Dealers may have induced the short covering at the open.  The 50% retracement value at 4250.00 may also be in sight.

ZeroHedge reports, “US equity futures are weaker to start the new month ahead of today’s Fed meeting (which as we previewed earlier will be a nothingburger now that the Treasury itself is raising yields with its relentless debt issuance and doing the Fed’s job for it) as well as macro data dump which includes the Treasury’s Q4 refunding statement. As of 8:00am, S&P and Nasdaq 100 futures dropped by about 0.4%. The USD is stronger with bonds catching a bid. Commodities are mixed with crude/base metals up, while natgas, gold down, and both softs/grains mixed. Today’s data focus includes the Fed, ADP, JOLTS, ISM, vehicle sales; Treasury refunding announcement at 8.30a ET. We also get a deluge of consumer-sector earnings today. ”


7:30 am

Good Morning!

SPX futures have declined to 4173.60 thus far this morning after making a mere 32% retracement.  I am a bit hesitant to call the bounce over, but all the ingredients may be present for a completed retracement.  If not complete, the turn may occur near mid-day.

Today’s options expiration shows Maximum investor pain at 4200.00.  Long gamma starts at 4220.00, while short gamma begins at 4180.00.  This morning we are exploring the potency of short gamma.


VIX futures have risen to 18.38 thus far this morning.  The trend line and confirmed buy signal occurs near 18.60.

Today’s op-ex shows Max Pain at 18.00-19.00.  There is no short gamma.  Long gamma extends from 22.00 to 45.00.

ZeroHedge reminds, “VIX has come down

VIX printed an intra day high of just above 22 on Friday. We are now trading around 18. We have actually seen one of the bigger 2 day down candles in the VIX in a long time…but volatilities still remain elevated given the fact we are not realizing much volatility.”


Posted in Published | Comments Off on November 1, 2023 All Saints Day

October 31, 2023

8:00 am

Good Morning!

NDX futures have risen to an overnight high of 14368.00.  Overhead resistance may lie at the 38.2% Fibonacci level at 14542.40 or possibly higher, at 14643.70, where an unfilled gap may stop the retracement.  The NDX Hi-Lo Index closed yesterday at -396.00, indicating that nearly all of the strength of the rally lies in the mega-caps.  Showing a smaller loss at month-end is critical.  Afterwards, anything goes.

Today’s options expiration shows Maximum Investor Pain at 14500.00 and the most contested space for both puts and calls.  There is virtually no long gamma above 14500.00, while short gamma is held at 50-point intervals down to 14100.00.

ZeroHedge notes, “A deteriorating outlook for corporate earnings offers little support for the S&P 500 reeling from its worst October since 2018.

While data from Bloomberg Intelligence show US firms are on pace to report a surprise increase in third-quarter earnings, forecasts for future quarters have been marked down as companies warned of tepid demand and an uncertain macroeconomic outlook. Deutsche Bank Group AG said analysts’ estimates for the fourth quarter have been cut by a “more than typical” 1.9% since the start of the reporting season.”


SPX futures made an overnight high at 4180.10, only ticks higher than yesterday’s intra-day high at 4177.47.  The uptick is weakening, suggesting a possible pullback to 4120.00-4130.00 before another attempt at a higher retracement.  A lower retracement target is possible.  The 38.2% retracement lies at 4215.00.

Today’s op-ex shows Max Pain at 4205.00.  Long gamma starts at 4220.00, while short gamma begins at 4200.00.  Dealers must close today’s market at or above 4200.00 to achieve minimum payout.

ZeroHedge reports, “Futures were higher and European bourses were solidly in the green on the last day of the month, extending yesterday’s blistering rally which sent the S&P 1.2% higher and which took place after most of the mutual-fund year-end tax loss selling had exhausted itself during last week’s rout. As of 7:45am, S&P futures were higher by 0.2%, Nasdaq 100 futs gained 0.1%, while Europe’s Estoxx 50 outperforms, higher by around 1% on the day with materials sector outperforming. Treasury yields are lower after the US Treasury reduced its estimate for federal borrowing for the current quarter, citing stronger-than-expected revenue; the dollar was weaker against most major currencies, except the yen. Oil prices are edging higher after dropping in the prior session. Israel stepped up ground operations in Gaza and struck more targets in Lebanon and Syria overnight.”


VIX futures declined to a morning low at 19.20.  Support appears at the trendline at 18.80.

Today’s op-ex shows Max Pain at 20.00.  Short gamma starts at 19.00, but is hemmed in there.  Long gamma begins at 21.00 and extends to 45.00.


TNX may have bounced from the Cycle Top at 48.13 as it completes a minor Trading Cycle.  If so, the rally may resume quickly.  The Cycles Model suggests another month of rising rates.

ZeroHedge comments, “One quarter ago, when reporting on the Treasury’s latest marketable debt issuance forecast, we pointed out something striking which sparked a historic selloff in Treasuries over the next 90 days: the US Debt Tsunami had Begun as the “US Was Set To Sell $1 Trillion In Debt in Q2, 2nd Highest In History, As Budget Deficit Explodes, while the forecast debt sale for Q3 was also an eye-watering $852 billion. The numbers were big enough that even the bond market – which had long since habituated to seeing huge debt issuance forecasts every quarter without batting an eyelid – cracked.

Since then it’s went from bad to worse when as we first noted, the US quickly added some $600 billion in total debt in just one month after breaching the key $33 trillion level.”


USD futures are rising toward the Cycle Top at 106.77.  It may still be in a period of trending strength, which may be enhanced by the FOMC meeting.


Posted in Published | 2 Comments

October 30, 2023

3:05 pm

Crude Oil had dropped beneath the Head & Shoulders neckline at 82.50 to a low of 81.84.  It is on a sell signal.


10:00 am

BKX, our liquidity proxy is due to bounce after making a Master Cycle low on October 25.  The retracement may only take a few days.  The potential target may be   Intermediate resistance at 76.96 or the 50-day Moving Average at 78.37.  From that point we may see a waterfall decline much like the  March decline, but larger.  The Cycles Model suggests the decline may continue into the first week of December.  Since this is a liquidity event, it may affect all markets.

ZeroHedge reveals, “With usage of The Fed’s emergency funding facility rising once again to a new record high last week – and banks stocks clubbed like a baby seal – all eyes are once again on just what The Fed can do to ‘seasonally-adjust’ the data to avoid the admission of any deposit run fears in domestic banks.

Total bank deposits – on a seasonally-adjusted basis – crashed by a massive $83.7BN last week (the biggest outflows since SVB) to the lowest since June…”


8:15 am

Good Morning!

NDX futures are testing the lower trendline/channel boundary at 14320.00.  More likely than not, there may be a breakthrough to 14750.00-14780.00, testing the prior high.  The Cycles Model suggests that this retest may be short, but sharp, squeezing out weak hands.  The institutions have an incentive to shore up the month-end visuals.

Today’s options expiration sows Maximum Investor Pain at 14230.00.  Long gamma begins at 14250.00, while short gamma starts at 14220.00.

ZeroHedge remarks, “Boo

“The strategy for the discoverers and entrepreneurs is to rely less on top-down planning and focus on maximum tinkering and recognizing opportunities when they present themselves,” wrote Nassim Taleb. “So, I disagree with the followers of Marx and those of Adam Smith: the reason free markets work is because they allow people to be lucky, thanks to aggressive trial and error, not by giving rewards or ‘incentives’ for skill. The strategy is, then, to tinker as much as possible and try to collect as many Black Swan opportunities as you can.””


SPX futures are testing the descending trendline at 4150.00.  The window for this rally may be short, but should it break through, the next level of resistance is at 4260.00.  The over-arching signal remains on a sell, since Waves B can be treacherous.  That being said, the bounce may go as high as the mid-Cycle resistance at 4257.83 in the next few days.

Today’s op-ex shows Max Pain at 4150.00, so there may be the dealers’ incentive to close at that level.  Long gamma starts at 4160.00 while short gamma begins with a wall of puts at 4140.00.

ZeroHedge reports, ” Ending a week that saw the S&P be the most overshorted in history, with Goldman PB reporting that its HF clients had shorted stocks for a record 12 consecutive weeksit was inevitable that we would get an oversold bounce at some point and this morning we are seeing just that, with stocks in Europe broadly higher, and US equity futures also rising and reversing all of Friday’s loss. As of 7:45am, S&P futures were higher by 0.7%, Nasdaq futures gained 0.8% and the Estoxx rose  0.8% in early London session with gains led by utilities and energy; WTI futures were lower by 1.1% on the day because the complacent market downplayed the Israeli ground offensive into Gaza as “less aggressive than feared.” Ahead of a very busy week, JPM summarizes sentiment as follows: “are futures potentially setting up a relief rally into month-end or does the selling pressure continue with SPX under its 200dma.” Gold slipped below $2,000 an ounce, the dollar dropped as bitcoin gained and ten-year Treasury yields resumed their grind higher to 4.86% ahead of today’s Treasury issuance projections statement.”


VIX futures are consolidating inside Friday’s trading range.  Support lies at the trendline at 18.60.  Alternate support lies at the mid-Cycle line at 17.24.  Something is afoot here, since today is a high trending strength day.  Should that strength reveal, the Cycle Top at 23.15 may be tested again.

Wednesday’s op-ex shows Max Pain at 20.00.  Short gamma may begin at 19.00, with a healthy collection of longs at 18.00.  Long gamma begins at 21.00 and is heavily populated to 450.00.

11:00 am

ZeroHedge observes, “VIX remains above 20 this morning, but has followed the pattern of the last 3 weeks with VIX/vol bid into Friday due to weekend risk… and when WW3 does not actually occur, VIX/vol is sold in relief.”


ZeroHedge informs, “Corrections

Corrections are common. On average, the market declined 10% or more every 1.2 years since 1980. It is of course not clockwork, but the following charts and tables are good to put things into perspective when we are in the middle of a correction (perhaps aspiring to become a crash…)

Corrections, we had a few…

1. Since 1980, the peak-to-trough pullback within a given year has averaged 14.3% in SPX

2. It is feature not a bug….over the last four decades, the NDX has averaged a peak-to-trough drawdown of 20% in each year


TNX rose to 49.11 this morning on a possible high strength day.  Should the correction be over, it may rest the upper trendline near 50.50.  Regardless of today’s outlook, yields are destined to rally higher through the end of November.  This rally may use the Cycle Top as support during that time.  Advisors and investors are showing too much enthusiasm for trying to find the top tick in treasuries.

ZeroHedge remarks, “The ongoing schism over the fate of the most important and liquid market in the world, US Treasuries, has reached never-before seen levelk.

Consider the following: with 10Y yields rising above 5.00% last week for the first time since 2007, ETF traders have been aggressively trying to bottom tick the selling in rates. They are doing so in two ways.

On one hand, as Goldman’s Derivatives traders Brian Garrett and Cullen Morgan write, demand for TLT calls and call spreads exploded this week. That’s because “this is a cheap way to play for a snapback in bonds.” As shown below, average TLT call volume this was over 350k contracts per day, an all-time highs…”


USD futures have pulled back to test Intermediate support at 105.83.  The test may not be completed, as today is a day of trending strength.  The trend is higher, so we may see the Cycle Top at 106.74 tested instead.  The Cycles Model suggests the uptrend may last another three weeks.


Crude Oil futures made a morning low of 83.75 as it retreats from its high at the 50-day Moving Average at 85.85.  Support lies at the Head & Shoulders neckline near 82.50.  Should it break through, we may see a waterfall decline down to the Cycle bottom at 65.11.


Posted in Published | 2 Comments

October 25, 2023

8:00 am

Good Morning!

Please Note:  This will be my last entry for the week, as family concerns take precedence.  I will return on Monday with more updates.

NDX futures are consolidating this morning after a completed 38.8% retracement.  While there may be room to go higher, a decline beneath 14600.00 may confirm the reversal.   A further decline beneath 14200.00 establishes a new downtrend.

Today’s options expiration shows Maximum Investor Pain at 14875.00.  Long gamma may begin at 14900.00.  Short gamma starts at 14850.00.

ZeroHedge notes, “Microsoft shares are soaring after hours following a top- and bottom-line beat

  • Revenue was $56.5 billion (better than the expected $54.54 billion) and increased 13% (up 12% in constant currency).
  • Diluted earnings per share was $2.99 (better than the $2.65 expected) and increased 27% (up 26% in constant currency).”

ZeroHedge comments, “The big question into Alphabet’s earnings was what, if any, progress they had made on monetizing the AI promise without cannibalizing the company’s main moneymaker – search advertising; and just how much capex they blew on NVDA chips to feed the LLM-processing beast.”


SPX futures may be consolidating after making a 34.3% retracement.  Despite the energy consumed to make this correction,  mid-Cycle resistance at 4259.00 appears to be holding.  A decline beneath 4219.00 suggests the correction may be over and the decline resumed.

Today’s op-ex shows Max Pain at 4265.00.  Long gamma begins at 4275.00.  Short gamma may begin at 4260.00 but strengthens beneath 4225.00.

ZeroHedge reports, “US equity futures are sliding – but off the lows of the session- setting up Wall Street for a lower open, with underperformance driven by Alphabet, whose shares have tumbled premarket after its cloud unit revenue disappointed. As of 8:00am ET, S&P futures were down -0.3% while Nasdaq futs drifted -0.5%, after Microsoft and Google delivered a mixed picture of big tech earnings, setting the stage for peers still reporting this week. The dollar is stronger for a second session tracking Treasury yields which also rose, while oil was little changed and there was a bounce for iron ore following the Chinese stimulus measures. In Europe, stocks reversed earlier losses as a 55% drop for French payments firm Worldline offsetting a gain for Deutsche Bank. Asian markets were also broadly higher on hopes that a new 1 trillion yuan in debt issuance will provide a fiscal stimulus for China’s struggling economy. Today’s macro data focus is on new home sales and mtge applications”


VIX futures dipped to a morning low of 18.86, remaining above the trendline at 18.60.  The Cycles Model allows the VIX to decline to its mid-Cycle support at 17.20 from which the next probe higher may be launched.  Otherwise, a breakout above 23.07 confirms the rally higher.

Today’s op-ex shows Max Pain at 18.00.  Short gamma is in short supply while long gamma begins at 20.00 and extends to 50.00.

ZeroHedge remarks, “Stress remains elevated

VIX and MOVE have “parked” at rather elevated levels.

Source: Refinitiv

Mexican butterflies

Risk is global, and watching some of the more risk sensitive FX pairs, such as the MXN, is a must. The short term gap vs SPX remains very wide…


TNX futures have risen to 48.93 this morning and appear to have resumed their rally after a brief respite.  The Cycles Model indicates a return of trending strength by the weekend.  If correct, the rally is rates may continue to the end of November.

ZeroHedge observes, “US households are becoming the buyer of last resort in Treasuries, meaning yields may need to rise by as much as 1.5 percentage points to meet the sector’s elevated and rising inflation expectations.

The world is once again having to acclimatize to higher rates. US 10-year yields this week rose above 5% for the first time since 2007. But they may need to climb even further to clear the market as other sectors continue reduce their Treasury exposure, leaving households as the only net buyer.”


Posted in Published | 1 Comment

October 24, 2023

12:30 pm

SPX has risen to the mid-Cycle resistance currently at 4257.38, then reversed down beneath the 200-day Moving Average at 4236.85.  It may be back on a sell signal, but with confirmation beneath 4200.00.  Too many pundits are not convinced of a bear market potential.  See below.

RealInvestmentAdvice opines, “The “pain trade” continues to be higher into year-end. We made Such a point in Januarysuggesting the 2022 “correction” was complete. Let’s review what I wrote, and then we will expand on why we believe the “pain trade” is higher over the next few weeks.”


8:00 am

Good Morning!

NDX futures rose to 14723.20 this morning in an extension of its bounce as it may aim for Intermediate resistance at 14982.62, a 61.8% Fibonacci retracement.  An alternate (lesser) possibility may be at short-term resistance at 14886.00, a 50% retracement.   The Cycles Model suggests another day (or more) of rally before the decline resumes.

Today’s options expiration shows Maximum Investor Pain at 14625.00.  Long gamma starts at 14650.00 while short gamma begins at 14600.00.

ZeroHedge observes, “It’s about get really busy.

This week we get 162 companies, or 39% of S&P market cap, reporting…

… with the highlights being the biggest giga-cap tech names such as Microsoft and Alphabet tomorrow, Meta on Wednesday and Amazon on Thursday, which together make up over $6tn in market cap, and nearly 17% of the S&P 500.”


SPX futures rose to a morning high of 4243.80.  It may continue to rise to the mid-Cycle resistance at 4256.23, a 32.8% retracement.  A positive earnings surprise may boost the bounce to 4282.00-4300.00, as much as a 50% retracement.  The decline may then resume until November 17 options expiration.

Today’s options expiration shows Max Pain at 4245.00.  Long gamma starts at 4250.00 while short gamma begins at 4225.00.

ZeroHedge reports, “Global stocks rose, US index futures jumped and bitcoin erupted higher ahead of closely-watched earnings from tech gigacaps Microsoft and Alphabet later today (full preview here). As of 8:00am ET, S&P futures were up 0.6%, at session highs and set to snap a five-day losing streak with Nasdaq futures also higher by 0.6%. Treasuries stabilized, with the US 10-year yield dropping as low as 4.80% before reversing gains, amid growing speculation that the recent selloff was excessive. Treasury 10-year yields slipped as much as five basis points to a one-week low before paring the move. Europe’s Stoxx 600 index edged higher.”


VIX futures fell to 19.66, hovering at the trendline.  An especially positive report from one or more of the giga-cap companies may drive the VIX down to the 50-day Moving Average at 16.49.  However, the Cycles Model suggests that trending strength may come back near the end of the week.

Wednesday’s op-ex shows Max Pain at 19.00.  Short gamma has an anemic sowing at 17.00-18.00.  Long gamma begins at 20.00 and extends to 50.00.

ZeroHedge remarks, “What is the risk of a short squeeze now?

“Still present, but potentially delayed…A squeeze might not accelerate unless we get 1) evidence consumer spending isn’t slowing too much, 2) relatively good earnings season, 3) Fed communicating they’re on hold. Given the conditions that might have to be met, a sustained move higher in shorts seems like a greater possibility in Nov than right now” (JPM Position Intelligence)

Lowest beat level

As for earnings, we’re only ~17% of the way through results for the SPX and the beat rate is coming in at its lowest level so far in ’23. The 73% reading is still 2ppts above the LT average, and decently above the 2 Qs it broke below 70% last year. That said, stocks are getting punished. The poor tape is definitely a big contributing factor, but misses (of which there have been plenty) are being punished the hardest vs. every other quarter since 2010, averaging -3.7% 1D moves.”


TNX made a new retracement low this morning at 47.98.  Should TNX not decline beneath the Cycle Top at 47.31, the rally may resume with increased trending strength by the weekend.  This may clear some “noise” in the Cycles Model.

ZeroHedge remarks, “US yields likely need to climb further as retail investors become increasingly attuned to hedging inflation. Bond rallies are likely to be transient as the primary trend for Treasuries remains down.

After decades of real and nominal levels being almost indistinguishable, it’s not a great surprise that both professional and retail investors will take time to adapt to the new normal. Countries used to unruly inflation, like Argentina, are well accustomed to their currency’s actual value (not the official value), and how rampant price growth can decimate the real value of financial assets.”


Crude oil futures declined to 84.92 thus far this morning.  Crude is on a sell signal beneath the 50-day Moving Average at 85.66.  The Cycles Model suggests that the decline may gain trending strength over the next few weeks with a potential low in about 4 weeks.


Posted in Published | 1 Comment

October 23, 2023

1:30 pm

SPX did an early correction to retest the mid-Cycle resistance at 4256.41.  Having done that, it may resume its decline beneath the lower trendline at 4150.00.  There is little support down to 3800.00.


7:30 am

Good Morning!

This is a good occasion to do a special report on US Treasuries, namely the 10-year Treasury note.  Unfortunately, StockCharts does not illustrate rates prior to 1990.  The entire period for the past 23 years has been corrective, replete with zigzags an overlapping Cycles, making it difficult to map out.  However, the above chart shows a best effort enumeration without violating any rules or guidelines.

There are two items that are worth noting.  The first is that the rally from the March 9, 2020 bottom now has 43 months of elapsed time, making this a significant Cyclical interval.   A time target may have been met, but a price target may still be missing.  It is possible that we may see TNX reach 53.16 before the month is over.  You may notice a second potential target of 68.23 which may be met in the January-February time period.

What fits the second projection is that the peak in the 10-year treasuries occurred on December 5, 1980.  As of December 2023, 43 years will have elapsed.  This is another more significant time period.  This is only an estimation of what may take place.  There are no guarantees of performance.


NDX futures declined to 14426 before making a bounce this morning.  The declining trendline is near 14300.00, which provides the next significant support.   Today is a trending strength day, so we may expect to see a significant decline before a potential bounce.

Today’s option expiration shows options investors overwhelmingly short with Maximum Investor Pain at 14730.00.  Long gamma starts at 14750.00.  Short gamma begins at 14700.00 with a wall of puts at 14600.00.

ZeroHedge remarks, “The market narrative boiled down to two things this week: geopolitical stress manifested in the places you’d expect (gold up, oil up, vol up), and US interest rates which chopped to higher highs on steeper curves. In so doing, the equity market was pushed around on significant risk transfer, and it’s very clear that some large index shorts were set. “


SPX futures made a new low at 4190.90, on the way to trendline support at 4150.00.  Today may show significant strength in the decline as investors give up hope for a meaningful bounce.

Today’s op-ex shows Max Pain at 4285.00.  Long gamma may begin at 4290.00-4300.00.  Short gamma starts at 4275.00 with a wall of puts at 4200.00.

ZeroHedge reports, “Global markets slumped and US equity futures started the new week deep in the red (if off the worst levels of the session) following losses on 5 of the past 7 weeks, after the 10-year Treasury yield finally topped 5%, fueling concern that soaring borrowing costs will erode economic growth. As of 8:00am ET, S&P futures were down 0.5% after sliding 0.7% earlier while Nasdaq 100 futures dropped 0.4%.

Europe’s Stoxx 600 index sank 0.7%, reaching the lowest intraday level since March. The catalyst for the selling was the 11bps surge in 10 year yields to 5.02%, the highest since 2007, before dipping modestly below 5.00%.”


VIX futures rose to a morning high at 23.08, challenging the Cycle Top resistance at 23.05.   There may be a probe to 23.75 before a pullback.

Wednesday’s op-ex shows Max Pain moving up to 21.00.  Short gamma has a weak showing beneath 20.00.  Long gamma begins at 22.00 with a high conviction of reaching 50.00 with 14,566 contracts.

ZeroHedge observes, “Monday blues

The bid in VIX continues. We are now seeing first signs of a more substantial fear hitting the market. VIX resets higher on Mondays due to the weekend effect, but the short term gap vs SPX is getting rather fearful here.”


TNX futures probed to 50.25 this morning as the cash market shows a lower opening.  Today is day 263 of the Cycles Model.  There may be a final probe to the upper trendline just above 50.00 before a reversal.  The Cycles Model suggests some choppiness for the rest of the week.  What may come next is a pullback to the 50-day Moving Average, currently at 44.49 over the next 2-3 weeks.

Zerohedge remarks, “It’s hard to see what would drive a significant and sustained rally in bonds without a US recession. A downturn hinges on the services part of the economy, where the outlook is balanced.

Powell’s comments on Thursday gave fuel to hawks and doves. Bonds are oversold, but not yet at extremes, thus yields could easily climb higher in the absence of any flight-to-safety move.”


USD futures declined to 105.82 as it heads toward Intermediate support at 105.63.  Should it test that support, it may reverse higher.  The Cycles Model suggests USD resuming its rally by the end of the week.


WTIC futures sank to a morning low of 86.74 after having made a possible key reversal on Friday.  It has made a sell signal after having decline beneath Intermediate support at 87.93.  Confirmation of the resumption of the decline lies beneath the 50-day Moving Average at 85.64.

ZeroHedge speculates, “Crude oil prices could go as high as $140 per barrel and send the world into a recession, Paris-based Allianz Trade said on Friday.

Tensions in the Middle East and escalations between Israel and Hamas into a broader regional conflic could trigger a price surge for crude oil that could send the commodity to trade at $140 per barrel, Ana Boata, head of economic research at Allianz Trade told Bloomberg Television on Friday.

“Higher oil prices, that’s the direct impact,” Boata said, adding that prices could escalate from the current $90 mark to $140 at its peak, even averaging $120 in 2024.”


Posted in Published | Comments Off on October 23, 2023

October 20, 2023

2:55 pm

SPX is challenging the 200-day Moving Average at 4233.000 this afternoon.  Should it break through, the next support may be the declining trendline near 4150.00.   Dealers may be desperate to hold the line here, since there is a very large wall of puts (37,333 contracts) at 4200.00.  The final hour may tell just how far it may go.  Fear of an escalation of the Middle East War also weighs heavily.  An onslaught of selling may begin after 3:30 pm as mutual funds and other institutions fulfill their orders.


10:20 am

BKX is on its way to a potential waterfall event.  The Cycles Model suggests the decline may last another seven weeks.  This is no joke.  A lot can happen in that period of time.  The main target may be dictated by the Head & Shoulders formation.   KRE (the regional banking ETF) may go to zero.


7:30 am

Good Morning!

NDX futures probed lower, to 14694.10 in the overnight session.    It may bounce to short-term resistance at 14880.00 to 14900.00, but is likely to close lower today.  The Cycles Model suggests a strengthening of the decline, a possible panic, starting today and extending through early next week.  There may be another 4 weeks of decline to follow.   The next support may be the trendline at 14350.00.   The potential target over the next month may be the October low.

Today’s option expiration shows Maximum Investor Pain at 14940.00.  Long gamma begins at 15000.00 while short gamma begins at 14925.00.  There is a wall of puts at 14800.00 and again at 14710.00.

ZeroHedge comments, “No more sub 20

VIX managed breaking the latest sub 20 close record today…but we still lack “real” panic. The short term gap between SPX and VIX remains rather wide.

Source: Refinitiv

NASDAQ saw the rates chart?

The short term gap shrunk by some into the close…”


SPX futures tested the mid-Cycle support overnight at 4254.55.  A bounce may bring it back to Short-term resistance at 4295.00-4310.00 with a maximum of 4340.00.  As mentioned earlier, a panic may ensue with today’s monthly op-ex.  Short gamma may be a force of its own, forcing the dealers to short the SPX to cover a massive number of puts. An approximate month of decline may still follow.

Today’s op-ex shows Max Pain at a hotly contested 4350.00 which may be difficult, if not impossible, to reach.  Long gamma starts at 4400.00.  Short gamma begins at 4325.00-4335.00.  The panic may begin when the dealers realize they cannot boost the SPX out of short gamma.

ZeroHedge reports, “Global stock dipped and US equity futures traded lower as crude oil extended the weekly advance for a 4th day, rising above $90 on concerns Israel and Hamas war could widen into a regional conflict and as the DOE announced plans to refill the largely drained SPR with another $6 million barrels (good luck doing that with the proposed purchase price of “$79 or below”). As of 8:00am, S&P and Nasdaq 100 futures were down 0.3%; Europe’s Stoxx 600 was down 0.7% to a seven month low and on course for a fourth day of declines. Meanwhile, Treasuries rose, led by gains in 10-year debt which briefly topped 5% yesterday for the first time since 2007, after Fed chair Jerome Powell suggested the US central bank is likely to hold interest rates steady at its next meeting. Asian equities also fell, on course for their worst week since August; China Evergrande Group is revising the terms of its proposed restructuring plan and Country Garden’s default on dollar bond interest payment still looms. A burst of buying among cryptocurrencies sent bitcoin above $30K, the highest since August.”


VIX futures receded to a morning low of 20.73 after yesterday’s breakout.  Today may be a day of trending strength with even greater gains over the next week.  The Cycles Model suggests the rally ay last until mid-November.

Next Wednesday’s op-ex shows Max Pain at 18.00-19.00.  Short gamma is practically non-existent.  Long gamma begins at 20.00 and extends to 50.00.

ZeroHedge advises, “The VIX closed above the “magical” 20 level for the first time in 105 sessions. The most recent record goes back to 2018. GS, however, on flows: “Flows primarily consisted of rolling protection down and out; no real panic.”

Source: GS


The VVIX panic

VVIX trading at 116 is basically “light” panic in a pic. We reached slightly higher levels during the SVB crisis, but this is getting rather extreme. The gap vs VIX is very wide. Don’t forget that despite the most recent rise in fear, markets have not moved much…


TNX futures hit a morning high of 49.99, fulfilling its Head & Shoulders target.  While 50.00 appears to be a “magical” number drawing fresh investor interest in treasuries, it may not last more than a few days.  The Cycles Model may allow a short-term pullback lasting no more than a week.

ZeroHedge observes, “On a day when the 10Y TSY yield briefly topped 5%, here is a remarkable stat from DB’s Jim Reid: as the DB strategist writes in his Chart of the Day note, after this week’s latest bond sell-off, there is now no fixed income asset that has outperformed USD cash amongst the main assets DB uses in its monthly performance review.

The last holdout was US HY and with this week’s bond sell-off, the return of the iBoxx US HY index has dipped below the return of US T-bills YTD. While US junk had until recently been seen as a strong performer this year, the returns show how difficult it is for any duration to perform in a sell-off, especially in a heavily inverted curve environment where carry is negative for government bonds relative to cash.”

ZeroHedge also comments, “With yields soaring exponentially higher, 30Y paper peeking above 5% and 10Y yields about to do the same…

…  some banks are quietly drawing a line in the sand, and according to Morgan Stanley Investment Management (not to be confused with the bank’s Rates strategist  Matthew Hornbach who has been one of the last bulls standing on TSYs as most of his Wall Street peers turned bearish), if 10-year US Treasury yields hit 5% or higher, that’s a good entry point for investors.”


USD futures declined to an overnight low of 405.95, on its way to test Intermediate support at 105.60.  There may be a test of the 50-day Moving Average, but considering the tenuous markets, may pass for the higher target.


Crude oil futures probed higher to 89.84as it attempts to reach the Cycle Top at 90.58.  Today is a potential reversal day, so due care is advisable.  The downtrend may resume shortly.


Gold futures rose to 1997.55 this morning on day 260 of its Master Cycle.  Today may be a reversal day, so caution is advised.  Should the new Master Cycle begin, it may extend in a decline to the year-end.


Posted in Published | Comments Off on October 20, 2023