July 7, 2021

7:45 am

Good Morning!

NDX futures continue to make all-time highs, although only by a few ticks.  Retail investors continue to buy the dips while institutional investors are absent.  The Fed is furiously pumping while the markets begin to sag.  Someone should tell Jay Powell that the markets rise (and fall) on confidence, no matter how much money is thrown at it.  As more big (smart) players leave the game, the realization that it isn’t the same trickles down to the retail end who are constantly searching for momentum plays until there are no more.

ZeroHedge comments, “Just a few days after Goldman trader Scott Rubner observed last week that the market is entering the best 2-week seasonal period of the year …

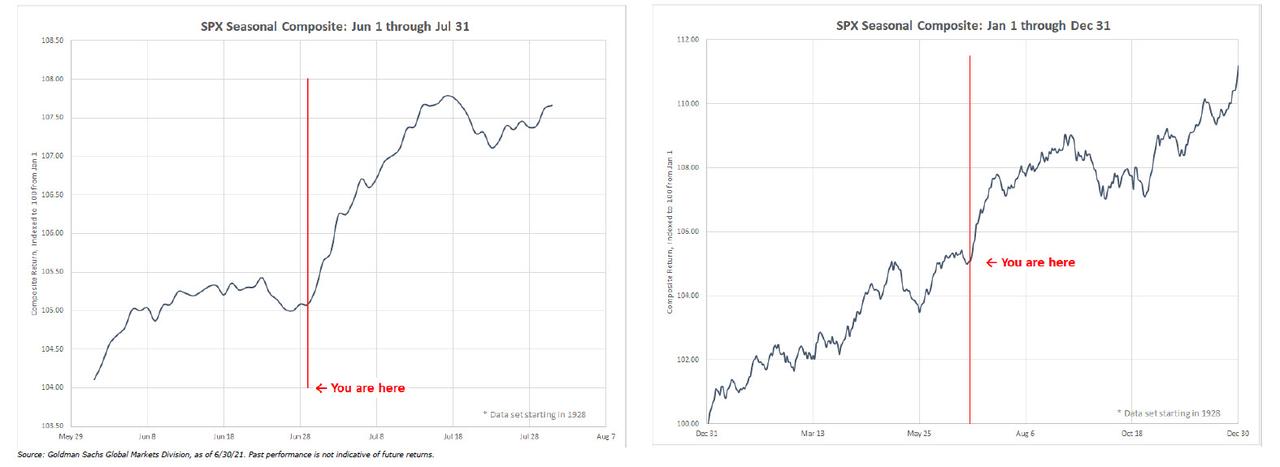
… he is out with a follow up note, in which he first points out a striking market statistic:

S&P 500 logged 7 straight trading days with a new ATH, this has only happened 5 other times since 1928. If today logs another all-time high, that has only happened 3 other times in history. No streak marked an immediate or significant top in the markets. Since 1928, if the S&P 500 is above >10% in 1H, then 2H performance is nearly 2x the median final 6 months for all years.

… but it was his observation on the rate of fund flows that was truly remarkable:

In 18 years of tracking flow of funds I could not imagine typing these large of numbers. I needed to check them twice. This was my busiest weekend and most incoming client questions of 2021 by far.”


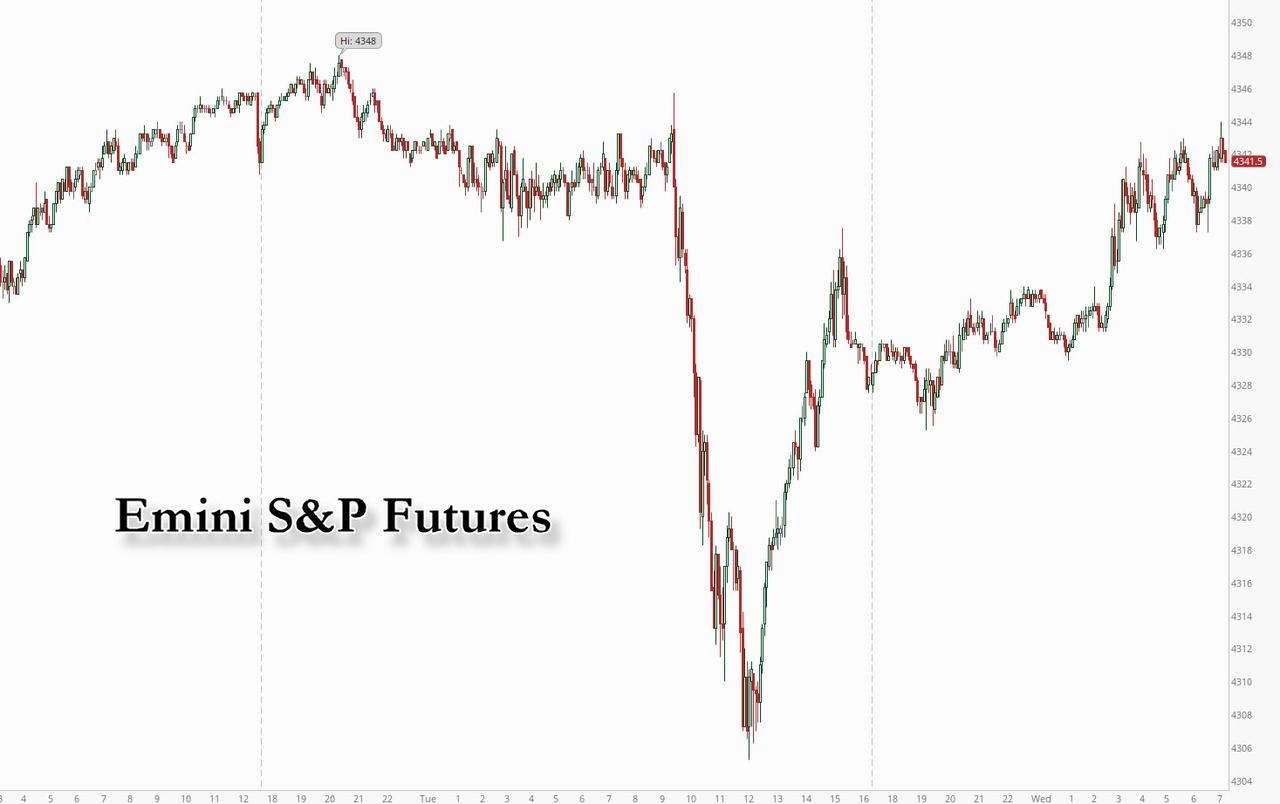
On the opposite side of the spectrum DJIA futures remain flat after yesterday’s drubbing.  This is the (increasingly former) home of major institutions and hedge funds that insist on liquidity and safety.  The peak remains on May 10 and the tires on this buggy are slowly deflating.  The wheels may come off sooner than one can imagine as the DJIA crosses beneath the 50-day Moving Average at 34251.50.  The final destination in the next 90 days may be beneath 17485.00 .


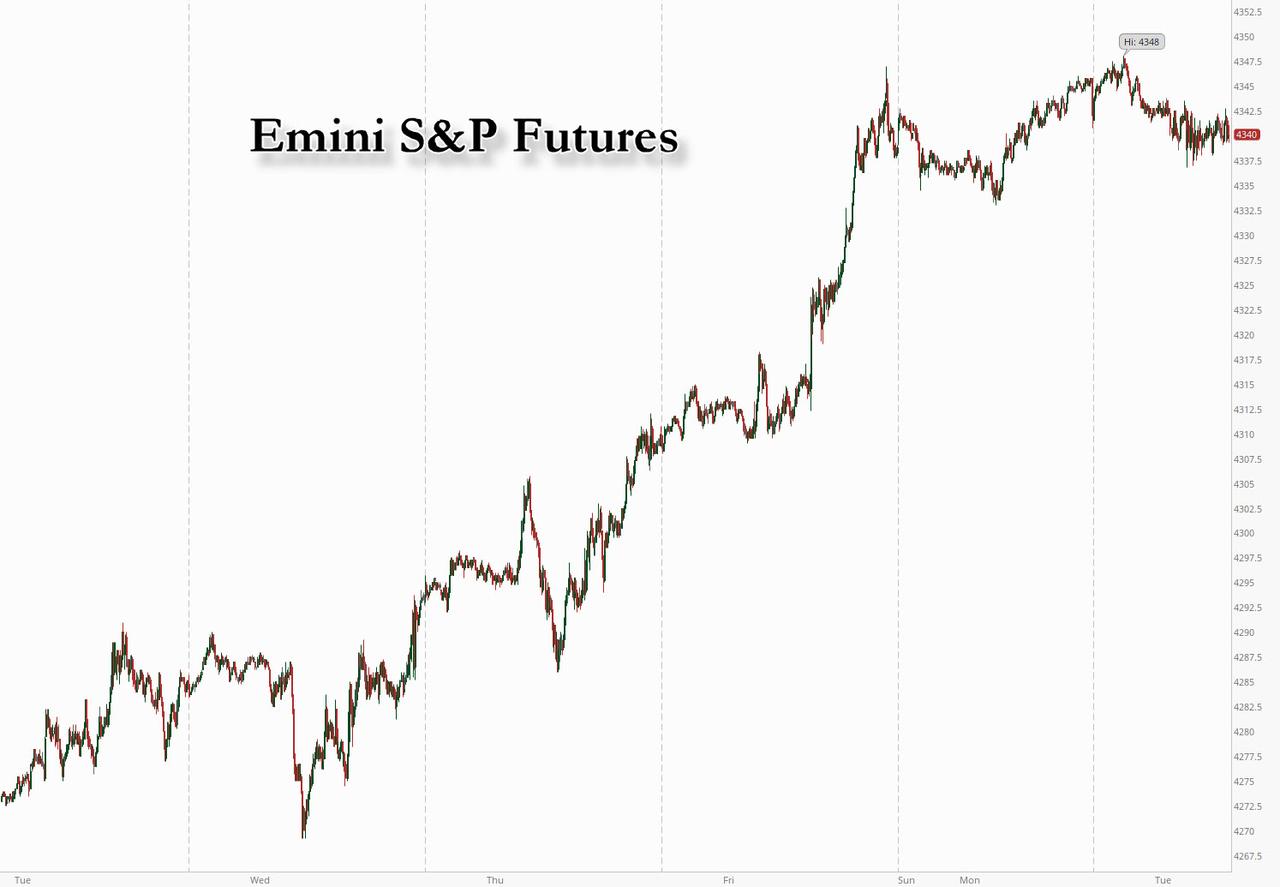
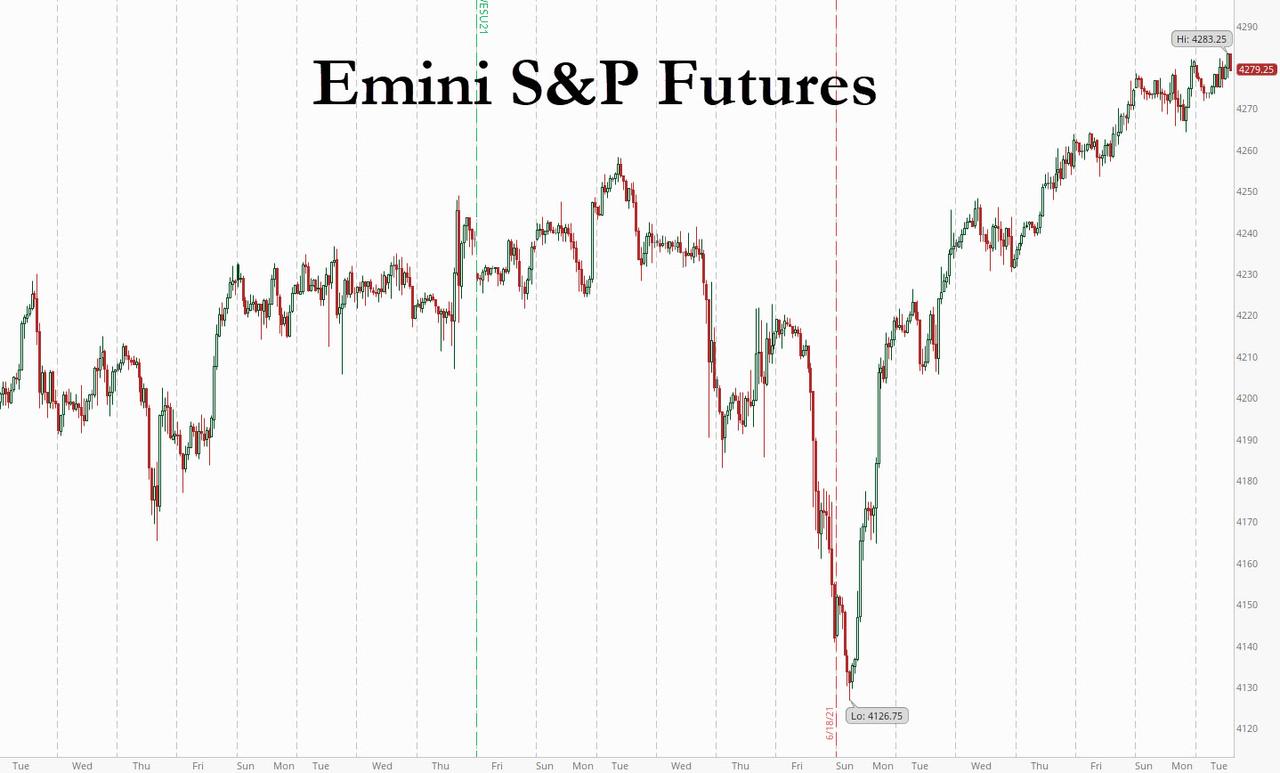
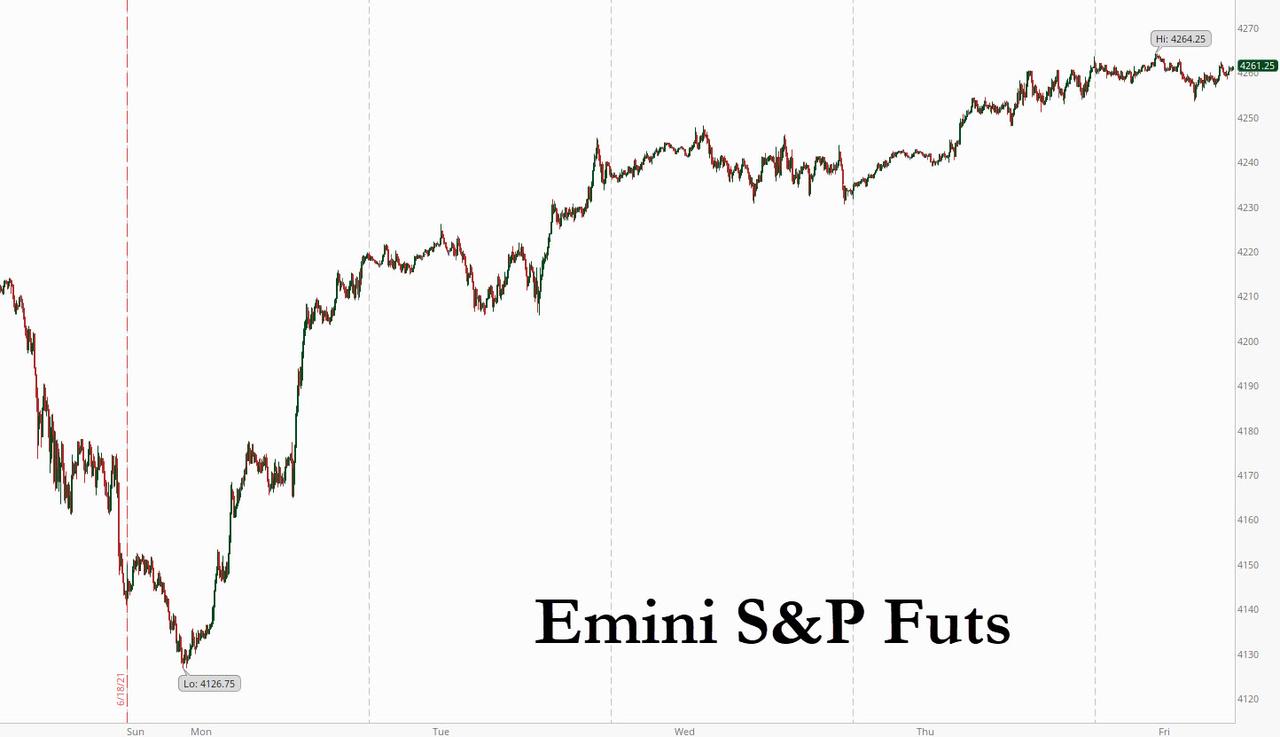
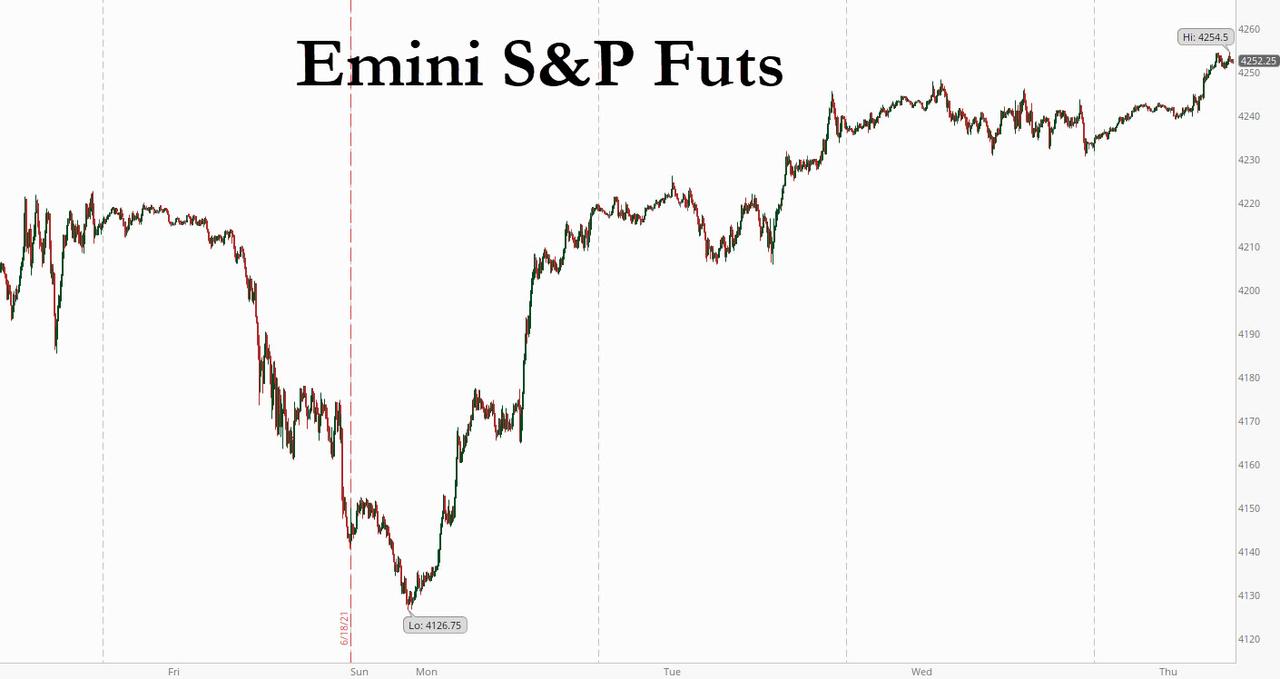
SPX futures made an overnight high at 4345.00, unable to beat yesterday’s (futures) high of 4347.00.  The SPX still appears to be bullish, but the fervor may be gone after last week’s blow-off top.  Today is day 271 of the current Master Cycle, making it a very stretched affair should a new high be made.

ZeroHedge reports, “One day after the S&P broke its near-record winning streak of 7 consecutive all time highs, futures resumed their grind higher as world stocks steadied below recent record peaks, while the Nasdaq jumped to a fresh all time high as the continued drop in Treasury yields supported tech-heavy growth stocks, with investors eyeing today’s June FOMC minutes for clues on policy support going forward. At 730 a.m. ET, Dow e-minis were up 21 points, or 0.06%, S&P 500 e-minis were up 8.25 points, or 0.19%, and Nasdaq 100 e-minis were up 89.25 points, or 0.59%. 10Y yields slipped for the seventh straight session, amid concerns about the economic outlook and coronavirus variants, helping Nasdaq futures rise premarket.


The NYSE Hi-Lo Index tells us more about the waning confidence in the markets.  The majority of June was spent beneath the 50-day Moving Average at 215.38.  While not enough for a sell signal, it shows a quiet liquidation/distribution since the high on May 10.  I had mentioned that a close beneath 50.00 may be a sell signal.  Under the current outlook, a close beneath the June low at 0.00 may be a better indicator of a sell signal.


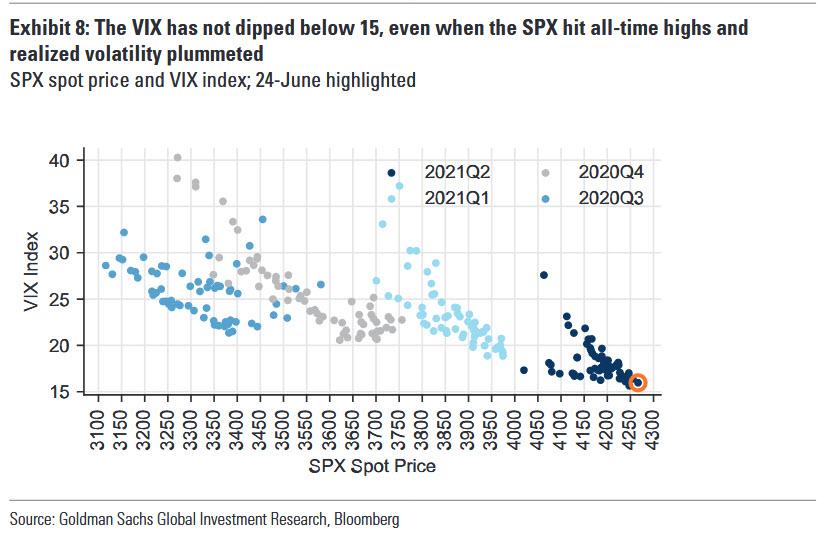
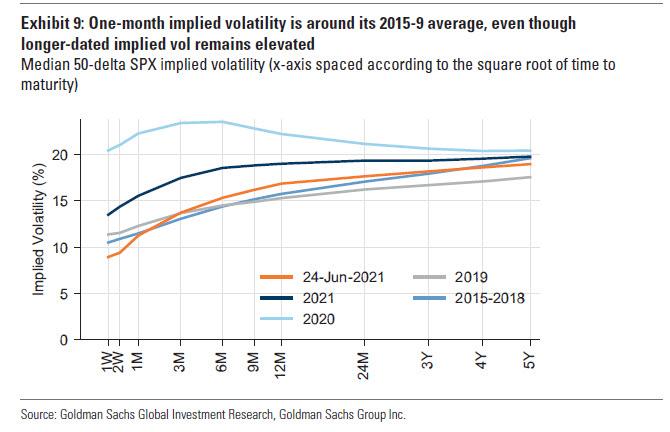
VIX futures are flat this morning after testing the 50-day Moving Average at 18.08 yesterday.  The VIX appears calm, but its declining wedge (pennant) formation suggests a rally at least as large as the one in 2020 from a higher base.


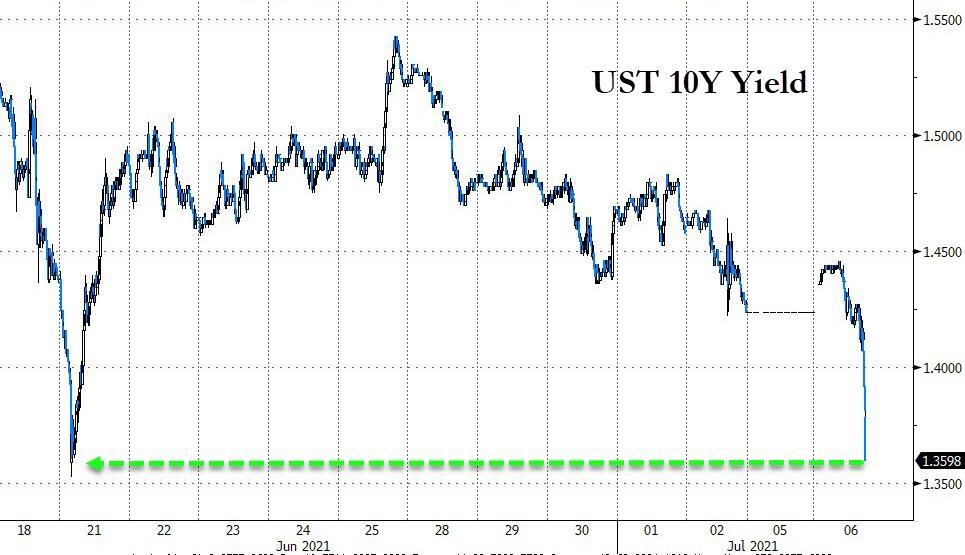
TNX may have (finally) made its Master Cycle low at an incredibly stretched 281 days this morning.  Treasury shorts are being pummeled.

ZeroHedge remarks, “After a modest stabilization overnight, the collapse in 10Y yields has resumed this morning tracking the latest drop in oil, which is down following a WSJ report that the UAE plans to “sell as much crude as possible before demand dries up” and aims to boost production and market share unilaterally amid high demand in threat to OPEC stability.

As a result of the latest deflationary gust, 10Y yields have dropped below 1.30%, sliding to the lowest since February 19…

… as the short squeeze discussed yesterday – as a reminder the latest JPM Treasury Client Survey found a near record number of shorts – accelerates.”


USD futures made an overnight high at 92.60 as it lingers near its Master Cycle high.  The Cycles Model calls for an approximate two week decline to the 50-day Moving Average at 90.87 before resuming its rally to 96.00.


Posted in Published | Comments Off on July 7, 2021

July 6, 2021

10:35 am

The Dow Jones Industrials have declined over 300 points in the first full hour of the cash market.  It appears that the DJIA is leading the decline at twice the velocity of the SPX decline.  That is attributable to the nature of a Wave 3.  This decline also tells us that institutions are leading the wave of selling, as retail investors usually come in later in the day.  This may be an Uh-Oh moment for retail speculators.

RealInvestmentAdvice comments, “Is the retail investor rampage over?

Since the crash in March 2020, the “retail investor army” marched propelled by chat rooms and social media channels. As discussed previously in “Blind Leading The Blind:”

  • In all, 46% have used social media for investing information in the past month.
  • 22% of Gen Z investors say they were younger than 18 when they started investing, versus 8% of millennial investors. 
  • Only 36% of young investors plan to use that money for retirement. 35% will make additional investments, while 19% will use the funds to pay for a major purchase.”


7:45 am

Good Morning!

SPX futures are lower this morning after making a new all-time high in the futures.  We shouldn’t be surprised by either.  SPX hit several relationships last Friday.  First, it was day 266 of the Master Cycle.  Second, Wave 5 is equal to Wave 1 at 4322.00, so it overshot that relationship.  Third, the DJIA, which is the most liquid index containing the largest companies failed again to make a new high on Friday and is also declining this morning along with the Transports.  Fourth, the indices are approaching 60 days from peak-to-peak (May 7 in the SPX and NDX, May 10 in the DJIA and Transports), which is one of the most basic Trading Cycles.

ZeroHedge reports, “Stock futures were steady, if drifting lower from overnight highs in muted trading as traders were watching whether Monday’s surge in oil which pushed WTI to the highest price since the November 2014 OPEC Thanksgiving massacre would depress stock sentiment after yesterday’s breakdown in OPEC+ talks. As of 730am, Emini S&P futures were down 2 points ot -0.05%, Dow jones futs were down 28 points ot -0.08% and Nasdaq minis were up 16.75 or +0.12%.”


NDX futures are modestly higher, having reached a new all-time high in the futures at 14743.38.  This index seems to be the most reluctant to reverse course.  However, it too appears complete.

ZeroHedge observes, “Stocks around the world continue to smash one record after another, and some of the world’s biggest money managers have a simple message: Get used to it.

The likes of BlackRock Inc., State Street Global Markets, UBS Asset Management and JPMorgan Asset Management expect equity markets to keep rising in the second half of the year, with many investors increasingly looking outside the U.S. for more returns. They cite reasons such as the economic recovery, continuing central-bank accommodation and a lack of alternatives amid low rates and the tightest credit spreads in a decade.

“Many indicators suggest there is still overwhelming liquidity in the system that is looking for a home,” says Carsten Roemheld, capital markets strategist at Fidelity International. Flows will continue to go into equities, though return expectations should be much lower from here, he says.”


The Fly in the Ointment for the NDX appears to be the tech-heavy Shanghai Composite Index, which is sitting on the neckline of a credible Head & Shoulders formation after making its all-time high on February 18.  A decline beneath the neckline is certain to have a knock-on effect to the NDX.  We should be seeing more reporting on Chinese stocks as the SSEC loses its grip.


VIX futures rose to a high at 15.89 over the holiday weekend.  The 50-day Moving Average is at 18.10 where a buy signal may be given.


TNX appears to be continuing  its Wave 4 low to 13.52 on a very stretched day 280 of its Master Cycle.  This may be typical Wave 4 pattern.  The Cycles Model also labels this as a “triple” Trading Cycle low.  A single Trading Cycle calls for a 5-10% move out of that reversal.  However The “triple” indicator suggests a potential rally over 30%.

ZeroHedge reports, “As stagflationary signals grow louder (after this morning’s ugly Services survey data), Treasury yields are plunging with 10Y back below 1.50% (testing the post-Fed/Bullad/Quad-Witch chaos puke lows)…

Source: Bloomberg

And 30Y yields have plunged back below 2.00%

Source: Bloomberg


Posted in Published | Comments Off on July 6, 2021

July 4, 2021

Happy Independence Day!

Since the ongoing market commentaries (see below) insist that the market has further to rise, let me take the opposite view.  As reported on Friday, the DJIA has reached its target of 34800.00.  That was the round number.  The actual target is the top of Wave [a] at 34849.30.  This completes an Expanded Flat correction, where [b] is deeper than [a] with Wave [c] bouncing back to the top of Wave [a].

I had announced that the Wave pattern was complete on Friday.  Here are a couple of rules that will help.  While the Wave pattern has all the elements necessary, it may still expand simply to reach the top of Wave [a].  The final top of an Expanded Flat correction does not have to be precise, suggesting Friday’s high may already be enough.

The bailout number is 34876.00 beyond which the third Wave of [c] becomes the smallest, which violates one of the few Elliott Wave Rules and opens the door for a new all-time high in the DJIA (which is what virtually everyone is predicting).

Why am I sticking to my guns?  First, we know where this pattern fails (34876.00).  Second, Wave [iv] of 5 is a triangle, which indicates “one and done.”  A Triangle in that position announces that the final Wave higher before a trend change follows.  That is why the DJIA has not been able to make new all-time highs, while the SPX and NDX had no Triangles and therefore could expand further to new highs.

The DJIA consists of the largest and most liquid stocks in the world.  Large international investors and institutions invest there.  This suggests there is liquidation among the largest and best known companies by the largest players.  It also means that retail investors may be holding the bag at this point.

Tomorrow is a market holiday, but overseas investors will still have access to the DJIA through overseas markets and futures.  The pattern could easily be finished in the futures market while we celebrate.  Tuesday’s market might be dancing to a different tune.

RealInvestmentAdvice comments, “Market Rallies To All-Time Highs

With the 4th of July weekend upon us, this week’s newsletter will be slightly shorter than usual. Such will ensure you “pitmasters” can get to work doing what you do best.

As we discussed last week, the market not only got off the mat and rallied back to new highs. That action continued through this week.

Q2 Peak Reporting 07-02-21, As Good As It Gets. Will Q2 Mark Peak Reporting? 07-02-21

The technical backdrop is not great. With the market back to 2-standard deviations above the 50-dma, conviction weak, and investors extremely bullish, the market remains set up for additional weakness.

However, we are in the first two weeks of July which tends to be bullishly biased. After increasing our equity exposure previously, we will give the market the benefit of seasonality for now.” 


Posted in Published | Comments Off on July 4, 2021

July 2, 2021

2:12 pm

BKX, the proxy for market liquidity remains beneath its 50-day Moving Average.  Perhaps this is also an indicator that the market may be exhausted.

ZeroHedge observes, “While today’s jobs report came in a bit on the weak side despite its impressive headline beat of 850K jobs created in June (a majority of which were teachers and bartenders) with wage growth slowing and the unemployment rate rising, we expect the Fed to look at today’s jobs data and try to again kick the can although whether this month or next, the inevitable taper announcement is coming not too long ater, the first rate hike as well. The only question is when.

Meanwhile, until that happens, Bank of America’s CIO Michael Hartnett reminds us that every day for the foreseeable future, as has been the case every day for the past 6 months, central banks bought $10 billion of bonds every day, the US federal government spent $20 billion every day, global stock market cap grew $73 billlion every day, and US bond & stock issuance averaged $20 billion every day.

The result: the just completed first half of 2021 was the 7th best for global stocks in the past 100 years…”


2:02 pm

SPX is finally giving us a blow-off top at 4350.00 today.  This is a top to sell into.  By the way, Primary Wave [5] is almost exactly 38.2% the length of Primary Wave [1].   This supports the probability of this rally being a huge Ending Diagonal since 2009.


1:25 pm

The DJIA has hit its target at multiple levels and may be ready for its reversal.  The transports have also stayed beneath their May 10 high in a Dow Theory confirmation.  This turn will whip the other indices (currently in blow-off tops) around in what may be a flash crash with multiple gaps down and investors trapped with ever growing losses.

ZeroHedge comments, “Michael Burry caused a stir on twitter (and subsequently in the financial press) late last month when he tweeted (and quickly deleted) that he expected “the mother of all crashes” would soon “spell doom” for crypto.

While he’s gone quiet again on Twitter, on Thursday, Barron’s published an interview with the infamous Scion Asset Management founder (whose story was featured in “the Big Short”) where Burry shared his skepticism of the “meme stock” craze, including GameStop, a company whose shares he correctly identified as undervalued back in 2019 (though he sold his position shortly after the price started trending higher in late 2020, missing out on the late-January surge in the company’s shares).”


7:20 am

Good Morning!

Those of you who love the outdoors will understand why it is so hard for me to tear myself away from our family lakefront property in northern Michigan.  We did renovations during the day, so the evenings were a favorite time to unwind and enjoy the campfire and the view.


SPX futures reached an all-time high of 4318.12 and may be finishing up its extended performance.  In the cash market Wave [v] equals 1.25 X Wave [i] at 4323.00, so there may be another push higher today.  The two things keeping the markets higher are the end of quarter window dressing (now over) and options expiration ending today.

In today’s options expiration, the calls outnumber the puts starting at 4375.00 and above, while the puts dominate below that level.  If I were a dealer, I would want to see the SPX decline to that level, since buying the index for only a day would be very costly if I were caught short.

The non-farm payroll report may spark a move in either direction, so we may know sooner than later today.

8:30 am

The non-farm payroll number came in at 850, missing the Fed’s bogey of 1 million, but above the 720,000 minimum.  ZeroHedge says, “After several months of major payroll disappointments, the BLS finally realized it has to come up with a strong number and it did just that moments ago when it reported that in June the US added 850K jobs, well above the 720K expected, and almost 50% more than last month’s 583K, in a welcome sign that the chronic labor shortages may finally be ending.”

ZeroHedge reports, “Another day, another record high for US stocks which have not hit a new all time high virtually every single day since the post-FOMC mini tantrum when Biden met with Yellen and Powell. At 7:30 a.m. ET, Dow e-minis were up 15.50 points, or 0.05%, S&P 500 e-minis were up 4.50 points or 0.1% to a new record high of 4,315, and now above Goldman’s year end price target of 4,300 and Nasdaq 100 e-minis were up 29.5 points, or 0.2%.”


Tuesday’s Master Cycle low in the VIX came early as the futures hover above that level, so we withhold judgement until after options expiration whether it is in or not.  The Ending Diagonal appears complete, so it won’t be long to discover whether the new trend has begun.


NDX futures made another all-time high at 14613.00 as it rallies to its Cycle top at 14660.91.  Open interest in puts dominate at 14550.00 and below, leaving little room for error should the market hit an air pocket during expiration.


TNX futures are still hovering just beneath a triple resistance at 15.41 to 15.56 (the 50-day Moving Average).  Wednesday’s low at 14.38 is not the Master Cycle low since it was made on June 19 at the same level.  That suggests Waves [i] and [ii] may have been made with TNX coiled for a breakout.


USD futures reached a new high at 92.74 this morning as it rallies toward its intended target at 96.00.  It is due for a Master Cycle high by mid-week, possibly reaching its Cycle Top resistance at 93.70.


Posted in Published | Comments Off on July 2, 2021

June 29, 2021

8:30 am

We are attending a family gathering at a northern lake for the next two days.  I will not be available for the blog tomorrow and possibly Thursday.

NDX futures made a new all-time (futures) high at 14512.38 at 6:45 am and has since retreated to the negative.   The Pattern is complete and Wave [v] is equal to 1.5 X Wave [i] at 14537.50.  NDX takes on a sell signal beneath the double trendlines at 14250.00.

ZeroHedge reports, “Global stocks were mixed and US futures edged to new all time highs as concerns over the Delta strain of Covid-19 spurred caution among investors. At 7:00 a.m. ET, Dow e-minis were up 46 points, or 0.13%, S&P 500 e-minis were down 1 points, or 0.02% after topping a new all time high of 4,283 earlier, and Nasdaq 100 e-minis were down 13 points, or 0.09%. The dollar strengthened and treasuries were steady while oil slipped and gold headed for the biggest monthly drop in more than four years.

While sentiment remains buoyant, investors are growing concerned by the latest evolution of the Delta variant, which is increasingly seen as a growing threat to the ongoing economic recovery in many areas, said Pierre Veyret, a technical analyst at ActivTrades. Even if the economic impact is “unlikely to be significant” in developed countries, “the inconsistency in vaccination campaigns in other parts of the world is likely to lead to an uneven recovery,” he said.”


SPX futures also made a new all-time high at 4282.88.  The cash market has made its target of 4291.00 yesterday, but the influence of the Industrials may keep it pegged near the top for another day or so as the DJIA has a target near 34800.00 (see yesterday’s final commentary).


VIX futures made a new low at 14.10 this morning, raising the probability of a new Master Cycle low today on day 243 of the current VIX Master Cycle.  The Ending Diagonal has been prolonged.  This is likely due to the fact that it is easily manipulated and has knock-on effects on the equity indexes.   The appearance of calm in the VIX gives a false sense of security as this formation acts like a coiled spring with a target of a complete retracement of the Diagonal.


TNX has pulled back to 14.90 as it chips away at the 50-day resistance at 15.33.  Additional resistance lies at the Intermediate=term level at 15.60.  A breakout may have dire consequences for the Fed, who appear to have control over rates.  That is simply not the case.  Once the breakout occurs, the Cycles Model foretells a month-long rally that may match or exceed its November 2019 high at 19.71.

ZeroHedge observes, “As in the stagflationary 1970s, the US Federal Reserve is once again denying that its own policies are the reason for a recent surge of inflation, even though there is good reason to think that they are. It is not too late to learn from past mistakes and reverse course – but the clock is quickly ticking down.

Fifty years ago, on June 22, 1971, US Federal Reserve Chair Arthur Burns wrote a memorandum to President Richard Nixon that will long live in infamy.

Inflation was picking up, and Burns wanted the White House to understand that the price surge was not due to monetary policy or to any action that the Fed had taken under his leadership. The issue, rather, was that “the structure of the economy [had] changed profoundly.” Accordingly, Burns was writing to recommend “a strong wage and price policy”:

“I have already outlined to you a possible path for such a policy – emphatic and pointed jawboning, followed by a wage and price review board (preferably through the instrumentality of the Cabinet Committee on Economic Policy); and in the event of insufficient success (which is now more probable than it would have been a year or two ago), followed – perhaps no later than next January – by a six-month wage and price freeze.”

Perhaps owing to Burns’s reputation as a renowned scholar (he was Milton Friedman’s teacher) and his long experience as a policymaker, the memo convinced Nixon to proceed with a wage and price freeze, and to follow that up with a policy of wage and price controls and guidelines for the entire economy.

For a time after the freeze was implemented, the controls and guidelines seemed to be working. They were even politically popular for a brief period. Inflation inched down, and the freeze was followed by more compulsory controls requiring firms to get permission from a commission to change wages and prices.

But the intrusive nature of the system began to wear on people and the economy because every price increase had to be approved by a federal government bureaucracy.

Moreover, it soon became obvious that the government controls and interventions were making matters worse.


USD futures are on the rise again in a probable rise to the Cycle Top at 93.78 in strength over the next week.  However, that may not be the extent of the rally, as it is due to resume through the end of July.


Gold futures plummeted to 1750.15 in the overnight market as it makes its way to test the Broadening Wedge trendline at 1725.00.  The Cycles Model just posted the sign, “Abandon all hope ye who enter here.”   Should the decline cross the trendline, the decline may continue through mid-August.


Posted in Published | 2 Comments

June 28, 2021

6:30 pm

During the week of May 10 I was looking for the all-time high in the equities markets.  Sure enough, the DJIA made its all-time high that very day (day 250 of that Master Cycle).  However, 5 weeks later, the SPX and NDX were again making new highs.  The Industrials have not.  The DJIA has one more attempt to make a new all-time high in the next few days. My calculation is that it may end in failure with a top near 34800.00.  Both the Cycle Top and the top of Wave [a] may provide maximum resistance.  Nobody has mentioned this, so it’s time to bring this out.

What this means is that the downtrend may already be in place.  The Fed and all the hopium-filled investors thought they can extend the rally without end.  This chart argues otherwise.  In fact, it the DJIA is poised at the top of Wave 3, it means that the other indexes reversal may be swift and strong.


8:00 am

Good Morning!

My wife and I handed off our eldest daughter to her new husband last week and, after the ceremony and celebration, heaved a sigh of relief.  The stress is gone, at least for now.

SPX futures remained flat over the  weekend, leaving open the possibility of yet another squiggle higher to match up Wave [i] with Wave [v] at 4291.00.  Another possibility is that Wave [5] equals Wave [1] X 4.25 at 4308.00.  Round number resistance at 4300.00 may also come into play.  Today is day 262 of the current Master Cycle, so the pressure for a reversal is on.

This week’s options expiration shows calls dominating at 4275.00 and higher, while puts are moving up to domination 4245.00 and lower.  This is the narrowest I have seen the neutral range of only 30 points.  Equity shorts have expanded since the FOMC meeting.

ZeroHedge reports, “S&P500 futures paused at fresh all time highs in a subdued session as traders eyed central bank support and awaited the June jobs report due Friday. European stocks dipped as new travel restrictions prompted by the Covid-19 Delta strain spurred a re-think of the reflation trade. The dollar and oil posted modest gains.

Contracts on the Nasdaq 100 led gains while the S&P 500 fluctuated following the best week for the underlying gauge since February following an agreement on President Joe Biden’s $1.2 trillion infrastructure spending deal (which however may prove to be a total dud) and waning concerns about a sooner-than-expected policy tightening from the Federal Reserve. At 730 a.m. ET, Dow e-minis were down 17 points, or 0.05% S&P 500 e-minis were up 3 points, or 0.08% and Nasdaq futs were up 42.50 ot 0.29% as FAAMG megacaps edged higher in premarket trading despite higher bond yields.”


NDX futures rose to a weekend high of 14388.75, testing the June 24 high.  It may require yet another probe higher to meet or exceed 14431.00 to meet its target where Wave [v] equals Wave [i].  This weeks open interest in call options dominate at 14300.00 and higher, while put options outnumber calls at 14260.00 and lower, leaving the NDX in a positive range, but subject to bearish pressure beneath the trendline at 14250.00.


VIX futures are rising to a weekend high of 16.37, suggesting a rally out of last week’s Master Cycle low may be imminent.  The 50-day Moving Average at 18.24 marks the buy signal.


This morning TNX rose to 15.12 while futures rose to 15.34, challenging the 50-day Moving Average at 15.12.  A rally above that level gives a buy signal.


USD futures rose to 92.02, indicating that the next move higher may be underway.  The next two weeks appear to have considerable strength of momentum behind them.


Posted in Published | 1 Comment

June 25, 2021

8:00 pm

SPX nearly reached the Wave relationship where [v] equals [i] at 4291.00.  The topping formation is clearly an ending Diagonal, with overlapping Waves of (a)-(b)-(c).  It is interesting that the positive gamma generated by this week’s options expiration brought the final Wave up to the very last hour on Friday.  The market is very fragile as the influence of options expiration wears off.  As it turns out, next week’s options are heavily weighted toward the puts at 4240.00 and below, barely 1% beneath tonight’s close, keeping a tight “collar” on the SPX movements.

ZeroHedge observes, “With last week’s post-Fed tantrum seemingly a distant memory, spoos just hit a new all time high at 4,275 as low realized volatility helped push the VIX near new Covid-era lows…

… if not the lowest level. Indeed, with the VIX at 16.0, and volatility risk premium elevated, Goldman notes that short-dated hedges are not cheap – especially relative to historically low implied volatility for other key markets (1M SPX implied vol is 43rd percentile vs. the last 5 years, vs. HYG, EEM, and HSCEI all below 15th percentile). As a result, Goldman also sees “heightened potential for realized volatility to approach June’s lows, leaving the VIX with moderate downside.”

The reason why VIX has so far failed to hit new lows despite , as Goldman’s Rocky Fishman explains, is because the skew index just hit a new all time high: this means that put options have been unusually expensive relative to at-the-money options, helping support the put-heavy VIX index. High skew, which compares put option prices with at-the-money option prices, has reached new all-time high, and reflects investor perception that high volatility would return should markets sell off.”


8:25 am

Good Morning!

NDX futures reached an overnight high at 14382.00 and has eased down, leaving yesterday’s 12:00 noon high as the top.  I have pointed out that the NDX often leads the rest of the market and this puts us on the alert for the rest of the market to follow.

ZeroHedge reports, “S&P futures traded at record highs, tracking strong gains in Asian markets, as investors braced for the Fed’s preferred inflation data following a tentative bipartisan agreement on infrastructure spending, while U.S. lenders rose after clearing stress tests. At 7am ET S&P futures were up 5.75pts or 0.14%, Dow Jones futs were +110 or 0.32% and Nasdaq futs were up 29.25 or +0.2%. Global stocks are poised for their biggest weekly advance since April, extending their fifth monthly gain.”


SPX futures rallied to 4265.12, just beneath yesterday’s cash high at 4271.28 on day 259 of the Master Cycle.  4265.00 is where Primary Wave [5] is 3.75 times the length of Primary Wave [1].  The normal Wave relationship is that Wave [5] equals Wave [1], so you can see how stretched this relationship is…

Charles Hugh Smith opines, “Risk has not been extinguished, it is expanding geometrically beneath the false stability of a monstrously manipulated market.

One of the most under-appreciated investment insights is courtesy of Mike Tyson: “Everybody has a plan until they get punched in the mouth.” At this moment in history, the plan of most market participants is to place their full faith and trust in the status quo’s ability to keep asset prices lofting ever higher, essentially forever.

In other words, the vast majority of punters are convinced they will never suffer the indignity of getting punched in the mouth by a market crash. What makes this confidence so interesting is massively distorted markets always end the same way: crisis, crash and collapse.”


VIX futures rose to 16.17 in the overnight market after yesterday’s low  at 14.19.  Another stretched Cycle at 281 days thus far.  The snap-back may be atrocious.


Posted in Published | Comments Off on June 25, 2021

June 24, 2021

10:40 am

SPX is now complete to the upside.  There are 5 distinct Waves in the final Wave C and its components.  In addition, The hourly Cycles Model suggests a break in the uptrend by noon today.  No guarantees, but I cannot find any convincing arguments to the contrary.

12:00 noon

A check on open interest in the options market show puts outnumber calls at 4225.00 and below.  The calls have it at 4265.00 and above.

ZeroHedge notes, ““Gamma Squeeze” has been the word of the year so far for many freshly-minted equity-trading gurus (as they watched their AMC, GME, and other meme stocks momentum ignited “to the moon” time and again in the first half of 2021).

To have a “gamma squeeze” there first needs to be a “delta squeeze”.

A sudden surge in call volumes can lead to options market makers (MM) having to purchase shares of stock, which can drive the stock price higher.

When new options positions are traded, MM may need to immediately hedge the risk generated by these new trades.

This initial hedge is called a “delta hedge” and can result in large amounts of stock being purchased. As the stock price moves around, MM may need to adjust their hedge positions, which is called a “gamma hedge”.


8:00 am

Good Morning!

This is the day of my eldest daughter’s wedding, so I will be paying absolutely no attention to the markets after this brief notation.

SPX futures are making a new all-time high this morning (by less than a point higher than the June 14 high).  It is very tired and has wasted a lot of energy (liquidity) for little results.  Wall Street is doing its best to keep sentiment high, but it is wearing very thin.  Today is day 258 of the Master Cycle.  A reversal may be imminent.

ZeroHedge reports, “U.S. stock-index futures rose, with Nasdaq 100 contracts set for a fresh record and spoos just shy of all time highs, as investors were encouraged by dovish commentary form a barrage of Fed speakers which will continue today with Barkin, Williams, Bullard, Kaplan, Bostic Harker all speaking shortly after we get a slew of economic data.  At 7:15 a.m. ET, Dow e-minis were up 168 points, or 0.5%, S&P 500 e-minis were up 20 points, or 0.47%, and Nasdaq 100 e-minis were up 80 points, or 0.56%, to a record 14,344. 10Y yields were 1.49%, oil was flat, gold was trading near session highs and bitcoin rebounded from overnight lows.”


NDX futures made a new all-time high at 14358.50 this morning.  NDX still leads the markets and is likely to lead the downside, as well.

NorthmanTrader comments, “Oops, he did it again. The second there was any concern in markets about tapering or the potential of earlier than expected interest rate hikes as suggested in last week’s Fed dot plot Jay Powell hurried to assure investors that the dot plot was meaningless and when Bullard dropped a 2022 rate hike bomb suggestion on Friday both Powell and Williams, aided by Kashkari on Friday, immediately put a stop to any such notion this week. After all Bullard is not a voting member and so who cares what he says. Voting members stay on script non voting members and ex officials can be more bold and reality prone in their assessments.”


VIX futures made a new low at 14.19 this morning.  This is the lowest it has been since mid-February last year, a week before the crash began.  Is this Deja’ Vu all over again?  VIX has been persistently ratcheted  down to keep up momentum in stocks.  The current Master Cycle is unbelievably stretched at 281 days.  There will be no warning when the entire market reverses.


TNX may have completed its retracement and is ready for the reversal.  It is in a period of strength over the next several days that should propel it above the 50-day Moving Average.

ZeroHedge reports, “For the second day in a row, today’s Treasury auction of $61BN in 5 year paper, has come in quite weak in the aftermath of last week’s hawkish FOMC pivot.

One day after we got a tailing, disappointing 2Y auction, we got a carbon-copy only this time at the 5Y tenor, when the US sold the latest batch of 5Y paper at a high yield of 0.904%, a sharp jump from last month’s 0.788%, the highest 5Y auction yield in 16 months since the pre-covid Feb 2020 auction, and a 0.2bps tail to the When Issued 0.902%.

The bid to cover dropped from last month’s impressive 2.49 to just 2.36 which was right on top of the six-auction average.”


Posted in Published | Comments Off on June 24, 2021

Juune 23, 2021

7:05 am

Good Morning!

My eldest daughter is getting married tomorrow and, being the father of the bride, I have a lot of responsibilities over the next two days.  I may not be able to comment as often as I would like.

NDX futures continued to make new all-time highs at 14312.62 in the overnight market in what appears to be an extended Wave [v].  While the futures are coming back down from their peak, there is a long way to decline before a chart sell signal is reached.  Each of the previous two declines have met with push back in the overnight markets, quite possibly from the Bank of Japan, which is buying equity ETFs.


SPX futures peaked at 4248.12, short of yesterday’s high at 4255.84.  The two day rally met all the requirements for a retracement, short of a new all-time high.  Short-term support at 4227.7 is the first level at which we go on alert for a sell signal.  Should the SPX make new highs, we could see SPX reach for the Cycle Top resistance at 4281.88 over the next two days.  The next Fibonacci/Wave relationship level is 4300.00.

ZeroHedge reports, “S&P 500 futures erased earlier gains, and after rising as much as 0.3% when they traded at all time highs, Eminis were last seen down 4 points or 0.1% to 4,232, as European stocks also struggled to gain momentum on Wednesday despite reassurances from U.S. Federal Reserve Chair Jerome Powell that the Fed is not rushing to hike rates contrary to the market’s post-FOMC freakout last week. Treasuries fell, the dollar was flat and bitcoin soared after tumbling on Tuesday.

On Tuesday, Powell sought to reassure investors on Tuesday, saying that the central bank will watch a broad set of job market data to assess the economic recovery from COVID-19, rather than rush to raise rates on the basis of fear of inflation. New York Fed President John Williams echoed Powell, saying that a discussion about raising interest rates is still “way off in the future.”


VIX futures are consolidating within yesterday’s trading range.  It has made a 91% retracement and may be ready for a reversal.


TNX still lingers near the Master Cycle low as I write.  However, the Cycles Model implies a sudden burst of strength today and more to come by the end of the week.  It may be that the Fed cannot keep a lid on this kettle despite all the jawboning.

Posted in Published | 1 Comment

June 22, 2021

8:25 am

Good Morning!

SPX made the 61.8% retracement level, but may not be finished.  SPX futures are mildly positive, but no breakout above yesterday’s futures high at 4224.88.  Friday’s low appears to be the bottom of Wave 1.  Yesterday’s rally may only be Wave (a) of 2, leaving Waves (b) and (c) to go.  Should that be the case, we may see a pullback to the mid-Cycle support at 4193.45 [Wave (b)], then another attempt at a retracement.  The maximum retracement may be as high as 4238.00.  Keep in mind that this market is an accident waiting to happen.  I am only giving the standard version of the Elliott Wave process.

ZeroHedge reports, “U.S. stock-index futures were little changed, trading just 1% below their all time high, while global shares extended their recovery on Tuesday from four week lows, as investors focused on prospects for post-pandemic economic growth, putting fears of a hawkish Fed in the rearview mirror even as they awaited Fed Chair Jerome Powell’s testimony before Congress. Nasdaq 100 futures extend increase to as much as 0.3%, the highest for Tuesday’s session, with contracts on the S&P 500 rising 0.1% as of 7:15am in New York.”


NDX futures made an overnight high of 14177.88.  Last Thursday’s high at 14205.40 is too close for comfort to call yet.  Should NDX go higher, resistance may be the Cycle Top at 14244.10.  The key here is investor confidence, which is waning.

ZeroHedge comments, “Traders of a certain age may recall that back in 2013, around the time the Fed’s “Taper Tantrum” sparked a surge in yields and led to a risk asset selloff, a big (if entirely artificial) debate emerged within financial media, where the Fed muppets and their media puppets would argue that “tapering is not tightening” while anyone with half a brain realized knew that this was total BS.

Fast forward to today when Morgan Stanley’s Michael Wilson opens up an old wound for clueless Fed apologists, saying in his latest Weekly Warm Up note that “Tapering is Tightening”… but then adds that contrary to the market’s shocked reaction to last week’s Fed meeting, tightening actually began months ago.”


VIX futures sagged beneath the 50-day Moving Average at 18.29 as investors mistake a normal retracement as a possible relenting of the Fed.  A 61.8% retracement would drop to 17.33, which is what appears to be happening this morning.


TNX is on the rise as it approaches the 100-day Moving Average at 15.25.  Intermediate-term resistance and the 50-day both reside at 15.74 to 1584.  The Cycles Model projects rapidly rising strength yet this week which may encourage a breakout (i.e. an “accident”).

ZeroHedge remarks, “Merrie Melodies

Just like that, all was well with the world again: bond yields up; equities up; commodities mainly up; and the dollar mainly down. What a merry market melody! This was despite a confusing barrage of Fed-speak which, as the headlines initially came in, had me thinking of ‘Elmer Fed’, and a silly little man in a deerstalker hat with a shotgun saying: “Be vewy, vewy quiet. I’m hunting 2% infwation and wo unempwoyment with high asset pwices and wo ineqwality. Huh-uh-uh-uh-uh-uh-uh-uh.


USD futures are still consolidating within the last two days’ trading range.  The rally may not be over yet.  The Cycles Model suggests about two more weeks of growing strength into the next Master Cycle peak.


Posted in Published | 1 Comment