January 27, 2022

7:55 am

NDX futures reached an overnight high of 14397.50 in a possible attempt to rise above the negative gamma beginning at 14400.00.  While NDX options are sparse due to the price, the QQQs (closing price $344.57) are a different story.  Tomorrow’s options expiration start with a massive put position at 350.00 and large positions every 5 points down to 300.00.  The inference here is that, should a short gamma panic ensue, the NDX may decline as far as 12000.00.

ZeroHedge reports, “After a rollercoaster overnight session, which saw S&P futures tumble as much as 2%, dropping as low as 4,260 following Powell’s hawkish comments, futures have recovered and briefly traded in the green while European stocks are still red though trading near session highs as traders spooked by the Fed’s comments started digging for bargains. At 7:20am ET (incredibly illiquid) emini S&P futures were flat at 4,341, Dow futures were up 0.1% or 36 points and Nasdaq futures swung the most and after dropping as much as 2.2% turned green some 0.5% higher or 75 points after Bill Ackman revealed late on Wednesday he had purchased 3.1 million Netflix shares.


SPX futures rose as high as 4376.00 in early morning trading.  Overhead resistance is at 4400.00.  In tomorrow’s options expiration, Max Pain is at 4415.00, while options gamma turns short at 4360.00.  This market is still ruled by the options market and the slightest accident may set off a chain reaction decline.  The SPX turns positive above yesterday’s high at 4453.23.


VIX futures remained range-bound inside yesterday’s trading range in the overnight session.  The Feb 2 options expiration shows calls dominating at 25.00 and above, while gamma turns positive at 27.00.  The bias is to go higher and positive gamma may propel it to 60.00.

CityIndex observes, “Stock markets have been volatile since the start of the year and it doesn’t appear to be letting up anytime soon.  There are 3 ongoing issues that are primarily causing the volatility in the markets.  They are as follows:

  1. The end of monetary policy easing and the ensuing interest rate hikes.Most major central banks have their first meetings of the year within the next 2 weeks
  2. The ongoing drama surrounding Russia’s buildup of troops on the border of Ukraine (presumably getting ready to invade)
  3. Earnings season and forward guidance. NFLX did little to inspire confidence last week as they said they only see 2.5 million new net subscribers in Q1 vs analyst’s average estimate of 5.8 million. Could this be the beginning of the end for “Stay-at-Home” stocks?


TNX is hesitant after bursting above Cycle Top resistance at 17.99.  It may retest the Cycle Top before moving higher, as trending strength improves next week.

ZeroHedge observes, “With attention increasingly turning to how fast the economic slowdown will hit the US economy in 2022, growth cheerleaders will have a favorable, if brief, diversion today courtesy of the Bureau of Economic Analysis which moments ago revealed that in Q4, US GDP grew at a remarkable 6.9% annualized Q/Q clip, nearly three times faster than the 2.3% growth recorded in Q3 and well above the 5.5% expectation, even if the components of GDP are an ominous confirmation that the US is engaging in aggressive restocking which could soon lead to a deflationary liquidation wave.


USD futures continued their rise this morning to a morning high of 97.26.  The Cycles Model suggests that USD may rise in strength until the second week of February.  The potential target may be 98.30, the 61.8% Fibonacci retracement of the 2020 decline.


Posted in Published | 1 Comment

January 26, 2022

4:1o pm

ZeroHedge examines the entrails…


4:05 pm

How do the dealers do it???  The VIX closed at 31.16, neatly at its Max Pain expiration between 30.00 and 32.50.  SPX closed just 10 points beneath its “logjam” of puts…a potential  $80 million loss cut by three quarters.


SPX just crossed beneath the short-gamma line where there are 20,630 put contracts for tonight’s expiration.  This may be bigger than Monday.


2:32 pm

TNX vaulted above the Cycle Top resistance at 17.95.  This is starting to get serious.

ZeroHedge remarks, “Since the last FOMC meeting, on December 15th, Gold is the lone asset-class that is higher while bonds and stocks have been monkey-hammered and the dollar is weaker…

Source: Bloomberg

All US equity markets are lower since the last Fed meeting with Tech/hyper-growth hammered and all the bubble-markets blowing up.

Financial Conditions have tightened significantly since the last Fed meeting (after easing dramatically into the Santa Claus rally)…


1:45 pm

BKX has bounced from its trading channel trendline and made a 45% retracement of its decline from the peak made on January 13.  The retracement was resisted by the 50–day Moving Average at 136.14 and creates a potential confirmed sell signal.  The current Master Cycle may last through mid-February.  However, there may be another Master Cycle ending in late March that shows us the bottom of the coming decline.

ZeroHedge remarks, “While traders are mostly focused on what the Fed will say about the coming rate liftoff, with markets today expecting just over 4 rate hikes by the end of 2022…

… a much more relevant question is what the Fed’s balance sheet runoff – i.e., Quantitative Tightening (QT) – will look like both strategically and tactically.

As a reminder, two weeks ago Deutsche Bank predicted some $3 trillion in balance sheet normalization as the Fed undoes the emergency actions from the covid crisis which doubled the Fed’s asset holdings from 20% to almost 40% of GDP.


1:27 pm

The DJIA is challenging its perch above the trendline of the 40-month old Orthodox Broadening Top.  This is a very serious support near 34400.00.  Should it close beneath this level at the end of the month, it would be considered a monthly bearish reversal and have some serious long-term implications for equities.


9:45 am

NDX was turned away at 4th Wave resistance at 14500.00.  It is well beneath the 200-day Moving Average at 15010.00.  Should the decline continue, the minimal target may be beneath 13000.00.  The Cyclical Model suggests it may go as low as 12200.00.


8:35 am

Good Morning!

SPX futures rose overnight to 4431.40.  There is a rule of thumb that Wave 4 may not rise above the top of Wave [iv] near 4500.00.  Should the bounce go higher, we may have to review the Wave pattern.  The daily Cycles Model tells us today is day 259.  However, the hourly Cycles Model allows 2.5 more days to play out the decline.  There are possibly 2 more hours in this hourly segment to complete the bounce.

Todays options expiration show negative gamma beginning at 4360.00, so the dealers and hedge funds have an incentive to stay above that level.  The distribution of calls vs puts is pretty even to 4400.00, although I cannot presume to say where gamma turns positive, since the positions are light, compared to last week.  The NYSE Hi-Lo Index closed at -141.00.

ZeroHedge reports, “Yesterday, after Microsoft stock initially slumped despite beating across the board as the skeptical market latched on to even the smallest weakness to hammer the stock, dragging down both the Nasdaq and S&P futures close to session lows, we said that the reaction was premature and would reverse, as the earnings release did not include guidance and would promptly reverse once the company revealed its cloud guidance in its conference call a little over an hour later. Well, that’s precisely what happened and after first tumbling as much as 5% after hours, the 2nd largest US company (MSFT has $2.2 trillion in market cap) reversed all losses and is now trading solidly in the green, sparking broader tech momentum, lifting the Nasdaq as much as 2.1% this morning and (briefly) helping traders forget that today at 2pm the Fed is expected to unveil a March rate hike and balance sheet runoff a few months later.

Indeed, contracts on the Nasdaq 100 led broad-based gains – which would have been gaping losses had MSFT failed to reverse late on Tuesday – as U.S. stock futures rallied, with investors bracing for the Federal Reserve’s decision and preparing for a slew of earnings from companies including Tesla, Intel and Boeing. Nasdaq 100 futures jumped as much as 2.1% while S&P 500 and Dow Jones futures also rallied. The VIX fell from a one-year high, snapping six days of gains. Elsewhere, the Stoxx Europe 600 rose 2% in the biggest jump in seven weeks. 10Y TSY yields rose to 1.79% with the Fed’s policy announcement in the limelight; the dollar was slightly higher, as was Bitcoin while Brent oil traded just shy of $90 on its way to triple digits.”


VIX futures dipped to a low of 28.14 this morning.  Should VIX move back above the neckline, we may see it reach a high of 60.00.  The reason is that no one is expecting it, so this is the point where panic begins.  What analysts fail to recognize is the breakout of the VIX is a signal for more (higher) to come.

ZeroHedge calmly advises, “(interim) peak FED fear

Yes, the recent sell-off is very FED related and the uncertainties for how QT will be received are enormous and will not go away over-night. But we also know the “Miss Market’s” fantastic ability to quickly switch her view from “glass half empty” to “glass half full”. There are many signs out there that show that we have sold off too hard, that volatility is too high and maybe the meeting (without FED basically saying anything new) will be the improbable catalyst that will serve as a slightly more risk-on green-light for a few sessions.”

(There are many hoping they are right!)


TNX is consolidating just beneath the Cycle Top resistance at 17.92.  It may continue that sideways motion through the end of the week, as trending strength comes back next week.  However, there’s no telling what the Fed will announce, so stay tuned for some possible fireworks above 18.00.

ZeroHedge remarks, “Pre-FOMC drift” – but this time, thanks to a massive “kick-save” from Microsoft guidance which turned the entirety of global risk-assets from cratering lower in the after-hours trade last night to now, spasming higher into Fed later today (NQ +4.4% low to high) and with still substantial “short Gamma vs spot” out there for Dealer hedging purposes, as well as sharply “netted-down” exposure from Fundemental investors and outright “shorts” in CTA Trend….while conversely, we currently see a quiet Rates trade (we did see a buyer FVH2 in 5k / $254k / 01 of UST belly, as well as UPSIDE protection against a “dovish surprise,” e.g. FVH2 120C ppr pays 14-1.5 on 4k…although later see more of the same “momentum” reloading back into large downside FVH2 119.5 / 119 PS ppr pays 13.5 on 25k…and also a fairly largly “buy” of ED$ May Put Fly)

However, the meat of the note today into the FOMC will touch-upon the “potential” that a “no hawkish surprise” or even “dovish hawk” Fed commentary (vs well-managed expectations) in-and-of-itself could see some of that recent “downside Crash” hedge buying get unwound, which then could set-off a +++ “virtuous feedback loop” spiral from Vol –space into the Equities –space, where exposure has been netted-down with violence on the fundamental / discretionary side, is at a historically “low” allocation from the Vol Control side, and of course is outright “Short” on CTA Trend.”


Posted in Published | 3 Comments

January 25, 2022

2:20 pm…mid-course correction

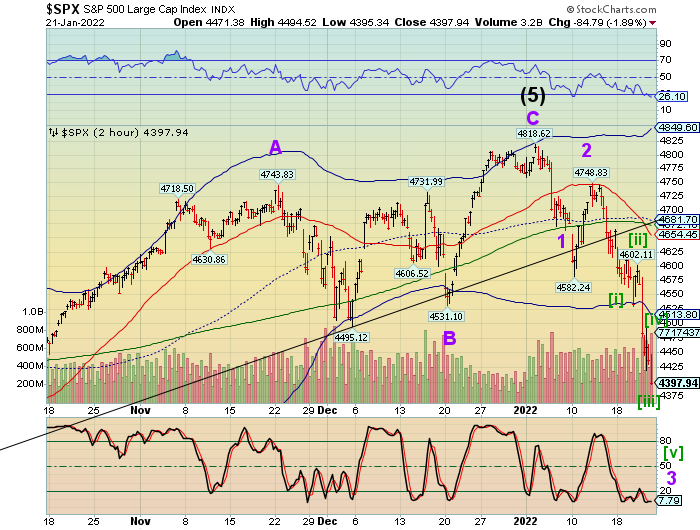
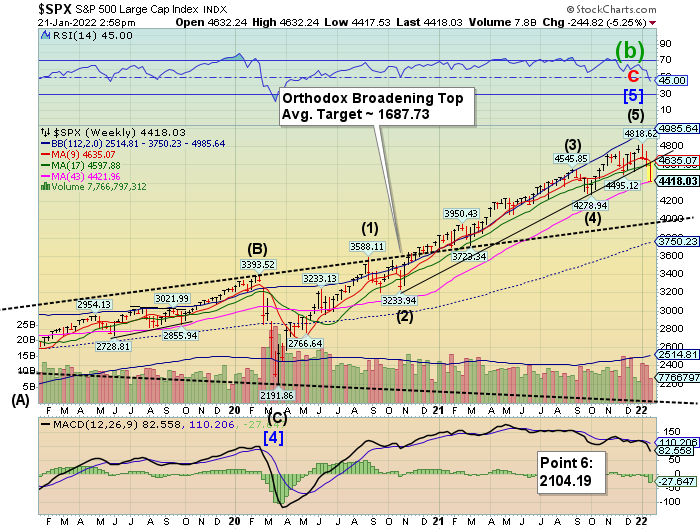
It now appears that yesterday’s decline may have completed Wave 3.  I should have known, since it took more time than the pattern suggested for a lesser Wave.  It now appears that Wave 4 may be in its final stages.  The fact is, Triangles usually only fit Wave four of an impulse, so this may be the final surge, which is likely to be over near 3:00 pm.  The decline that follows may register another record.  4000.00 is still the target.

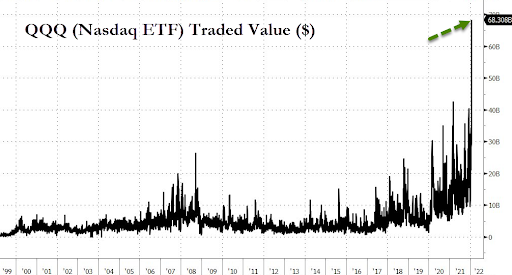
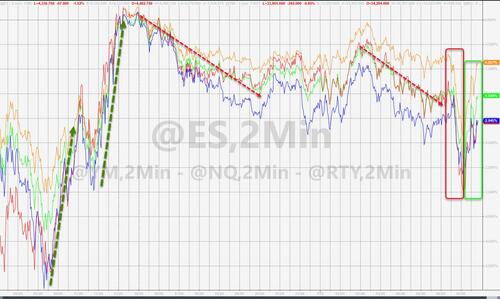
ZeroHedge informs, “In perhaps the best post-mortem of yesterday’s insanity, Morgan Stanley Quantitative And Derivatives Trading Desk (QDS) writes that yesterday intraday volatility was absolutely extraordinary with record cash volume of $1.16tr.

The good news according to Morgan Stanley is that a tame close-to-close return has kept systematic supply at bay, and the rebound in growth stocks helped stem the P/L drawdowns for both HFs and retail traders alike. The bad news according to the QDS trading gurus is that the afternoon rally was likely driven by short covering, and it is hard to draw a read from this into the future – i.e., not much has changed, and the market is still grappling with the concern of a growth shock while the Fed is likely on autopilot.”

ZeroHedge further analyses, “We previously discussed how a mystery put-selling whale emerged just around noon on Monday…

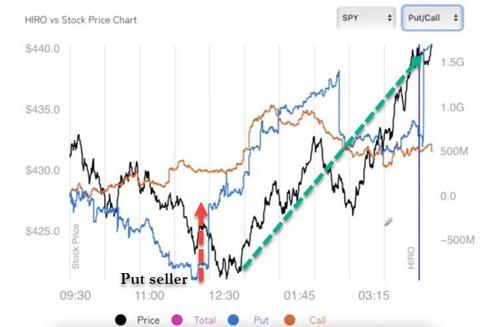
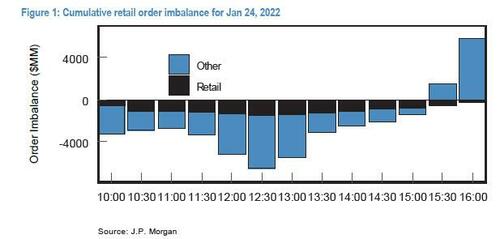
… and helped reverse a historic rout of nearly 5% in the Nasdaq, which then attracted a frenzy of retail dip-buying momentum chasers, who reversed near-record selling in the first half of the day to near-record buying in the second half.

But while there is still some speculation as to who or what may have been behind yesterday’s historic reversal, what is beyond dispute is what a massive difference the reversal meant for the market’s future demeanor, in other words the difference between the market closing down -4% on Monday and just slightly green.”

1:15 pm

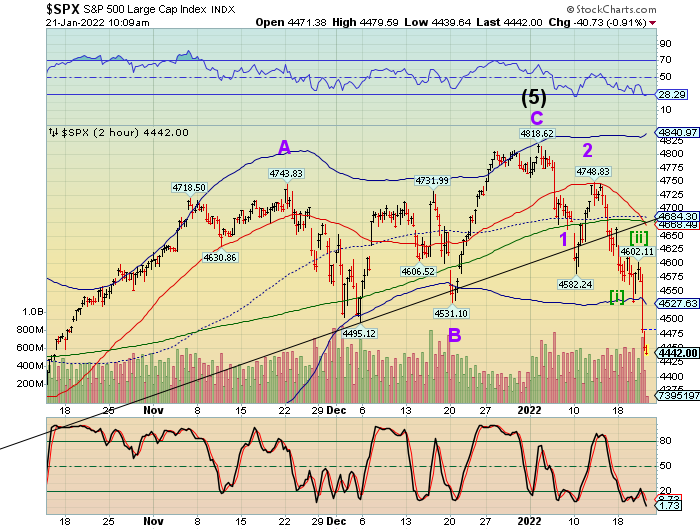
There is a Triangle formation visible that tells us one more move may be necessary to complete Wave 3.  The target may be near 4150.00, then another tear-your-face-out rally into FOMC day.  This rally may be larger than yesterday’s, so it may be time to take some short profits.  However, stay tuned for another short opportunity tomorrow.  The roller coaster continues.

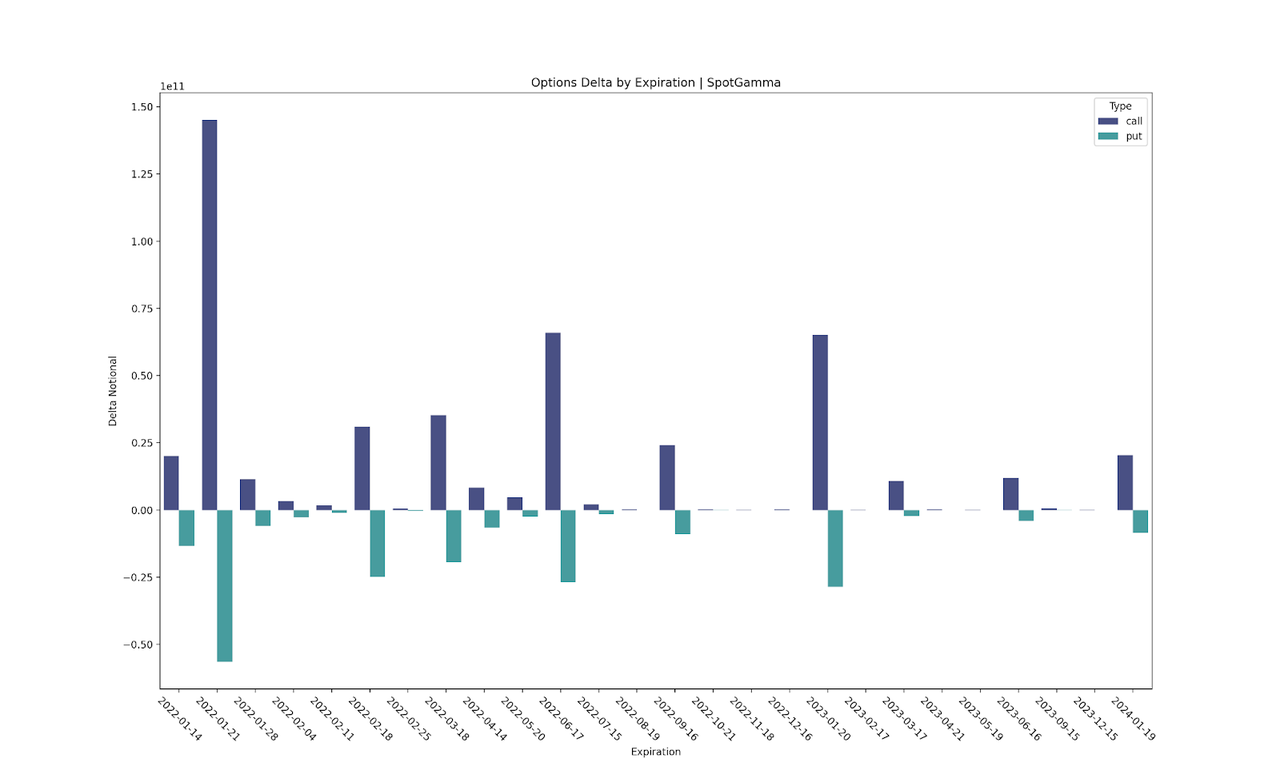
Gamma for tomorrow’s options expiration turns negative at 4350.00.

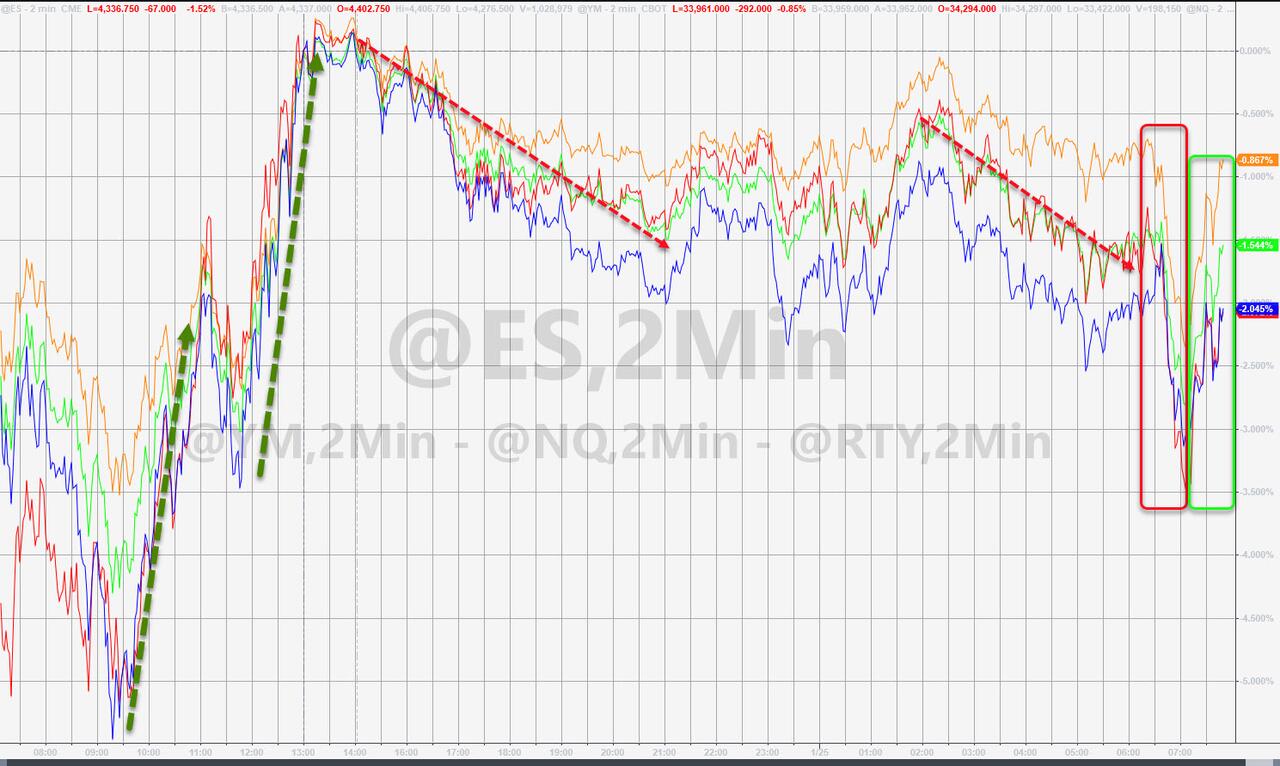
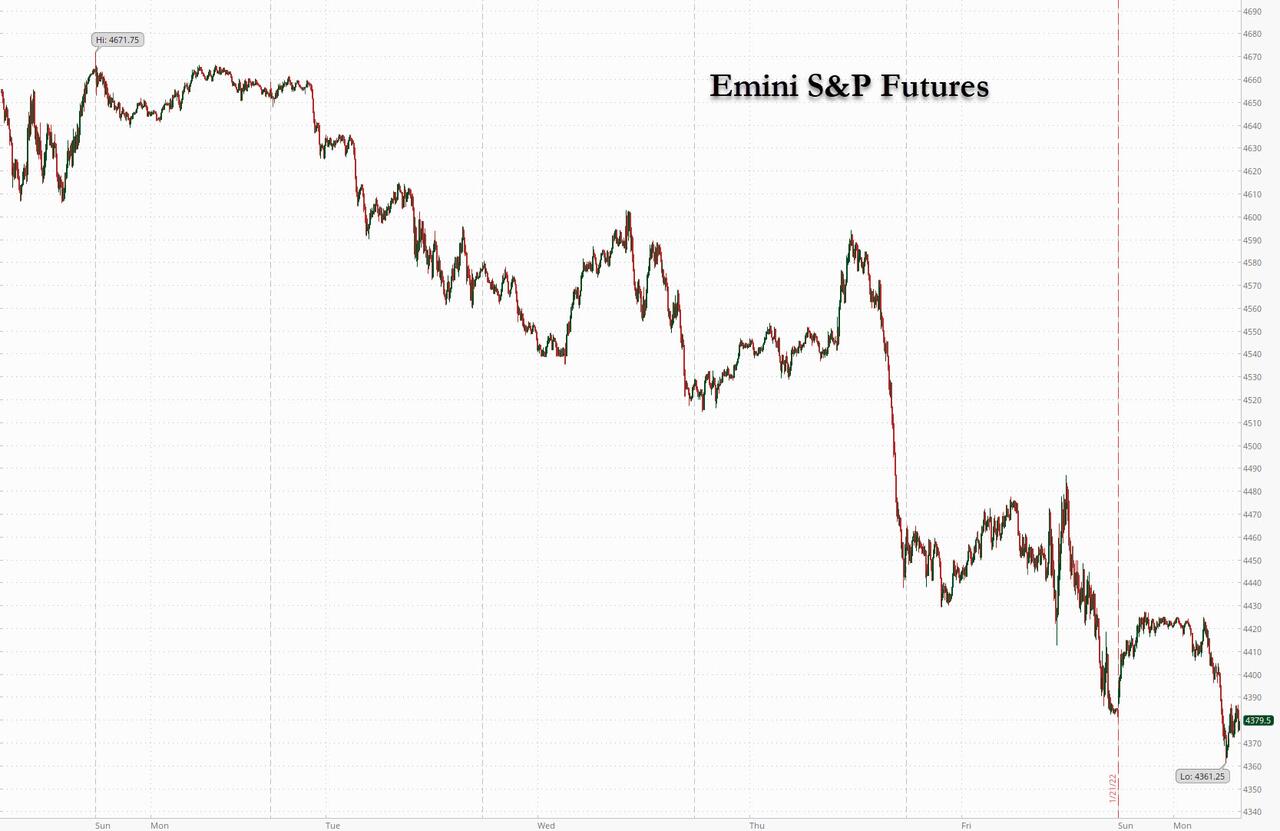
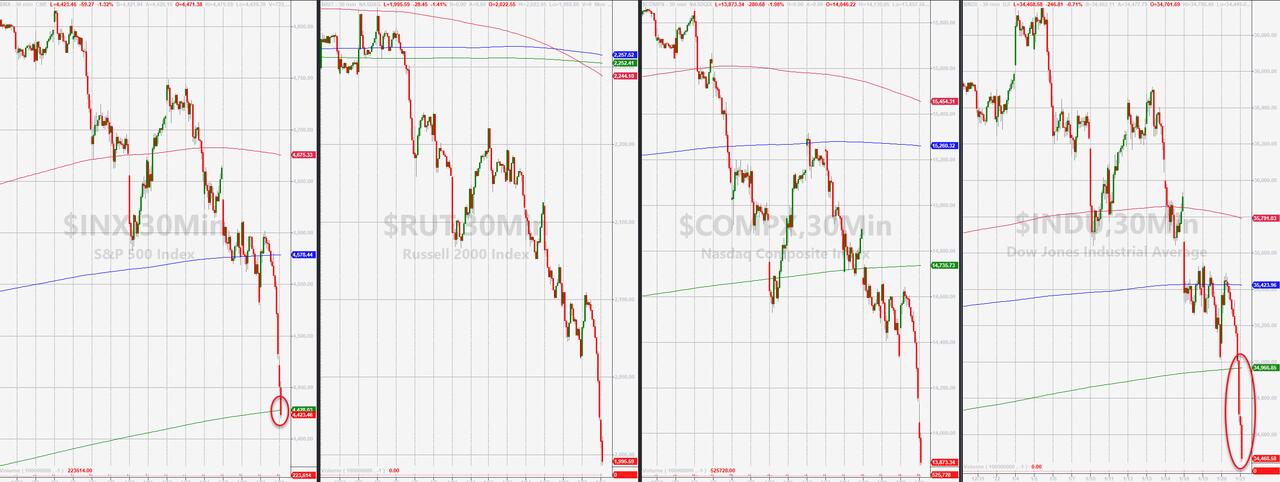
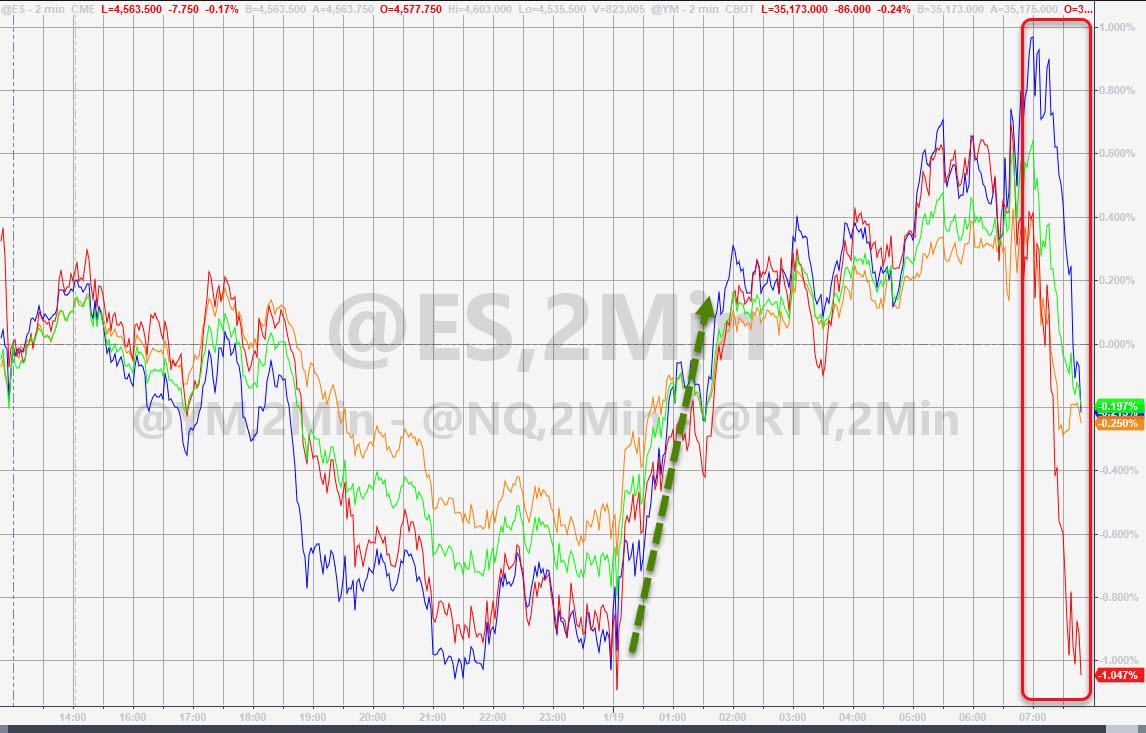
ZeroHedge relates, “US equity markets weakened from the moment cash trading closed yesterday, weakening overnight and puking at the open, erasing a large chunk of the unprecedented rampage higher in stocks yesterday afternoon (driven by put-sellers) before dip-buyers jumped in.

Nomura’s Charlie McElligott said that this morning so far is what happens after the “burn out” of part of that Dealer “short hedge” cover, in conjunction with the lost “bid” from the client short-covering hyperactivity.

And now to make things even spicier, the rally off the selloff lows yesterday on the US Equities Index has PERVERSELY brought us back to levels where Dealers are back near  “max short Gamma” in SPX and IWM (QQQ however a touch away from “max vs spot”).”


7:15 am

I will be leaving at 9:00 to attend a funeral of a member of my extended family.  I may return for comments this afternoon.

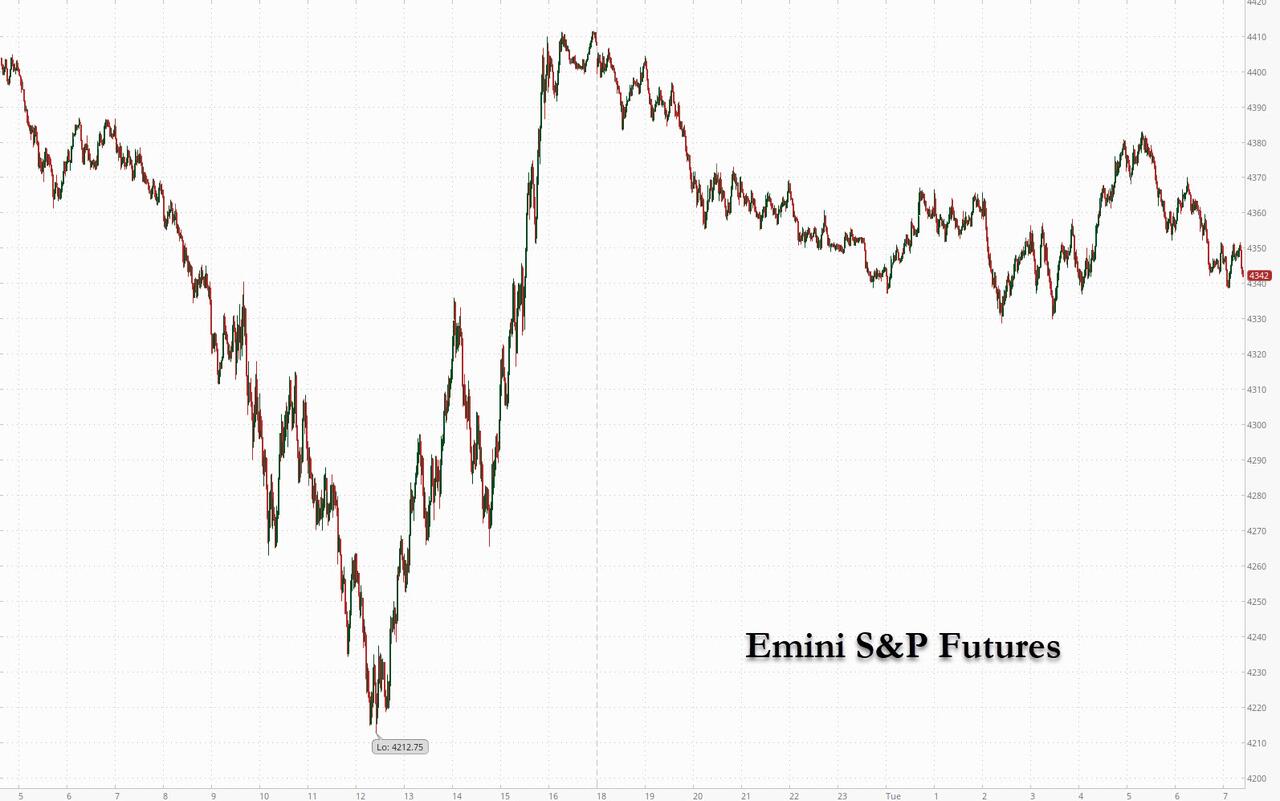
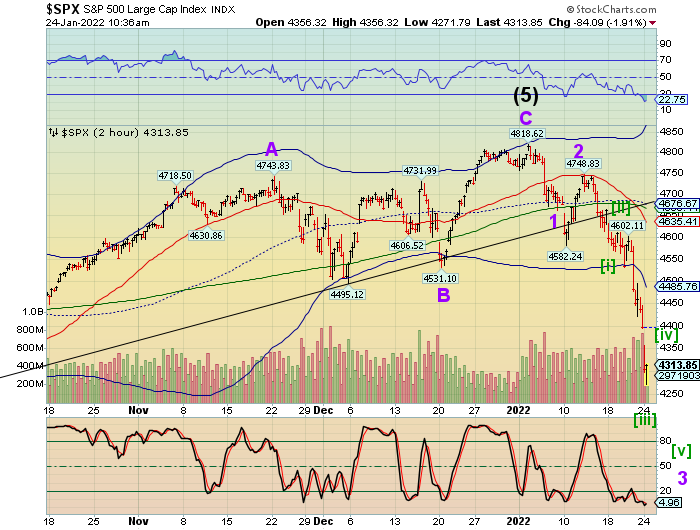
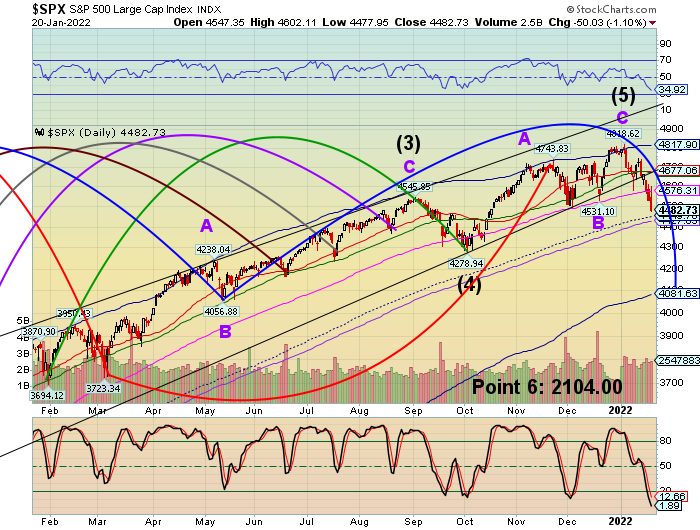
No, we’re not there yet.  SPX futures have declined to 4337.80 as I write and are due to decline beneath 4200.00 today.  Wave 3 needs completion today and it must be deeper than yesterday’s low, so be prepared for a lot of volatility.  The decline may hit bottom in the final hour of the day, so take appropriate action based on your flavor of trading.  Short profits may be taken beneath 4200.00.

Tomorrow’s options expiration offers its Max Pain zone at 4365.00 but becomes bearish at 4350.00.  Gamma goes short beneath 4300.00.  There may be some wild swings in the market with these parameters.

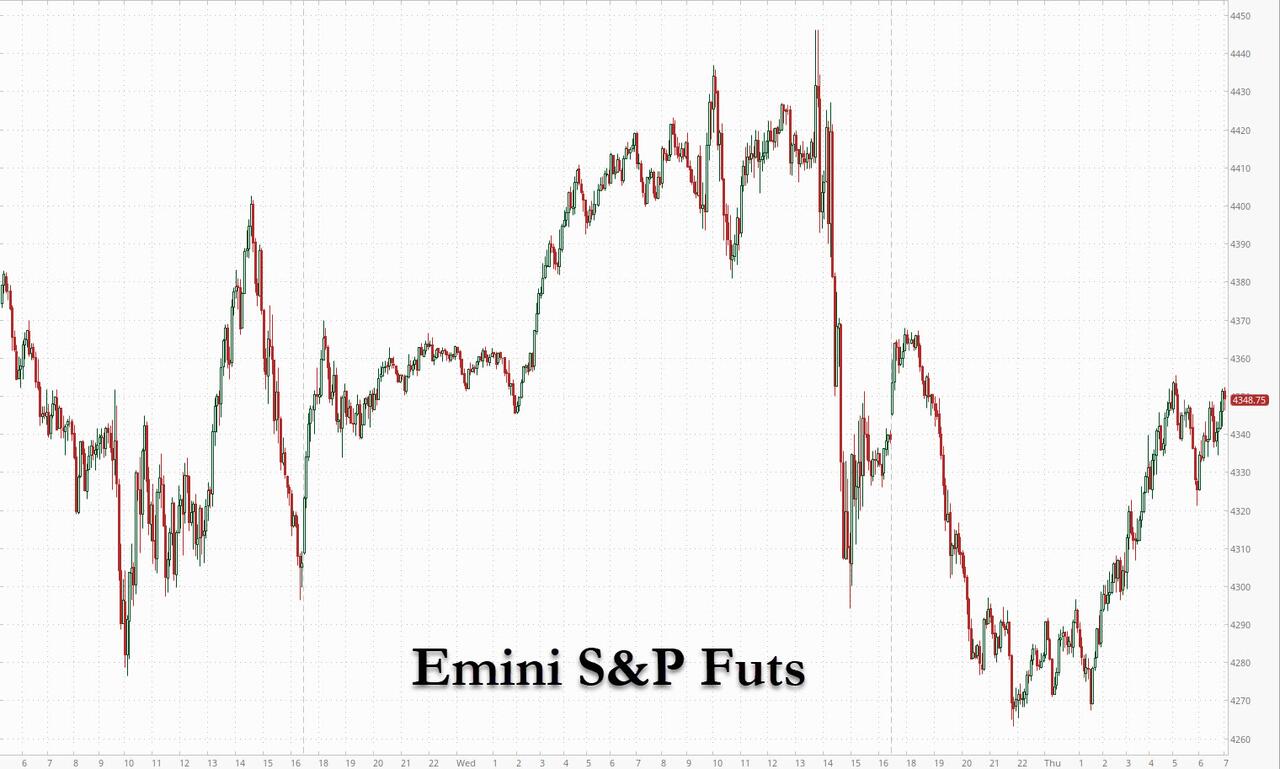
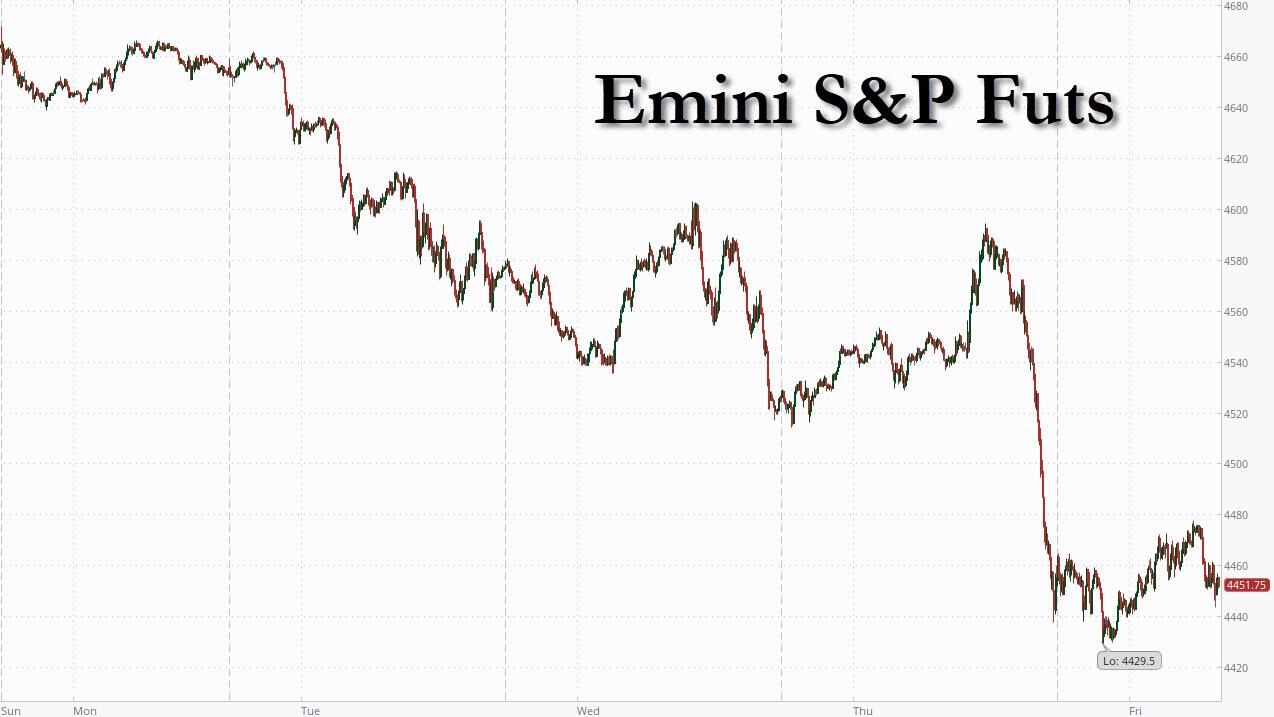
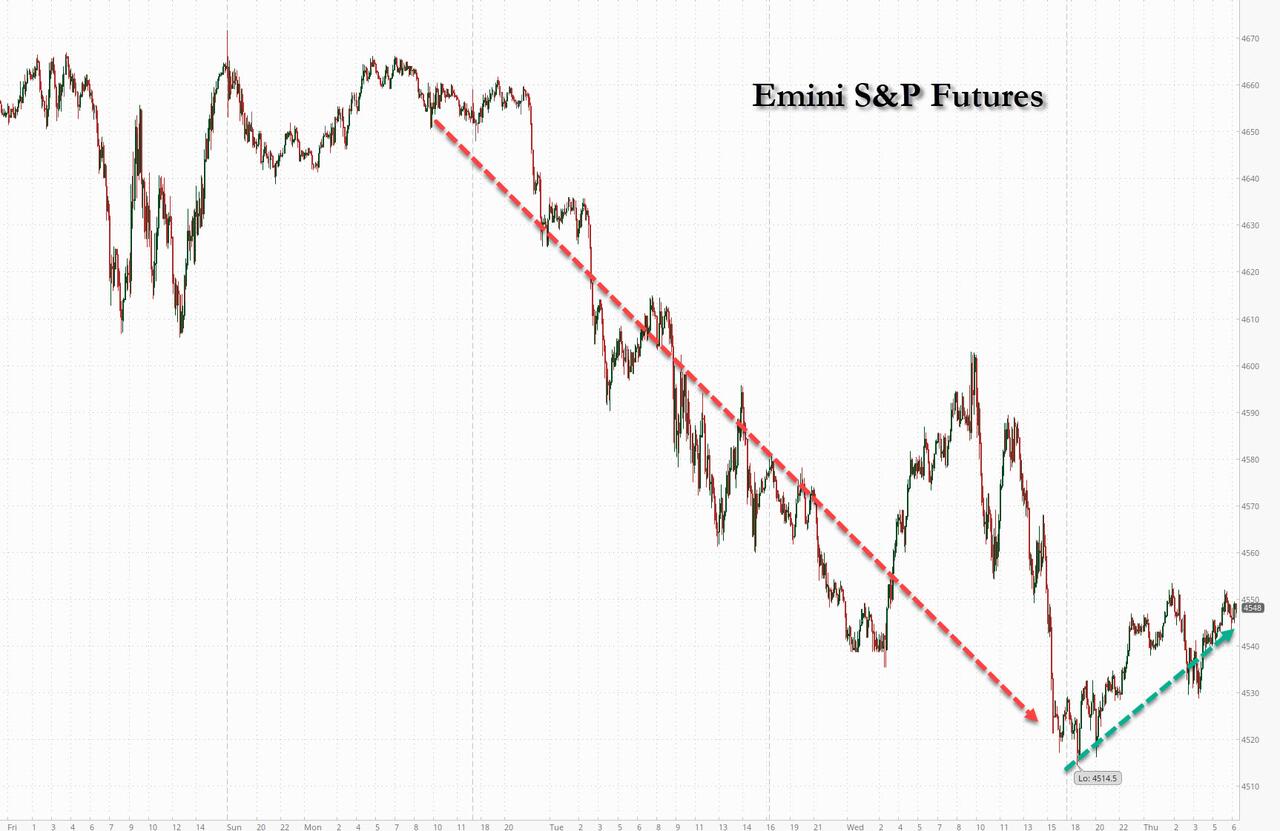
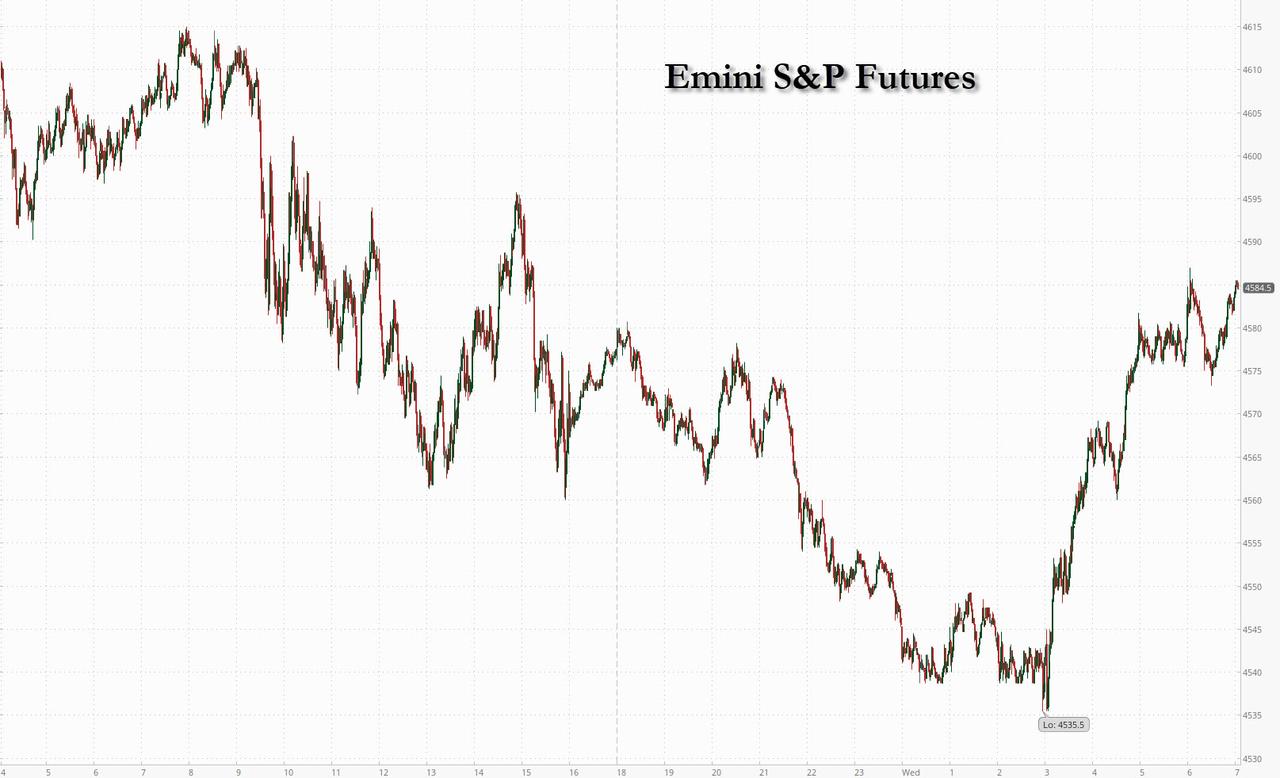
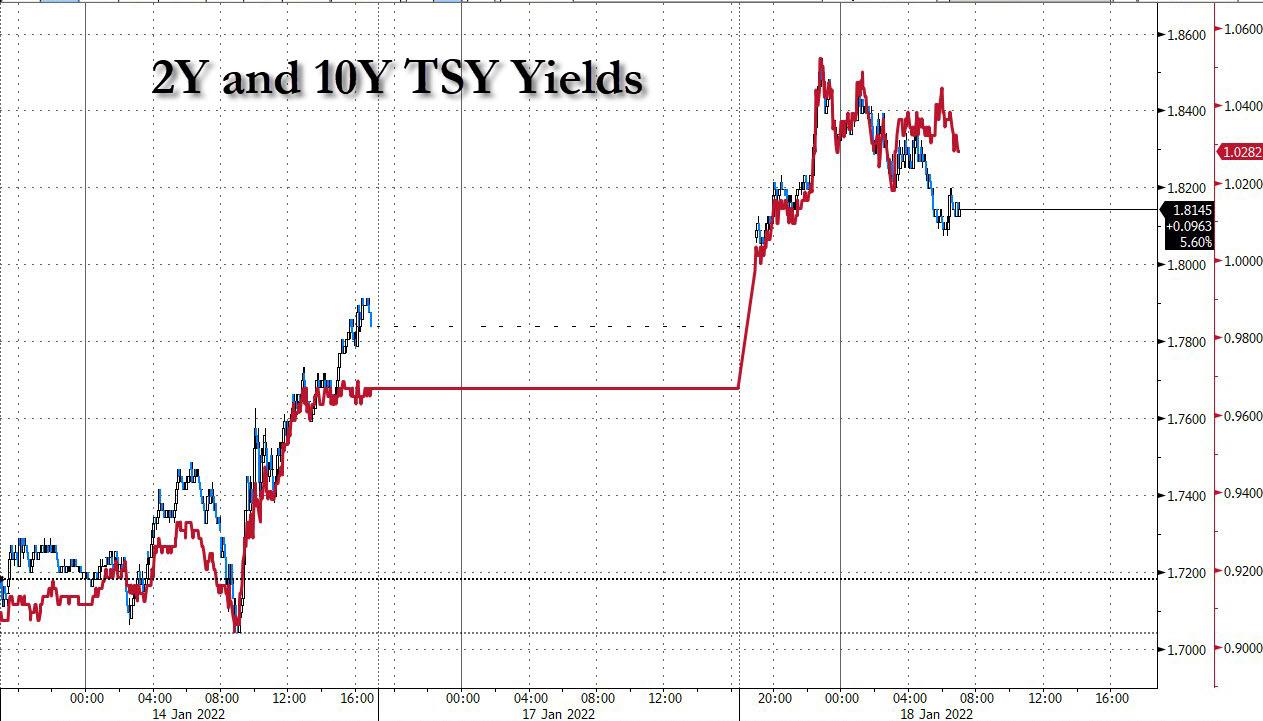
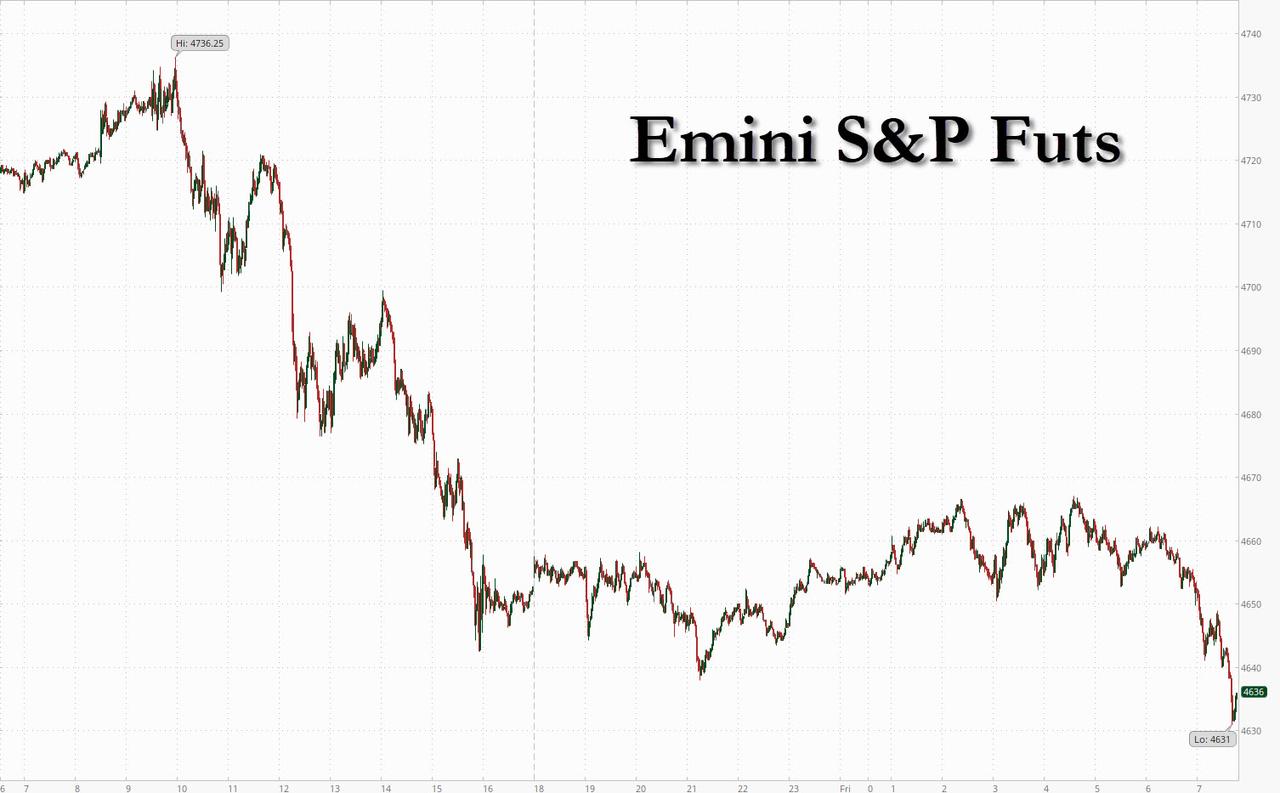
ZeroHedge reports, “Following one of the greatest intraday market reversals in history, US index futures resumed their decline led by the Nasdaq, signaling more pain for richly valued technology shares as investors braced for the highly anticipated Fed meeting and a flurry of earnings as geopolitical tensions between Russia and Ukraine persisted.  Companies including GE, J&J, Verizon and Microsoft report earnings on Tuesday, as the Fed starts a two-day meeting. As of 7:30am ET, emini S&P futures were down 60 points or 1.36% to 4,343, Nasdaq futures were down 1.88% or 272 points and Dow futures were down 236 points or 0.68%. The VIX was at 33, after swinging between 29 and 39 on Monday; 10Y Treasury yields were unchanged at 1.77% and the dollar gained.”


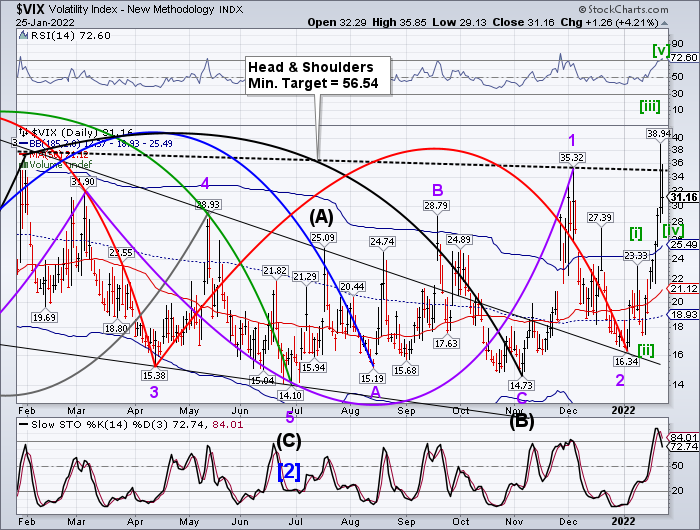
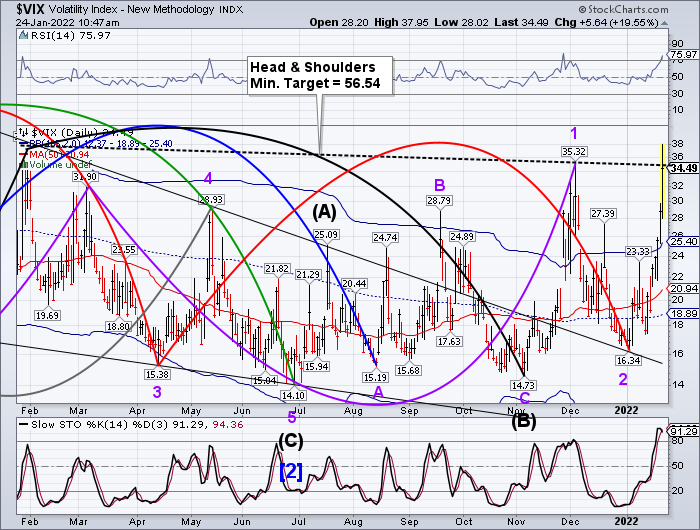
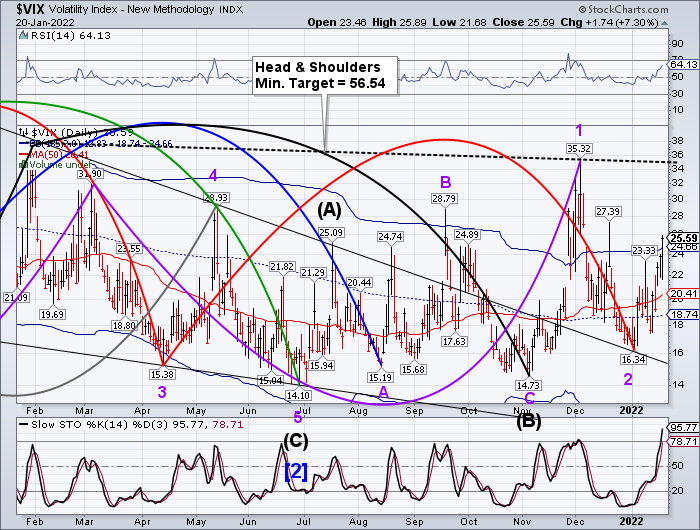
VIX futures have risen to 33.36, not exceeding the Head & Shoulders neckline.  Should we see the kind of moves in the SPX as described above, the VIX may hit it H&S target by the end of the day.

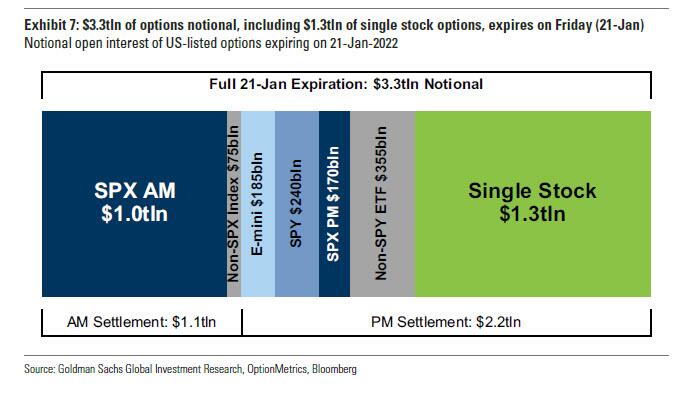
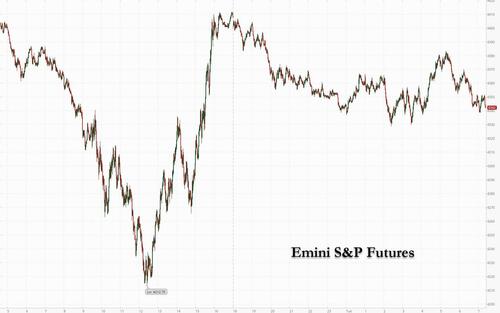
ZeroHedge remarks, “Heading into today’s rollercoaster session, we were – perhaps naively – confident that Friday’s massive $3.1 trillion opex would also mark the bottom for stocks (an option expiration which we correctly said would be surrounded by massive volatility, as explained last Tuesday).

And – in a roundabout way – it did, because after plunging more than 4%, stocks staged a furious rally the likes of which have been seen only on a handful of occasions, before closing green. Putting today’s historic reversal in context, this was only the sixth time since 1988 that the Nasdaq reversed a 4%+ intraday drop to close higher. The other days were 10/28/97, 10/26/00, 7/15/02, 10/10/08, and 11/13/08. As for the S&P, this was the biggest intraday comeback since November 2008 when the US was in the middle of the biggest financial crisis in recent history.


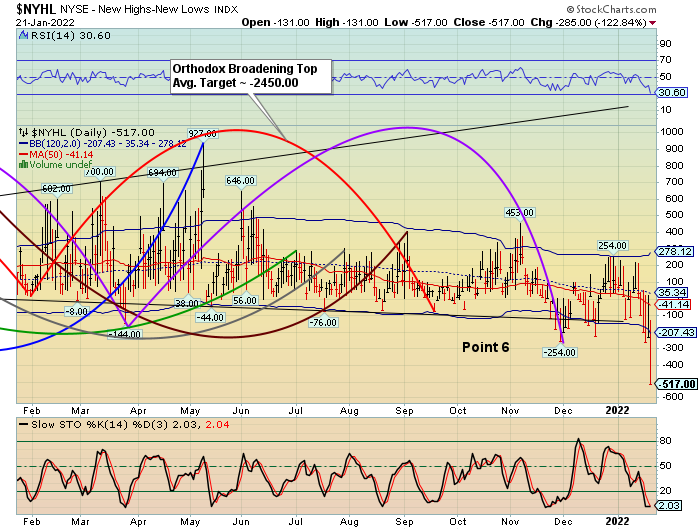
Despite the rip roaring rally, the NYSE Hi-Lo Index closed at its lowest point of the year.  Granted, the market was very oversold, but there appears to be little or no (net) new money buying stocks yesterday.   Buy-the-dippers were nowhere to be seen.  Shorts were furiously scrambling to cover.


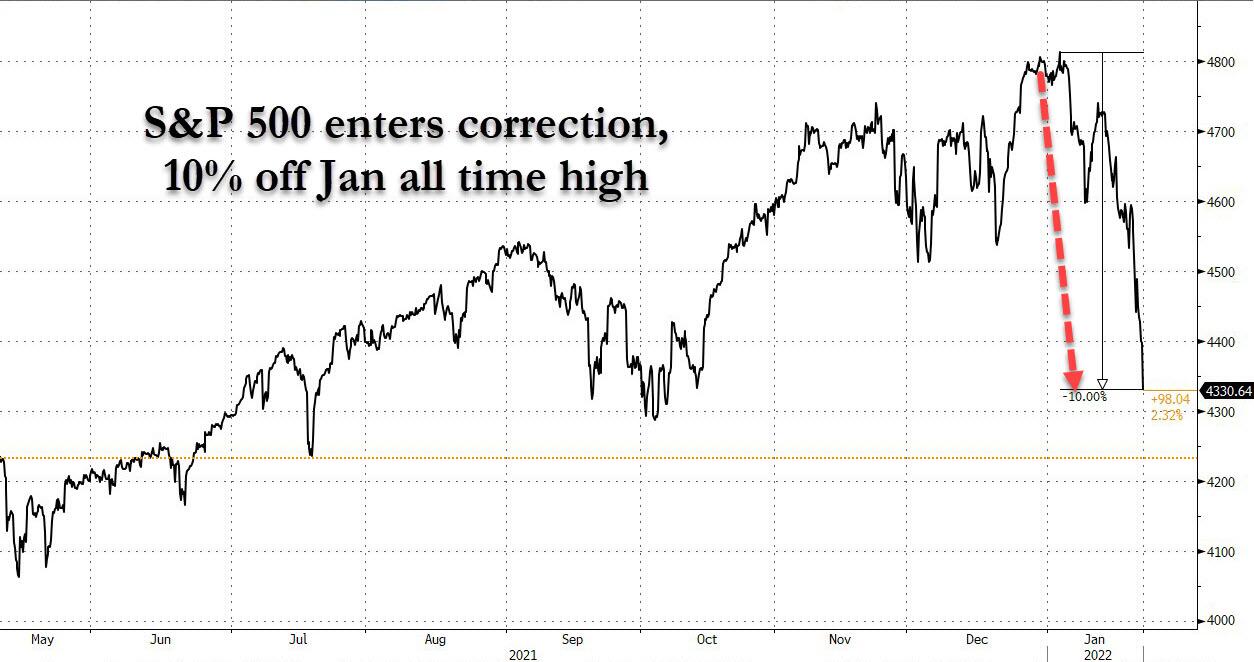
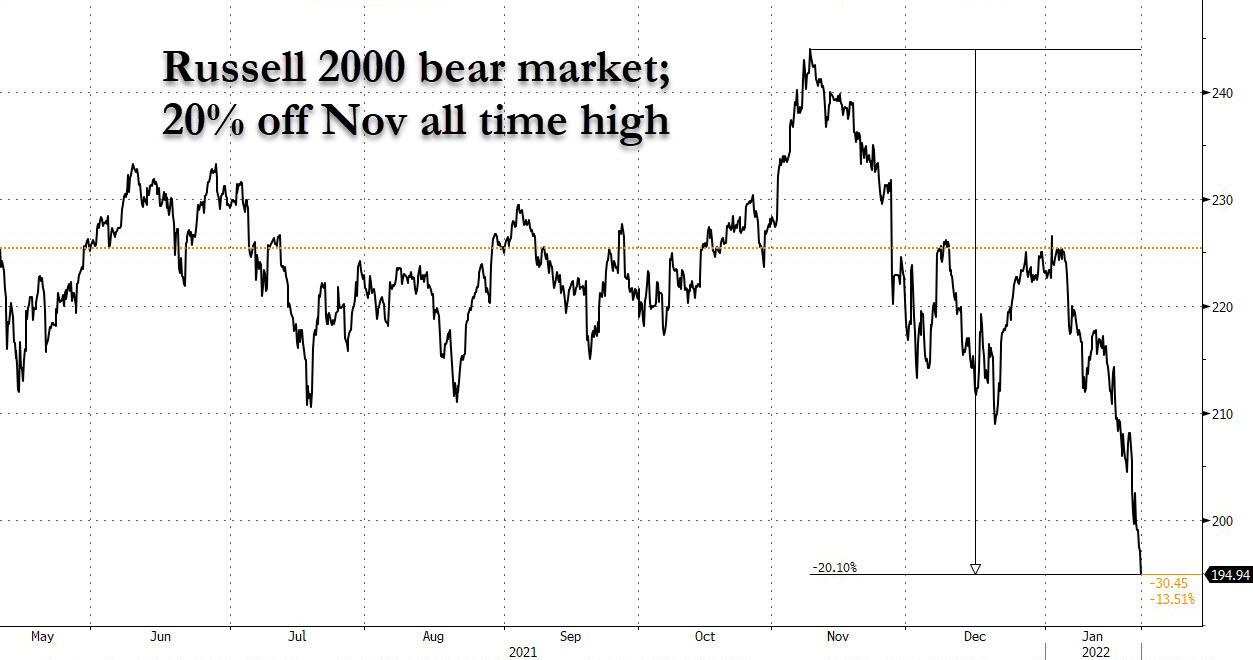
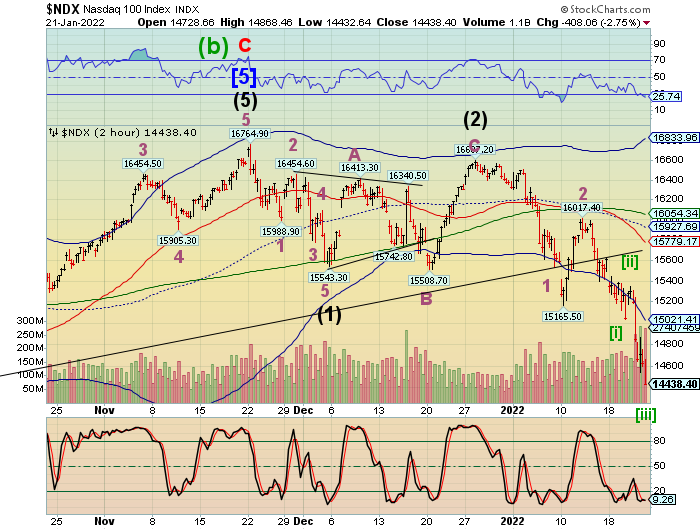
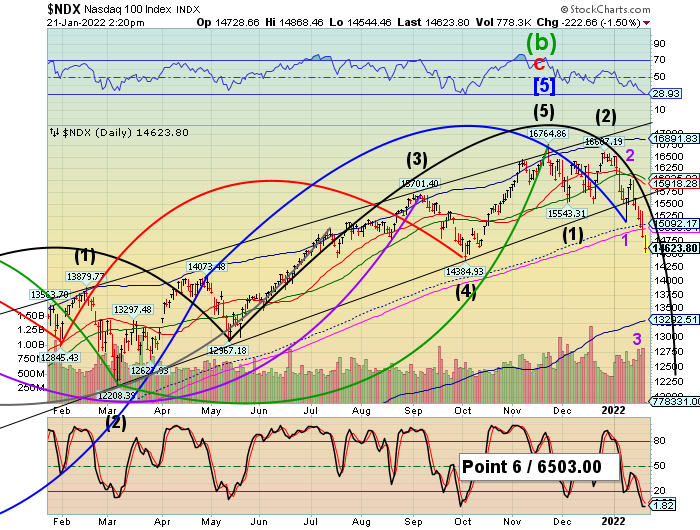
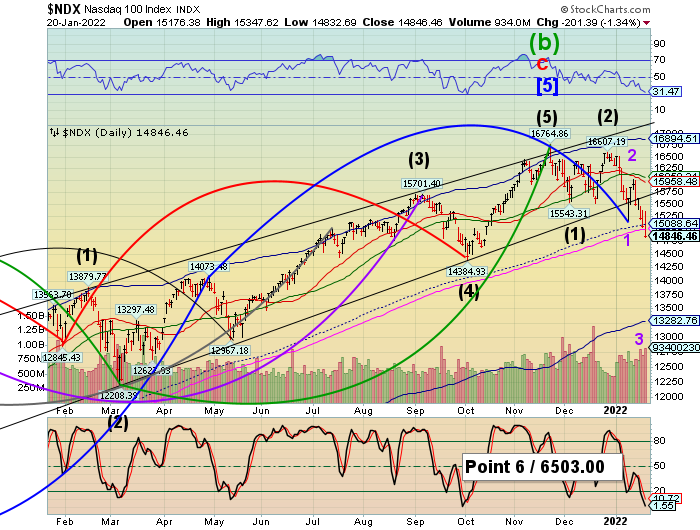
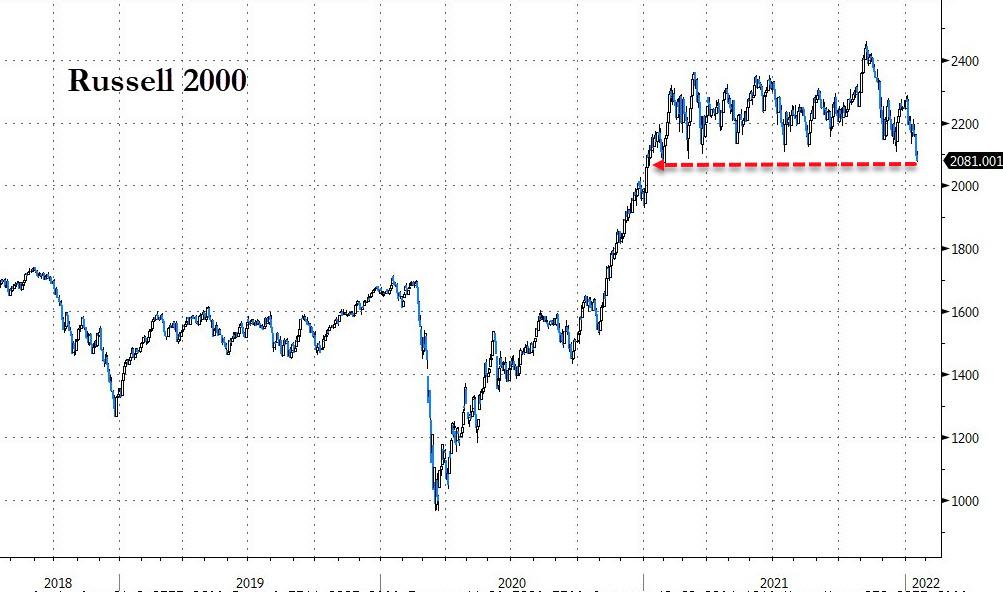
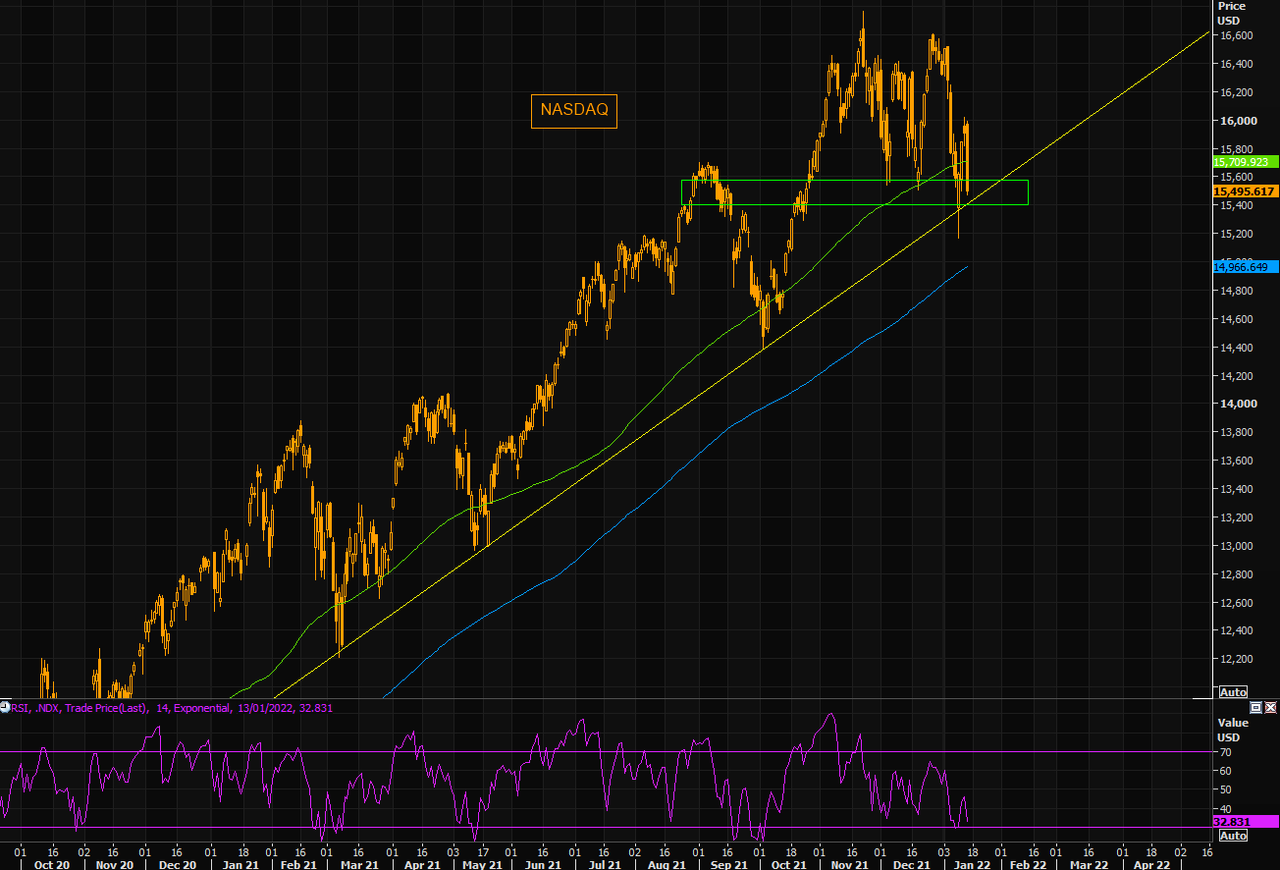
NDX futures declined to a low of 14166.00 thus far in the overnight session.  While SPX flirts with a correction below 4336.00 (10% loss), the NDX appears to be entertaining a bear market (20% loss) at 13400.00.  It is on a similar pattern in the Elliott Wave as the SPX and appears due to complete Wave 3 of (3) today.  NDX”s deeper losses may pull the SPX further down than anticipated due to liquidity issues.  A probe beneath yesterday’s low will activate the margin calls which have a tendency to broaden the decline.  In other words, there’s more pain coming.

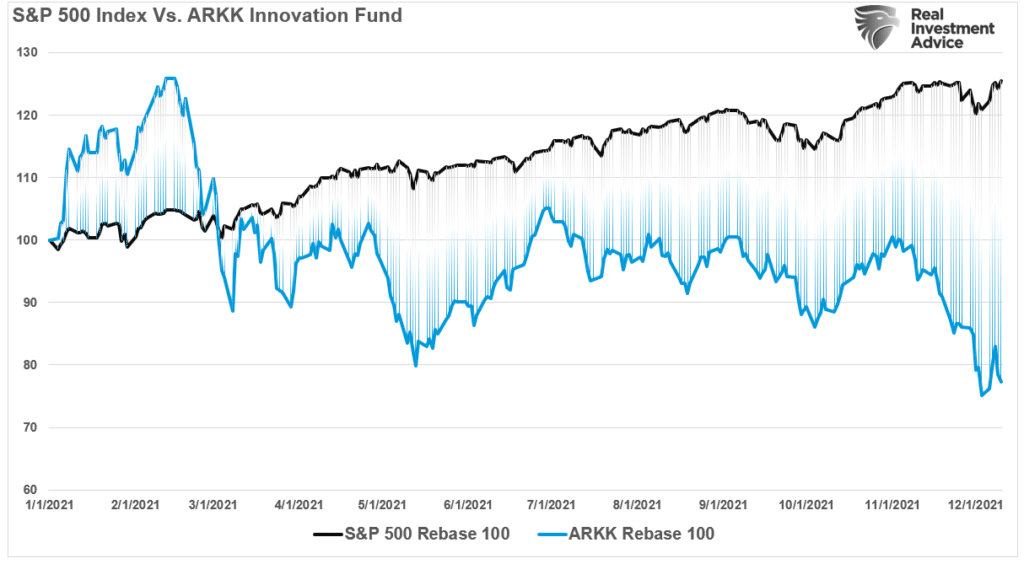
ZeroHedge remarks, “Monday likely marked a much needed gasp of air for Cathie Wood and those holding her ARK Innovation Fund (ARKK).

The fund, which is down 22% year to date according to Bloomberg, was able to finish the trading day on Monday up 2.82% at $73.54 per share after falling as low as $64.98, which marked a new 52 week low for the asset manager’s flagship fund.

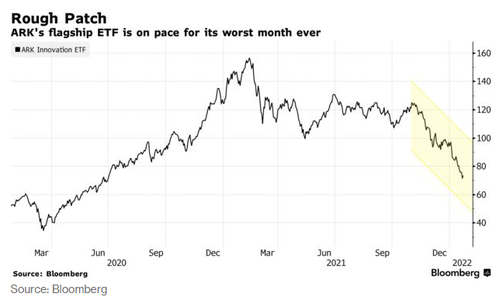
After being down as much as 9.1% during the intraday session, ARKK rebounded with the rest of the market starting at about noon eastern time and, by the close, had posted what felt like one of its few meaningfully positive green days in 2022 so far.”


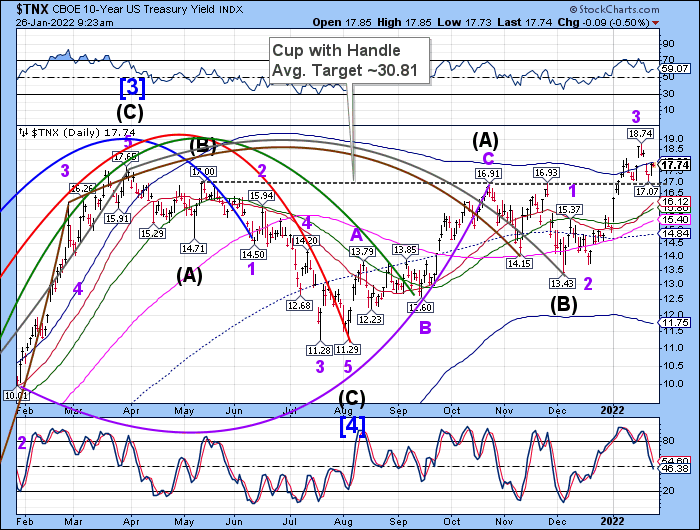
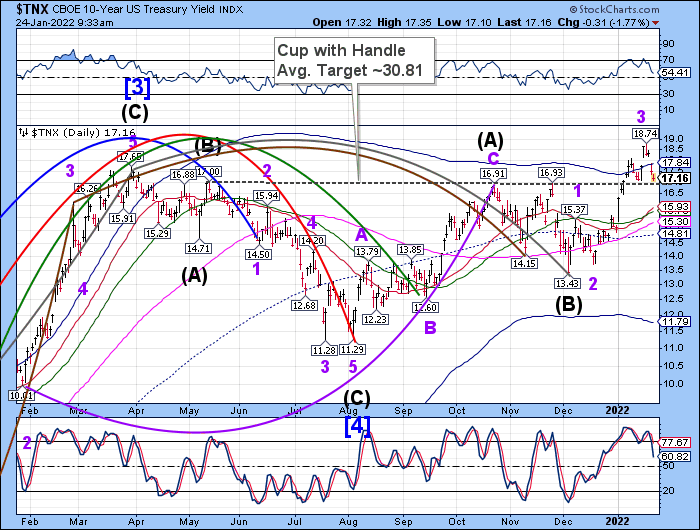
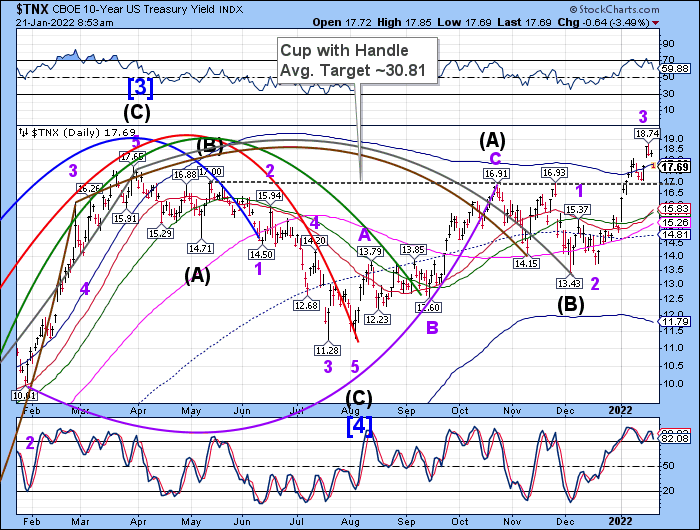
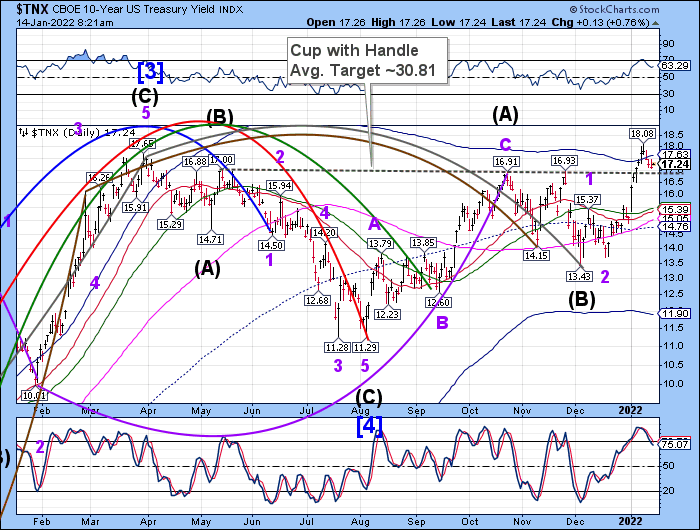
TNX futures are on the rise after bouncing from the Lip of the Cup with Handle formation, rising to an overnight high of 17.97.  It has broken through the Cycle Top at 17.64, creating a new buy signal.  This week shows a lack of strength, so it may revisit the Lip before the week is over.  However, strength returns next week, possibly elevating to the level where Wav (C) equals Wave (A) at 19.05.  The Cycles Model suggests the current Master Cycle may continue to the end of February.  I may have to recalibrate the Waves in (C) to reflect that reality.

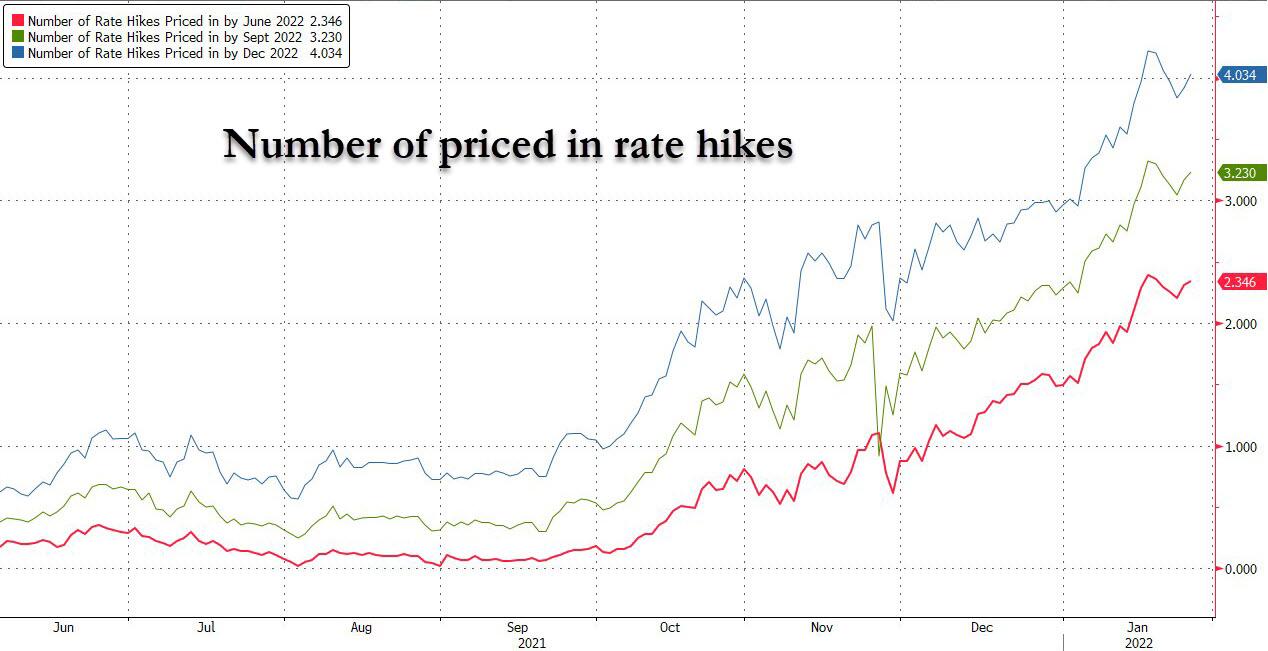
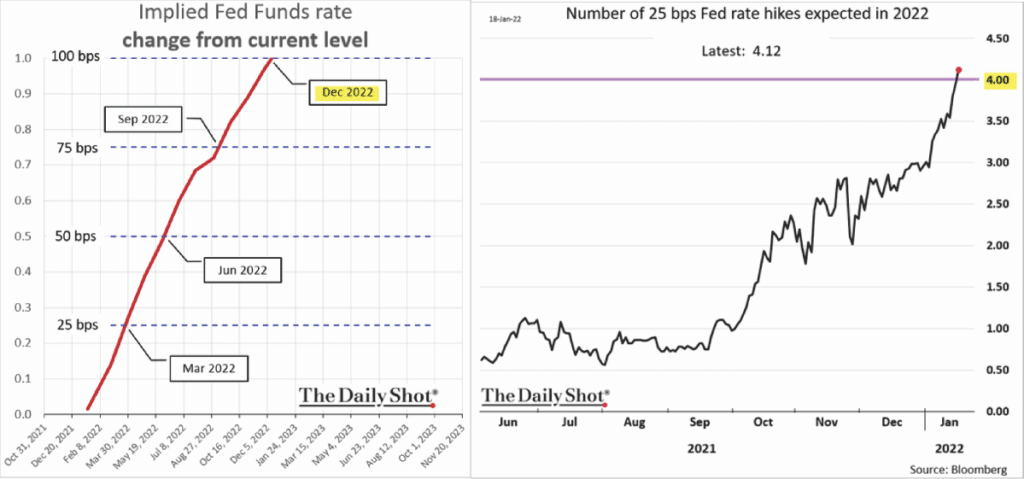
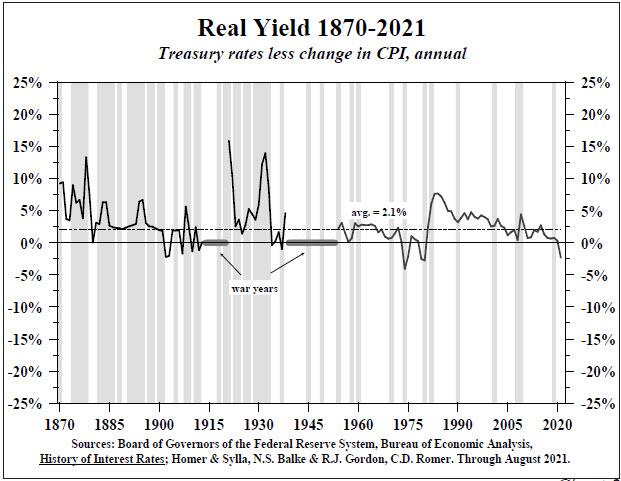
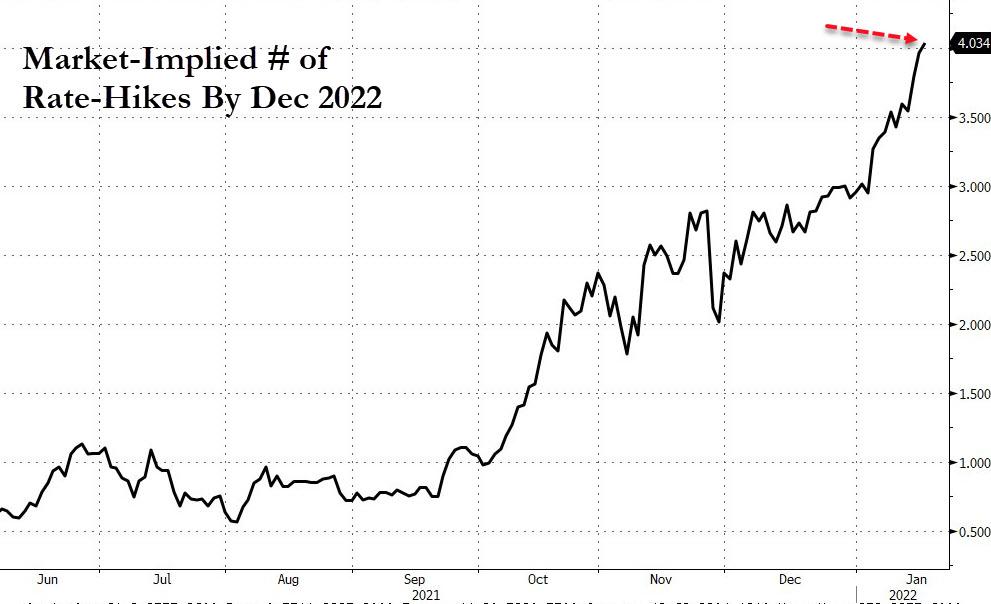
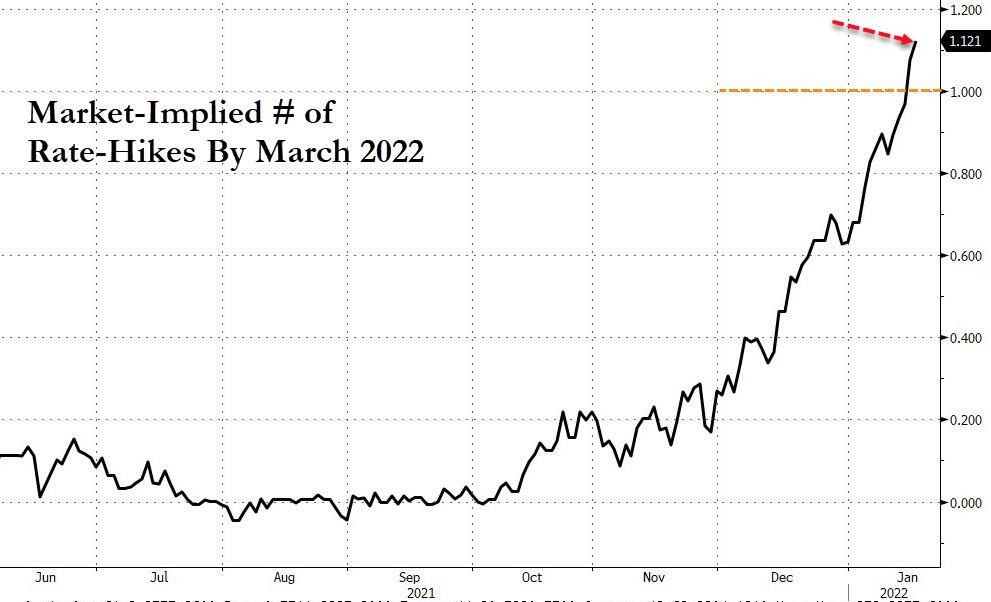
RealInvestmentAdvice observes, “Rate hikes will be far fewer than the markets currently expect.

Currently, with inflation pushing more than 7%, the highest level in decades, it is not surprising to see the market “pricing in” a more aggressive rate-hiking campaign by the Federal Reserve. As shown via the Daily Shot, the markets expect a certainty of 4-rate hikes in 2022.

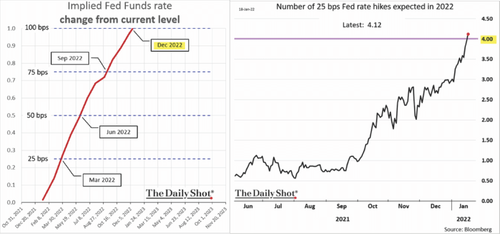
As Michael Lebowitz previously discussed, such is essential because the market tends to UNDER-estimate the Fed. To wit:

“The graph below shows how much the Fed Funds futures market consistently over or underestimates what the Fed does. The green areas and dotted lines quantify how much the market underestimates how much the Fed ultimately reduces rates. The red shaded areas and dotted lines are akin to today’s potential rising rate situation. They show estimates for rate cuts fall short of the Fed’s actual actions.”


USD futures rose above the 50-day Moving Average at 95.92 this morning after a brief challenge yesterday.  It is on a buy signal with a potential target near 98.30.  the current Master Cycle is due to end in early February, suggesting a possible hit in the next two weeks.


WTI futures appear to be consolidating after an early Master Cycle top on January 20 at 87.10.  It is on a new sell signal with a 7-week window to the next Master Cycle low.


Posted in Published | Comments Off on January 25, 2022

January 24, 2021

10:47 am

VIX has broken through the Head & Shoulders neckline, which often gives the minimum target for Wave 3.  If you read the prior alert, the SPX Wave 3 may not be complete until tomorrow afternoon.  If so, Friday’s VIX may exceed 100.00.


10:36 am

There are two possible scenarios being played out.  The first is that the SPX may have complete Wave 3 and goes into a holding pattern to Wednesday (Wave 4) before completing its decline (Wave 5) on Friday.  The second is much more bearish, whereby Wave 3 may not be complete until near the close tomorrow and a target beneath 4200.00 with a brief pause on Wednesday and further decline to Friday.  A bounce today may go to 4350.00-4360.00, but the gap is likely to remain open.

ZeroHedge reports, “It’s official: as of this morning, the S&P is in a correction, having tumbled 10% from its all time high recorded at the start of the month…

… with the Russell suffering an even more humiliating fate, as it entered a bear market at roughly the same time, tumbling 20% from its early November all time high.”


7:45 am

Good Morning!

SPX futures are lower, declining to 4363.50 as I write, before a potential bounce this morning in an extended Wave [iii] of 3.  Should it follow the Cyclical pattern that it has established, it may bounce to 4435.00-4450.00 before resuming its decline in short order.  The extension may negate the need to take short profits until Friday.  The target for Wave 3 may still be 4250.00 or lower.  The target for Wave 5 remains near 4000.00 until further notice.

An exam of the SPX options chain shows virtually no calls in today’s and Wednesday’s expiations as those positions have been sold and moved to the puts column, which carries massive short gamma.  Open interest in puts doesn’t slack off until it reaches 4275.00.   In Friday’s options expiration, there are 14000 puts contracts between 4050.00 and 4125.00.   The pileup of short gamma pretty much dictates to the dealers and hedge funds to be short down to 4,000.00.  I will monitor this as Friday (day 260 of the Master Cycle) approaches.

ZeroHedge reports, “US stock index futures erased early overnight gains and turned negative, dimming hopes for a rebound after one of the worst stretches for global markets last week since the pandemic began, as investors prepared for the upcoming Federal Reserve policy meeting and as the prospect of a war between Russia and Ukraine quashed demand for riskier assets such as bitcoin, and bolstered the dollar and oil. Nasdaq 100 futures declined 0.7% after rising as much as 1.1%. Those on the S&P 500 dropped 17 points or 0.4% while the Dow Jones dropped 0.3%. Elsewhere, the Stoxx Europe 600 fell 2% with travel and leisure as well as technology stocks leading declines. The dollar rose, bond yields dropped and oil was unchanged.”


The NYSE Hi-Lo  Index plummeted to -517.00 on Friday as longs threw in the towel.  Nearly 16% of all NYSE stocks were sold to their 52-week low.  This approaches capitulation, but not there yet.  The March 2020 low was -2375.00.  We may see that number being approached again this week, but most certainly see worse in February during the decline of the next Master Cycle.


VIX futures rose to 31.29 thus far this morning.  It may be summoning the energy to challenge the Head & Shoulders target near 35.00 today.  Once above it, the Wave 3 target matching the Head & Shoulders may be reached or exceeded.

This Wednesday’s options expiration shows short gamma trailing off at 23.00 and higher, while long gamma takes over above it.  There are over 8,000 call contracts between 45.00 and 50.00 which have a high likelihood of a payoff.


NDX futures have declined to 14121.00 this morning as it continues to descend in an extended Wave 3.  Options gamma has ben increasingly negative, forcing a self-fulfilling decline.  Today’s options expiration shows negative gamma building down to 13600.00.   There may be a bounce to 14500.00, but the decline may resume quickly.  The NDX Hi-Lo closed at -1293.00 on Friday, a nearly 40% slice of NDX stocks hitting their 52-week low.  However, in March 2020 the Hi-Lo made a low of  -2087.00.


TNX appears to be declining to the Lip of its Cup with Handle formation at 17.00.  There is a lot of support there, so the likelihood of declining through it is small.  The Cycles Model gives little directionality until next week when trending strength comes back.  We may see a flat performance in TNX this week.


USD futures have risen above the 50-day Moving Average at 96.88.  It may reach a Master Cycle high during the second week of February.


Posted in Published | 3 Comments

January 21. 2022

3:30 pm

Watch the 4300.00 level.  Should the SPX close at or beneath it, it would be time to take short-term profits.  Monday’s open may be messy.


2:58 pm

SPX has crossed beneath the 200-day/43-week Moving Average at 4422.00 which defines the long-term trend.  In addition, it has crossed beneath the 4450.00 options (over 21,857 put contracts) that may cause an acceleration to the downside.

3:11 pm

SPX crossing beneath 4400.00 strike with 25,445 contracts… another $110+ million of market cap being shorted.  Large strikes at 4375.00 and 4350.00.  Will the pain stop?  Another $86 at 4300.00.


2:20 pm

NDX may be making its most spectacular decline yet.  The potential target for this hourly Cycle appears to be 13550.00.   Another 1100 points lower in the next 2 hours.  It’s hard to tell yet whether the decline lasts over the weekend.  We may see a volatile open on Monday in order to make this target.  It may hit bear market status should it hit 13400.00.

ZeroHedge advises, “For the past year BofA Chief Investment Strategist, Michael Hartnett, has been one of Wall Street’s gloomiest strategists (perhaps just below Albert Edwards and Michael Wilson on the permabear scale) warning that global markets are on the precipice of disaster, and predicting that 2022 will unleash a “rate shock” that will hammer risk assets, and as 2022 gradually rolls out doling out major pain for the bulls, his predictions are coming true. In fact, just last Friday we published his outlook for a “Stagflationary Hellscape For Markets In 2022″, and over the past week traders have watched in shock as this view imposes itself on markets.”


10:39 am

SPX bounced at 4420.00.  Will it escape the short gamma claws?  Hardly.  It may resume with a top-of-the-napkin target near 4250.00. at the end of the day.

ZeroHedge comments, “As this morning’s chaotic open uncoils into another leg lower, Nasdaq is now suffering its worst start to a year in at least 30 years (it is very slightly worse than 2008), and the S&P’s longest weekly losing streak since Sept 2020.

Crucially, the S&P 500 just broke below its 200DMA…

Which now means all the US majors are below their 200DMAs…


10:0 am

SPX declined beneath a massive tranche of  21,870 put contracts which may entail the sale or short sale of over 97 million market cap.  This is what may accelerate the decline.  Should that take place, margin calls may also be de rigeur.

What Do Markets Look Like When They Panic?

Read ZeroHedge.

They look like today.

ZeroHedge observes, “As we noted last night, today we see a whopping $3.3 trillion in total notional option expirations, of which $1.3 trillion in single stock options expirations, the 2nd largest ever, and ~2.7% of the Russell 3000 market cap. According to Goldman, single stock options trading activity remains robust, with an average daily notional of $506bn in January, consistent with the elevated levels of 2021 (average daily notional of $468bn).

Why does this matter? Well, as we have discussed extensively in the past, at major expirations, options traders track situations where a large amount of open interest is set to expire. In situations where there is a significant amount of expiring open interest in at-the-money strikes (strike prices at or very near the current stock price), delta-hedging activity can impact the underlying stock’s trading that day. If market makers or other options traders who delta-hedge their positions are net long ATM options, expiration-related flow could have the effect of dampening stock price movements, causing the stock price to settle near the strike with large open interest. This situation is often referred to as a “pin” and can be an ideal situation for a large investor trying to enter/exit a stock position. Alternatively, if delta-hedgers are net short ATM options (have a “negative gamma” position), their hedging activity could exacerbate stock price moves.”


7:50 am

Good Morning!

NDX futures continued their decline last night, reaching a low of 14617.00 before a bounce.  NDX is caught in a short gamma scenario that has yet to play out.  This may keep the decline underway through options expiration and possibly at the open on Monday, where a searing bounce is brewing.  However, that is not the end of the Master Cycle, which may resume through Thursday/Friday (another options expiration?).  There are large nests of expiring puts at 50 point intervals down to 14500.00 today.  They are large enough to have been bought by hedge funds against a potential crash.  Unfortunately, this activity may make the decline more severe.  Most analysts are not used to this and expect the bounce sooner than later.

This may also raise the spectre of margin calls on the NDX, which closed down 11.4% from the high.  Margin usually kicks in in a decline that exceeds 10%.   The NDX Hi-Lo Index closed yesterday at -653.00.

ZeroHedge advises, “Facing a massive $3.3tln of options notional, including $1.3tln of single stock options, expiring on Friday, Nomura’s Charlie McElligott warned yesterday that “it’s a doozy of epic “short Gamma, short Delta”…

But, SpotGamma points out that the shift lower in markets over the past several days has increased the concentration of put-heavy gamma tied to Fridays OPEX.

We now see >=30% of S&P, and >=20% of QQQ rolling off on 1/21. You can see below that as long as the S&P is <=4600 the expiration brings a reduction in negative gamma (via the closure of puts).


SPX futures probed beneath the mid-Cycle support at 4449.00 in the overnight session where another short gamma bomb is set to go off.  The 200-day Moving Average is at 4427.63.  In today’s options expiration gamma turned seriously short at 4500.00 and there are large holdings of puts at 50-point intervals down to 4350.00.  The NYSE Hi-Lo Index closed at -232.00 yesterday with sellers coming in late in the day.

The hourly Cycles suggest the decline may continue through today and may bleed over to Monday’s open as the dealers and hedge funds “true up” their positions to reflect the drop-off  of  today’s expiring options.

ZeroHedge reports, “Futures, yields, oil, dollar, cryptos – everything is lower on this $3.1 trillion option expiration day

… as US traders relocate from their bedroom to their basement on the last day of the week, discovering a sea of red in most assets and a “total meltdown” in others. Emini S&P futures are down 0.5% or 22 points to 4,452 which by the way is well off the session lows which saw the S&P plunge as low as 4,429. Nasdaq futures are down 0.8% or 122 and Dow futures are lower by 95 points or 0.25%, while European stocks touched the lowest level in a month weighed by miners, travel and leisure and automakers. 10Y TSY yields are at 1.778%, rising from 1.76% at the session lows, but down from Thuesday’s close around 1.80%.”


VIX futures made an overnight high of 27.18 after closing above the Cycle Top yesterday.  Today’s question is, will it break out above the Head & Shoulders neckline?  In next Wednesday’s options expiration, options turn positive at 23.00 and gamma turns seriously long at 24.00.  While there may be a pullback on Monday, the Master Cycle ends in strength on Thursday/Friday next week.


TNX is in a serious pullback due to the migration of liquidity from stocks to bonds, but it may not last beyond today as trending strength returns over the weekend.  The Cycles Model suggests a continued uptrend through late February, possibly awaiting the FOMC meeting/announcement on the 16th.

MikeShedlock observes, “In his 4th Quarter Review and Outlook, Lacy provides some interesting charts on negative real rates and recessions.

Please consider the Hoisington Management Quarterly Review and Outlook Fourth Quarter 2021Emphasis Mine

Real Treasury Bond Yields

Real Treasury bond yields fell into deeply negative territory in 2021. In elementary economic models, this event, taken in isolation, would qualify as a plus for economic growth in 2022 and would be consistent with the strength indicated by fourth quarter 2021 tracking models.

Lacy a different view however. His analysis shows that negative real yields are associated with recessions.

Debt overhang and demographics make the matter worse.”


Posted in Published | Comments Off on January 21. 2022

January 20, 2022

11:00 am

VIX may be making a shallower retracement than normal.  We may be seeing a reversal higher in the next hour or so.  The next VIX options expiration is Wednesday, January 26.  VIX guy may be right this time.

ZeroHedge comments, “VIX guy just called us…

Regular readers of TME are familiar with the “VIX guy”. He is our contra indicator when it comes to VIX as well as short term market directions. Let us remind you of what we wrote about his latest VIX call on Dec 31: “…his latest logic is basically the inverse of what he said in late November. He has also managed picking up the January effect logic and argues for this market to remain trending higher with diminishing volatility. We did not plan to get excited on the last day of the year, but given his perfect track record, executing the first part of the planned long volatility trade suddenly seems like a good idea.” We suggested to look at hedges and pointed out: “…exploring put spreads as a hedge (skew is high).”

This was only twenty days ago and since then a lot of things have changed. The VIX guy called us today outlining his bearish thesis and is basically telling us VIX must go higher: “have you seen the pricing of the rate hikes, tech is going much lower bro, Fed is behind the curve, ARKK is crashing etc”. Given his perfect track record (inversely speaking), we find closing out those put spreads and any long vol trades very attractive (would even consider shorting some vols to fit direction trades).


10:50 am

SPX has hit its round number resistance at 4600.00 and an important hourly pivot.  We may see a reversal here that takes SPX down for the next two days.  Good Luck and good trading.


8:45 am

Good Morning!

I apologize for the delay.  The website server went down this morning and has just been restored.

NDX futures declined to 15010.00 this morning, just above the 200-day Moving Average at 14995.00.  The bounce has taken it over 15200.00.  Natural resistance lies at 15382.00 and the 38.2% Fibonacci retracement is at 15444.00.  The Cycles Model suggests a sort retracement this morning with a resumption of the decline by this afternoon.  The NASDAQ Hi-Lo Index closed at -731.00.  Those going short late in the day may be forced to cover.


SPX futures declined to 4523.50 before bouncing.  Straight line support lies at 4531.10 and may form the neckline of a Head & Shoulders formation.  The minimum H&S target appears to be 4242.00.  This may be in line with the Cycle Bottom at 4077.97 which often provides support for the bounce of a Wave (1).  The Cycles Model suggests that target range may be met by the close on Friday.  The Master Cycle may not be complete until later next week.

The NYSE Hi-Lo Index closed at -262.00.  That suggests short covering may be the impetus for the bounce.  Natural resistance for the bounce lies at the 100-day Moving Average at 4577.00 and round number resistance at 4600.00.  The 38.2% Fib retracement is at 4631.00.

ZeroHedge reports, “Whereas the stock plunge on Tuesday could be blamed on surging rates, the repeat tumble on Wednesday took place as Treasury yields dropped sharply, so with markets at a loss how to read rate signals, so far this morning S&P e-mini futures have rebounded by 23 points ot 0.5% from yesterday’s low just above 4,500 – a key support level according to JPMorgan – as volatility eased and global bond yields appear to have stabilize for now, and hours after China’s latest easing measure when Beijing lowered mortgage lending benchmark rates on Thursday as monetary authorities step up efforts to prop up the slowing economy. 10Y Treasuries rose from session lows, last trading at 1.84%, European stocks fluctuated as the dollar index was little changed and crude oil slipped after a three-day rally as gold held around a two-month high.”


VIX futures declined to a low of 22.83 in the overnight session after testing the Cycle Top resistance at 24.53 yesterday.  The VIX may retest its 50-day Moving Average today, but should be higher by the end of the day.  Yesterday’s monthly options expiration took much of the downward pressure from the VIX as short gamma resided beneath 22.00 in spades.  Long gamma takes over at 25.00 and above, with a self-reinforcing drive higher that may  surprise the experts.


TNX sits at the bottom of its two day trading range, unlikely to fill  the gap beneath it.  The Cycles Model suggests that trending strength returns by tomorrow and may heighten over the weekend.

ZeroHedge reports, “After a furious rout in bonds, rates traders were carefully looking at today’s 20Y auction to see if the recent blowout in yields meant less demand for US paper at auction, or inversely, if the drop in prices had sparked a hunt for bargains. And if the 20 year reopening auction which just closed with the sale of $20BN in 19-year 10-month cusip TC2 is any indication, the answer is resoundingly the latter.

While yields had dropped sharply on the day (granted after yesterday’s surge), some were worried that the lack of a concession would lead to a tail in today’s sale. However, not only did that not happen, but the auction – which priced at a high yield of 2.210% – stopped through the When Issued 2.225% by 1.5bps, the second biggest stop through since June 2021. That said, with a yield some 27bps above the December auction, today’s auction cleared at the highest yield since June.

The bid to cover was solid, and while it was below last month’s stellar 2.59, at 2.48 it was well above the six-auction average of 2.39%.”


Posted in Published | Comments Off on January 20, 2022

January 19, 2022

4:05 pm

Is this time different?

Wishfully thinking, ZeroHedge comments, “It’s crunch time for the buy-the-dip crowd.

The S&P 500 is threatening to close below its 100-day average — having already slipped below that measure intraday Tuesday for the first time in more than three months.

Drops through moving averages can be seen as concerning because they may signal a change in momentum — but in this case, buying the next day has been an almost sure-fire winner for the past 19 months.

Since June 2020, the benchmark has closed below its 100-day average eight times, data compiled by Bloomberg show. Three of those instances, it never traded lower after that, even intraday, and three times there was never a lower close after. One of the occurrences there was one lower close — by 0.03% — before it headed higher, and the worst time was one close 0.16% lower before it recovered, the data show.”


1:06 pm

This is the hour the Cycle was meant to turn.  It appears that SPX could not get above the options “logjam” at 4600.00.  That leave SPX in a short gamma position…about to resume its decline.  If my hourly Cycle calculations are correct, this Wave 3 decline may last through the open on Monday.  The final low for this Master Cycle may be late on Wednesday, day 259, or Thursday next week.  It’s time for the longs to panic.

ZeroHedge comments, “US equity markets just cannot catch a bid and are puking below critical support levels this morning:

The Russell 2000 is now down 4% on YoY basis (its first YoY drop since July 2020)…

And these shifts are starting to shake the unwavering bullish foundation that so many have stuck to in recent years as TINA is dead (bonds are now trading at their ‘cheapest’ to stocks in three years)…


11:55 am

VIX has finally broken above its previous high and emerged from a massive short gamma zone.  Gamma turns positive above 25.00.  This may create a self-reinforcing panic rally in VIX.  However, it is due for a pullback that may last through the end of the day.  It may revisit the Max Pain zone at 22.00 by the end of the day (monthly options expiration).


11:05 am

SPX aborted its rally in just an hour.  The hourly Cycle may have also been cut short.  It is possible that short gamma for today’s options expiration was simply too much to overcome.  SPX has also crossed the 100-day Moving Average at 4577.00.  My instinct and observations suggest the next 7 days may be a panic (literally).  Hang on!  This could be very exciting.

ZeroHedge observes, “US equity markets have given up all their overnight ramp gains with Small Caps back at the overnight lows (down 1% on the day). The Dow, S&P, and Nasdaq are back to unchanged…

This has pushed all the majors back to or below key technical support levels…

The S&P and The Dow have both broken back below their 100DMA, Nasdaq is pushing further below its 200DMA”


7:30 am

Good Morning!

NDX futures dove deeply to the mid-Cycle support at 15077.00, then bounced.  Should it retrace, the 50% level is at 15540.00.  It may go as high as the trendline in a retest near 15600.00.  The hourly Cycles allow about 4 hours to complete the retrace/retest.  In today’s options expiration, gamma is sort beneath 15400.00 and options turn positive at 15500.00.  For Friday’s (monthly) options expiration calls prevail above 15600.00.  The calls are thinning.  For QQQ (370.55) today’s Max Pain level is 372.00 while gamma turns positive at 378.00.  Friday’s monthly options expiration carries a Max Pain at 373.00.  There are a lot of long options at 375.00 and higher, as investors have bought out-of-the-money calls as long as a year ago.

The NDX Hi-Lo Index closed at -728.00 yesterday.

ZeroHedge remarks, “NASDAQ – welcome to must hold levels

NASDAQ futs are trading close to the huge 15k level. We are well below the 100 day moving average, sentiment is horrible, but 15k is basically the longer term make or break level. Note the 200 day around those levels.


SPX futures made an overnight low at 4544.10, having declined through the 100-day Moving Average at 4576.00.   Futures are positive as I write and expect to bounce for the morning session.  A most likely retracement would be to the top of Wave (iv) at 4655.13, not far from the 50% retracement level at 4659.16.

Today’s expiring options favor puts beneath 4650.00 while calls dominate at 4660.00 and above.  Max Pain appears be hover near 4655.00.  In Friday’s monthly options expiration, there is a massive logjam of both puts and calls at 4600.00.

ZeroHedge reports, “After what earlier looked like another assured overnight rout, especially after 10Y yields hit 1.90% and Brent rose as high as $89/bbl, US equity futures reversed earlier losses to trade higher as earnings optimism outweighed concerns over soaring bond yields and a 50bps March rate hike.  As of 7:00am ET, emini S&P futures were up 14 points ot 0.3% to 4,585, Nasdaq futures were up 65 points or 0.44% and Dow futures were also in the green by 89 points or 0.25%. The dollar slumped after several days of sharp gains, the 10Y yield traded at 1.8826%, down from the session’s highest levels, and Brent was at $88.23.


The NYSE Hi-Lo Index closed at -202.00 yesterday, the lowest reading thus far in 2022.  What that means is that the bounce in the SPX may only be a short squeeze.  Once the powder runs out, the panic begins.


VIX futures have declined to 21.89 as the retracement takes hold.  Today is monthly options and futures expiration.  Max Pain is near 22.00 while long gamma takes hold at 25.00 and above.  That may have been the reason for suppressing the VIX until after today’s options expiration.

ZeroHedge offers something to watch, “As SpotGamma details below, this Friday, January 21st, deep in the money calls worth billions of dollars are set to expire.

Deep in the money calls are unique, because they are valued as being essentially equivalent to shares of stock (referred to as a Delta 1 position). Most of these calls were purchased in 2021 and have participated in the massive stock rally over the last year (S&P500 +24% since 1/1/21).”


TNX is taking a brief rest from its surge this week.  However, the rally is not over.  The Cycles Model points out a double dose of strength over the weekend.  This suggests that TNX may be approaching 20.00 by the end of the month.  This may make the reluctant Fed raise the rate by .5% or more in March.

ZeroHedge remarks, “It all started with another silly forecast from Jamie “Bitcoin is worthless” Dimon who predicted “six or seven” rate hikes, and a tweet from Bill Ackman (who apparently had read the latest Michael Hartnett “Flow Show” in which the BofA strategist said that “Joe [Biden] needs 50bps from Jerome at Jan FOMC” but won’t get it) in which the billioniare hedge fund manager best known for talking his book – in this case being very short bonds –  said that “the @federalreserve  could work to restore its credibility with an initial 50 bps surprise move to shock and awe the market, which would demonstrate its resolve on inflation.”


USD futures challenged the 50-day Moving Average at 95.80 yesterday and have pulled back to 95.49 this morning.  The Cycles Model suggests a continued rise through mid-February.  The potential target for this move appears to be 98.30.


Posted in Published | 2 Comments

January 18, 2022

2:19 pm

SPX is making new lows.  Why isn’t VIX making new highs?  There may be several reasons.  First, the new lows in the SPX appear to be a Wave (b) expansion.  This would have a lesser effect on the VIX due to its corrective nature.  Second, tomorrow is the expiration for VIX monthly options.  VIX is still influenced by the shorts below 23.00.  Gamma turns positive at 25.00.  And third, VIX may be used by the dealers as a means of influencing the SPX, as in “Tail wags dog.”  Should SPX make a new high, the decline in stocks may accelerate.


1:59 pm

SPX made a new low, going deeply into short gamma territory.  It may have made an expanded correction and now must dig itself out of the hole.  To escape the short gamma, the minimum bounce must be above 4600.00.   The 38.2% Fib retracement would be 4638.02.  The 50% retracement is 4659.16 and the 61.8% Fib retracement would  be 4689.28.  Chances are that it may not cross the trendline at 4665.00.  This could be a fast bounce, but not fatal to the overall decline.  Should the bounce fail, we may see an oversold panic decline.


12:00  noon

Nomura Warns “Rates Vigilantes” Are At The Gates

ZeroHedge remarks, “Nomura’s Charlie McElligott began his note this morning with an ominous tone, warning that the Rates Vigilantes are at the gates and are now pushing through / above 4 hikes in ’22…

…(and with more “trending” to a 50bps hike out of the gate) – and with a chance now that IF the Eurodollar market were to go ahead and price a hike pushing towards a 50bps “rage liftoff” to start at the March meeting (I’m still paying little-to-no mind to talk of Jan)…

…the Fed will simply “have to” take what the market is dictating to them, despite me currently believing that the FOMC has little desire to do-so.”

(Ed: This is what I have been saying all along.)


11:50 am

BKX has challenged its Cycle Top this morning at 144.25.  Beneath that is a confirmed sell signal with the Cycles Model suggesting an almost continuous decline through the end of February.  Banks reporting losses and misses in their quarterly earnings confirm that liquidity is being drained from the market.

ZeroHedge reports, “One trading day after JPM reported disappointing earnings and its stock suffered the biggest post-earnings drop in a decade, moments ago Goldman joined it in the penalty box with its shares tumbling as much as 3.1% in premarket trading Tuesday after reporting worse-than-expected fourth-quarter trading revenue, even if overall revenue beat (Q4 revenue $12.6BN, Exp. $12.08BN), with EPS of $10.81 also coming in below expectations of $11.76. Total profit declined 13% to $3.94BN, even as revenues grew 8%. Still, this was a solid number in context: profit at JPMorgan fell 14% in the fourth quarter from a year earlier, while profit at Citigroup fell 26%.”


11:44 am

SPX bounced from its 100-day Moving Average at 4576.00.  It appears to be trapped below 4600.00 so the bounce may have ben shortened.  Short gamma is prevalent at this level, so be prepared for further weakness.

ZeroHedge remarks, “As Europe closes, US equity markets took a decided leg lower with Small Caps and Nasdaq leading the way but S&P and The Dow not escaping the selling pressure this time…

And this push lower sent the S&P to its 100DMA, The Dow broke below its 100DMA, Nasdaq surged below its 200DMA and Russell 2000 is searching for any support…”


11:05

TNX surged to a new high of 18.56 as ZeroHedge reports, “The New York Fed just issued a statement that is is rescheduling today’s planned Treasury Purchase due to “technical difficulties”:

Due to technical difficulties, today’s Treasury outright purchase operation – scheduled for 10:10 AM in the 4.5 to 7 year sector for up to $6.025 billion – is being rescheduled.

It is now scheduled to take place Wednesday, January 19, 2022 at 10:10 AM. Information on Treasury securities operations can be found on the New York Fed’s webpage.

This does not impact any other operations scheduled for today.”


10:15 am

SPX has completed a 5-Wave impulsive decline.  Now for the probable corrective bounce.  The 50% retracement value is 4668.00 while the 61.8% Fibonacci retracement is at 4687.00, just above the Wave (iv) high.  There is some indication that the bounce may fall short of those two targets.  Short gamma is very strong and may become irresistible beneath 4600.00.

ZeroHedge observes, “The market selloff into January rattled investors as concerns of So Goes January, So Goes The Year” began to dampen expectations. Combined with a more aggressive stance from the Federal Reserve, rising inflation, and a reduction in liquidity, investor concerns seem to be well-founded.

As discussed last week in Passive ETFs Are Hiding A Bear Market,” the “blood bath” in the high-beta stocks is particularly humbling for the retail crowd that piled into risk with reckless abandon last year.

“Probably one of the best representations of the disparity between what you see ‘above’ and ‘below’ the surface is the ARKK Innovation Fund (ARKK). While the S&P 500 index was up roughly 27% in 2021, ARKK is down more than 20%. That is quite a performance differential but shows the disparity between the mega-cap companies and everyone else.”


7:40 am

Good Morning!

NDX futures made a morning low at 15284.40 as short gamma has its sway on stocks that could only thrive in a low interest environment.  The dominoes are falling while NDX may have another 8 days of decline in a 21.5 day crash.  The NDX Hi-Lo Index fell to -600.00 on Friday, setting the tone for this morning’s bloodbath.


SPX futures fell to 4599.20 this morning, testing last Monday’s low and the 100-day Moving Average at 4575.14.  Today’s options are positive above 4685.00 and gamma turns long at 4700.00.  Today’s cumulative options expiration remains short at 4625.00 and gamma goes short beneath 4600.00 which may stat a chain reaction among the dealers who must match up their books with investors/speculators who are increasingly bearish in options.  SPX has 8 days left of a potential 17.2 day decline in the current Master Cycle.  On Friday the NYSE Hi-Lo Index fell to -98.00.

ZeroHedge reports, “Yesterday when US stock markets were closed but both bond and equity futures were trading, we pointed out that 10Y Treasury futures implied a yield of over 1.80%, a number which was the highest in years and which we warned would cause headaches for stock traders when the US reopened fully on Tuesday. And sure enough, with 10Y yields surging as high as 1.8536% overnight and 2Y yields jumping to 1.05% (up a whopping 15bps from 0.90% last Friday)…

…. futures are getting hammered this morning, with emini S&P futures down 48 points or over 1% and just above 4,600, while Nasdaq futures were getting hammered again, sliding 1.62% or 254 points. The dollar rose and Brent oil touched $88/bbl, the highest price since 2014.”


VIX futures rose to a new high at 22.09 and is on a confirmed buy signal above the 50-day Moving Average at 19.95.  VIX is on the same Cycle as SPX, but inverse with 8 days left of the current Master Cycle.

ZeroHedge reports, ”

  • The Event: This Friday, January 21st, deep in the money calls worth billions of dollars are set to expire. Deep in the money calls are unique, because they are valued as being essentially equivalent to shares of stock (referred to as a Delta 1 position). Most of these calls were purchased in 2021 and have participated in the massive stock rally over the last year (S&P500 +24% since 1/1/21).
  • The Participants: We think these calls are held by a wide variety of players, from large hedge funds all way to wealthy individuals. For example, its well known that Nancy Pelosi favors purchasing long-dated call options. By purchasing large, long-dated call positions, investors gain levered exposure to higher stock prices, while limiting downside risk. Meaning, they can pay a premium to buy more upside through long-dated calls then they can get by buying shares of a company’s stock using the same amount of investment capital.
  • The Potential Impact: Regardless of these investor’s individual strategies, at SpotGamma, our models indicate that the net options delta set to expire on Friday, January 21st is over $125 billion.  Our base case is that the expiration of these deep in the money calls are a catalyst for volatility – that is expanded stock price movement higher or lower. The ability to assign a direction to this volatility is dependent on how one assumes these investors are positioned.

If the bulk of these call positions (which could vary on a ticker by ticker basis) are held long by investors, then our assumption is that there are options dealers who are short these calls. In turn the dealers likely hedge these short call positions through owning shares of the underlying stock, and/or offsetting long call options (aka long delta positions).

Conversely, if these investors are net short calls, then dealers would own long calls and may in turn short the underlying shares as a hedge.”


USD futures are climbing after having made their Master Cycle low on Thursday.  USD appears to be on the final surge of its corrective phase that may run to 98.30, the 61.8% retracement of the 2020 decline.


TNX gapped above the prior high as trending strength took hold this weekend.  This period of strength may last through the week with the current Maser Cycle set to last through the end of February.  Normally the interval between Cycles is 30 to 60 days.  This one is anticipated to go 86 days in varying degrees of strength.

ZeroHedge asks, “(Will) rates matter?

The short term gap between NASDAQ and the 10 year is rather wide here (again). If “they” start to care about rates properly, tech could be in for another round of beating…

Source: Refinitiv

GS: front end will shift higher

GS: “We think current market pricing is too low, and expect the front end of the curve to shift higher by the end of next year”.

Source: Goldman

Fed pricing still looks modest…

…when looking longer out. Nordea, who has been spot on the inflation/yields narrative, writes: “…we do see more room for such pricing to surface later this year and next and see higher bond yields also at the longer end of the curve.”


Posted in Published | 4 Comments

January 17, 2022 – Martin Luther King Day

7:30 am

Good Morning!

SPX futures are mildly positive this morning.  As of Friday’s low the SPX Cycle has gone 8.6 days from the January 11 peak at 4818.62.  It is now at a major crossroads.  The chart above shows the bullish view, showing the SPX rising to 4920.00 or higher by the end of the month in a Broadening Wedge formation.  Last week’s decline did not make a new low, raising the probability that this may be the outcome.

Tomorrow’s options expiration may guide us.  SPX options are negative beneath 4675.00 with negative gamma at 4625.00 and below.  Max Pain is at 4680.00.   Options turn positive abruptly at 4685.00 with positive gamma at 4700.00 and above.   The 50-day Moving Average is at 4679.65, which may be the demarcation guide for tomorrow’s outlook.


NDX futures remain flat this morning.  NDX also did not make a new low on Friday, although the options are clearly in negative territory beneath 16000.00.  Should NDX remain beneath the trendline at 15600.00 and make a new low tomorrow, it may pull the other indices substantially lower.  NDX appears to have made its Master Cycle low on January 10 (day 253).  This is out of sync with the SPX, which is ending its current Master Cycle next week.  However, the two indices appear to sync back up at the end of February.


TNX futures rose to 17.93, above the Cycle Top support/resistance at 17.64 and threatening the January 10 high.  Note that the NDX Master Cycle low occurred also on January 10.  Should we see a breakout in the next few days, the path for equities will become clear, as well.  Everything is interconnected.  Unfortunately, most analysts don’t see the whole picture.

ZeroHedge comments, “The Devil Is in the Details

The first two weeks of the year have reinforced the key message from our 2022 Strategy Outlook – the policy training wheels are indeed coming off, and fast! The hawkish shift in the minutes of the FOMC’s December meeting, reinforced by the rhetoric from a number of Fed officials, signals policy tightening through more hikes. They are coming sooner than expected, and the timeline between the first rate hike and the beginning of balance sheet runoff will be compressed. Our economists now expect the Fed to deliver four 25bp hikes this year, at its March, June, September,and December meetings, in addition to an August start for the balance sheet runoff announced last July. Market pricing already reflects this hawkish shift, with the March liftoff nearly fully priced in along with 3-4 hikes in the subsequent 12 months.


Posted in Published | Comments Off on January 17, 2022 – Martin Luther King Day

January 14, 2022

11:55 am

BKX has reversed back beneath the trendline after Yesterday’s Master Cycle high.  This constitutes a sell signal which may be confirmed once it declines beneath the Cycle Top support at 144.01.   The Citigroup’s earnings miss marks the top of this Cycle and ushers in reduced liquidity to the markets.

ZeroHedge remarks, “According to Doug Ramsey of the Leuthold Group, 334 companies trading on the New York Stock Exchange recently hit a 52-week low, more than double the amount that marked new one-year highs. That’s happened only three other times in history — all of them occurring in December 1999.

How did we get back to the precipice of the year 2000, where tech stocks plunged 80% and the S&P 500 lost 50% of its value over the ensuing two years? Well, start off with the fact that the amount of new money created by our central bank in the past 14 years is $8 trillion. That, by the way, is an increase in base money supply only and does not include all of the new money created by our debt-based monetary system. So, from 1913 to 2008, the Fed created $800 billion. And, it took from 2008 until today—just 14 years–for it to have created $8.8 trillion in base money supply. Is there really any wonder why inflation has now become a salient issue, especially for the middle and lower classes, and why the stock market is now set up for a meltdown similar to the NASDAQ collapse of two decades ago?”


7:45 am

Good Morning!

NDX futures have continued their decline overnight, slipping beneath the Ending Diagonal trendline and the 2-hour Cycle bottom at 15455.00.  Max Pain for today’s expiring options is at 15660.00.  It is deep in negative gamma territory and may lose control beneath 15500.00, near yesterday’s close.  At that point the decline may become self-reinforcing.  The NDX Hi-Lo Index closed at -318.00, showing investors heading for the exits.

ZeroHedge remarks, “NASDAQ – back to very oversold, but…

NDX closed right in the big support “congestion” area. We closed below the 100 day moving average, but the longer term trend is still around these levels/slightly lower. 200 day is some 3% lower. RSI is oversold, but as we all know, oversold can stay oversold for longer time periods, especially when RSI “establishes” low levels (note RSI in February and September 2021). Big oscillations and a non trend remains the theme, but watch this closely should we close slightly lower…”

Source: Refinitiv


SPX futures have fallen beneath the 50-day Moving Average and the Ending Diagonal trendline at 4650.00 this morning.  It is on a confirmed sell signal with the potential of reaching 4000.00 by the end of the month.  It may go deeper.  The Ending diagonal target is its origin at the March 23, 2020 low at 2191.86 and may be complete by the end of February.


The NYSE Hi-Lo Index closed at 34, just above neutral territory at 30.00.  A sell signal is confirmed beneath the 50-day Moving Average at 7.36.

ZeroHedge reports, “fter trading flat for much of the overnight session, S&P futures slumped to session lows shortly after JPM reported earnings that disappointed the market (see our full write up here) and were last trading down 30 points or 0.64%, with Dow futures down 0.3% and Nasdaq futures taking on even more water as the “sell tech” trade was back with a bang. Treasury yields rose 3bps to 1.74% and the dollar reversed an overnight loss. The VIX jumped above 20 and was last seen around 21.

The Nasdaq 100 fell to the lowest in almost three months yesterday as tech came under pressure after Fed Governor Lael Brainard said officials could boost rates as early as March. It looks like the selling will continue today.”


VIX futures made a new high this morning at 21.82.  It is on a confirmed buy (SPX sell) signal.  An unofficial calculation shows the VIX may rise above 100.00 this month.  There may be two more weeks of rally in this Wave 3.


TNX may have launched its next surge higher as a triple dose of trending strength may have taken hold today.  That period of strength may last until the end of the month.    However, the top of this Cycle may continue to the end of February.


Posted in Published | Comments Off on January 14, 2022