
3:30 pm
Watch the 4300.00 level. Should the SPX close at or beneath it, it would be time to take short-term profits. Monday’s open may be messy.
2:58 pm
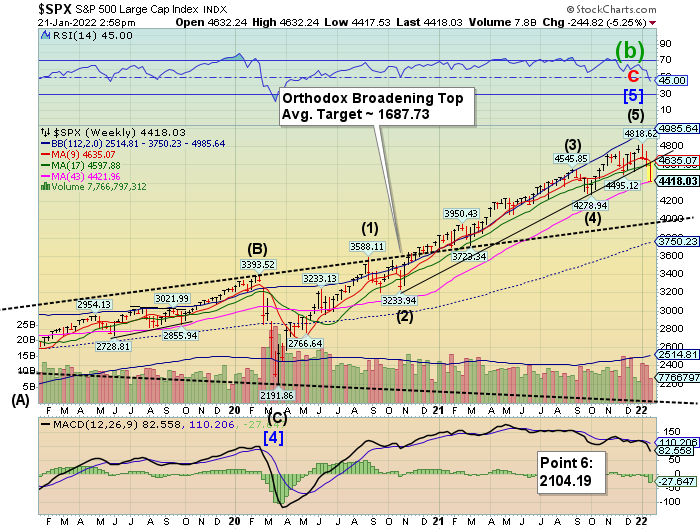
SPX has crossed beneath the 200-day/43-week Moving Average at 4422.00 which defines the long-term trend. In addition, it has crossed beneath the 4450.00 options (over 21,857 put contracts) that may cause an acceleration to the downside.
3:11 pm
SPX crossing beneath 4400.00 strike with 25,445 contracts… another $110+ million of market cap being shorted. Large strikes at 4375.00 and 4350.00. Will the pain stop? Another $86 at 4300.00.
2:20 pm
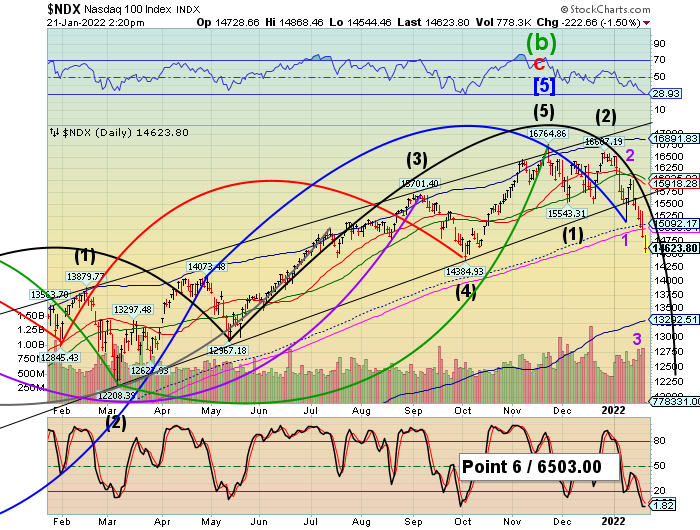
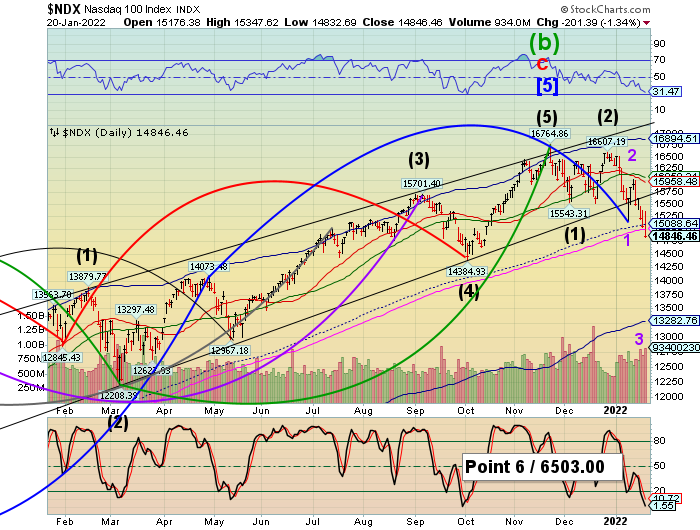
NDX may be making its most spectacular decline yet. The potential target for this hourly Cycle appears to be 13550.00. Another 1100 points lower in the next 2 hours. It’s hard to tell yet whether the decline lasts over the weekend. We may see a volatile open on Monday in order to make this target. It may hit bear market status should it hit 13400.00.
ZeroHedge advises, “For the past year BofA Chief Investment Strategist, Michael Hartnett, has been one of Wall Street’s gloomiest strategists (perhaps just below Albert Edwards and Michael Wilson on the permabear scale) warning that global markets are on the precipice of disaster, and predicting that 2022 will unleash a “rate shock” that will hammer risk assets, and as 2022 gradually rolls out doling out major pain for the bulls, his predictions are coming true. In fact, just last Friday we published his outlook for a “Stagflationary Hellscape For Markets In 2022″, and over the past week traders have watched in shock as this view imposes itself on markets.”
10:39 am

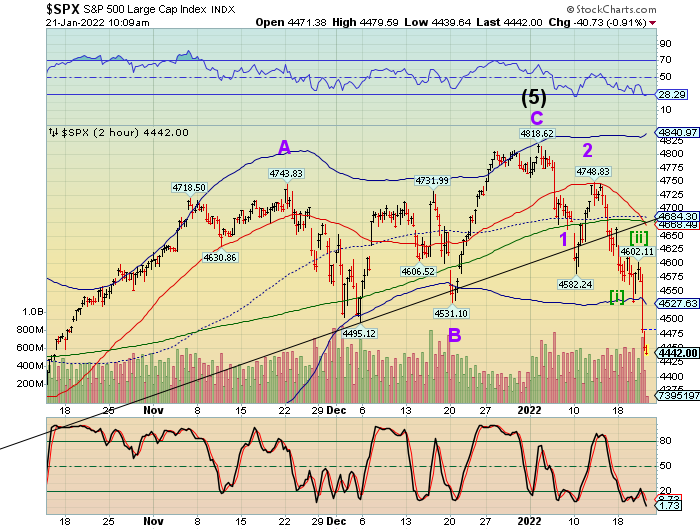
SPX bounced at 4420.00. Will it escape the short gamma claws? Hardly. It may resume with a top-of-the-napkin target near 4250.00. at the end of the day.
ZeroHedge comments, “As this morning’s chaotic open uncoils into another leg lower, Nasdaq is now suffering its worst start to a year in at least 30 years (it is very slightly worse than 2008), and the S&P’s longest weekly losing streak since Sept 2020.
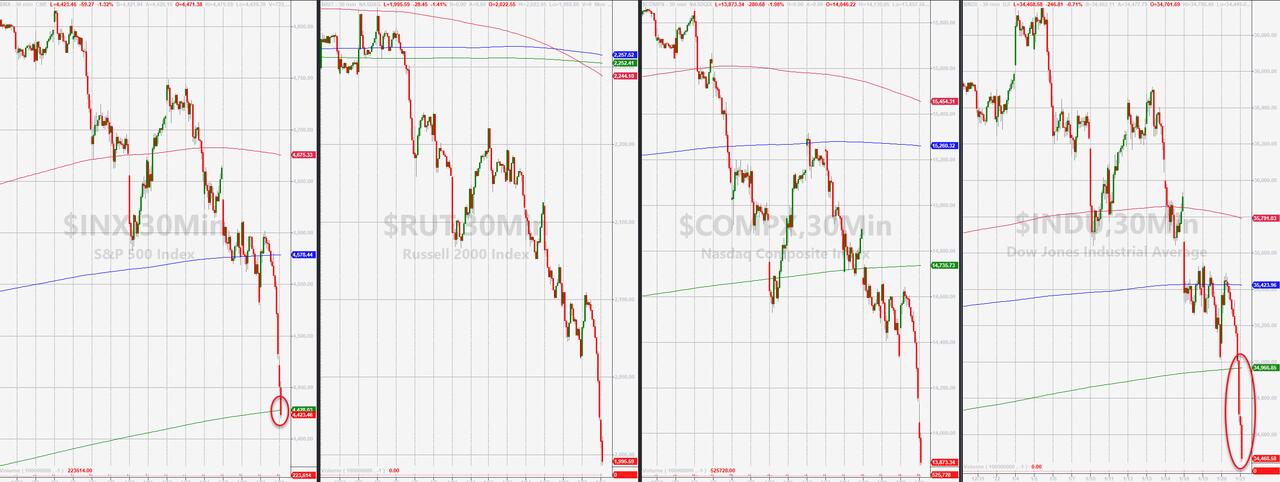
Crucially, the S&P 500 just broke below its 200DMA…

Which now means all the US majors are below their 200DMAs…
10:0 am
SPX declined beneath a massive tranche of 21,870 put contracts which may entail the sale or short sale of over 97 million market cap. This is what may accelerate the decline. Should that take place, margin calls may also be de rigeur.
What Do Markets Look Like When They Panic?
Read ZeroHedge.
They look like today.
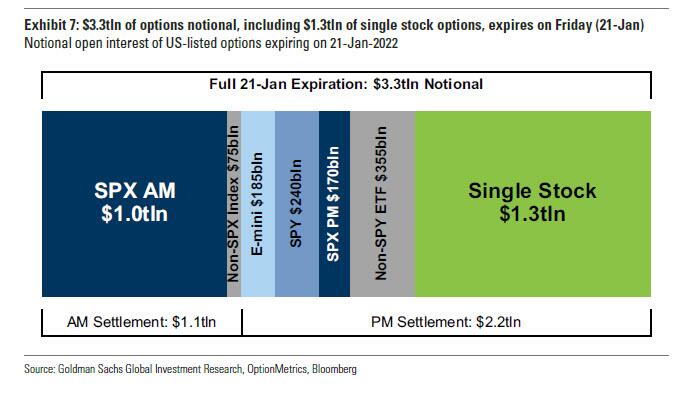
ZeroHedge observes, “As we noted last night, today we see a whopping $3.3 trillion in total notional option expirations, of which $1.3 trillion in single stock options expirations, the 2nd largest ever, and ~2.7% of the Russell 3000 market cap. According to Goldman, single stock options trading activity remains robust, with an average daily notional of $506bn in January, consistent with the elevated levels of 2021 (average daily notional of $468bn).
Why does this matter? Well, as we have discussed extensively in the past, at major expirations, options traders track situations where a large amount of open interest is set to expire. In situations where there is a significant amount of expiring open interest in at-the-money strikes (strike prices at or very near the current stock price), delta-hedging activity can impact the underlying stock’s trading that day. If market makers or other options traders who delta-hedge their positions are net long ATM options, expiration-related flow could have the effect of dampening stock price movements, causing the stock price to settle near the strike with large open interest. This situation is often referred to as a “pin” and can be an ideal situation for a large investor trying to enter/exit a stock position. Alternatively, if delta-hedgers are net short ATM options (have a “negative gamma” position), their hedging activity could exacerbate stock price moves.”
7:50 am
Good Morning!
NDX futures continued their decline last night, reaching a low of 14617.00 before a bounce. NDX is caught in a short gamma scenario that has yet to play out. This may keep the decline underway through options expiration and possibly at the open on Monday, where a searing bounce is brewing. However, that is not the end of the Master Cycle, which may resume through Thursday/Friday (another options expiration?). There are large nests of expiring puts at 50 point intervals down to 14500.00 today. They are large enough to have been bought by hedge funds against a potential crash. Unfortunately, this activity may make the decline more severe. Most analysts are not used to this and expect the bounce sooner than later.
This may also raise the spectre of margin calls on the NDX, which closed down 11.4% from the high. Margin usually kicks in in a decline that exceeds 10%. The NDX Hi-Lo Index closed yesterday at -653.00.
ZeroHedge advises, “Facing a massive $3.3tln of options notional, including $1.3tln of single stock options, expiring on Friday, Nomura’s Charlie McElligott warned yesterday that “it’s a doozy of epic “short Gamma, short Delta”…

But, SpotGamma points out that the shift lower in markets over the past several days has increased the concentration of put-heavy gamma tied to Fridays OPEX.
We now see >=30% of S&P, and >=20% of QQQ rolling off on 1/21. You can see below that as long as the S&P is <=4600 the expiration brings a reduction in negative gamma (via the closure of puts).
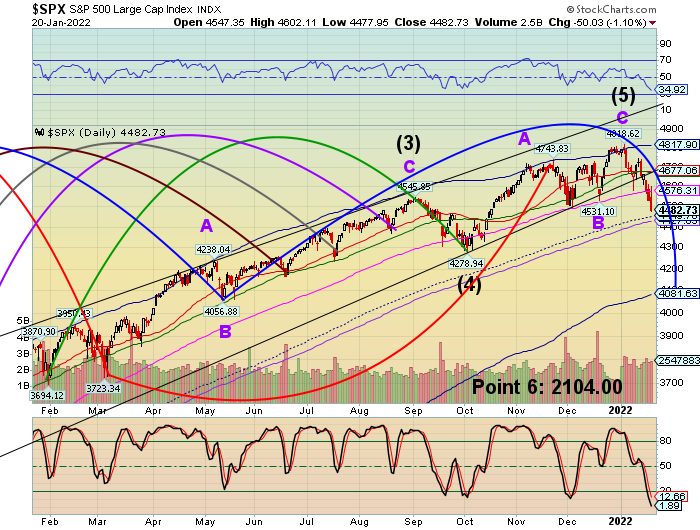
SPX futures probed beneath the mid-Cycle support at 4449.00 in the overnight session where another short gamma bomb is set to go off. The 200-day Moving Average is at 4427.63. In today’s options expiration gamma turned seriously short at 4500.00 and there are large holdings of puts at 50-point intervals down to 4350.00. The NYSE Hi-Lo Index closed at -232.00 yesterday with sellers coming in late in the day.
The hourly Cycles suggest the decline may continue through today and may bleed over to Monday’s open as the dealers and hedge funds “true up” their positions to reflect the drop-off of today’s expiring options.
ZeroHedge reports, “Futures, yields, oil, dollar, cryptos – everything is lower on this $3.1 trillion option expiration day…

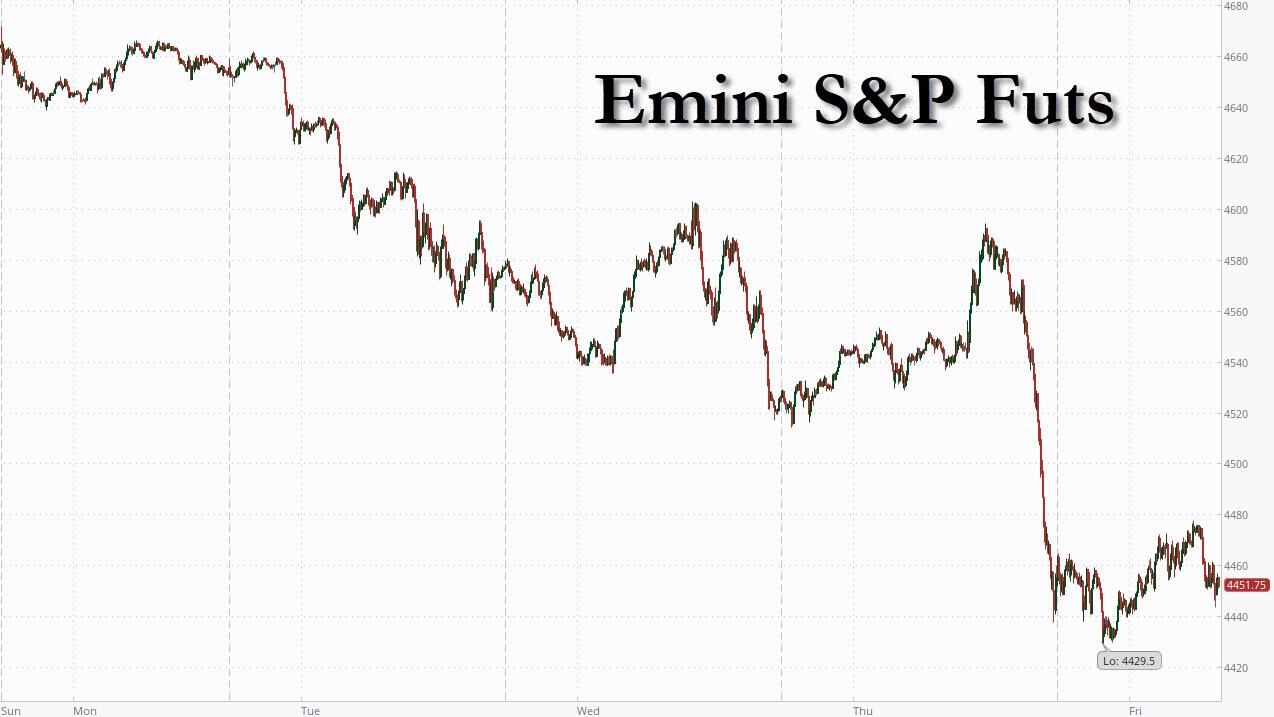
… as US traders relocate from their bedroom to their basement on the last day of the week, discovering a sea of red in most assets and a “total meltdown” in others. Emini S&P futures are down 0.5% or 22 points to 4,452 which by the way is well off the session lows which saw the S&P plunge as low as 4,429. Nasdaq futures are down 0.8% or 122 and Dow futures are lower by 95 points or 0.25%, while European stocks touched the lowest level in a month weighed by miners, travel and leisure and automakers. 10Y TSY yields are at 1.778%, rising from 1.76% at the session lows, but down from Thuesday’s close around 1.80%.”
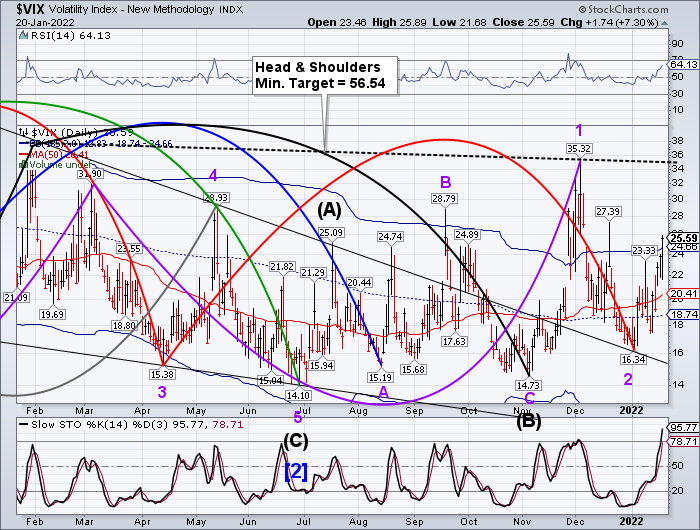
VIX futures made an overnight high of 27.18 after closing above the Cycle Top yesterday. Today’s question is, will it break out above the Head & Shoulders neckline? In next Wednesday’s options expiration, options turn positive at 23.00 and gamma turns seriously long at 24.00. While there may be a pullback on Monday, the Master Cycle ends in strength on Thursday/Friday next week.
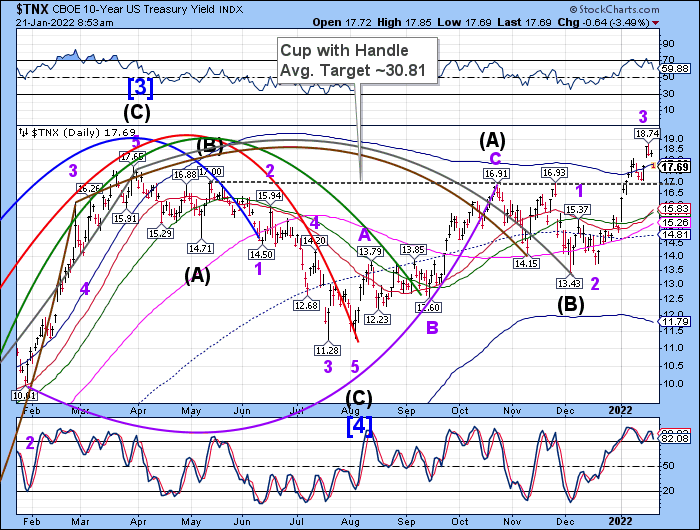
TNX is in a serious pullback due to the migration of liquidity from stocks to bonds, but it may not last beyond today as trending strength returns over the weekend. The Cycles Model suggests a continued uptrend through late February, possibly awaiting the FOMC meeting/announcement on the 16th.
MikeShedlock observes, “In his 4th Quarter Review and Outlook, Lacy provides some interesting charts on negative real rates and recessions.
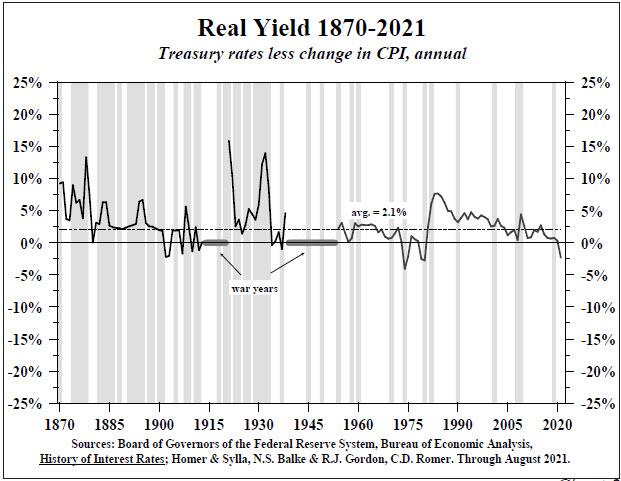
Please consider the Hoisington Management Quarterly Review and Outlook Fourth Quarter 2021. Emphasis Mine
Real Treasury Bond Yields
Real Treasury bond yields fell into deeply negative territory in 2021. In elementary economic models, this event, taken in isolation, would qualify as a plus for economic growth in 2022 and would be consistent with the strength indicated by fourth quarter 2021 tracking models.
Lacy a different view however. His analysis shows that negative real yields are associated with recessions.
Debt overhang and demographics make the matter worse.”