February 27, 2023

9:52 am

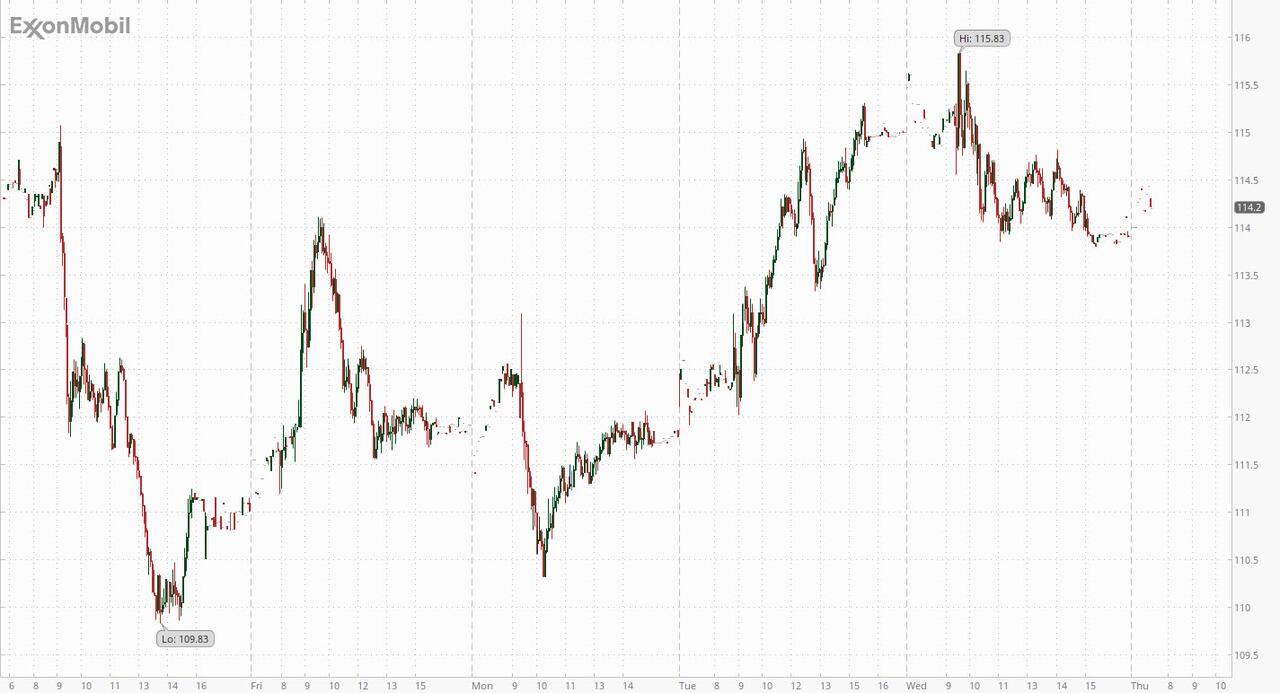
BKX, our liquidity proxy, has a probable day left in its correction mode.  Intermediate-term resistance is at 110.30, while the 38.2 % Fibonacci retracement is at 110..70.  While it could go higher, time is running out for this move.  The Cycles Model suggests the decline may extend to the end of March.

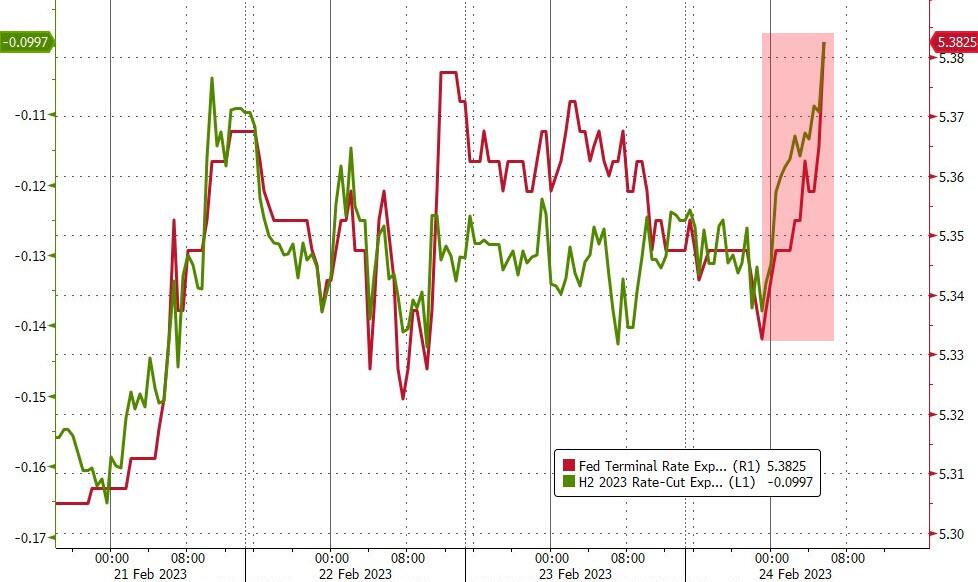
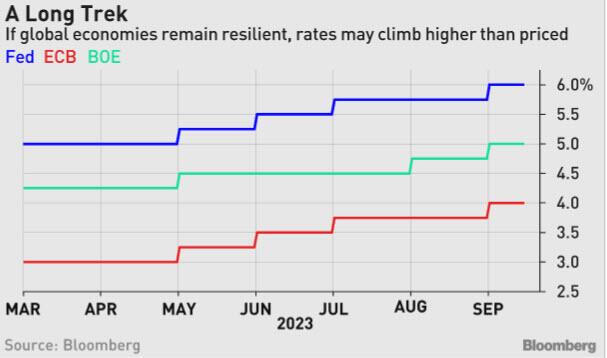
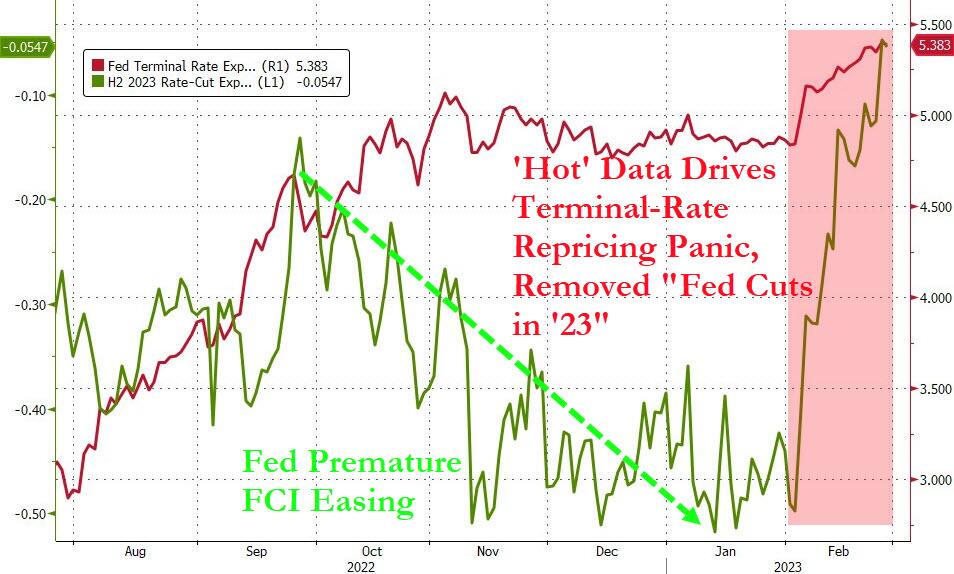
ZeroHedge remarks, “Nomura’s Charlie McElligott notes that the market has rightfully “trued-up” Fed terminal rate expectations in-line with spectacularly resilient growth data both domestically and internationally, following the FOMC’s multi-month “premature FCI easing” blunder which allowed for a reacceleration of “animal spirits” across inflation-, retail / consumption-,  labor- and even survey- / “soft-” (particularly within Services sector) data, pouring gasoline on a still too robust economy, relative to their purported inflation-fighting aspirations.

Source: Bloomberg

The market had to reassess a ton of “mis-pricing” in Rates – needing to effectively remove the probability distribution which then implied the potential for Fed EASING later in 2023 – and we got it, with U3 / Z3 smashed lower, upper left Vols reaccelerating, a monster “de-inversion” in M3-Z3, and a power flattening in cash UST curves…”


8:20 am

I am planning on doing a final post tomorrow, but may be cut short due to scheduling issues.  I have a 3-week tour of the mid-West starting tomorrow and lasting through the 21st.

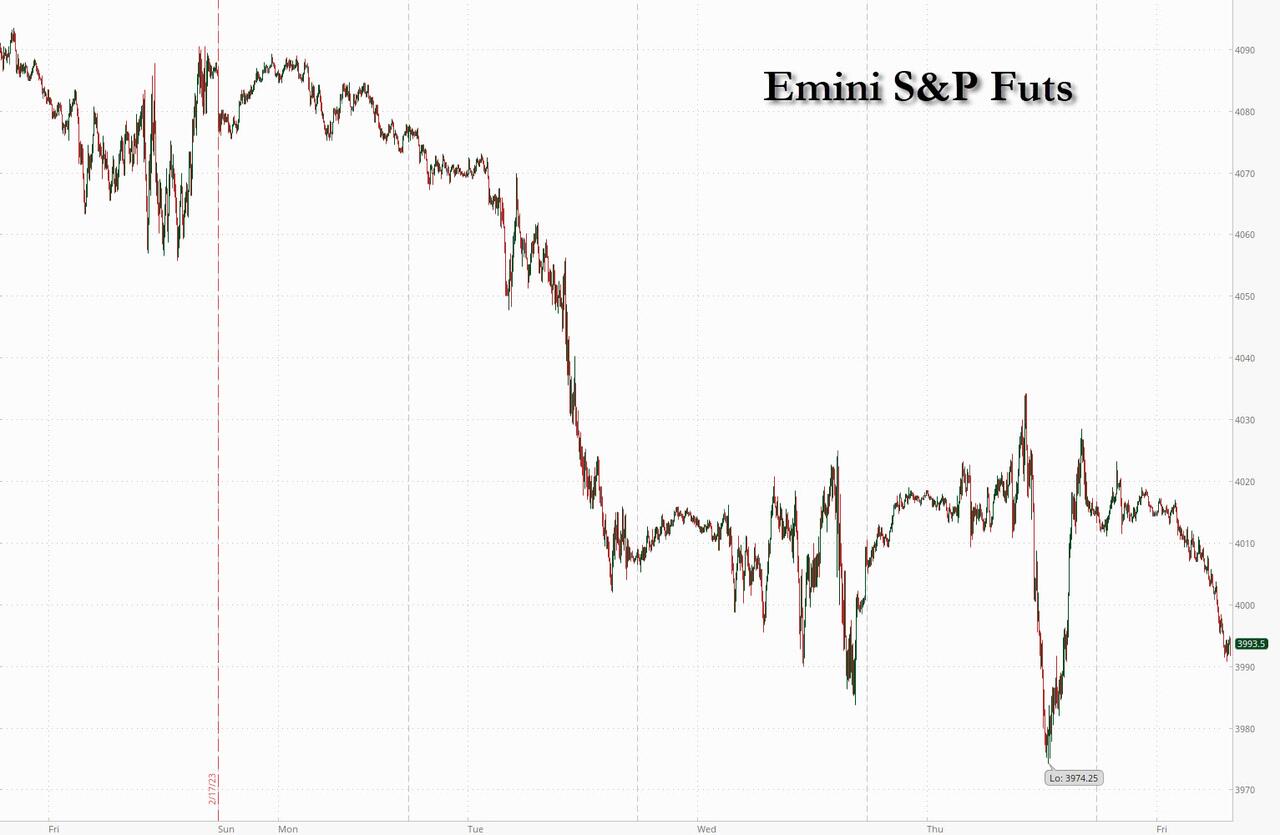
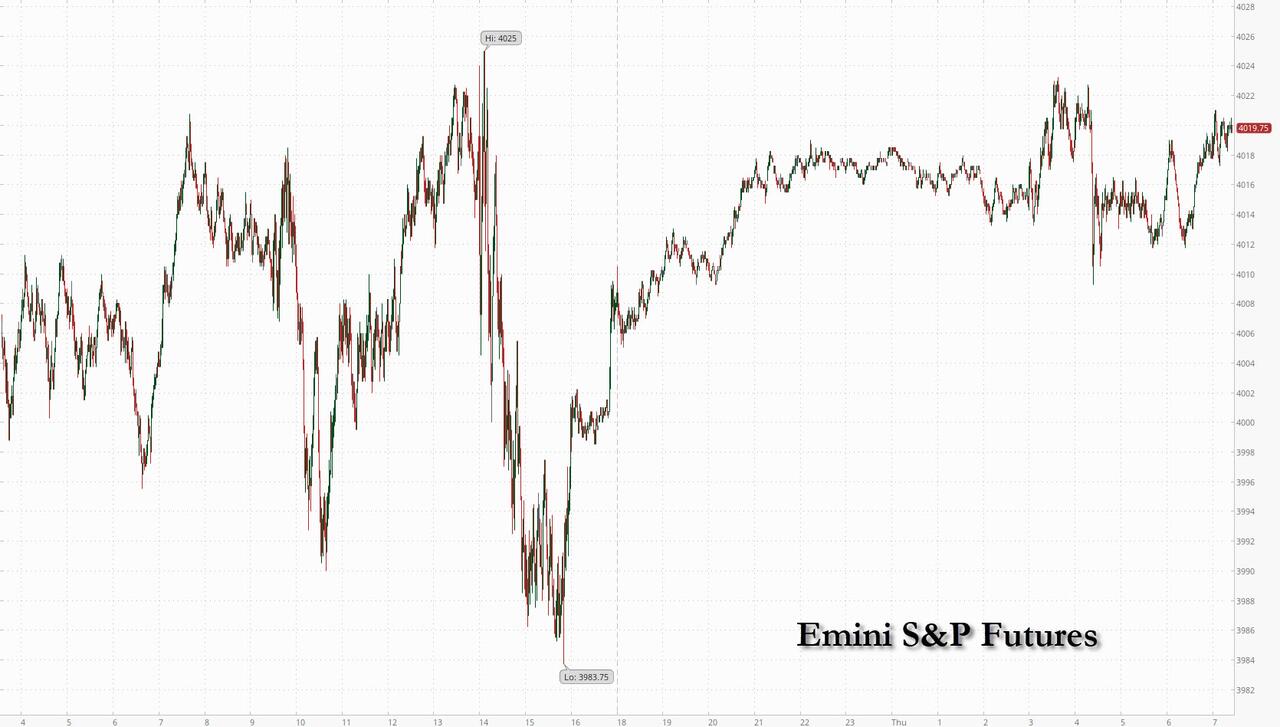
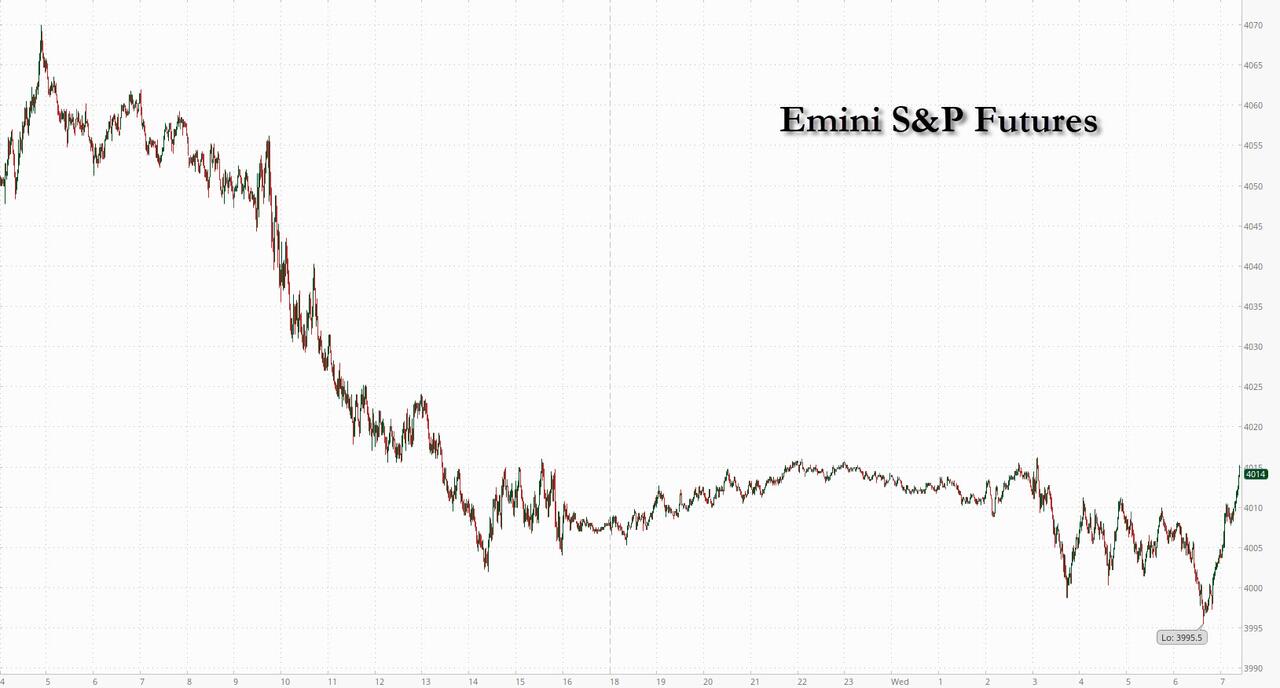
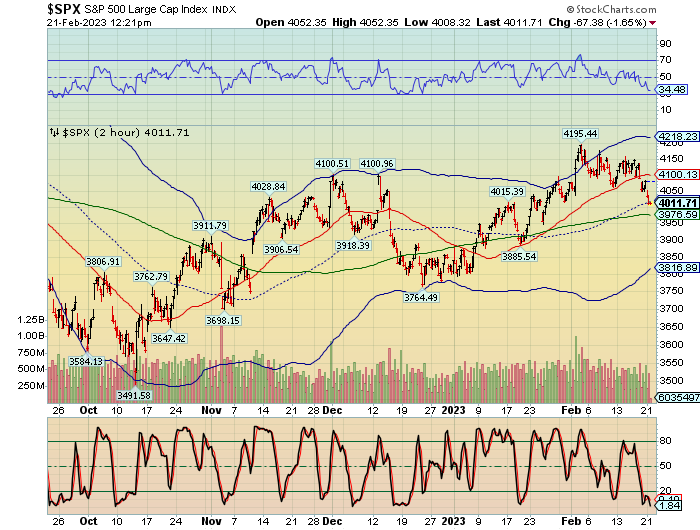
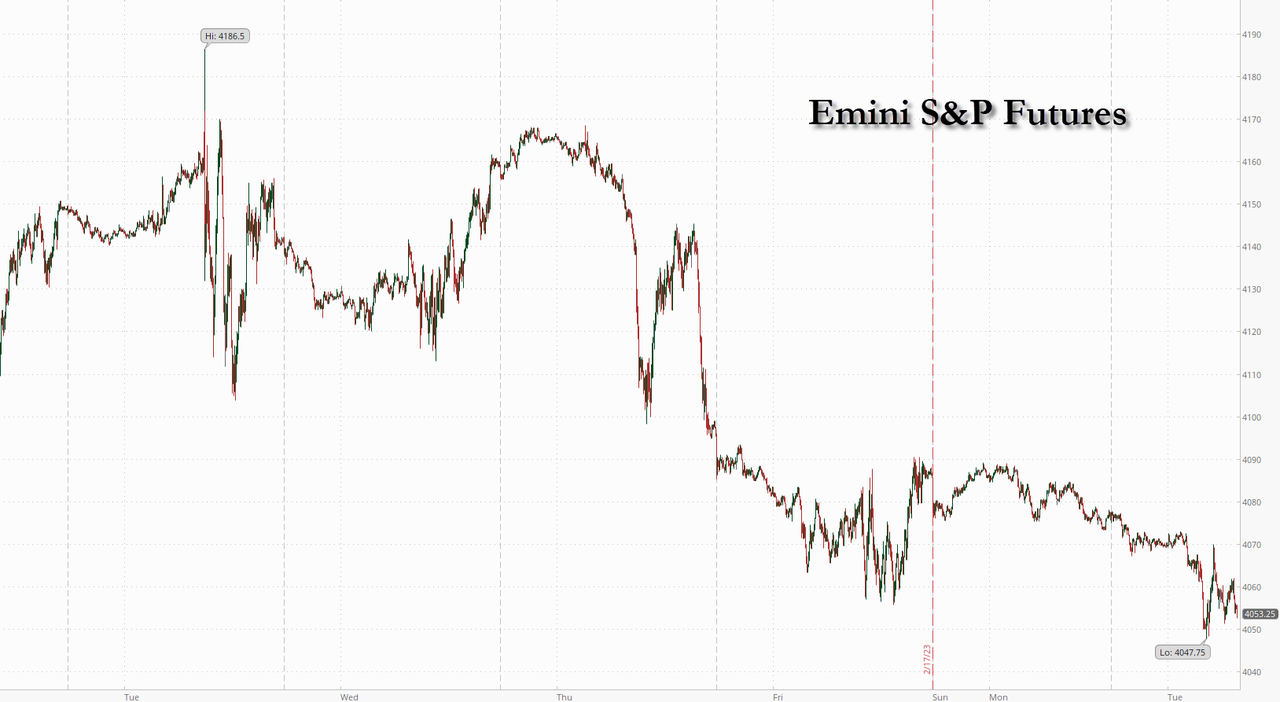
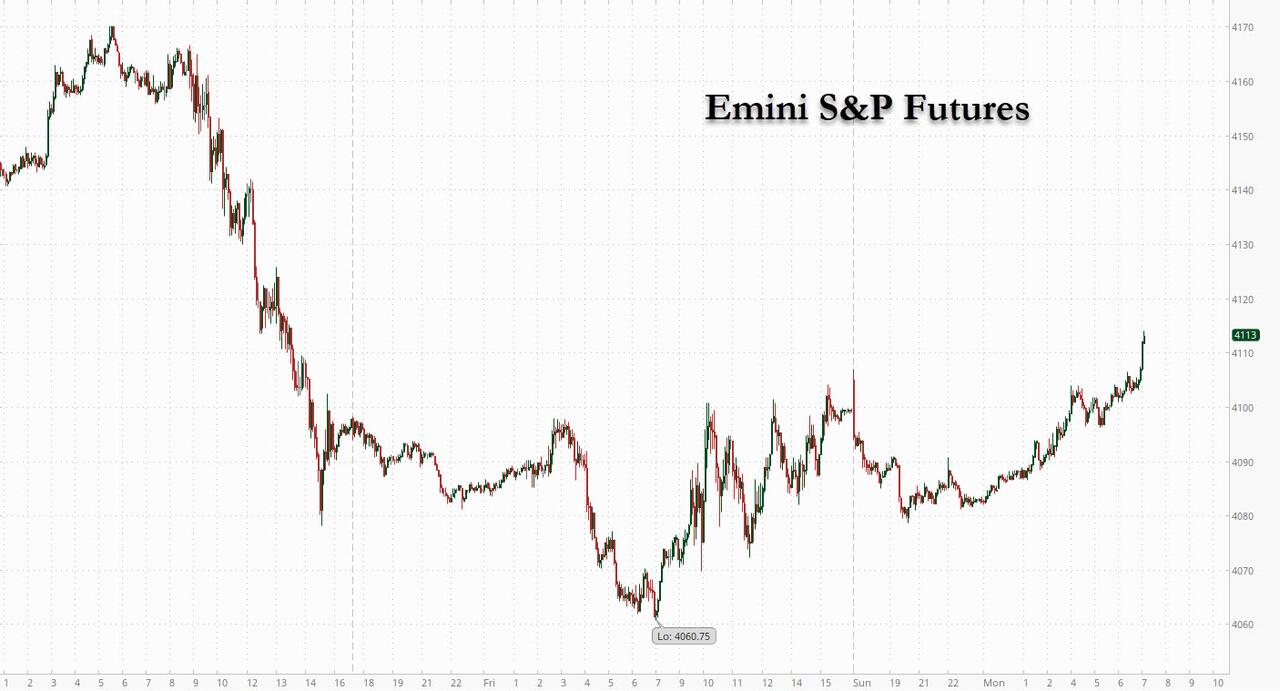
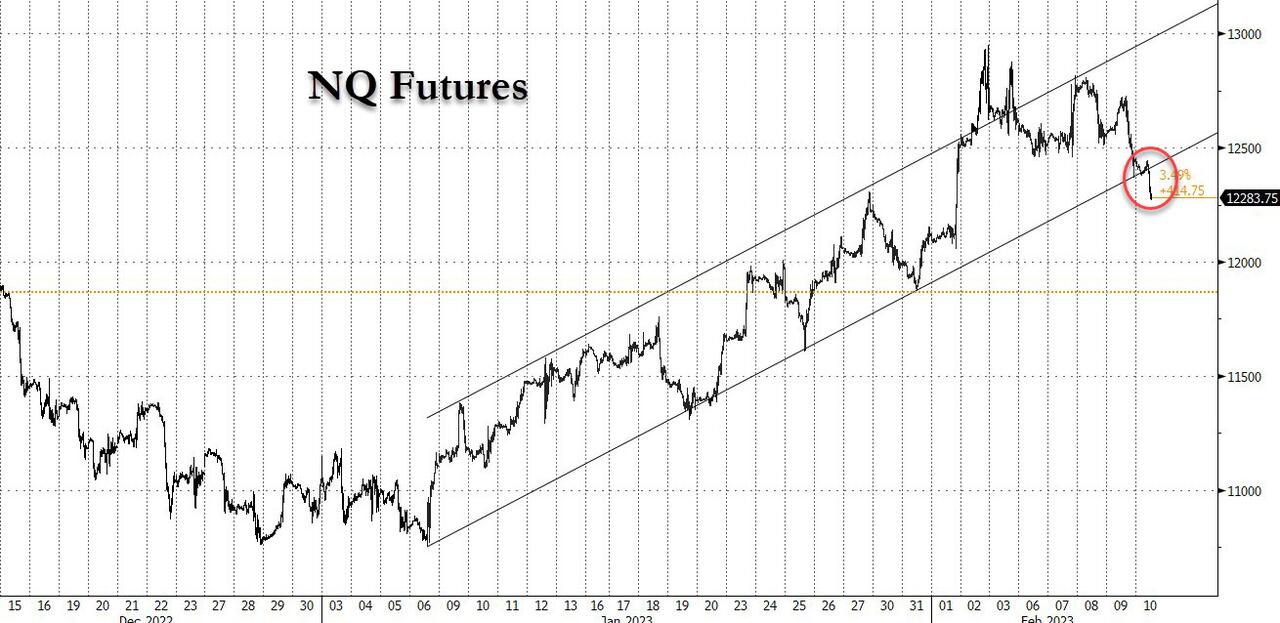
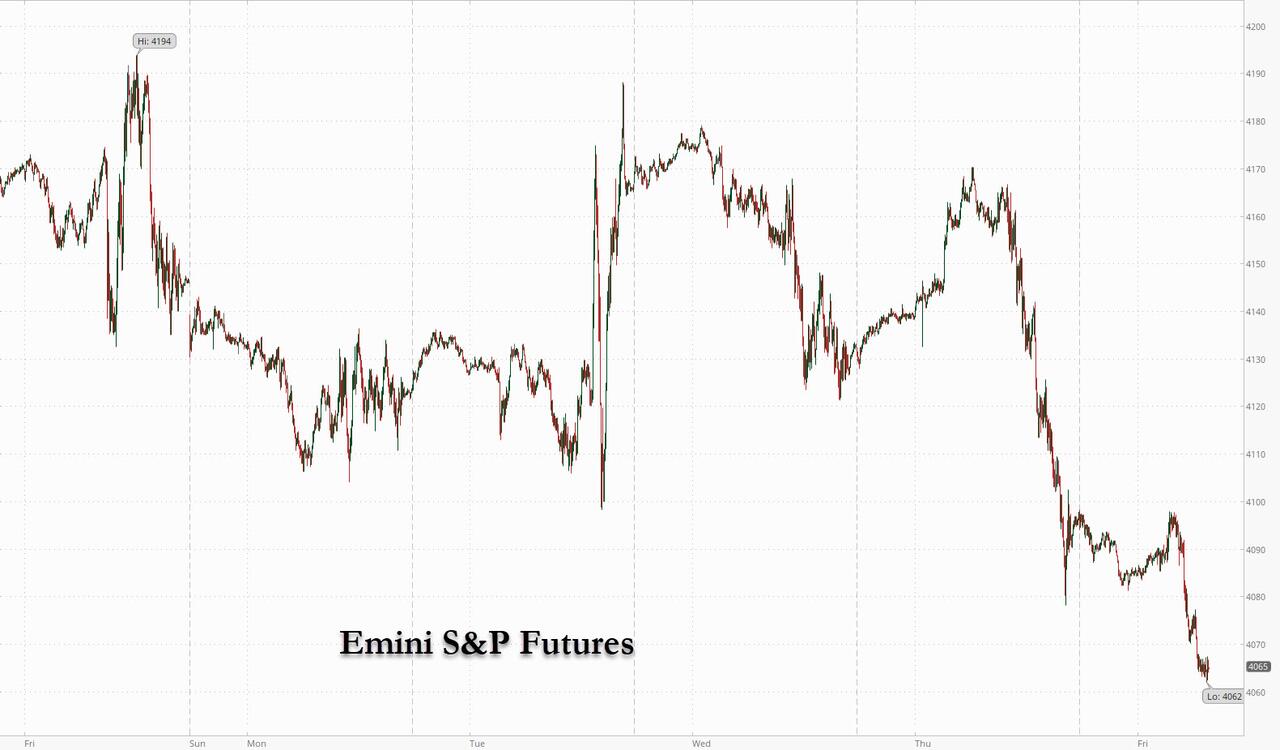
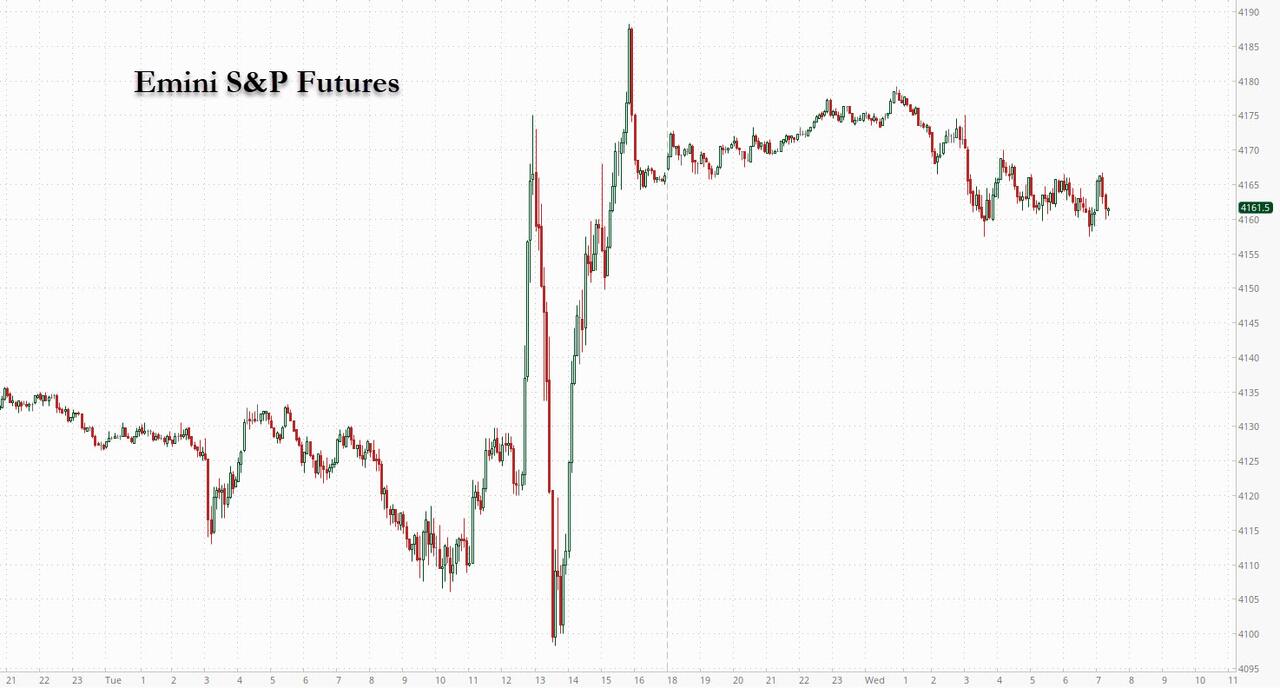
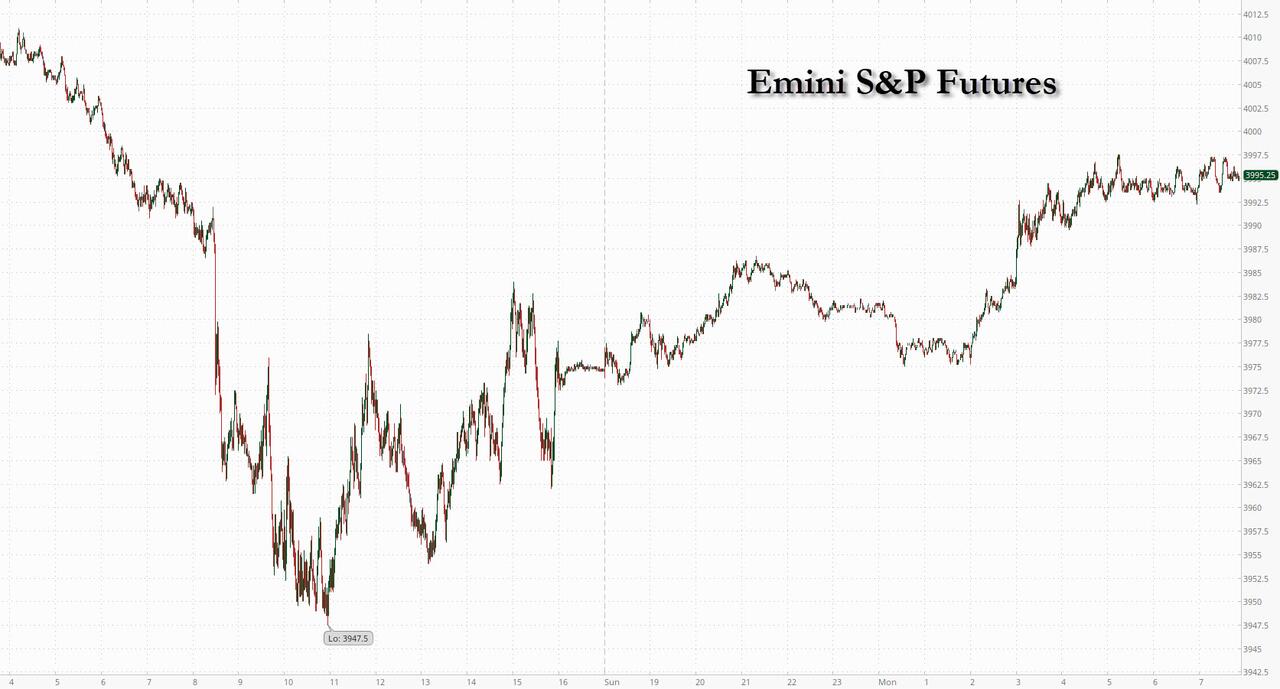
SPX futures have bounced back above the 50-day Moving Average at 3979.19 to a morning high at 4003.00 thus far.  The bounce may go to 4020.00-4040.00 and last through the morning.  The earliest we  may see a low is Wednesday March 1.  However, the  Wave structure is far from complete, leaving the current Master Cycle to extend at least to Friday or the following mid-week.  The reason for this extension is the jobs report on Friday, which may cause a chaotic reaction.

Today’s options chain shows Max Pain at 3975.00.  Calls eke out an advance at 3995, while puts show short gamma starting at 3950.00.  Short interest is gathering steam and only needs a push to dominate the Cycle.

ZeroHedge reports, “US index futures jumped after suffering their worst weekly drop of 2023, as traders looked for fresh opportunities to buy stocks while assessing the outlook for growth. S&P 500 futures rose 0.5%, rising just shy of 4,000 by 7:45 a.m. ET after the underlying benchmark fell 1.1% in the last trading session. Nasdaq 100 futures rose by about 0.6% after the tech-heavy gauge tumbled 1.7% at the end of last week. European and Asian stocks also rose; the Bloomberg Dollar Spot Index turned red after retreating from the day’s highs, lifting most Group-of-10 currencies. Treasuries edged lower, mirroring moves in global bond markets. Gold was little changed, oil fell and bitcoin resumed losses after gains overnight.”


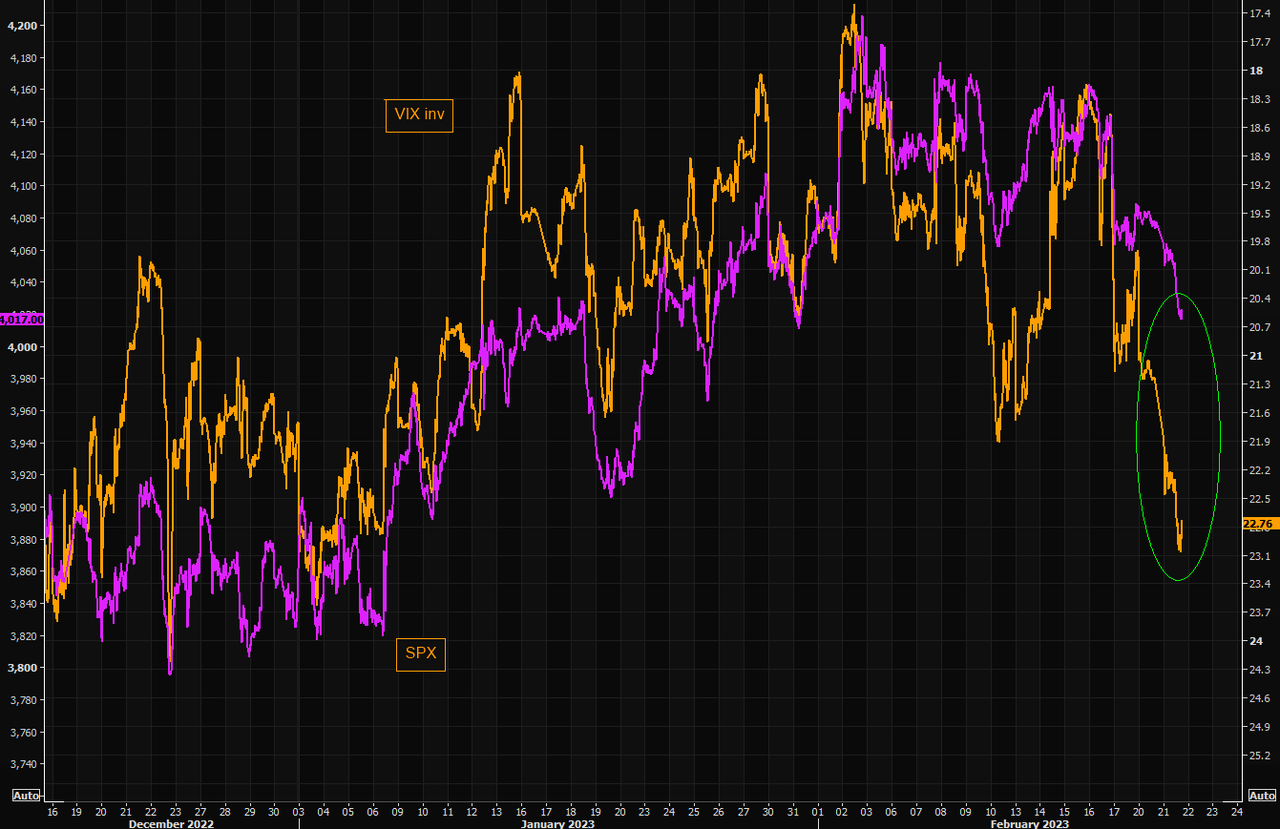
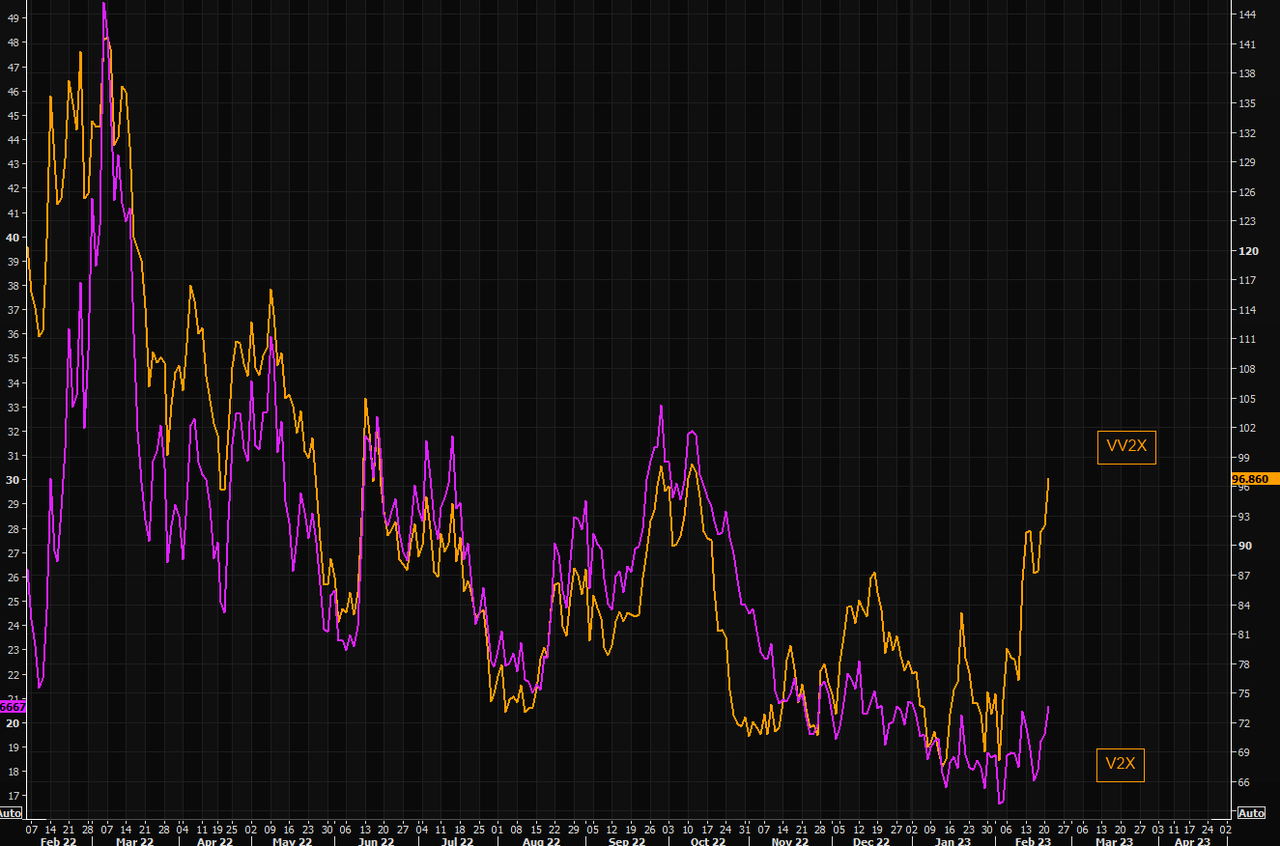
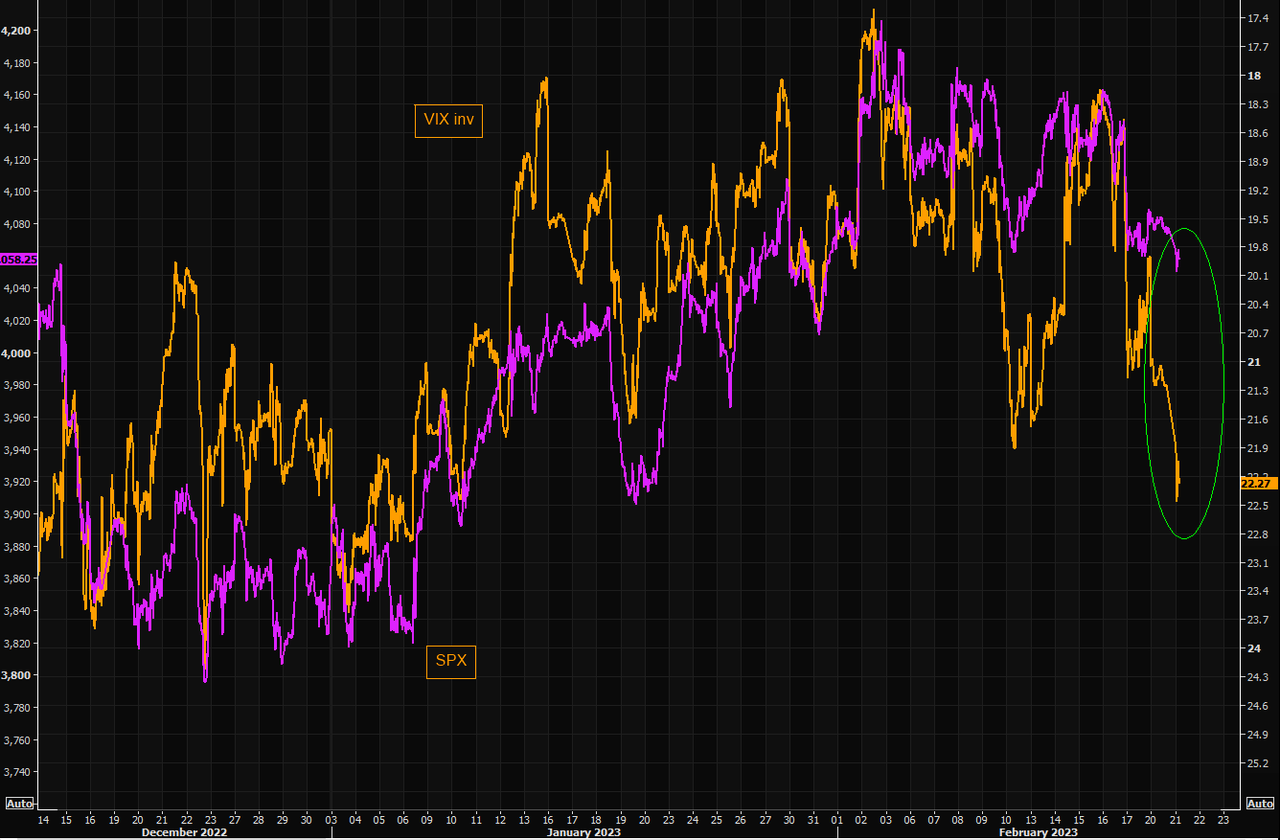
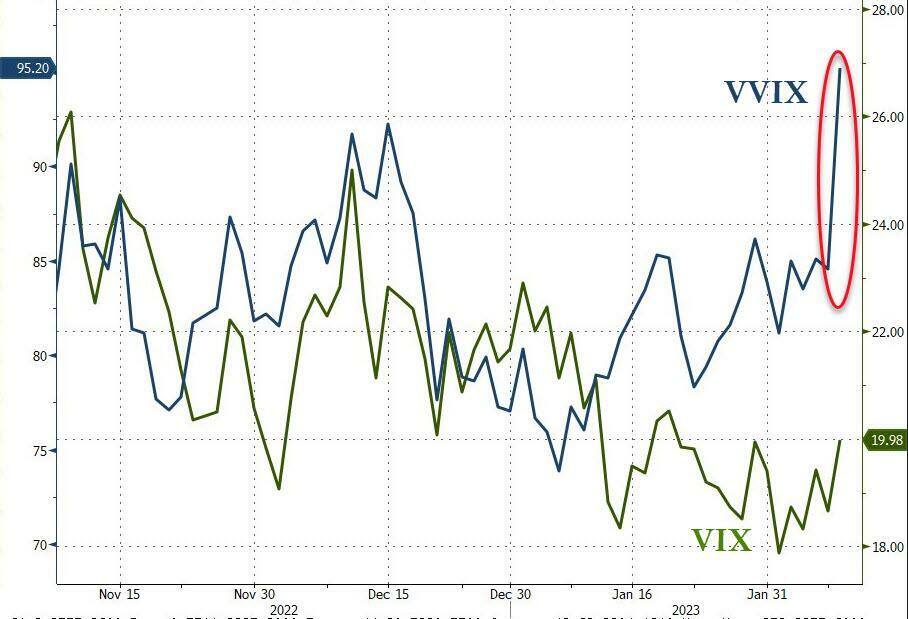
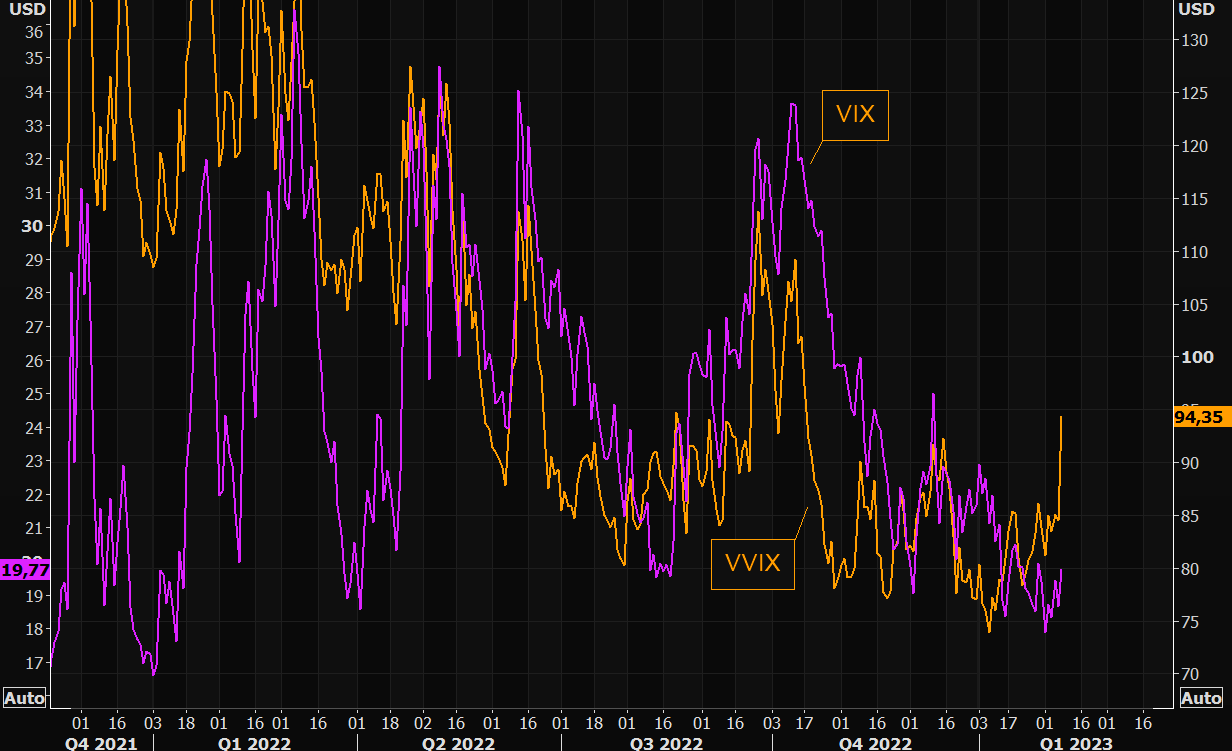
VIX futures are consolidating near the lower end of Friday’s trading range.  There is a strong likelihood of extending its pullback to the 50-day  at 20.53 or slightly lower today to 20.15, its 61,8% Fibonacci relationship.  That leaves another 4.3 to 6.45 market days for a panic spike higher.

Wednesday’s op-ex shows Max Pain at 23.00.  Short gamma is strong at 21.00 with over 11,000 contracts at that level.  Meanwhile long gamma kicks in at 25.00.  Next Tuesday’s op-ex (March 7) is early due to International Women’s Day on March 8.  Max Pain is also 23.00, but long gamma begins at 24.00.

MarketWatch remarks, “The stock market’s fear gauge jumped suddenly this week, with volatility returning to equities amid heightened concern the Federal Reserve may raise interest rates higher than investors had been expecting, according to DataTrek Research.

“Equity vol is back,” said Nicholas Colas, co-founder of DataTrek, in a note Wednesday. “We are back in ‘2022 mode’, where it pays to watch the VIX.”


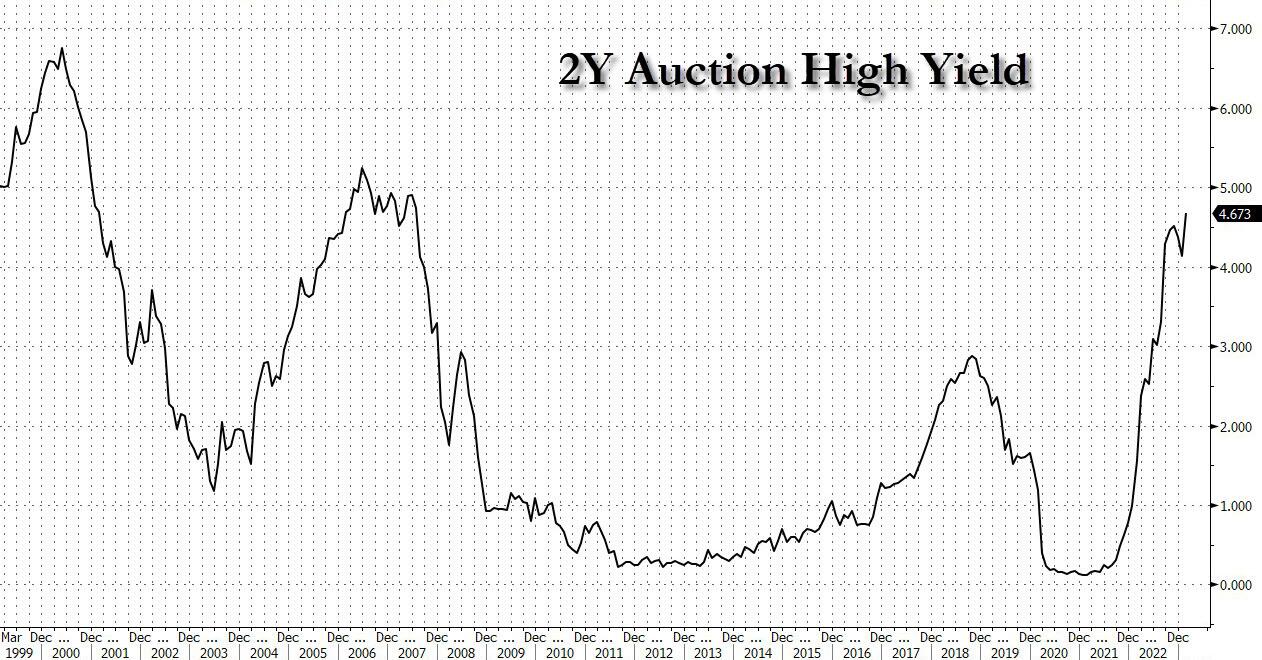
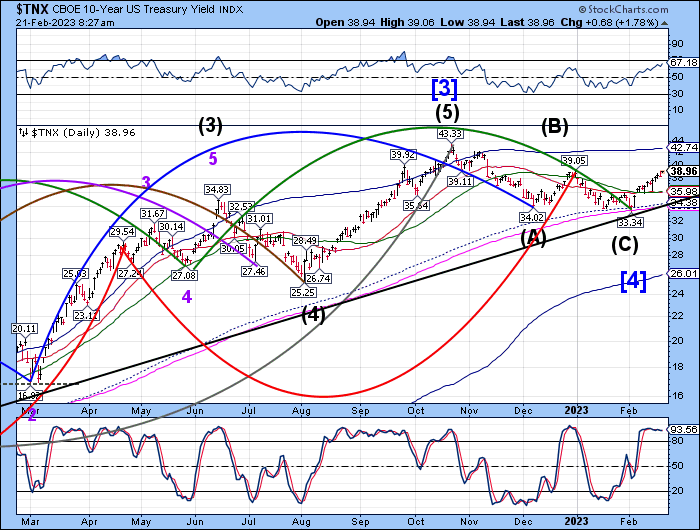
TNX has pulled back this morning to 39.04, but the Cycles Model suggests a possible spike in yields in the next 24 hours.  The Cycles Model suggests the trend may peak the week of March 20.  The following week may be chaotic, but it is not clear whether the uptrend extends or not.

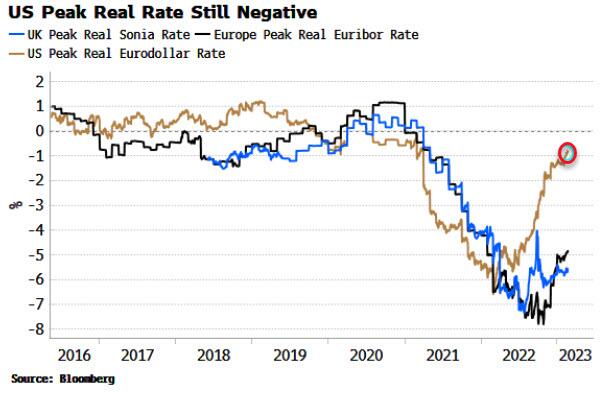
ZeroHedge observes, “Longer-term bond yields continue to reflect an environment where inflation eventually comes back to target, and are not adequately pricing the likelihood it remains elevated and unstable.

PCE deflator data for the US is released today and we will find out how intact the current disinflationary trend is.

The trend looks set to end sooner than expected, with global inflationary forces picking back up as China recovers, reinforcing already sticky domestic inflation. If bond holders start to demand more premium to reflect a higher-inflationary world, yields will rise.”


USD futures have pulled back, but still within Friday’s trading range.  Today is day 257 of the current Master Cycle, suggesting a high is in the making.  Today’s reading still shows strength, suggesting a final trip to mid-Cycle resistance or the 200-day near 106.59.The corrective phase of the new Cycle may test the 50-day Moving Average at 103.56 or Intermediate-term support at 102.8.  The behavior at that point may indicate a resumption of the rally through the end of April.


Posted in Published | 2 Comments

February 24, 2023

10:35 am

SPX is pausing near the late January low at 3949.06.  Should there be a significant bounce (at least to the 50-day Moving Average), this formation may be activated with a target date of March 1.

As an alternative, there is the possibility of a bounce nearer to the mid-January low at 3885.54.  The target for the lower Head & Shoulders would be 3575.00 after a bounce (again to the 50-day).  Since the H&S target may be a minimum, we could see the SPX at the October low by the end of next week.

Remember, these are simply speculations based on the sxtent of today’s decline.


8:45 am

Good Morning!

SPX futures dropped through the 50-day Moving Average at 3979.86, making  a morning low of 3958.00.  It may have broken through the descending trendline at 3965.00 and is likely to challenge the 200-day Moving Average at 3946.23.  The Cycles Model calls for another 3-5 days of decline to its next Master Cycle low.

Today’s op-ex shows short gamma beginning at 4000.00.  The longs have a toehold at 4005.00, but appear to be losing the battle for dominance.

ZeroHedge reports, “US index futures reversed Thursday’s rebound, and dropped as investors braced for data that may show accelerating inflation in the world’s largest economy. European stocks erased an earlier gain, while Asian equities fell on a quiet day for global markets. Contracts on the S&P 500 slipped 0.6% while those on the Nasdaq 100 fell 0.7% by 7:45a.m. ET. Friday sees the release of the personal consumption expenditures index, the Fed’s preferred price gauge, which is expected to show acceleration amid robust income and spending growth. The dollar rose amid concern over disappointing earnings and geopolitical tensions, and as the Yen tumbled after the confirmation hearing of Ueda’s proved to be far less hawkish than some expected.”


9:00 am

 ZeroHedge remarks, “A much hotter than expected Core PCE print has sparked a dramatic hawkish response across markets.

Expectations for The Fed’s terminal rate has spiked to 5.39% and H2 2023 rate-cut expectations have dwindled to single-digits (just 9bps priced in)…

Source: Bloomberg

The market is now fully pricing in 3 x 25bps rate-hikes at the next three FOMC meetings…”


VIX futures jumped to a high of 22.55, but short of the lower Triangle trendline.  VIX remains in flux whether the Master Cycle lo has already been made on February 15 (day 252) or may register a high sometime next week.

Wednesday’s op-ex shows Max Pain at 22.00.  While sort sentiment is weakening, long gamma kicks in at 25.00 and remains strong up to 42.50.


TNX may be consolidating after yesterday’s breakout.  The Cycles Model suggests the rally may continue to the week of March 20 with increased trending strength next week.

ZeroHedge remarks, ” The peak expected real Fed rate has risen but remains negative, while it remains considerably higher than peak real rates in the UK and Europe.

The Fed minutes on Wednesday underscored the bank’s intention to keep raising rates, with the market’s expectations of the peak Fed rate rising about 50 bps since the beginning of February.

However, this has still not been enough to take the peak real rate (based off CPI) to positive territory. Core PCE data just released for 4Q22, which was revised up to 4.3% from 3.9%, highlights the Fed’s challenge.

CPI fixing swaps see the real rate going positive in May, based on the implied rates from Fed Funds futures. But this assumes the Fed is able to hike as much as the market expects (55 bps across the next two meetings in March and May).”


USD futures are continuing to make new highs at 105.23 this morning.  However, the Master Cycle may come to an end by mid-week.  This is a puzzle, as TNX may continue its rally for another three weeks.  It is possible that aversion to the USD may increase due to political errors being made.


Posted in Published | 1 Comment

February 23, 2023

12:05 pm

SPX has crossed beneath the 50-day Moving Average at 3978.91 after bouncing from it yesterday.  There may be another 4.3 days of decline from this morning’s high.  Mark your calendars for March 1 for a probable low.  A possible alternate date for a low would be Friday, March 3.  Afterwards, there may be a two week retracement, so prepare for a short squeeze in early March.  I won’t be available to blog during that time, so use your discretion.

ZeroHedge warns, “Late last week, when we showcased the dramatic reversal of one of Goldman’s biggest (and most accurate) bulls into a (tactical) bear, pointing out what according to GS flow trader Scott Rubner was one of the top bearish factors for stocks, we noted that CTAs – which until recently were aggressive buyers of stocks – could very soon turn into (potentially very motivated) sellers as “CTA flows dynamics present asymmetrical risk to the downside” should the selling in stocks accelerate.

The reason for that is that both the Short-Term and (more important) Medium-Term pivots were about to be taken out if the drop in S&P futures extended below 4,000.”


11:50 am

BKX, our liquidity proxy, broke through Intermediate-term support at 109.94 yesterday, then bounced to retest that support/resistance line.  It is now heading lower supports between the 50-day at 106.51and mid-Cycle support at 105.55.  The Cycles Model shows a continued decline to the end of March, suggesting a total retracement to the October low.

ZeroHedge gives Martin Armstrong’s view, ” Armstrong explains, “They want a war, but they also need it because the monetary system is collapsing… “

“You have had interest rates at negative since 2014.  So, suddenly interest rates are rising.   Any bond owned by any institution in Europe is a loser.  They have lost so much money, it’s incredible.  What happens?  Nobody is interested in long term debt – period…

If you have interest rates rising, and rates are going to be going up because the Fed cannot stop this kind of inflation.  Then, you got war.  

You have untold billions of dollars being shipped into Ukraine which is absurd.  This is what you have…

You also have to look at what Janet Yellen said, and she was concerned with the tons of new debt coming out.  You are exceeding the balance sheets of the Primary Dealers.  To be a Primary dealer you have to be able to guarantee you will be able to buy X amount of debt.  If you can’t sell it, what happens?  The bank is stuck with the debt, and then, they go bust.  So, we have a real problem here.  They cannot continue to issue this kind of debt in perpetuity. 

They have been borrowing money since WWII with no intention of paying anything off… The Fed is independent, and they don’t want the long term debt.  They have been moving towards the short end of the curve.  How do you continue to fund a government if there are no buyers for the debt?  This is on a global scale.

So, war checks all the boxes?  Armstrong says, “Absolutely…””


7:30 am

Good Morning!

SPX futures bounced to 4015.90 as gamma weary dealers cashed out their short positions, settling at Max Pain.  The Cycles Model suggests another week of decline that is likely to land near the Cycle Bottom at 3610.39, taking out the December low and possibly lining up with the October low.

Today’s options chain show Maximum Pain at 4015.00, thus the overnight move to that level.  Long gamma begins at 4035.00-4050.00.  Short gamma begins strongly at 4010.00.

ZeroHedge reports, “US futures rebounded from yesterday’s post FOMC selloff, rising back over 4,000 as concern about aggressive monetary tightening eased and Nvidia soared 10% after giving a bullish revenue outlook. Contracts on the Nasdaq 100 were up 1% as of 7:45 a.m. ET while S&P 500 futures rose 0.4%. The underlying stock gauges closed mixed on Wednesday as minutes from the Federal Reserve’s latest meeting signaled its determination to keep hiking interest rates to combat inflation. The tech rally may be short-lived thought: treasuries edged lower again, reversing yesterday’s gains. The Bloomberg Dollar Spot Index recovered from earlier lows, pressuring most Group-of-10 currencies. Gold was little changed, while oil advanced. Bitcoin rose nearly 2% following two days of losses, before fading some of its gains.”


VIX futures probed the lower side of yesterday’s trading range, with a morning low of 21.74.  There is a likelihood of VIX challenging the 50-day Moving Average at 20.63, the 50% retracement level of the rise from the 18.11 bottom on February 15, which is shaping up to be the expected Master Cycle low.

Next Wednesday’s VIX options chain shows Max Pain at 22.00 with puts leading at 21.00 and lower.  Short gamma is in short supply while long gamma takes hold at 25.00.  There’s not a lot of hedging yet, but that may change by the weekend.


TNX may be having a running correction (higher highs and lows), suggesting the uptrend may resume with gusto by early next week.  The Cycles Model indicates the rally may continue through the week of March 20.

ZeroHedge reports, “Following yesterday’s mediocre at best 2Y auction, moments ago the Treasury sold $43 billion in 5Y notes in what was a solid auction.

The high yield of 4.109% was a nearly 50bps jump from last month’s 3.530% (thank you Jan NFP and retail sales seasonal adjustments), and the highest of the current tightening cycle with just two expections: the 4.228% in Sept 22 and 4.192% from Oct 22; separately, thanks to today sharp rally in across the curve, the auction tailed the When Issued 4.106% but just modestly, and would have likely stopped through if yields didn’t slide by 6bps today.

The bid to cover of 2.48 was below last month’s solid 2.64 (which was the highest since August 2020), but above the recent average of 2.42.”


USD futures are running higher to 104.63 this morning.  The Cycles Model indicates a possible burst of trending strength through the weekend, culminating in a probable Master Cycle high by mid-week.  The USD may become a safe haven for a possible panic in equities during the same period.


Posted in Published | 3 Comments

February 22, 2023

8:30 am

Good Morning!

SPX futures have made an anemic bounce to 4013.00, and have since receded.  The decline may continue, at least to test the 50-day Moving Average at 3977.20.  The downside momentum is still palpable, though it may wait until the FOMC announcement at 2:00 pm.  The Cycles Model suggests another week of decline, followed by a spirited bu choppy bounce perhaps lasting two weeks.

Today’s op-ex shows Max Pain at 4050.00, a level that is hotly contested by both puts and calls.  Long gamma reigns above 4100.00, while short gamma becomes strong at 4000.00.

ZeroHedge reports, “After suffering their biggest one-day drop of 2023, US futures rebounded in muted trading on Wednesday, boosted by a drop in rates (the 10Y just hit a session low of 3.92% after rising as high as 3.97%) and weakness in the dollar, even as investors awaited further clues on the direction of monetary policy from the Federal Reserve’s minutes due out at 2pm today. S&P 500 and Nasdaq futures rose 0.3% and 0.4%, respectively, at 7:45am ET; sentiment was boosted by a CNBC appearance of the Fed’s “trial balloon” speaker, St Louis Fed president James Bullard, who was hawkish – saying he favors hiking rates to 5.375% as fast as possible, but not as hawkish as some had feared, leading to a sharp bounce in futures just after 7am. Yields dropped, as did the dollar, while oil, gold and crypto erased earlier losses.”


VIX futures are consolidating above the lower Triangle trendline near 23.00.  There is a debate whether last Thursday’s low on day 252 was an actual Master Cycle low.  The outcome of the debate may become clearer in the next week.  In the meantime, trending strength is accelerating over the same period.

Today’s op-ex shows Max Pain at 22.00.  Short gamma begins at 20.00, while long gamma erupts at 23.00, with strength extending to 40.00.  There is no guarantee, but a hawkish Fed may push the VIX above its Cycle Top at 32.28.

ZeroHedge observes, “What price are you paying to panic

On February 2, VIX low this year, we outlined our logic on hedges/downside speculation in our thematic email “” (premium subs only, sign up ).

Vols have exploded since then and we are seeing early signs of panic in terms of pricing volatility. Most people tend to overpay for protection when things get “dynamic” to the downside as they only think about direction, but you need to consider what you are paying (implicitly) to “panic”? Make sure you don’t confuse direction with pace…Time for a thread on volatility:

1% move = 16% volatility

A 1% move in the underlying can be “translated” into a 16% implied volatility for that maturity. We are currently pricing the 1 month SPX atm around 21-22% implied volatility. That means the options market is pricing that SPX will be moving around 1.4% daily until expiration.

VIX – the new “dog”

The VIX (inverted) vs SPX gap has continued to widen as people decided that loading up on protection is a must.”


TNX appears to be consolidating after yesterday’s strong advance.  A hawkish Fed may propel TNX to its Cycle Top at 42.79, despite being overbought.  In any case, trending strength picks up next week, making a new high more probable.  The Cycles Model calls for 4 more weeks of potential rally before the trend takes a rest.

ZeroHedge comments, “The yield curve is indicating a US recession could begin as early as June. The likely rapidity of its onset means the Fed will have to loosen policy sooner and by more than the market is currently pricing.

Recessions have gone out of fashion, with fears one will hit in the next year down sharply, according to BofA’s Global Fund Manager Survey. But the sugar high of some recent, rosy economic prints is not yet enough to derail the weight of evidence pointing the other way.”

ZeroHedge reports, “After two months of declines, in February the high yield on the 2Y auction exploded higher, and in the Treasury’s sale of $42 billion in 2Y paper completed moments ago, the US had to pay interest of 4.673%, up from 4.152%, and tailing the When Issued 4.670% by 0.3bps. The yield was also the highest going back to July 2007.

Amusingly, at the exact same time, today’s 52-Week Bill auction also closed. Its yield: 4.795%, so yes – the curve is now inverted at that 1Y-2Y kink. ”


USD futures are resting above the 50-day Moving Average at 103.28 with a possible retest of that support today.  The Cycles Model anticipates a potentially explosive move higher into the end of the month.  The declining Wedge offers the potential of a complete retracement.


Gold futures are consolidating above the 50-day Moving Average at 1829.30.  While gold is on a confirmed sell signal, tha signal may be strengthened beneath the 50-day.  The Cycles Model anticipates another 7 weeks of decline before this new trend gets a rest.  The narrow trading bands imply a move strong enough to crash through the Lip of the Cup with Handle formation.

ZeroHedge opines, “By owning gold, investors are not necessarily hedging against a government default but ironically betting the Fed will increasingly misuse monetary policy to help the government avoid defaulting. That may not be the exact thesis gold investors signed up for, but there is ample evidence linking gold prices to Fed behaviors, as we will share.

Financial Mismanagement

Since 2008 government debt has risen twice as much as GDP, as shown in the first graph below. Individual and corporate debt have followed suit. The second graph below shows over $70 trillion of all debt in the U.S. economy, above and beyond annual GDP. That does not include the present value of future obligations, such as social security, which some budget experts argue can easily double the Treasury’s debt load. ”


Crude oil futures made a new low at 73.97 this morning, confirming the decline /sell signal.  The Cycles Model suggests the current Master Cycle may wind up early next week.  A new low, especially beneath the trendline at 72.00, may inform us whether the decline may continue or not.


Posted in Published | Comments Off on February 22, 2023

February 21, 2023

12:21 pm

SPX has crossed Intermediate-term support at 4023.95, confirming the sell signal.  The 50-day Moving Average lies at 3976.59.  So far, no bounce is taking back the loss.  Should the decline continue, a bounce may occur either at the 50-day or the descending trendline at 3965.00 (on the daily chart).  SPX is solidly in short gamma territory.

ZeroHedge comments, “Nomura’s Charlie McElligott notes that the ongoing stop-out of legacy ‘imminent recession’ trades” continues, perversely thanks to the resumption of the Global Bond selloff on “higher for longer” risk due to better global growth data with many of the most popular “everything rally” trades seen in January have now experience a “round-trip” over the past two weeks and reversed much of their prior YTD moves… with the broad exception of Equities, although they too are now beginning to show “cracks” there too…”


7:45 am

Good Morning!

Not much has taken place since my last post.  Next week I begin a longer absence as I embark on a three week road tour on a different topic altogether.  Hopefully my next absence will be as uneventful as this one.

NDX futures are testing their February 10 low at 12204.20 with a morning low at 12194.90 thus far.  Retail investors are still packing it in (long) as their dreams of a soft landing are crumbling.   The Cycles Model anticipates a test of multiple critical supports just beneath 11900.00.

The NDX options chain shows long options have dwindled dramatically since last Friday’s op-ex.  Short gamma begins at 12350.00.

ZeroHedge observes, “For much of the waning days of 2022, the broader theme in markets was a downbeat one, especially for one group of habitual gamblers investors: after a stellar 2021 when nothing made sense and the junkiest of companies exploded higher steamrolling shorts, for retail investors 2022 felt like the polar opposite: a relentless series of gut punches which knocked the air out of basement dwelling daytraders and crushed some of the most popular retail names.”


SPX futures are testing short gamma at 4075.00 this morning while aiming at critical support near 4000.00, making a low at 4048.00 thus far.  The Cycles Model suggests the decline may begin in earnest once 4050.00 is decisively broken, making a new low in less than 2 weeks.

Today’s op-ex shows Maximum pain for options investors at 4085.00.  Long gamma dwells above 4100.00, while short gamma emerges at 4075 with short convictions growing beneath 4050.00.

ZeroHedge reports, ” US stock futures fell for the second day amid deepening geopolitical tensions, and as investors awaited data this week that may show stickier core inflation, prompting expectations for more rate hikes by the Federal Reserve. Futures contracts on the S&P 500 dropped 0.7%, while those on the Nasdaq 100 were down 0.9% as of 7:45 a.m. in New York, after the cash market was closed on Monday for a public holiday. Treasury yields jumped, with the 10Y rising as high as 3.89%, while the Bloomberg Dollar Spot Index retreated from the day’s highs, and the pound led gains among Group-of-10 currencies after UK companies reported surprise growth in output.”


VIX futures have risen to a morning high at 22.54, testing the lower Triangle trendline.  VIX is on a buy signal , even as it made a strong pullback last week.  There is a risk of testing last week’s low before moving higher.  If so, the ensuing rally in VIX may extend until the end of April.

ZeroHedge remarks, “Seen this volatility “panic”?

The SX5E has it´s own “VVIX” (vol of vol) as well, the VV2X. The move higher over the past 2 weeks is huge. The V2X crowd has been late, but has woken up now.

Source: Refinitiv

Not so “happy” VIX

VIX hasn’t traded here since January 10. Back then SPX was around 3900. Volatility doesn’t “work that way”, but the exuberant VIX is long gone.”


ZeroHedge observes that not all analysis on the VIX agrees, “The rapid rise in 0DTE (zero days to expiry) option trading means that traditional measures of risk such as the VIX are understating the true extent of underlying market instabilities.

Longer-dated implied volatility is relatively low and has remained subdued.

But this should not be taken as an indication that underlying risks in the market are low.”


TNX may have made a new high at 39.06, beating the December 30 high at 39.05.  The Cycles Model shows a strengthening trend beginning this week and extending through the week of March 20.  While investors look at the strengthening economy, smart money knows the price of war is higher interest rates.

ZeroHedge remarks, “Investors now expect the major central banks to raise rates much more than they were just at the start of this month. They are still underpricing the risk of how much more tightening is to come.

The Federal Reserve may raise interest rates as high as 6%, the European Central Bank to 4% and the Bank of England to possibly 5% should the global economy continue to be resilient and inflation run rife.”


USD futures are consolidating inside last Friday’s trading range.  The Cycles Model shows another week of potential rally that may challenge the 200-day Moving Average at 106.30 or the mid-Cycle resistance at 106.53 before a correction or pullback.  An alternate view may show USD pulling back early, with the Triangle trendline near 102.00 as a target.  If so, look for a break of the 50-day at 103.30 for a further pullback.


Crude oil futures have bounced to test resistance at the 50-day Moving Average at 77.24.  Once accomplished, we may see crude tumble to the Broadening Wedge trendline near 72.00.  Should it break through, we may see a further decline to the Wedge’s target.


Posted in Published | 1 Comment

February 13, 2023

9:45 am

Good Morning!

Tis is just a brief summary of what you may expect over the next week.  The options market seems to dictate price action, which is wedged between 4150.00 and 4050.00.  The current action suggests the upper range may be tested over the next two days, until VIX monthly op-ex on Wednesday.  However, a break beneath 4050.00 may set off a waterfall event.  The current Master Cycle is due for a probable low at the end of the month.  Short positions should e maintained for the duration.  The minimum downside target appears to be the December low.  the more likely event is a decline to the October low.

Today’s options chain shows 4100.00 being hotly contested by both sides.  Long gamma rules above 4125.00-4150.00.  Short gamma starts at 4050.00.

ZeroHedge reports, “US index futures reversed an earlier drop and traded near session highs as traders braced for inflation data that will may support the Fed’s commitment to further policy tightening (or it may not), and as the world was transfixed by a global UFO hullaballoo(n). S&P 500 futures were up 0.3% at 8:00am ET while Nasdaq 100 futures rose 0.6% after the underlying index suffered its first weekly loss of 2023. European stocks rose to trade near session highs, lifted by construction, industrial goods and consumer stocks while energy and real estate underperformed. The dollar pushed higher, Treasuries were little changed and oil slipped after Friday’s jump; bitcoin slumped.”


VIX is consolidating above the 50-day Moving Average at 20.73.  It rose above the 50-day On Friday, giving a buy signal.

Wednesday’s options chain shows Maximum Pain at 21.00.  Short gamma starts at 20.00 while long gamma begins at 22.00.  Long conviction is high up to 80.00 with 189,244 contracts at that strike.  There is no assurance that VIX may reach that level.  However, long gamma exerts a “pull” on the dealers to cover those positions as VIX moves higher.


TNX made a new high this morning, but now appears to be consolidating.  The Cycles Model suggests a steady climb with retests of support to the week of March 20.  The Cycle top may be the intended target for this phase of the Cycle.


Posted in Published | 3 Comments

February 10, 2023

7:45 am 

Please Note:  I am leaving for a week-long vacation on Monday, February 13.  I will be returning late on February 20.  I may not be capable of writing in my blog during that period of time.  Good luck and good trading!

SPX futures have declined to 4051.20 thus far this morning, moving into short gamma.  The support/resistance of the descending trendline may be today’s target near 3990.00.  Beneath that, the aggressive sell signal changes to confirmed.    Should that line be breached, SPX may suffer the potential of giving up all its gains made in January over he next three days.  Furthermore, Wave (C) may be a broadening formation, suggesting a likely decline to 3450.00 by the end of the month.

Today’s options chain shows Maximum Pain for options investors at 4095.00  Long gamma begins at 4125.00 while short gamma starts at 4075.00.

ZeroHedge reports, “Global markets dropped, US futures extended their slump into a third day and the Nasdaq 100 was on course for its first weekly loss of 2023, while Treasuries extended a selloff as wagers for more hawkish monetary policy mounted. Oil rose after Russia said it will cut output. Nasdaq futures were down 1.1% by 730 a.m. ET after the tech-heavy index lost 0.9% during the previous session, bringing this week’s declines to 1.5%. Nasdaq futs have broken below the support level of the rising channel since the start of the year.

The tech benchmark is still up over 13% year-to-date, but expectations of interest rates staying higher for longer – at least for a few more days – after a blowout US payrolls report and concerns about inflation pressures are weighing on sentiment. Investors will be closely watching the US inflation report next Tuesday for clues on the Fed’s monetary policy outlook.

S&P futures were also down, off by 0.6% and trading near session lows, and at the lowest level since the Golden Cross earlier this week. Treasury yields held gains across the curve after investors inverted the TSY yield curve by the most since the early 1980s, a sign of flagging confidence in the economy’s ability to withstand additional Federal Reserve hikes. The dollar reversed earlier losses when the yen surged after a report that Japan’s Prime Minister Fumio Kishida had picked the hawkish Kazuo Ueda as the next head of the BOJ.


VIX futures rose to a new high at 21.94 this morning.  The move has exceeded the 50-day Moving Average at 20.79 and created a confirmed buy signal.  The next target for this rally may be the mid-Cycle resistance at 24.71.  However, should a panic occur, The Cycle Top at 32.81 may be the alternate target by next week.

In Wednesday’s op-ex, Maximum Pain for options investors is at 22.00.  Short gamma starts at 21.00, while long gamma begins at 23.00.  Long convictions are rising, with 189,244 call contracts at the 80.00 strike.

ZeroHedge reports, “With both BofA’s Michael Hartnett (last week) and Goldman’s biggest FICC bull, Scott Rubner (this morning as pro subs know already, and we will have more on this in a subsequent post) now calling for a mid-February peak in risk assets and predicting a slide in stocks following the CPI report, sentiment appears to be shifting and as our friends and derivative gurus over at SpotGamma discuss this morning, they have “received a large number of inquires into two, linked points”: first, the spike in the VVIX which we first discussed yesterday (this takes place as the VIX lifted back up to around 20 as options traders begin to price in event risk around next week’s CPI print)…

… and second, the Large 25k ES 2/17 4050 put buyer (who according to some unconfirmed twitter reports may be Carl Icahn, although there is zero evidence of this). That said, there has been only a change of 18k OI at that strike for today.”


TNX futures have risen to a new high at 37.17, while the cash market has yet to catch up.  Today begins a period of strength that may last through the weekend.  The new Master Cycle continues through mid-March, so not only might there be fireworks starting today, but it may continue for another month or more.

ZeroHedge reports, “After a horrific 3Y auction, and a stellar, record-demand 10Y auction all in the span of just two days, moments ago the Treasury concluded the refunding week with the sale of 30Y paper. Some expected yesterday’s solid demand to continue while others were worried that we may see a reversal and demand would tumble. Well, the latter group was spot on because today’s 30Y auction was almost as ugly as the 3Y earlier this week.

Let’s start at the top: the auction stopped at a high yield of 3.686%, which was above last month’s 3.585% and the highest since November. More importantly, the yield tailed then When Issued 3.654% by 3.2bps, the biggest tail since Nov 2021’s 5.2bps tail, and the third highest on record (going back to 2016).”


USD futures are consolidating inside yesterday’s trading range.  Today may see a retracement back to the trendline at 101.80, but the pullback may not last.  The Cycles MOdel does not show rising strength until the end of the month.  However, rising yields may pull the USD along for the ride.


Posted in Published | 2 Comments

February 9, 2023

11:58 am

SPX declined from its spike high at the open, as indicated earlier.  Despite the Cycle Top on February 2, the trend still appears to be “higher.”  Short gamma appears in the options chain at 4050.00, in line with the Broadening Wedge trendline and Short-term support.  Retail investors are still buying the dips until a breakdown occurs.  Be patient…

ZeroHedge remarks, “An increasing number of investors are buying any dip they can, convinced that a more dovish turn from central banks is just around the corner against the comforting backdrop of a soft landing for the economy. But at the same time, they’re bulking up on hedges, just in case.

All eyes were on Fed Chair Jerome Powell this week as he cautioned that rates may move higher than previously expected, given the strength of the job market. Suffice to say, any weakness in stock futures prompted by his warning was bought on both sides of the Atlantic.

According to Barclays strategist Emmanuel Cau, a pattern of short covering by hedge funds and systematic strategies adding equity exposure is now “well advanced.” But long-only funds that missed out on recent gains are still defensively positioned and may be tempted to make up ground by capitalizing on any declines, he says.”


10:27 am

BKX behavior has the appearance of “all is good.”  However, the 12.9 month Cycle high has been made on February 2 with the Cycles Model proposing an imminent 2-month decline.  The Fed is shrinking the money supply with interest rates rising and tightening credit sure to slow down the economy.  While the US economy slows, it is virtually collapsing in Europe. European banks may be hit first, with US banks to follow.  The problem may be moving from “over there” to “over here.”

ZeroHedge reports, “The better-than-expected non-farm payroll report for January along with the smaller interest rate hike delivered by the Federal Reserve at its February meeting increased optimism that the central bank can bring price inflation back to 2% without tanking the economy. But the shrinking money supply undercuts this soft landing narrative.

While Fed rate hikes and balance sheet reductions aren’t likely big enough to permanently take down inflation, they are shrinking the money supply and that generally means a recession is looming.

Money supply growth went negative for the first time in 28 years in November and fell again in December.”

This morning, ZeroHedge comments, “Back in late 2022, when Credit Suisse stock cratered to never before seen levels after a series of dismal earnings reports and regulatory “missteps” sparked a staggering bank run, amounting to some $88 billion forcing the bank to seek emergency liquidity from the Fed via SNB swap lines, and which also led to a historic corporate restructuring which included the de facto closure of the bank’s investment bank coupled with mass layoffs and bonus cuts, many thought that would be as bad as it gets as the (rapidly changing) management had finally thrown out the kitchen sink.

Boy, were they wrong.

On Thursday, Credit Suisse shares tumbled as much as 12%, after the Swiss bank unexpectedly posted a bigger-than-expected loss for the fourth quarter and even more unprecedented client outflows, exacerbating the difficulty for new CEO Ulrich Koerner in returning to profitability by next year. ”


8:30 am

Good Morning!

SPX futures rose to an overnight high of 4159.50,above the 61.8% retracement value at 4151.77.   This may have been due to not testing support yesterday at 4100.00 and the hold that the dealers have on the options market.  The Cycles Model suggests a turn lower may ensue in the first hour of trading.  Despite the bullish sentiment by the hedge funds and dealers, the Cycles must be obeyed.

Today’s options chain shows Maximum Pain for options investors at 4090.00.  4100.00 is a hotly contested strike with long gamma at 4150.00 and short gamma at 4050.00.  Sentiment is gaining on the short side.  This morning’s spike high may be an effort to keep  SPX in long gamma.

ZeroHedge reports, “US stocks were set to rebound following Wednesday’s slide, after Walt Disney announced it would fire 7,000 sending its stock surging (alongside mediocre earnings) as investors assessed corporate earnings reports and awaited the latest US jobless claims data. Contracts on the Nasdaq 100 were up 1.1% at 7:30 a.m. ET while S&P 500 futures added 0.8%. Both underlying indexes slumped more than 1% on Wednesday following a barrage of hawkish commentary by Fed officials. European stocks also advanced after positive earnings updates from heavyweights Siemens and AstraZeneca, although a stinker from Credit Suisse soured the mood. Asia was also solidly in the green. The dollar slid, Treasuries edged higher after a strong rally yesterday and an index of commodities rose.”


VIX futures consolidated between 19.05 and 19.63 in the overnight market. It may test Tuesday’s lower range near 18.40 before reversing higher today.  Te Cycles Model suggests a rally in the making to be confirmed by a rise above the 50-day Moving Average at 20.78.

ZeroHedge observes, “VVIX exploding higher

VIX of VIX is exploding higher. The crowd is loading up on VIX options. Do we see VIX catching up soon?

Source: Refinitiv

VIX volatility structure shifting higher

The entire curve is shifting higher as the crowd is back to chasing hedges. Note the shift is most notable in the short end of the curve, where the biggest “juice” is to be found.

Source: vixcentral


TNX is testing the 50-day Moving Average at 35.84 this morning.  The 38.2% retracement value is at 35.57 and the 50% retracement is at 35.15.  The retracement may be short-lived, as trending strength may come roaring back tomorrow and over the weekend.


USD futures are in a pullback, testing the upper trendline of the declining Wedge formation near 102.00.  The uptrend may resume next week.


After a brief foray above the 50-day Moving Average at 77.25, crude oil may drop below it today.  This may resume the sell signal.  Next week trending strength returns with a vengeance, propelling crude oil to possible new lows.  The Broadening Wedge trendline is at 71.00.  A panic decline lies beneath it.

OilPrice.com reports, “Each of the world’s biggest oil and gas majors reported record profits for 2022 in the past week, doubling their combined net earnings from 2021 and booking the best-ever year for Big Oil.

Combined, the net profits of Exxon, Chevron, BP, Shell, Equinor, and TotalEnergies surged to $219 billion for 2022, up from around $100 billion booked for 2021, as oil and gas prices surged following the Russian invasion of Ukraine and majors raised oil and gas production to meet growing demand for oil and limited gas supply from Russia to Europe.

Most majors also raised their shareholder distributions, including by increasing dividends and buybacks, much to the resentment of the White House and other governments, while households struggled with energy bills. The UK and the EU already slapped windfall taxes on the industry in 2022, while U.S. President Joe Biden said in his State of the Union address that share repurchase taxes should be quadrupled to punish Big Oil for their “outrageous” profits.”


Gold futures are consolidating after a nasty 5% drop from its February 2 high.  The message from the Cycles Model is that today may be a day of unusual strength…Should gold decline beneath Intermediate-term support at 1883.00, the strength may be in a decline.  Above that level, a short squeeze may develop, taking gold back near the Cycle Top at 1937.18.  Either way, gold remains on a sell signal through the end of March.


Posted in Published | Comments Off on February 9, 2023

February 8, 2023

2:25 pm

SPX appears to be declining to 4100.00 or possibly deeper, then a probable bounce back to 4130.00 to 4138.00.


1:25 pm

BKX, our liquidity proxy, has been lingering near its Cycle Top resistance at 115.77 for a week.  I have been warning that a panic in the bond market may devastate the banks.  Not only will their holdings in loans and bonds decline in value (assuming their payments are timely), but the dealer banks must buy what is not purchased by other institutions in the Treasury auctions.  We saw an aversion to the 3-year Treasury notes yesterday.   The next few auctions may show the true demand for the Treasury auctions, thereby overwhelming the capacity of the dealer banks to absorb the spillover.  In conjunction with that, the new Master Cycle may face a decline in BKX lasting up to 2 months.  This has the earmarks of a probable panic.

Note:  The 10-year Treasury auction was a success.  That in no way minimizes the warning.

ZeroHedge notes, “The better-than-expected non-farm payroll report for January along with the smaller interest rate hike delivered by the Federal Reserve at its February meeting increased optimism that the central bank can bring price inflation back to 2% without tanking the economy. But the shrinking money supply undercuts this soft landing narrative.

While Fed rate hikes and balance sheet reductions aren’t likely big enough to permanently take down inflation, they are shrinking the money supply and that generally means a recession is looming.

Money supply growth went negative for the first time in 28 years in November and fell again in December.”


11:11 am

The Ag Index completed its Master Cycle on January 31, in line with the high inequities.  The new master Cycle extends to early April and is twice as long as the new equities Cycle.  While Equites may be entering a panic phase it is uncertain whether the Ag Index may fully participate or only partially so.  I am looking for a decline down to the 50-day Moving Average at 460.10.  Should that level hold, the Cycle may rally for the duration, instead.  Stay tuned for further developments.

ZeroHedge remarks, “The worst case scenario that many of the experts feared is starting to play out right in front of our eyes.  Throughout 2022, I repeatedly warned my regular readers that there were all sorts of indications that the emerging global food crisis would go to entirely new level in 2023, and that is precisely what is happening.  In response to tightening supplies of food, prices are surging all over the planet and the number of desperately hungry people is exploding.  Unfortunately, this crisis is not going to be just temporary.  As I will explain at the end of this article, the global nightmare that we are facing is inevitably going to intensify in the years ahead.

Most of us in the western world simply do not understand how badly conditions have already deteriorated in much of the world.”


8:20 am

Good Morning!

SPX futures have declined to a morning low of 4142.90, in line with options Max Pain at 4145.00.  A hourly Cycle may have completed at the close leaving the probability of a further decline on the table.  Yesterday’s spike high failed to overcome The February 2 Master and Primary Cycle high.  I was asked what the catalyst for this and my answer is simply “exhaustion.”  The 50% retracement of last year’s entire decline is 4142.03.  Each Fibonacci level (38.2%, 50% and 61.8%) offer a progressively higher level of resistance.  In this case, the Cycles completed the time element as well, leaving no further energy for the rally.  The tide has turned and now we look at supports which lie below.  The two main levels of support lie at the December low at 3764.49 and the October low at 3491.58.  The Model suggests one of those two supports may be hit by monthly options expiration on February 17, where the Model suggests the decline may accelerate.

Today’s options chain shows Maximum pain for options investors at 4135.00.  Long gamma may begin at 4150.00, while short gamma begins at 4100.00.  Retail buyers appear to remain on the long side, but there are some large short positions down to 3960.00 and possibly lower.  Next Friday’s (Feb 17) op-ex shows huge “collar” positions every 50 points all the way down to 4000.00 as a possible attempt (by dealers) to control the decline.

ZeroHedge reports, “US futures dipped after Tuesday’s furious last hour reversal rally sparked by Powell’s “disinflation” commentary which refrained from pushing back against investor optimism, even as stocks in Europe and Asia were still buoyant, with the FTSE 100 posting a new record high. S&P 500 eminis slipped 0.4% at 7:45 a.m. while Nasdaq futures were 0.2% lower. The underlying benchmarks jumped 1.3% and 2.1%, respectively, in the latest session as investors brushed off Fed chief Jerome Powell’s comments that borrowing costs may need to peak higher than previously expected, choosing to focus instead on his outlook that 2023 will be a year of significant declines in inflation. The dollar slid,  Treasuries reversed some of Tuesday’s losses, and an index of commodities rose a second day.”


VIX futures have consolidated within yesterday’s trading range and are treading above the close.  The Cycles Model infers the rally may continue through the end of February. While VIX may be on an aggressive buy signal, confirmation comes on a rise above the 50-day Moving Average at 24.80.


TNX is pulling back from yesterday’s new high and may be declining for a retest of the 50-day Moving Average at 35.89.  That may be only a short term move, since the Cycles Model shows a strong trending strength pattern forming by this weekend.

ZeroHedge reports, “One month ago, when commenting on January’s 3Y auction, we said that it could “only be described as an absolute whopper” with record foreign bidder demand and “blowout” metrics including record indirects and a record stop through. Today’s 3Y auction was an absolute mirror image, with the auction about as horrific as they come.

The high yield of 4.073% was not only well above last month’s 3.977%, but also stopped through the When Issued 4.033% by a 4bps which was a record in our data set which goes back to 2016. More remarkably, it was the polar opposite of last month when the 3Y was also a record, only in the other, stop through direction!”


USD futures are declining to the bottom of yesterday’s trading range this morning.  The most likely outcome may be a retest of the Declining Wedge trendline near 102.00.  The Cycles Model shows a possible low by the weekend, with a resumption of the rally next week on growing strength.  A buy signal is confirmed above the 50-day Moving Average, currently at 103.68.


WTIC futures are challenging the 50-day Moving Average at 77.30 this morning.  A close back beneath that level indicates the decline may resume.  The Cycles Model suggests a possible new low by the end of February while the strength of the decline beginning to accelerate by early next week.  The consequences of a break of the trendline near 72.00 are enormous.

ZeroHedge comments, “Oil prices soared today after reassuring comments from Fed Chair Powell built on growing confidence in China’s reopening (as Aramco increased its selling prices for shipments to Asia) and that was all helped by a weaker dollar. Additionally, the devastating earthquake on Monday that left thousands dead in Turkey and Syria also led to a halt in operations at Turkey’s Ceyhan oil export terminal, with has a capacity of 1 million barrels a day.

“In the grand scheme, essentially you have contrasting forces of rising inventories and a bullish outlook on demand,” said Daniel Ghali, a commodity strategist at TD Securities.

The last few weeks have seen some rather shocking series of inventory builds across crude and the products – not exactly reassuring for the demand picture (even if some of it was affected by the nationwide deep freeze).”


Gold futures are consolidating this morning inside yesterday’s trading range just above Intermediate-term support at 1880.00.  The Cycles Model urges caution for the longs, as trending strength resumes on Thursday after Tuesday’s Master Cycle high.  Gold is on an aggressive sell to be confirmed beneath Intermediate-term support and the 50-day Moving Average at 1847.48.  The new Master Cycle suggests the decline may continue through the end of February with a possible extension through early April.  Unfortunately, most commentary only shows what has already happened, assuming it may continue.  Remember, past performance is no guarantee of future results.

Zerohedge observes, “Central banks closed out 2022 with reported net purchases of 28 tons of gold in December. Including large unreported purchases, this brought total central bank gold buying in 2022 to 1,136 tons. It was the second-highest level of net purchases on record dating back to 1950, and the 13th straight year of net central bank gold purchases.

China officially started buying gold again in November and made another large purchase of 30 tons in December. That raised China’s total gold reserves to over 2,000 tons for the first time.”


Posted in Published | 2 Comments

February 7, 2023

3:05 pm

Crude oil rose to 77.34, testing the50-day Moving Average.  It remains on a sell signal.  The Cycles Model suggests the decline may resume through the end of February.

ZeroHedge remarks, “My big trade has been long commodities, short treasuries. Part of this was driven by political change, which continues to be supportive. Another part of this trade was assuming that we would follow a typical commodity cycle.

In a typical commodity cycle high prices attract capital and increased activity, this cause prices to fall and activity to fall as capital leaves, and then leaving a set up for higher prices again. In the energy space, and particularly natural gas, only the US has really seen a huge increase in activity, but even here we saw signs of capital discipline beginning to emerge. In 2019 purchase of Anadarko by Occidental was very bullish in my mind, as it further consolidate the all important Permian region. The idea is that a consolidated market would lead to more capex discipline.


1:40 pm

SPX spiked up to Cycle Top resistance, then plummeted to a new low.  Powell’s comments were not what the market wanted to hear.  This may finally tamp down the bullish impulse.  The next three weeks may see new lows in the SPX.

ZeroHedge comments, “Hawkish… but not hawkish enough…

That’s the initial message the market heard from Fed Chair Powell.

He confirmed his message from the post-FOMC presser message that disinflation has barely begun and there’s still a long way to go.and that “financial conditions have tightened.”

“Financial conditions are more well-aligned with that than they were before.”

He also reiterated that more rate hikes are likely to be needed.

“This process is likely to take quite a bit of time,” Powell says. It’s not going to be smooth.”


8:00 am

Good Morning!

SPX futures traded in a very narrow band as the market awaits Powell’s press conference.  Powell is given too much credit, as circumstances do not allow him to ease on rates.  Remember, the Fed has always raised or lowered rates only after the market had already changed since 1949.  It is clearly in the records which are ignored.  The Cycles Model infers a decline in equities through the end of February.  The 50-day Moving Average has risen to 3960.00, where the current aggressive sell signal is confirmed.

Today’s op-ex shows maximum pain for options investors at 4085.00.   Long gamma starts at 4125.00, while sort gamma begins at 4050.00.

ZeroHedge reports, “US equity futures rose, led by Nasdaq 100 contracts, setting up the tech-heavy index for a rebound as investors brace for Powell 2nd press conference in less than a week, in which he is widely expected to be more hawkish than he was during last week’s FOMC. S&P 500 futures climbed 0.1% as of 7:45 a.m. ET while Nasdaq 100 contracts added 0.3%. The Bloomberg Dollar Spot Index retreated from the day’s highs, boosting most Group-of-1o currencies. Treasury yields pulled back after two days of outsized gains. Oil climbed with gold, while Bitcoin advanced for a second day.


VIX futures are consolidating inside yesterday’s trading range, awaiting Powell’s press conference.  VIX awaits a breakout above the 50-day Moving Average at 20.83 for a confirmed buy signal.  Note that the VIX has been trading beneath the 50-day since mid-October.  Time for a change in trend?

ZeroHedge observes, “Since Fed Chair Powell’s press conference last week, equity markets (and bond yields) have soared exuberantly on his apparently dovish lack of push-back against the dramatic decoupling between monetary policy tightening and market-driven easing of financial conditions.

Nasdaq is up 3.5% post-Powell (The Dow is unchanged though)…

And that has smashed financial conditions to their ‘loosest’ since June (and suggesting (given a 90-day lead) that The Fed is done and the terminal rate is here now…


TNX rose to 36.69 this morning.  It may retest the 50-day Moving Average at 35.90 during the give-and-take around Powell’s press conference.  The Cycles Model shows increasing strength as the new Cycle gains legs.  It appears that the new outbreak in rates may surprise the markets.


USD futures appear to be testing the 50–day Moving Average at 102.77 this morning.  Powell’s press conference may boost it over an important benchmark as the Cycles Model suggests a rising USD through the end of February.


Posted in Published | 1 Comment