
12:21 pm
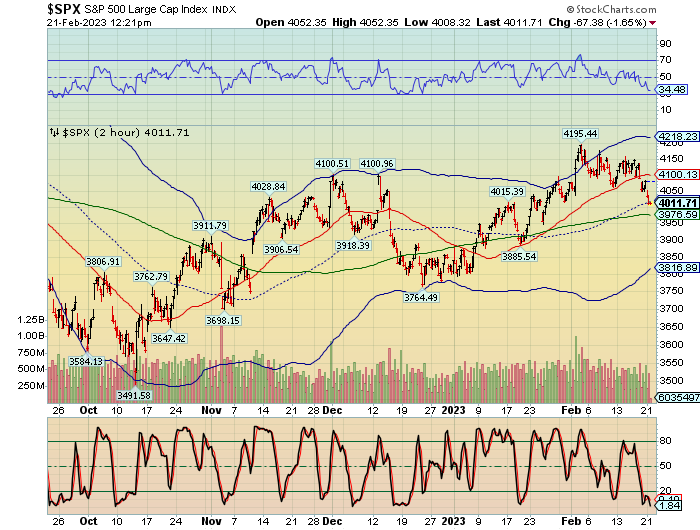
SPX has crossed Intermediate-term support at 4023.95, confirming the sell signal. The 50-day Moving Average lies at 3976.59. So far, no bounce is taking back the loss. Should the decline continue, a bounce may occur either at the 50-day or the descending trendline at 3965.00 (on the daily chart). SPX is solidly in short gamma territory.
ZeroHedge comments, “Nomura’s Charlie McElligott notes that the ongoing stop-out of legacy ‘imminent recession’ trades” continues, perversely thanks to the resumption of the Global Bond selloff on “higher for longer” risk due to better global growth data with many of the most popular “everything rally” trades seen in January have now experience a “round-trip” over the past two weeks and reversed much of their prior YTD moves… with the broad exception of Equities, although they too are now beginning to show “cracks” there too…”

7:45 am

Good Morning!
Not much has taken place since my last post. Next week I begin a longer absence as I embark on a three week road tour on a different topic altogether. Hopefully my next absence will be as uneventful as this one.
NDX futures are testing their February 10 low at 12204.20 with a morning low at 12194.90 thus far. Retail investors are still packing it in (long) as their dreams of a soft landing are crumbling. The Cycles Model anticipates a test of multiple critical supports just beneath 11900.00.
The NDX options chain shows long options have dwindled dramatically since last Friday’s op-ex. Short gamma begins at 12350.00.
ZeroHedge observes, “For much of the waning days of 2022, the broader theme in markets was a downbeat one, especially for one group of habitual gamblers investors: after a stellar 2021 when nothing made sense and the junkiest of companies exploded higher steamrolling shorts, for retail investors 2022 felt like the polar opposite: a relentless series of gut punches which knocked the air out of basement dwelling daytraders and crushed some of the most popular retail names.”


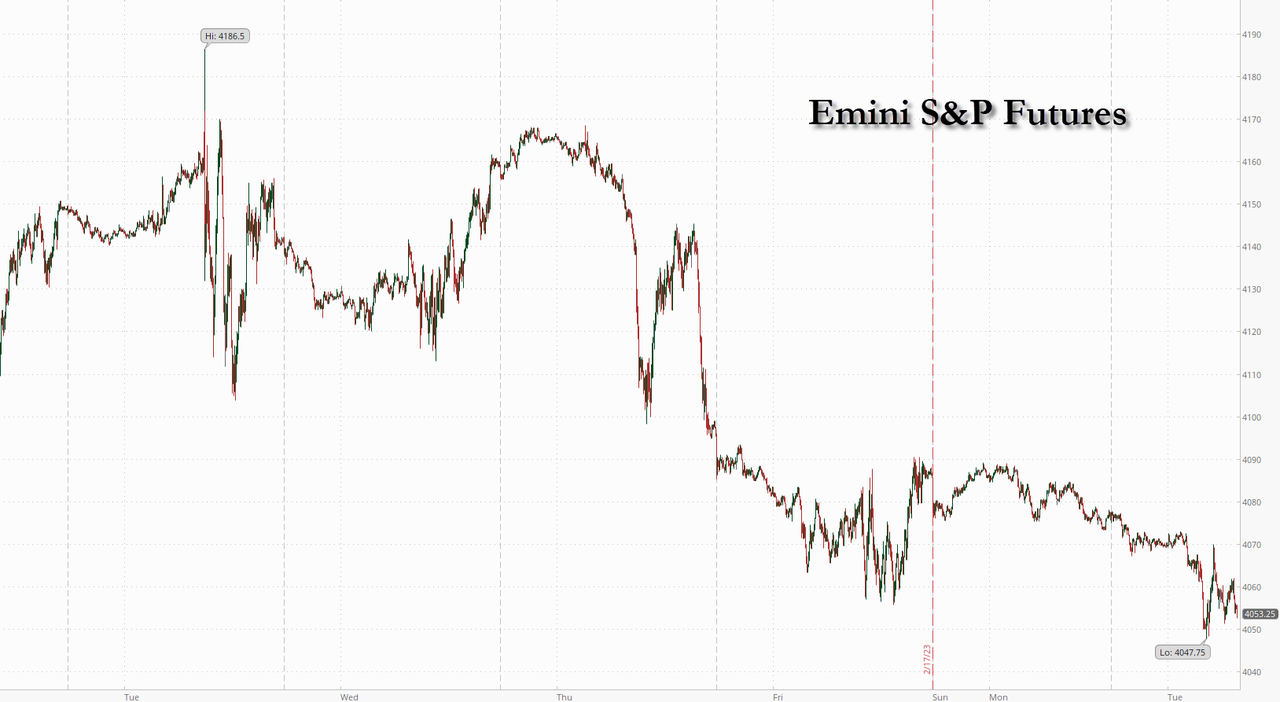
SPX futures are testing short gamma at 4075.00 this morning while aiming at critical support near 4000.00, making a low at 4048.00 thus far. The Cycles Model suggests the decline may begin in earnest once 4050.00 is decisively broken, making a new low in less than 2 weeks.
Today’s op-ex shows Maximum pain for options investors at 4085.00. Long gamma dwells above 4100.00, while short gamma emerges at 4075 with short convictions growing beneath 4050.00.
ZeroHedge reports, ” US stock futures fell for the second day amid deepening geopolitical tensions, and as investors awaited data this week that may show stickier core inflation, prompting expectations for more rate hikes by the Federal Reserve. Futures contracts on the S&P 500 dropped 0.7%, while those on the Nasdaq 100 were down 0.9% as of 7:45 a.m. in New York, after the cash market was closed on Monday for a public holiday. Treasury yields jumped, with the 10Y rising as high as 3.89%, while the Bloomberg Dollar Spot Index retreated from the day’s highs, and the pound led gains among Group-of-10 currencies after UK companies reported surprise growth in output.”

VIX futures have risen to a morning high at 22.54, testing the lower Triangle trendline. VIX is on a buy signal , even as it made a strong pullback last week. There is a risk of testing last week’s low before moving higher. If so, the ensuing rally in VIX may extend until the end of April.
ZeroHedge remarks, “Seen this volatility “panic”?
The SX5E has it´s own “VVIX” (vol of vol) as well, the VV2X. The move higher over the past 2 weeks is huge. The V2X crowd has been late, but has woken up now.
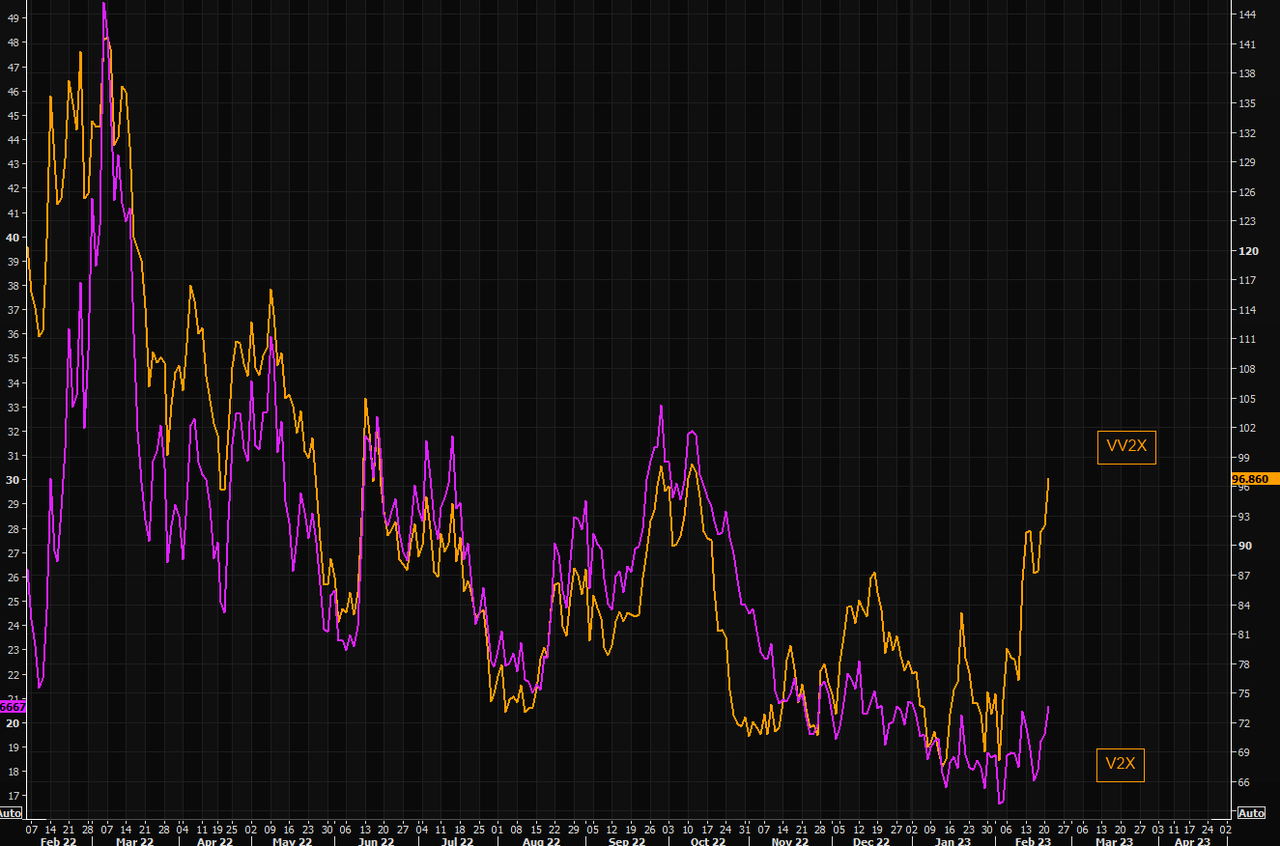
Source: Refinitiv
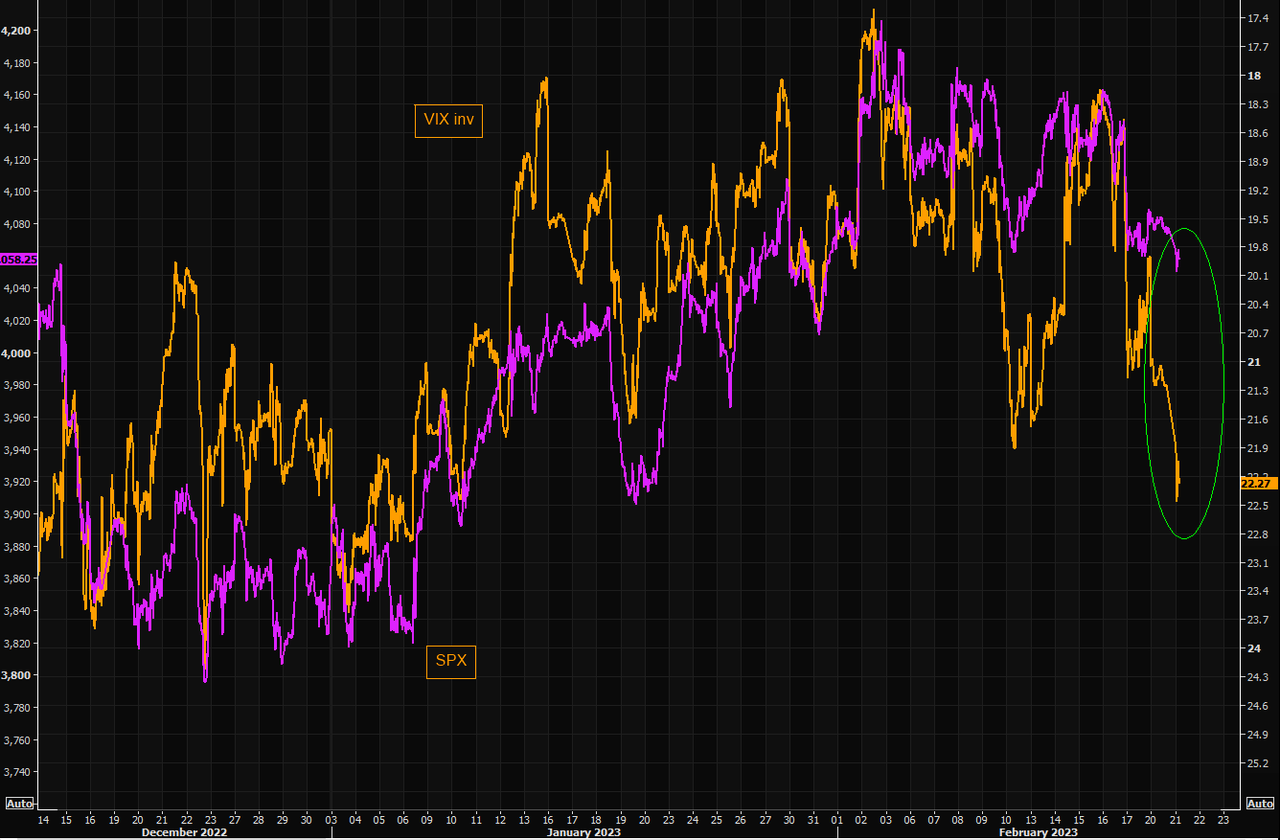
Not so “happy” VIX
VIX hasn’t traded here since January 10. Back then SPX was around 3900. Volatility doesn’t “work that way”, but the exuberant VIX is long gone.”
ZeroHedge observes that not all analysis on the VIX agrees, “The rapid rise in 0DTE (zero days to expiry) option trading means that traditional measures of risk such as the VIX are understating the true extent of underlying market instabilities.
Longer-dated implied volatility is relatively low and has remained subdued.
But this should not be taken as an indication that underlying risks in the market are low.”
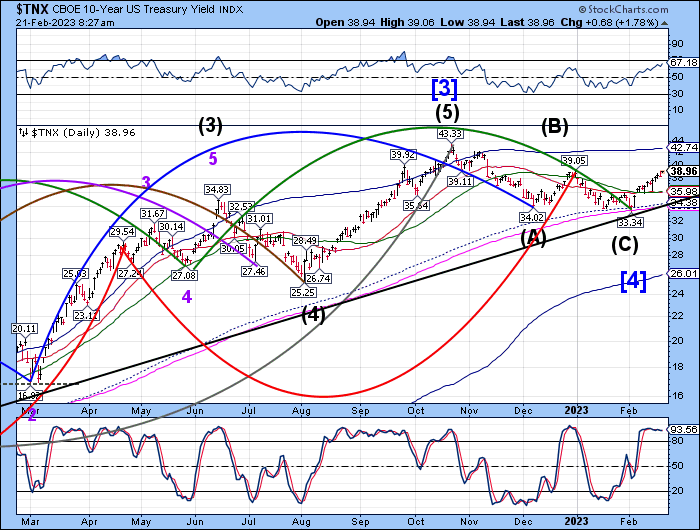
TNX may have made a new high at 39.06, beating the December 30 high at 39.05. The Cycles Model shows a strengthening trend beginning this week and extending through the week of March 20. While investors look at the strengthening economy, smart money knows the price of war is higher interest rates.
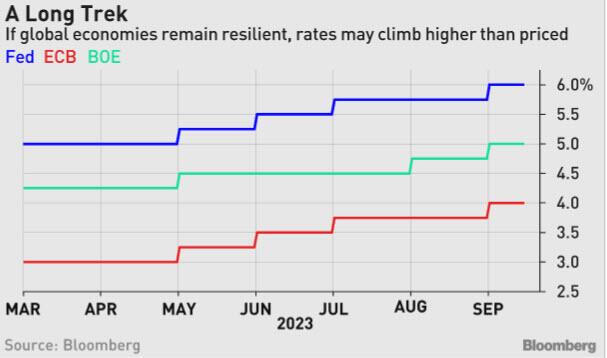
ZeroHedge remarks, “Investors now expect the major central banks to raise rates much more than they were just at the start of this month. They are still underpricing the risk of how much more tightening is to come.
The Federal Reserve may raise interest rates as high as 6%, the European Central Bank to 4% and the Bank of England to possibly 5% should the global economy continue to be resilient and inflation run rife.”

USD futures are consolidating inside last Friday’s trading range. The Cycles Model shows another week of potential rally that may challenge the 200-day Moving Average at 106.30 or the mid-Cycle resistance at 106.53 before a correction or pullback. An alternate view may show USD pulling back early, with the Triangle trendline near 102.00 as a target. If so, look for a break of the 50-day at 103.30 for a further pullback.
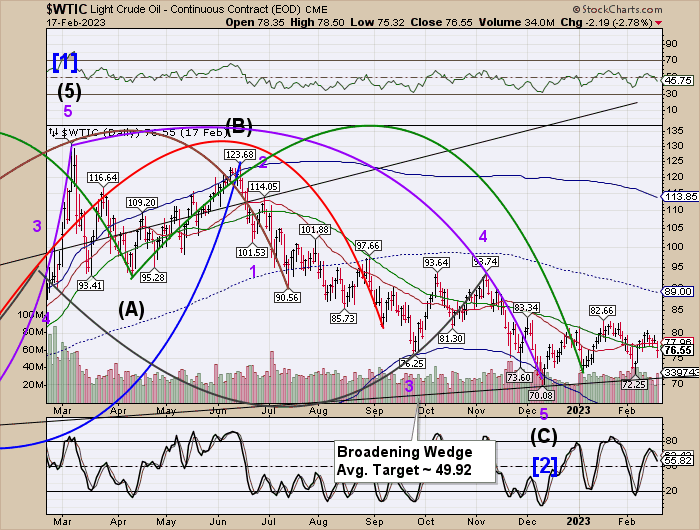
Crude oil futures have bounced to test resistance at the 50-day Moving Average at 77.24. Once accomplished, we may see crude tumble to the Broadening Wedge trendline near 72.00. Should it break through, we may see a further decline to the Wedge’s target.