May 2, 2023

10:39 am

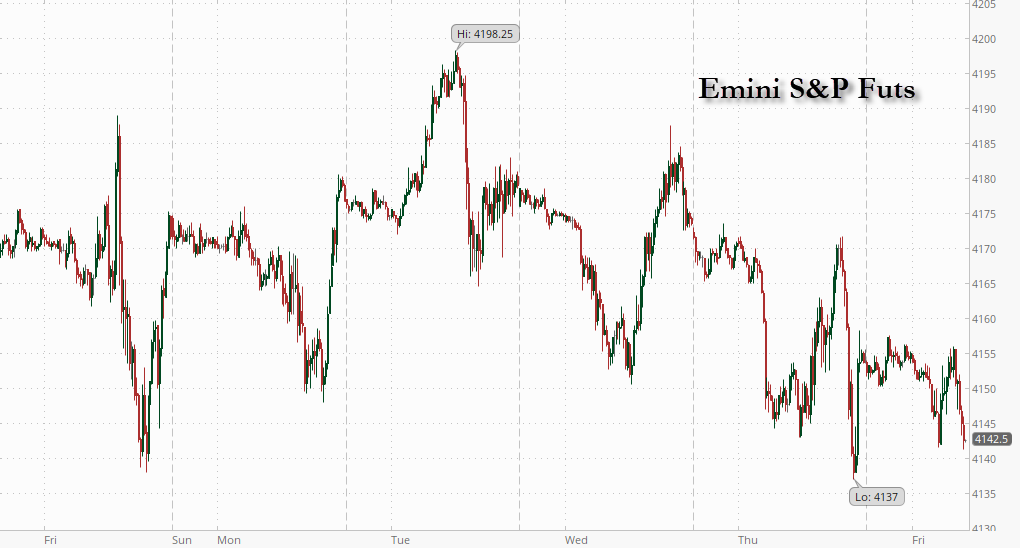
SPX has declined beneath its Short-term support at 4125.77, creating an aggressive sell signal.  Further confirmation of the sell signal may come at the trend channel lie at 4075.00 and the mid-Cycle support at 4061.89.

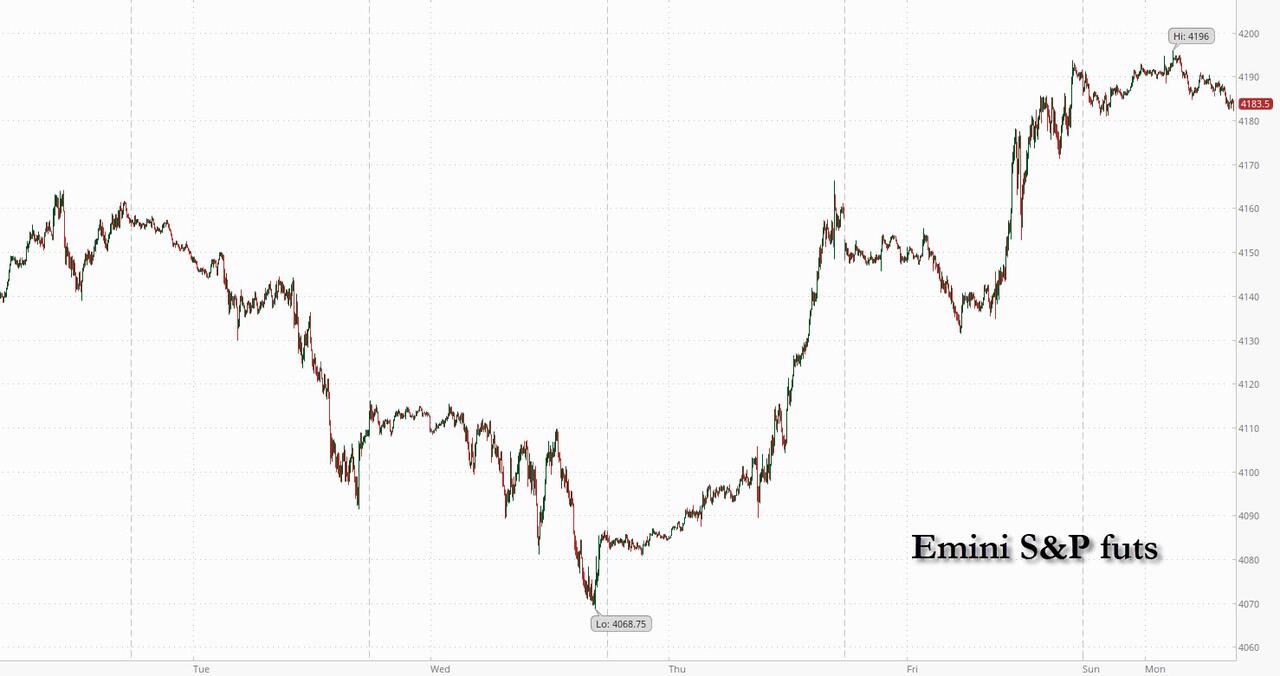
ZeroHedge reports, “Weak JOLTS?, Poor factory orders, a sudden realization of the urgency and seriousness of the debt ceiling debacle, Europe back from vacation, or just pre-FOMC jitters?

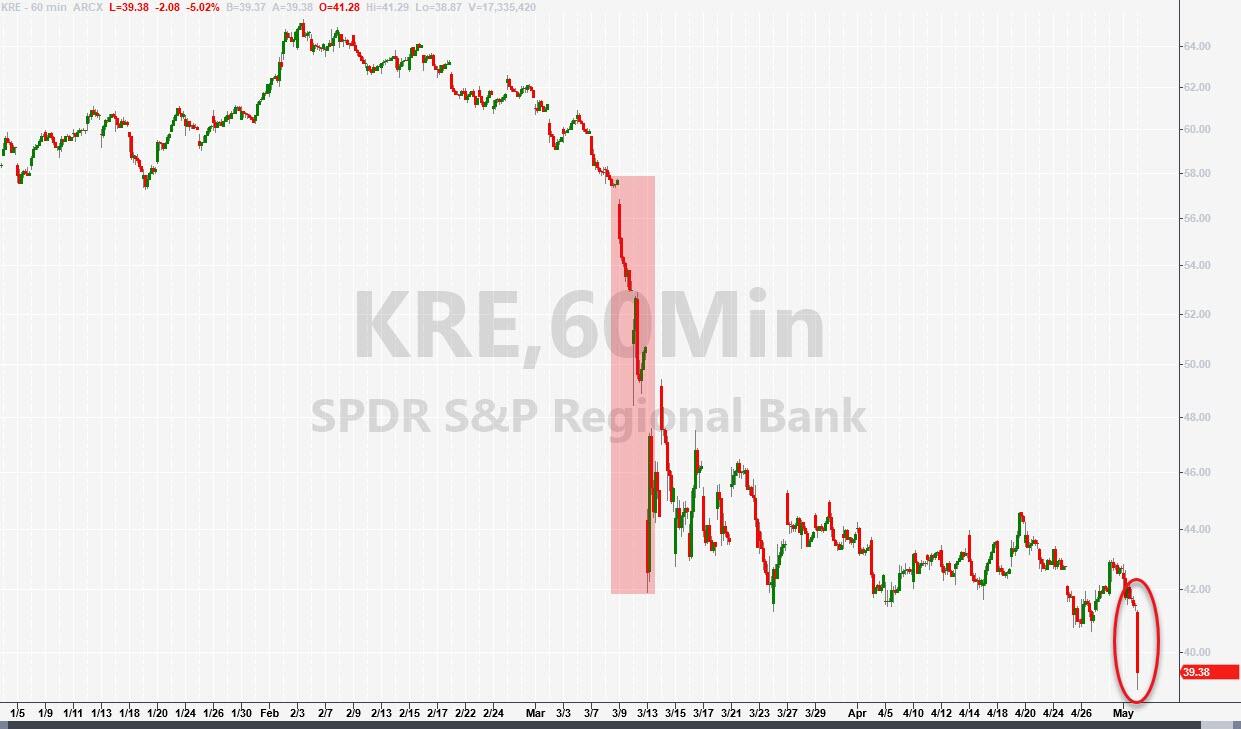
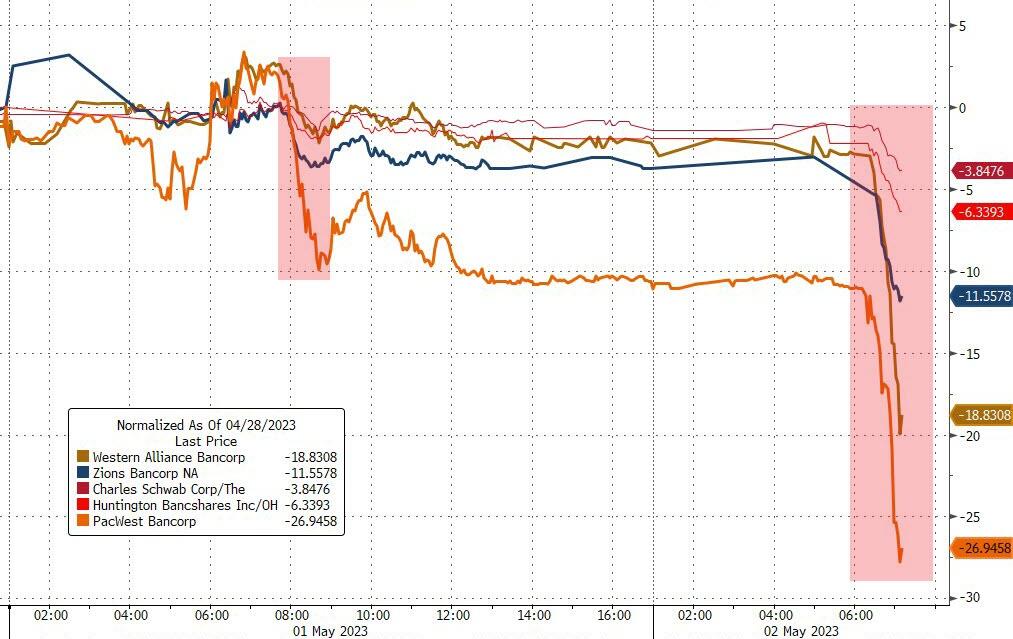
Who knows to be frank but everything went just a little bit turbo, starting with a total collapse in regional banks…

And despite the Biden admin claiming that FRC was just another ‘outlier’ business model, PacWest, Western Alliance, and Zions (among others) are in a freefall…”


9:37 am

BKX has slipped beneath its Cycle Bottom support at 79.32, confirming the sell signal.  Yesterday’s move may confirm downside strength for this index.  If so, we may see the decline intensify through mid-June.

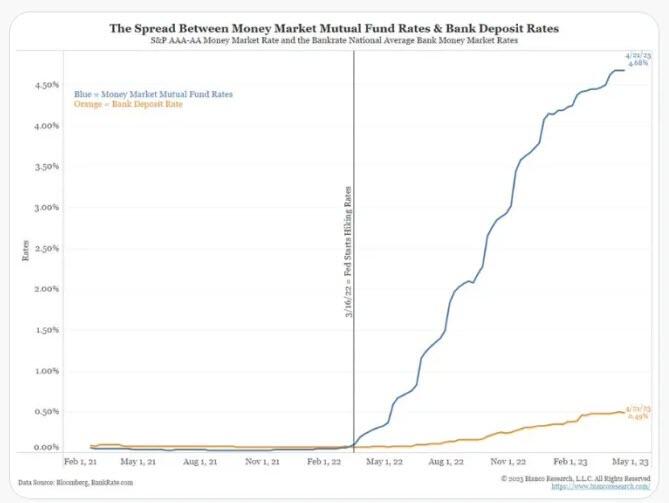
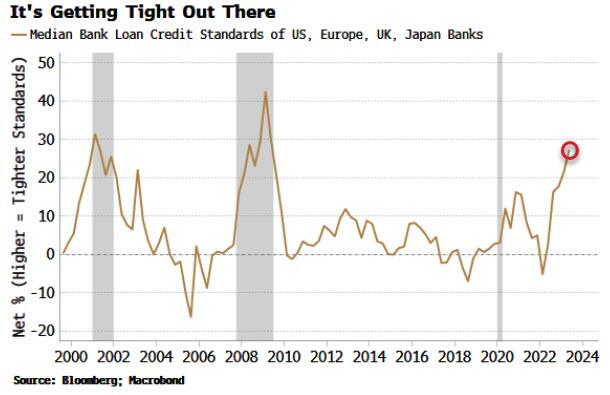
ZeroHedge notes, “A composite measure of DM banks’ lending standards shows they are the tightest since 2009. Tighter credit conditions will be an impediment to central banks’ preference to keep rates “higher for longer.”

The ECB’s bank lending survey was released this morning, with banks further tightening their credit standards.

This has pushed an aggregate measure of bank-loan credit standards to levels not seen since the Lehman crisis.”


7:30 am

Good Morning!

NDX futures have been consolidating in place in the overnight market on day 259 of the current Master Cycle.  The current Wave structure puts a target on this move near 13400.00.  The 2-hour trading Cycle top is at 13403.37.  Cycles may be stretched, for good reason.  The markets may be waiting for the FOMC announcement.

Today’s op-ex sows Maximum Pain for options investors at 13180.00.  Long gamma may begin at 13200.00, suggesting investors/dealers are comfortable being long up to 13500.00.  Short gamma begins at 13130.00, but does not have any depth.

ZeroHedge suggests, “NASDAQ does not care

Did you see the move in the 30 year yesterday? Goldman’s Nocerino reminds us: “The last time the 30yr had a move like this was 06/13 – the SPX fell 3.88% and Non-Profitable Tech fell 8.7%…” Yesterday was pretty much another flat day for equities…”

Source: Refinitiv


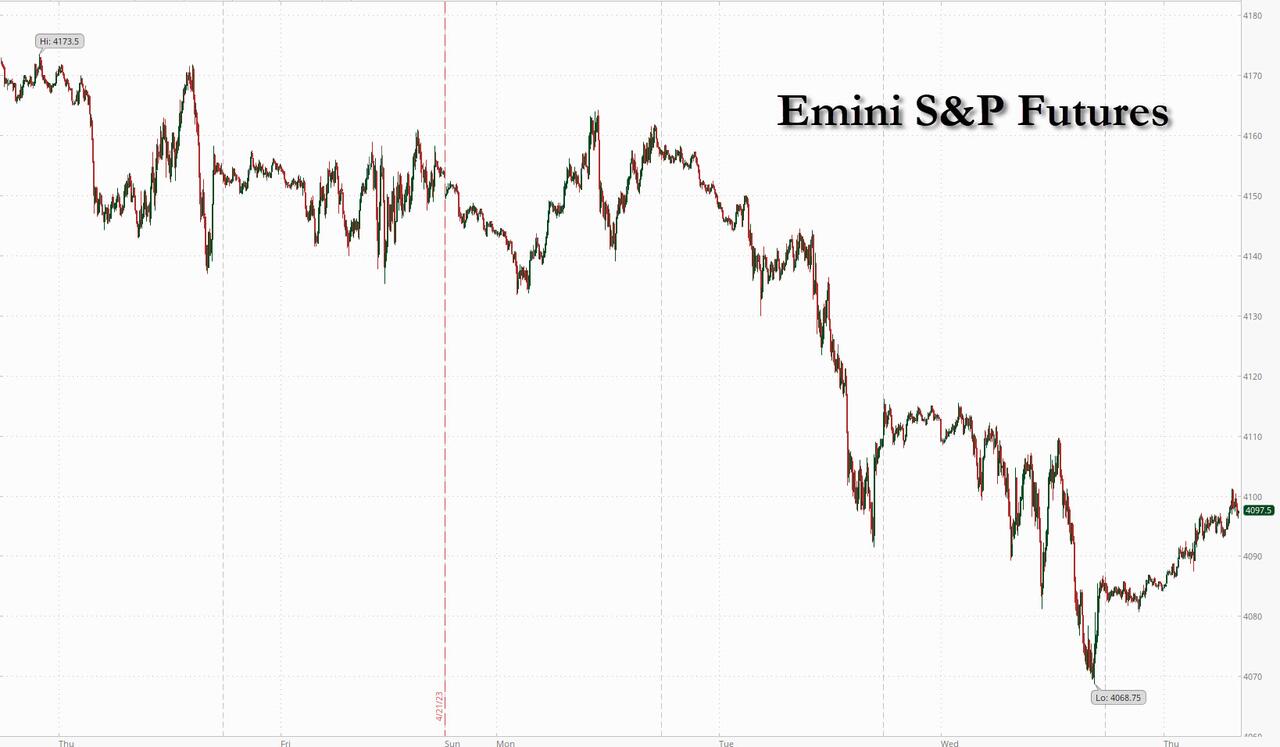
SPX futures are also consolidating in a narrow range.  The current Master Cycle may have completed yesterday, day 258, but the signs of a reversal have not appeared.

Today’s op-ex shows Max Pain at 4165.00.  Long gamma begins at 4190.00, while short gamma starts at 4150.00.  There seems to be little conviction for either puts or calls.

ZeroHedge reports, “US index futures saw modest declines on Tuesday as investors braced for this week’s Federal Reserve meeting where policymakers are expected to deliver another rate increase, and then pause the hiking cycle. S&P 500 contracts slid 0.1% as of 8:00 a.m. ET after earlier swinging between small gains and losses. Nasdaq 100 futures traded little changed. Both benchmarks closed steady on Monday after data showed that US factory activity contracted for a sixth-straight month in April, the longest such stretch since 2009.”


VIX futures are testing yesterday’s high after making a new Master Cycle low on day 262.  The Wave structure is complex, but appears to be complete.  An aggressive buy signal may be imminent, while confirmation lies above the 50-day Moving Average at 20.04.

Tomorrow’s op-ex shows Max Pain at 16.00 with minimal puts beneath it.  Long gamma starts at 20.00 and remains strong to 33.00.

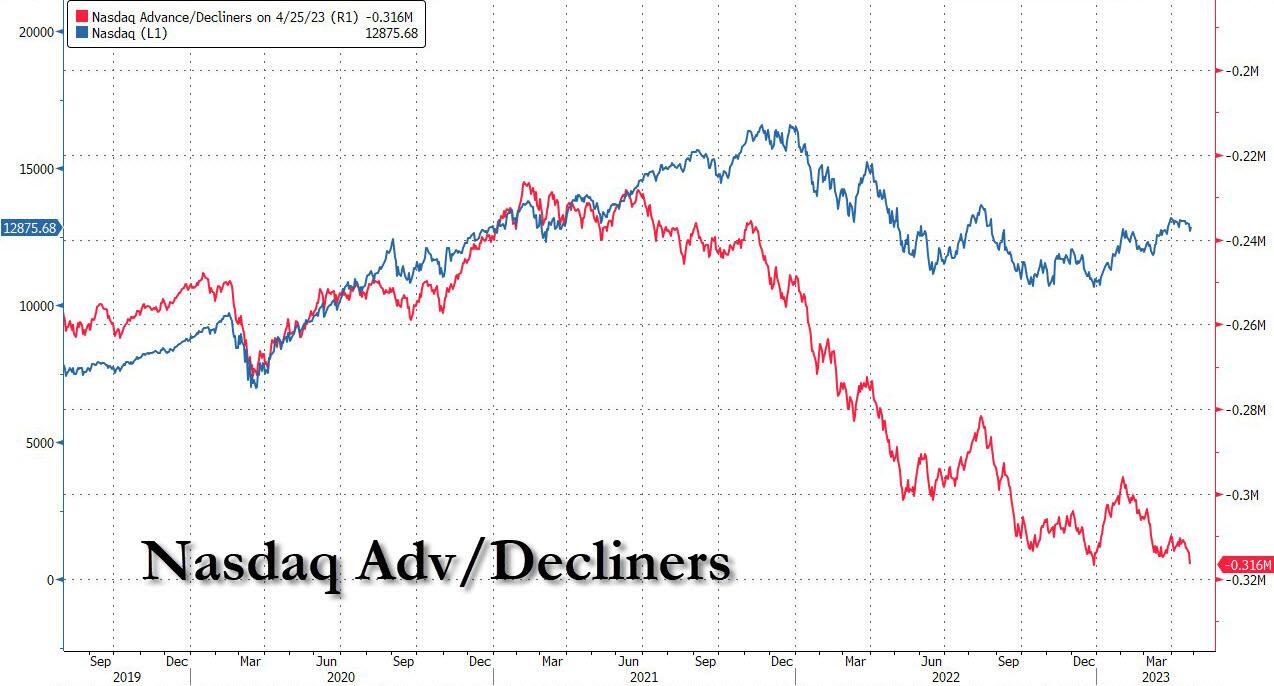
ZeroHedge comments, “Yesterday we laid out a tactical summary of the near-term market direction catalysts as a tug of war between several distinct forces: on one hand, risk could be propelled higher thanks to i) the return of buybacks, ii) the much stronger than expected Q1 earnings season, and iii) the “peak Fed narrative” following this week’s final Fed rate hike; on the other hand, bears were betting that i) “sell in May and go away” would work this year as it has in previous years, that ii) the widely discussed collapse in market breadth would lead to a sharp market drop as it has on all previous occasions, and iii) that the coming debt ceiling crisis would require a sharp market drop to force a paralyzed Washington into action.

Finally, the fact that a recession of some sort is inevitable was cited by Goldman as a fundamentally bearish catalyst over the medium-term.

However, looking at the market structure, so far the bulls are winning, and not just because of Friday’s epic 0DTE call-driven squeeze-o-rama: as Goldman’s start derivatives trader writes in a note published today in which he looks at the “greenshoots of the right tail chase”, Friday was the fourth largest SPX Call session in history with some $600bn in call volume traded!”


TNX pulled back beneath the 200-day Moving average at 35.45.  It may have embarked on a 2-moth rally to a higher yield that may not be recognized until it breaks above the 50-day Moving Average.  The Cycles Model suggests it may do so in the next week.

ZeroHedge remarks, “In a long-awaited update from Janet Yellen, shortly after the close, the Treasury Secretary sent a letter to Congress in which she said that as a result of the recent slowdown in tax receipts (extensively discussed here), the Treasury could run out of emergency debt-limit measures (i.e., hit the infamous X-Dateas soon as June 1 absent a debt-ceiling deal, a revision to her previous Jan 13 letter in which she said that it was “unlikely that cash and extraordinary measures would be exhausted before early June.” In other words, Congress has exactly one month to get a deal to raise the debt limit – which of course won’t happen without the market first plunging enough to prompt the extremely polarized chamber into action.”


USD futures rose to 102.10 this morning, crossing above the Intermediate-term resistance at 102.01.  This may confirm the aggressive buy signal coming off the Master Cycle low.  The Cycles Model suggests a rising USD to the middle of June.  Crossing the 50-day Moving Average at 102.88 may add further confirmation to the rally.


Gold futures are bouncing off the Intermediate-term support at 1992.36.  The failure to rally out of the Master Cycle low on April 20 may be suggesting further downside may be imminent.  If so, the decline may continue through the middle of June.


Crude oil slipped back beneath the 50-day Moving Average at 76.50 and the trendline near 75.00 to reiterate its sell signal.  The Cycles Model suggests at least tree more weeks of decline.  There is a possibility of another new low in that time.

OilPrice.com reports, “Western tanker insurers are concerned that they may inadvertently help ship Russian crude oil above the $60 per barrel price cap as purchases and transactions have become opaque since the G7 introduced the price ceiling in early December 2022.

Protection and indemnity (P&I) clubs have attestation that the shipments they are covering have not been bought above the price cap, but they are wary that increasingly evasive practices by Russia and its new crude customers may obscure the actual price at which Russian crude cargoes are being traded.”


Posted in Published | Comments Off on May 2, 2023

May 1, 2023

8:15 am

Good Morning!

NDX futures may be coming off its 17.2-month long Cycle this morning, as Friday marked the precise timing for a high.  There may be another attempt to probe higher, but the probability of new highs may be waning quickly.  The Cycles Model suggests that there may be a two-month decline starting imminently.  A panic may develop at any time as Waves [3] are the most powerful of declines.

Today’s options expiration shows 13200.00 to be highly populated by both puts and calls.  Long gamma begins at 13250.00 and is populated to 13500.00.  Short gamma starts at 13125.00 and has conviction down to 13025.00.

ZeroHedge remarks, “Regular readers know that among Wall Street’s strategists, the one whose opinion we value the most, is that of Citi’s Matt King of Are the Brokers Broken” fame , who – unlike so many of his peers – feels no pressure to publish every day, or every week… or every month for that matter having long ago cemented his reputation among the annals of Wall Street financial analysis, but merely whenever he has something important to say. Like now.”


SPX futures probed to a weekend high of 4175.80, but have settled back to the flat line this morning.  Today is day 258 in the Master Cycle for the blue chips.  Both SPX and NDX are about to begin a 2-month decline that is likely to take out the October low.

In today’s op-ex, 4150.00 marks the Max Pain zone.  Long gamma begins at 4160.00 and strengthens at 4185.00,  while short gamma starts at 4140.00 and remains strong to 4000.00.  ZeroDTE options have the ability to really upset this apple cart.

ZeroHedge reports, “US stock futures were flat to start the busy new week in subdued trading with much of the world close for May 1 celebrations, as investors assessed the government-backstopped intervention which saw JPMorgan Chase acquire First Republic Bank ahead of this week’s Federal Reserve rates decision. Contracts on the S&P 500 were unchanged at 4,187 after the underlying benchmark gained sharply on Friday, rising 0.8% on the back of another painful gamma squeeze. The dollar dropped, alongside Treasuries which edged lower after a muted session in Asia. There was no trading in much of Europe to observe the May 1 holiday, with markets also shut in Asian centers like Hong Kong, Singapore and mainland China.”


VIX also extended its Master Cycle in a massive throw-under to Friday, thanks to 0DTE option trading.  This morning’s VIX futures show a bounce off the low in what is likely to be the reversal.  The Cycles Model suggests a rally to mid-June.

Wednesday’s op-ex shows Max Pain at 17.00.  Short gamma is non-existent, while long gamma extends from 20.00 to 33.00.

ZeroHedge observes, “VIX has got seasonality too

The VIX seasonality has actually worked pretty well this year. VIX rose until mid March (and we got the March spike). It reversed and has since then imploded. Let’s see if we continue to follow the seasonality pattern going forward…”


TNX lingers beneath the 200-day Moving Average at 35.42.  However, that may change this week, as a double dose of strength may force a breakout by the end of the week.


Posted in Published | Comments Off on May 1, 2023

April 28, 2023

3:16 pm

GKX finally completed an 8.6-month Cycle in the form of an expanded flat correction.  Earlier this week I warned that it may have been targeting the trend channel at 424.00.  Today’s move was sufficient to fulfill that target.  Be prepared for a potential rally to the end of June.


2:52 pm

It seems that 0DTE options players have pulled the rug out from under the VIX for another day.  However, this move may be suicidal for those who wish to jump on that “trend” for any longer.

ZeroHedge remarks, “The last few weeks have been ‘easy street’ for options traders – selling puts has been extraordinarily and very smoothly profitable… until this week when, as Nomura’s Charlie McElligott notes picking up the pennies in front of the steamroller always ends the same way – like Taleb’s “life of a Thanksgiving turkey”…

The question is – will that pain-trade be enough to stall the exuberance vol-selling crowd that has been enabling the equity market’s gains amid growing stagflationary threats?”


2:43 pm

The SPX did not make a new high, as February 2 was the Pivotal day in the Cycles.  Recall that February 2 terminated a 12.9-month Cycle in the Blue Chips.  Today, however, completed a 17.2-month Cycle in the NDX at a new high, as mentioned earlier this week.  Both SPX and NDX are due for a serious decline through the month of June.  Prepare for a panic decline starting now.


:30 am

Good Morning!

NDX futures have pulled back to 13101.50 this morning after yesterday’s ramp higher.  There may be a final probe higher, as high as 13460.00 before the reversal.  This may draw in the last of the FOMO crowd before the reversal.  Bear in mind that the actual reversal may happen over the weekend, so it would be appropriate to exit longs and establish shorts as the target is approached.  Today is day 255 of the Master Cycle and an ideal time for NDX to make a reversal.

Today’s options expiration shows Maximum Pain for investors at 12990 with puts holding an edge beneath that, but little short gamma.  Long gamma starts at 13000.00 and runs strong to 13500.00 at 100 point intervals.  This suggests large money at work.

ZeroHedge notes, “Panic call buying – QQQ edition

The upside panic in a pic. With implied vols at rather low levels, just use those options to play direction, and/or get some long gamma onboard and hedge the deltas. These moves are huge, and gamma is cheap. Long gamma is always a good way to “regain” confidence and trade the market from the “right” side, in case the last moves have confused you.

Source: Spotgamma/Hiro

The concentrated NDX bull

The NDX vs NDXE (NDX equal weight) ratio is surging today again. The move in 2023 is “impressive”!”


SPX futures pulled back to Short-term support (not shown) at 4116.00, lingering near Max Pain.  There is a possibility of a probe higher, moving the current Master Cycle high to today.  If so, the turn may begin mid-afternoon and gain momentum over the weekend.  As it currently stands, the retracement may already be complete, suggesting an morning reversal in SPX.  This is a difficult turning point.

Today’s op-ex shoes Max Pain at 4115.00.  Long gamma runs from 4125.00 to 4250.00.  Short gamma runs from 4110.00 to 3850.00.

ZeroHedge reports, “A rally in US tech stocks was set to reverse on Friday as investors punted on a surprisingly downbeat comment by Amazon about the rapid slowdown in AWS sales growth in April, as well as the prospect of more interest-rate hikes, elevated inflation, signs of slowing economic growth and so on. Contracts on the Nasdaq 100 were down 0.3% by 730 a.m. ET after the underlying index soared 2.8% in its best day since Feb. 2 on Thursday following upbeat results this week from a slate of technology heavyweights. S&P 500 futures were also down 0.3% following the benchmark index’s sharpest gain since January. Treasuries bounced, while gold prices edged lower. Oil prices were also set to end the week lower. The dollar, meanwhile, rose while bitcoin was flat.”


VIX futures are bouncing within yesterday’s trading range. It is still in the accumulation stage with a small chance of making a deeper low.  The buy signal is confirmed at the 50-day Moving Average at 20.17.  The Cycles Model suggests a burst of strength may ensue over the weekend.  Something is cooking under the surface that may be revealed soon.


TNX is pulling back after an attempt at the 200-day Moving Average at 35.39 yesterday.  The Cycles Model suggests that TNX will also have a burst of strength over the weekend, suggesting a breakout above the resistance zone may occur next week.  TNX may appear weak as long as it is beneath the 200-day Moving Average, but that may quickly change.

ZeroHedge reports, “After an average 2Y, and a stellar (if slightly tailing) 5Y auction, moments ago the Treasury held its final coupon auction of the week when it sold $35BN in 7 Year paper in a sale that was solid if forgettable.

The auction stopped at a high yield of 3.563%, below the 3.626% last month and the lowest since January; extending the recent trend, the auction tailed the 3.550% When Issued by 1.3bps. This was the third consecutive tailing 7Y auction and 6 of the past 7.

The Bid to cover of 2.415 was a slight improvement to last month’s 2.394 if below the 2.465 six-auction average.”


Posted in Published | Comments Off on April 28, 2023

April 27, 2023

12:08 pm

The Ag Index broke through a very narrow trading band support at 439.11 on day 279 of the Master Cycle.  There is a trendline support at 324.00 which may stop the decline in the next few days.  If so, this may be a major turning point for the Ag Index.  A follow-up report may come early next week.  In the meantime, the midwest corn belt is being hit by unusually cold and wet weather.  Normally the corn planting season would be over and the plants emerging from the ground by now.  Instead, farmers cannot even get into their fields.

Meanwhile, ZeroHedge points out, “On Tuesday, financial services firm Stephens Inc. lowered their rating of Cal-Maine Foods from overweight to equal weight, pointing to concerns about plunging wholesale egg prices as the reason.

Stephens research analyst covering the consumer staples, food and agribusiness, and grocery/c-store sectors Ben Bienvenu said in a recent conference call with Urner Barry, a market research firm that tracks wholesale food prices, that wholesale egg price trends were “understandably more downbeat.”

“When considering what’s currently playing out for eggs, we think it is best for us move to the sidelines on Cal-Maine as we think risk/reward is now more balanced,” the analyst said. “


9:41 am

BKX slipped beneath its Cycle Bottom support/resistance at 80.35 and is testing the underside resistance today.  As it stands today, the Cycles Model offers a probable decline to the middle of June.  The Head & Shoulders minimum target may be the possible low at that time.

ZeroHedge remarks, “Let’s tune into a mass exodus of deposits at banks for money market mutual funds and what it means…

Spread between bank deposit rates and money market funds from Tweet below.

Jim Bianco has a 21-Tweet Thread on what’s going on with bank deposits. I chimed in on a couple of the Tweets. Here are some of the most important ideas.”


7:45 am

Good Morning!

NDX futures rose off Intermediate-term support at 12765.60 to a high of 12934.40 in the overnight session.  The most likely target may be round number resistance at 13000.00, which is near the 50% retracement level.  Today may be the last day of the bounce, with trending strength reappearing on Friday and lasting into next week.  Investors should not be long beneath 13000.00.

In today’s op-ex, Maximum pain for options investors is at 12860.00.  Long gamma may arise at 12900.00, while short gamma  may begin at 12850.00.

ZeroHedge observes, “Mightiest tech

The NASDAQ vs Russell futures ratio is breaking above the most recent highs..trading at levels last seen in September 2020. For context, MSFT accounted for 140% of the NDX move yesterday (114 points out of an 81-point move), writes Nocerino.

Source: Refinitiv

There is an equal weight NDX…

…and it is lagging. Mega cap tech becoming more and more important for this market. The ratio continues the powerful break out move.

Source: Refinitiv

It is a narrow bull

Impressive performance by a few. Great chart via JPM showing the current state of narrowness.”


The NDX Hi-Lo Index shows a weakening market.  The Cycles Model suggests a worsening condition through the month of June.  As the saying goes, “Sell in May and go away.”

ZeroHedge remarks, “Something odd is taking place below the surface of the nasdaq: while the Index is sharply higher today on the back of strong earnings from MSFT and GOOGL, and is just shy of a bull market from the October lows, there is less here than meets the eye. And, as we have noted repeatedly in recent weeks, today’s action cemented what we already knew: Nasdaq breadth defined in this case by the advance/decline ratio, just hit a record low!”


SPX futures are bouncing off the double support at the 50-day Moving Average at 4037.53 this morning. There is an hourly resistance at 4116.53 that may prove to be a stopper.  The decline may resume in strength by Friday.  The Cycles ae suggesting a possible event over the weekend that may accelerate the decline into next week.  The Head & Shoulders neckline may come into play by then.

Today’s op-ex shows Maximum Pain at 4050.00.  Long gamma may begin at 4075.00, while short gamma may start at 4025.00.

Friday’s (month-end) op-ex shows Max Pain at 4080.00.  Long gamma has the edge above 4100.00, while short gamma is heavy at 4050.00 and worsens at 4100.00 as the shorts are making gains over the longs.

ZeroHedge reports, “US index futures gained on Thursday halting a two-day drop, led by the tech stocks, after Meta’s better-than-expected results helped mitigate investor concerns about the F(ailing)irst Republic Bank, economic outlook, inflation and monetary policy. S&P 500 futures traded just above 4,100, rising 0.7% as of 8:00 a.m. ET, while Nasdaq 100 futures rose 0.9%, extending Wednesday’s gains as the tech-heavy benchmark continues its outperformance of the broader market this year. According to JPM, “this week’s Equity performance highlights the divergence due to low market breadth” something we discussed yesterday. European stocks gained and were set to snap a three-day losing streak as Barclays, AstraZeneca and Unilever all rise after their respective updates. Asian markets were also green after a rebound in Chinese stocks. USD is weaker, longer-dated yields are higher, and commodities are mixed before US GDP and jobless claims to gauge the strength of the US economy. Yields on five-year notes dropped the most in a month on Tuesday, spurred by a wave of quant investors. The Federal Reserve’s preferred inflation gauge, the core PCE deflator, is due Friday.”


VIX futures pulled back to 17.90 and is likely to test hourly support at 17.50 today.  Tomorrow may begin a period of strength that may last through next week.

Next week’s op-ex shows Max Pain at 19.00, with lagging short gamma.  Long gamma begins at 21.00 and intensifies to 33.00.


TNX probed higher this morning, challenging Intermediate-term resistance at 34.91.  The next resistance to be recognized is the 200-day Moving Average at 35.31.  A breakout above the resistance zone (34.91-36.26) may lead to a rally in yields lasting to early July.  The 7-year Note goes to auction today.  Watch closely.

ZeroHedge reports, “One day after a strong 2Y auction, moments ago the Treasury sold $43BN in an even stronger sale of 5Y paper.

Stopping at a high yield of 3.500%, this was not only below last month’s 3.665% but it was also the lowest 5Y yield since August 2022 when the tenor priced at 3.23%. It also stopped through the When Issued 3.506% by 0.6bps, the second straight stop through in a row.

The bid to cover was also solid, rising to 2.54, the highest since January and well above the 2.49 six-auction average.”


Crude Oil is consolidating today after breaking the Broadening Wedge trendline near 75.00.  The target for the Broadening Wedge may be 56.00.  The Cycles Model suggests the decline may last to the end of May.

Reuters reports, ” Oil prices dropped by almost 4% on Wednesday, extending the previous session’s sharp losses, even after a report showed U.S. crude inventories fell more than expected, as recession fears grew for the world’s biggest economy.

Brent crude settled at $77.69 a barrel, losing $3.08, or 3.8%. U.S. West Texas Intermediate crude settled at $74.30 a barrel, shedding $2.77, or 3.6%.

Energy Information Administration (EIA) data showing U.S. crude inventories fell last week by 5.1 million barrels to 460.9 million barrels helped to limit the price fall, far exceeding analyst forecasts of a 1.5 million drop in a Reuters poll.”

Gold futures continue to decline, approaching Intermediate-term support and a confirmed sell signal at 1981.40.   The Cycles Model proposes a double strength event over the weekend which may retest the Cycle Top resistance at 2039.17 early next week.  Should that happen, the Cycles Model suggests the decline may resume with confirmation of a sell signal beneath Intermediate-term support.  Meanwhile the gold crowd continue their onslaught of misinformation.  


Posted in Published | 1 Comment

April 26, 2023

8:00 am

Good Morning!

NDX futures bounced to 12912.20 in the overnight session, attempting to emerge out of short gamma, but pulled back substantially from there.  The return of (downside) trending strength was anticipated in the Cycles Model.  It suggests further downside by the weekend.  Whether it develops into a panic decline by the end of the month is TBD, but the indications are there.  The current Master Cycle may continue its decline through mid-June with downside strength increasing into a probable panic through the month of May.

Today’s op-ex shows Maximum Pain at 12920.00.  Long gamma starts at 12950.00, while short gamma begins at 12860.00.

ZeroHedge observes, “Goldman’s closely followed flows guru, Scott Rubner, broke one of his golden rules and sent an email this afternoon (“I do not send emails in the afternoon… this goes against every email rule that I follow.”) His message was simple – a doubling down on what he said last Friday when after a brief spell as a bull, he made a U-turn: “I am tactically bearish”

And as to why he broke his email rule – “things have changed and flow-of-funds changed today… this is new”.

What is he referring to? Simple: the same technical force that provided a backstop to stocks for much of the past month when fundamentals threatened to drag risk sharply lower and which helped push the market right back to where it was… is no more.”


SPX futures bounced to 4095.00 in an attempt to elevate it out of short gamma this morning.  The decline may gain some intensity by the weekend with a possible bounce early next week.  A decline beneath the 50-day Moving Average may bring on more selling, as universally recognized supports are broken.  The initial target may be the Head & Shoulders neckline at 3850.00.  This decline may have both time (June 15) and probable strength to bring SPX back to its October low.

In today’s op-ex Max Pain is at 4095.00.  Long gamma begins at 4120.00 while short gamma starts at 4080.00 and remains strong down to 3775.00.

ZeroHedge reports, “US index futures are fractionally higher, led by tech, however continued turmoil surrounding First Republic Bank which tumbled as much as 30% this morning after losing half its value yesterday, has sapped much of the earlier optimism and gains. Yesterday was the SPX’s worst day in a month and was April’s second move that exceeded 1%, in either direction. As of 8:00am ET, S&P futures were up 0.1%, while Nasdaq futures gained 0.8%, but both were well of their highs. Google parent Alphabet and Microsoft Corp. both beat first-quarter earnings expectations in results published after the market close. Microsoft gained in the premarket Wednesday, while Alphabet reversed an advance to move into the red. Meta Platforms is due to report after the bell today.”


VIX futures consolidated inside yesterday’s move, leaving the 50-day Moving Average at 20.24 as the next target.  The Cycles Model suggests the new trend may intensify by the weekend, with a possible panic during the month of May.

Today’s op-ex shows Max Pain at 18.00 with short gamma at 16.00-17.00.  Long gamma starts at 21.00 and remains strong to 33.00.

ZeroHedge observes, “Equities feel like they are approaching “a point of instability,” warns Nomura’s Charlie McElligott in his latest note.

Today we see an old-school “risk off” trade, with USTs rallying sharply, Equities / Commodities (Gold, Crude, Copper) lower, Credit wider and USD ripping higher to the pain of “Anti-Dollar” trades everywhere.”


TNX bounced this morning but may attempt another probe to the trendline at 33.50 before a possible reversal.  Should that take place, the new trend in TNX may last through mid-July.

ZeroHedge notes, “Pressure on reserves and extra demand for the Fed’s RRP facility will keep weighing on stocks and other risk assets.

Debt-ceiling dynamics are distorting the Treasury bill curve. Bills are first in the line of fire if the debt ceiling becomes binding due to the way they are issued. This is leading to a surfeit of demand for bills which mature before “X Day”, the day when it is anticipated the Treasury will hit the debt ceiling. Tax payments are slower than average this year, bringing estimates for X Day to early June.

This has led to 1-month bills yielding only ~3.75% versus 3-month bills at ~5%. The current overnight RRP rate is 4.80%. We can use the rates implied by Fed Funds futures to imply what the 1-month and 3-month RRP rates would approximately be.”


USD futures are consolidating following its rise out of its Master Cycle low.  The consolidation may be positive as trending strength may come back by the weekend.  The Cycles Model suggests the new trend may last through mid-June.


Crude oil has dropped beneath its 50-day Moving Average at 76.49 this morning, potentially confirming the decline starting on April 12.  The trendline at 75.00 may be the next target, taking it to the 61.8% retracement of the rally from April 2020 and the weekly Cycle Bottom at 53.05.

ZeroHedge observes, “Oil prices fell on the day amid banking and debt ceiling fears weighing on consumer sentiment and knocking into broad market sentiment (and a stronger dollar did not help).

“The crude market is in wait-and-see mode with trading dominated by short term strategies as opposed to real investors,” said Rebecca Babin, a senior energy trader at CIBC Private Wealth.

“Longer-term investors aren’t going make real bets until there is clarity around China’s recovery and US recession.” Earnings are also likely pulling the focus to other asset classes, she added.”


Posted in Published | Comments Off on April 26, 2023

April 25, 2023

11:57 am

BKX has fallen beneath the Cycle Bottom support at 81.16, confirming the sell signal after reversing from the 50-day Moving Average at 85.95 on the 19th of April.  The new Master Cycle is projected to run until mid-June.  Is this the beginning of a bank run?

ZeroHedge observes,”UBS’s Swiss-listed shares slid in early Tuesday trading after the bank posted a 52% year-on-year decrease in net profit in the first quarter. Despite the slump, the bank recorded strong customer inflows while preparing to acquire rival Credit Suisse. This marks the first financial results since UBS announced the takeover of Credit Suisse last month.

UBS disclosed its weakest quarterly earnings in more than three years and a dim outlook for interest income in its wealth management division. It said net profit came in at $1.03 billion for the first quarter, missing analyst expectations of around $1.75 billion for the period.

Switzerland’s largest bank experienced a $665 million hit in net income due to US residential mortgage-backed securities litigation. It also said it’s in talks with the US Department of Justice to settle a 2018 civil complaint.

That news overshadowed the inflow of $28 billion from high-net-worth clients during the quarter, $7 billion arriving in the ten days following the announcement of the Credit Suisse takeover in March.”

ZeroHedge also remarks, “Moments ago the regional bank at the forefront of the banking crisis, First Republic, whose stock crashed from $125 to $12 one month ago amid the broader banking crisis, reported its closely watched earnings. And, on the surface, they weren’t terrible: the company beat on both EPS, Net Interest Income and revenues:

  • Q1 Revenue $1.2BN, -14% Y/Y, beating the estimate of $1.12BN
  • Q1 EPS of $1.23, beating estimates of $0.72
  • Q1 Net Interest Income $923MM, -19%, but beating estimates of $889.9MM”


7:15 am

Good Morning!

I am starting early to attend a morning conference and appointments the rest of the day.

NDX futures are nudging yesterday’s low as the Cycles Model suggests a burst of strength in trend.  Most believe the trend is still up, but the turn may have been made, allowing a confirmation of the aggressive sell signal.  The short sellers may be right, after all.  However, their position has been embattled for the past two weeks.  While SPX completed a 12.9-month Cycle on February 2, NDX is now completing a 17.2-month Cycle from high-to-high this week.It is likely we will know the outcome by Friday.

ZeroHedge remarks, “Two weeks ago, just ahead of earnings and at a time when sentiment was starting to turn extremely bearish again, we explained that the main reason why every selloff attempt was violently reversed and transformed into a short squeeze, is because hedge funds were most short S&P emini futures in 12 years, and thus every failed attempt at a sharp selloff – no matter how valid the fundamental reasons – led to a short-squeeze rally.

Two weeks later, with stocks even higher, the technicals once again dominate and as shown below, the latest non-commercial (a proxy for hedge fund activity) emini net spec position revealed in the weekly Commitment of Traders report showed a fresh 12-year high in bearish sentiment.”


SPX futures are probing yesterday’s low, bottoming thus far at 4109.50.  SPX reversed from its high on April 18 with room in the Cycle to go a bit higher, if necessary, on day 252.  Should the retracement be complete, the current action may be the calm before the storm.

ZeroHedge reports, “US equity futures fell on Tuesday, as investors braced for the first earnings from the megatech giant “generals”, which incidentally are mostly lower premarket; bond yields are 3-5bp higher and the USD is higher.

Contracts on the S&P 500 and Nasdaq 100 both fell 0.5% in New York as of 7:45 a.m. after Wall Street benchmarks ended Monday’s session broadly unchanged.  Commodities are mixed with weaker oil after several days of gains. Yesterday, FRC reported after the bell with deposits declining 41% QoQ vs. -9% survey; stock is down 21% after close. Today, the focal point will be GOOGL and MSFT’s earnings after-market: investors will look for cost outlook and revenue growth. GOOGL closed +0.5% yday and +20.1% YTD; the implied move is 4.6%; MSFT closed -1.4% yday and up 17.5% YTD pre-market; the implied move is 3.3%. Further, keep an eye on the April Conference Board Consumer Confidence and Richmond Fed survey data.”


VIX futures are consolidating after making a new high yesterday.  The Cycles Model implies that today may be a “breakout” day for volatility.

ZeroHedge comments, “Flatter

1. VIX1D single digit….

2. Four days left in April and NASDAQ still has not had consecutive green days.

3. So low NYSE volume you kind of wondered if the market actually was open

Source: Refinitiv

15-month “flat”

Implied and realized volatility at 15 months low. Really? Feels like 15 century low….”

ZeroHedge warns, “..but what happens next?

As we noted Friday, CBOE Global Markets launched a one-day volatility options tracker to its arsenal this morning.

The 1-day VIX is designed to offer insight into 0-DTE trading patterns that are not picked up (due to maturity mismatch) in the traditional fear index.

The 1-day VIX is higher this morning (as is the VIX), but we note that the 1-day VIX is trading around half the level of the VIX…


USD futures have edged higher after making an overnight low of 100.93.  The Cycles Model suggests the USD may rally through mid-June.


TNX fell beneath the 200-day Moving Average at 35.21 and may be headed for the trendline near 33.50.  The New Master Cycle may be a high-to-high Cycle stretching to early July…in other words, a monster.  As long as there is downward pressure on the TNX, equities may go higher.  It may not last beyond this week.


Posted in Published | Comments Off on April 25, 2023

April 24, 2023

9:32 am

BKX may be resuming its decline following the reversal on April 19.  The next decline may be as strong (or stronger) as the first, leading to a possible 50% decline, in line with the Head & Shoulders target.  It may be accompanied by much tighter liquidity and possible bank closures through mid-June.   It’s time to be personally prepared for a liquidity event, as well as aligning your portfolio for such an outcome.

ZeroHedge remarks, ““Credit started tightening six to nine months ago,” said the developer, a close friend, entrepreneur, with large residential projects across the nation. “It started with the money center banks,” he continued. “This pushed us to regional banks for our latest projects, but then SVB happened.” The market froze.

“The lender for our latest 30-story project in a tier-one city backed out, so we scrambled, and spoke with well over 100 banks. Not one will provide financing.” His firm is a leader in their market niche. A strong track record.

“The Fed is going to have to inject liquidity and slash rates to break this financing freeze on new construction.” Not only have higher rates failed to push home prices down materially, but they are now reducing new supply.”

ZeroHedge observes, “Credit Suisse reported Monday that clients had withdrawn 61.2 billion francs ($69 billion) in the first quarter and that outflows were continuing, highlighting the challenge faced by UBS in rescuing its rival in March.

In the last financial statement as an independent company, Credit Suisse reported a loss of 1.3 billion Swiss francs ($1.46 billion) for the first three months of the year. It said “significant net asset outflows” were seen in March.

Most asset outflows originated from its wealth management unit and occurred in all regions. The troubled bank said, “These outflows have moderated but have not yet reversed as of April 24, 2023.”


7:45 am

Good Morning!

NDX futures appear frozen in place over the weekend.  April 4 appears to be the high thus far, although I have marked April 18, which is 6 points lower.  The Wave structure is anomalous and offers few clues as it may be approaching a major turning point.

Today’s op-ex shows Maximum investor pain at 13040.00.  13000.00 is hotly contested by both puts and calls.  with short gamma possible beneath it.  Long gamma may begin at 13050.00 and longs are own 102 contracts at 13100.00.

ZeroHedge observes, “Boring is king

NASDAQ continues trading the incredibly boring range in April. We have basically seen a 2.5% max move from low to high so far in April.

Source: Refinitiv

Don’t brag you trade NASDAQ

It is not a cool thing these days. NASDAQ 1 month and 5 days realized volatility.

Source: Refinitiv

…but downside convexity is back

Latest CTA flow projections via Goldman’s flow guru Scott Rubner:

1 week: – flat tape: +$5.7bn to buy, up tape: +$7.1bn to buy, down tape: -$36.2bn to sell

1 month: – flat tape: +$100mm to buy, up tape: +$11.1bn to buy and the “kicker” – down tape: -$222bn to sell”


SPX futures are nudging the lower end of the trading range with a overnight low of 4111.20, but ramped up in morning trading.  Unlike the NDX, SPX appears to have completed its retracement rally on April 18.  It is on an aggressive sell signal that may be confirmed beneath the 50-day Moving Average at 4028.15.  This week shows trending strength may come back in a big way, starting today, most likely primed to the downside.

Today’s op-ex shows the 4130.00 strike hotly contested by both puts and calls.  Long gamma may begin at 4150.00, while short gamma starts at 4100.00.

ZeroHedge reports, “In what is shaping up as yet another unchanged open, futures are set up to open violently unchanged after earlier sliding as much as 0.6% following lackluster sentiment in Asia, but a reversal during European trading. Investors are bracing for a barrage of earnings ahead of the busiest reporting weak in Q1 earnings season which sees the likes of MSFT, GOOGL, Meta, AMZN and XOM all set to report amid rising interest rates and economic slowdown worries. S&P 500 contracts fell as much as 0.6% before paring the drop to unchanged as of 7:30 a.m. ET while futures for the tech-heavy Nasdaq 100 benchmark were 0.1% lower.”


VIX futures jumped to a new high at 18.24 this morning after making its Master Cycle low on the 19th.  While standard technical analysis shows no buy signal until it reaches the 50-day Moving Average at 20.35, the Wave structure and Cycles both indicate that the turn may have been made.  Should that be so, the Cycles Model suggests a probable rally in VIX to the end of May.

Wednesday’s op-ex shows Max Pain at 18.00.  Short gamma rests at 16.00-17.00 with no conviction beneath it.  Long gamma starts at 19.00 and extends to 42.50.

ZeroHedge comments, “Subdued equity volatility is poised to rise soon as the US economy becomes more recession-like.

Oscar Wilde once said the only thing worse than being talked about is not being talked about. It’s a fate that’s befallen the VIX in recent months as its limelight has been stolen by the increasing focus on options with zero days to expiry.

But that’s likely to change soon as it and other measures of longer-dated volatility rise as the economy enters the recession event horizon: the transitory state between a slowdown and an inescapable contraction.

We can see this most clearly in the rapid deterioration in unemployment claims across the US.

When the percentage of states with claims rising sharply reaches around 20% (where it is now), it typically shoots much higher, with a recession often following soon after.”


TNX has settled somewhat lower as it tests the 200-day Moving Average at 35.30.  The current Master Cycle has about a week left, leaving the possibility of a probe above the 50-day Moving Average at 36.51, which it tested last week.

ZeroHedge remarks, “With Wall Street’s attention suddenly transfixed on the upcoming debt ceiling fiasco following our report  Why This Week’s Tax Data Could Lead To A Much Earlier Debt Ceiling Crisis (as well as subsequent articles here and here) in which we warned that sharply weaker tax receipts (a non-trivial puzzle considering the BLS claims the US generated 4 million jobs since last year yet tax receipts are 30% lower) in 2023 could bring forward the infamous X-date from the previous consensus of as far as October to as soon as June, on Friday we said that the latest Daily Treasury Statement (or DTS) which updates the Treasury’s daily cash balances, receipts and outlays, would be a doozy and far more important and informative than the Fed’s Friday H.8 statement (which tracks bank deposit and loan data).”


USD futures are lower as they digest last week’s bounce out of its Master Cycle low.  Despite protests to the contrary, the Cycles Model suggests a rising USD to the middle of June.

ZeroHedge remarks, “Over the last few weeks, it has seemed you can’t turn a page, blink at a pixel, or hear a news report without some form of de-dollarization headline shrieking at you. From Brazil to Saudi Arabia, and from India to Argentina, and increasing number of nations are ‘reportedly’ shifting away from the dollar hegemon.”


Gold futures bounced this morning and may retest the Cycle Top resistance at 2030.69 before resuming their decline.  It was not able to overcome its 2020 high at 2089.20, suggesting it may retest its 2016 low at 1045.40.  Gold may be in a Cyclical decline within a secular bull market.


Posted in Published | 2 Comments

April 21, 2023

8:00 am

Good Morning!

SPX futures are consolidating after having broken beneath the rising trendline on day 247.  The Cycles Model suggests that, if the reversal has been made, the next week may give us a panic decline.  The Model also suggests the decline may progress through the end of June.

Today’s morning op-ex shows 4100.00 being hotly contested with both puts and calls numbering over 25,000.  Large pockets of both puts and calls are at 50-point intervals between 3950.00 and 4200.00.  This may lead to higher volatility at the open.  The pm expiry shows Max Pain at 4135.00 with long gamma beginning at4150.00 and short gamma starting at 4045.00.

ZeroHedge reports, “US equity futures extended their recent weakness and traded near the week’s lows in early Friday trading as investors digested the latest corporate updates. Investors now await PMI data later today for further direction on the path for monetary policy. Contracts on the S&P 500 and the Nasdaq 100 drifted -0.2% lower as of 7:15 a.m. ET, as both indexes were set to end the week in negative territory, the Nasdaq underperforming slightly. Treasury yields edged higher, while the dollar advanced against other major currencies with a measure of its strength set for its first weekly gain in six weeks. Iron ore, gold and oil all decline, as the gains from the latest OPEC+ output cut are now all gone: so will OPEC cut again to reverse the slide in the one asset class that unlike stocks, everyone loves to short as a hedge for the coming recession?”


VIX futures show a probe at 17.71 as VIX rises out of its Master Cycle low on Wednesday.  While not giving a buy signal, the extreme downdraft into Wednesday’s op-ex suggests the decline may be played out, providing a good location to accumulate VIX futures, options and ETFs.

The April 26 op-ex shows Maximum investor pain at 18.00.  Short gamma runs out below 17.00, so the decline appears tapped out.  Long gamma comes to life above 19.00 and runs to 33.00.

ZeroHedge inquires, “The S&P 500 just did something it hasn’t done since 2021: The benchmark index went 19 straight days without falling at least 1% in a single session; showcasing a lack of anxiety about the stock-market advance that’s on track for its fifth week of gains in seven.

As Bloomberg notes, several explanations could be supporting the trend. One is that the earnings season – the current center of investor attention – is off to a strong start. Secondly, the mini banking crisis in March is slowly getting further in the rear-view window, and no alarming developments are adding to it this month.

“There is bearish pressure, but maybe not as much as when the banks were steadily worsening,” Sameer Samana, senior global market strategist at Wells Fargo Investment Institute, said by email.

“And it’s now being offset by bullish pressure, from folks looking at things like banks earnings and Fed deposits/loans/flows data, which have shown some improvement.”

However, at the heart of this low-anxiety, Fed-reliant market is the reflexive rout of VIX that has many asking, incredulously amid  growing recession fears, stickier than expected inflation prints, and Fed rate trajectory uncertainty: “Why is VIX so low?”


Posted in Published | 1 Comment

April 20,2023

7:20 am

Good Morning!

SPX futures have crossed beneath the trendline at 4145.00, giving a probable aggressive sell signal.  I cannot stay to comment further.  Confirmation is at the 50-day Moving Average at 4040.11.  The punchbowl is down to its dregs.

ZeroHedge muses, “After almost 15 years of Fed-fueled cheap money offered at near-zero rates that was leveraged into overinflated speculative bubbles, the lights are on, the crowd is dispersing – and the party might finally be over.

At an actual party, it’s easy to know when it’s time to say your goodbyes. The hosts turn the music off, start looking at their watches and taking away the snacks.

In this metaphorical party, though, how do you know when it’s over?


Posted in Published | Comments Off on April 20,2023

April 19, 2023

6:30 am

Good Morning!

SPX futures have challenged the rising trendline at 4130.00, making a potential aggressive sell signal.  Aggressive signals offer a high risk, high reward pivot point at which volatility is still capable of taking either direction.  However, it offers the best placement against later pullbacks which often shake out weaker investors.

VIX futures have als risen back above the rising trendline at 17.42, also giving an aggressive buy signal.

I am due for an all-day meeting, so I cannot comment further at this time.


Posted in Published | 11 Comments