April 23, 2021

3:45 pm

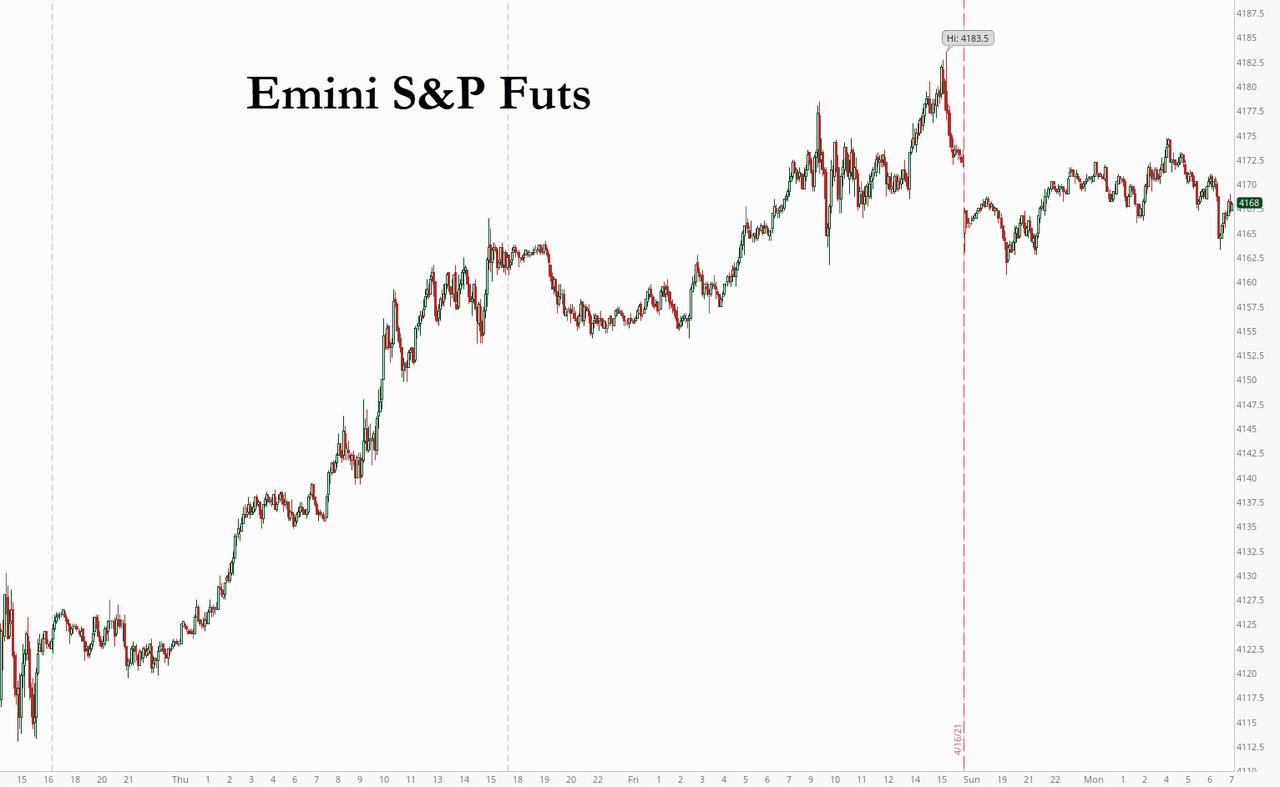
SPX made a nominal new high at 4194.17.  The rally appears to be complete.

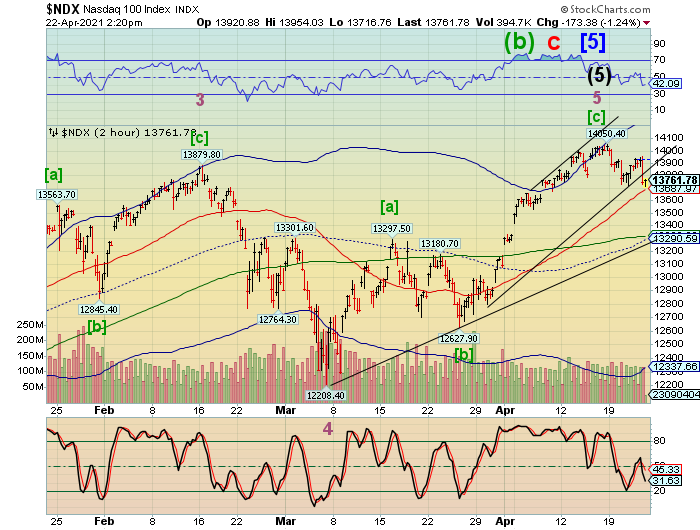
NDX did not make a new high and its retracement appears complete.

INDU did not make a new high and it’s retracement also appears complete.

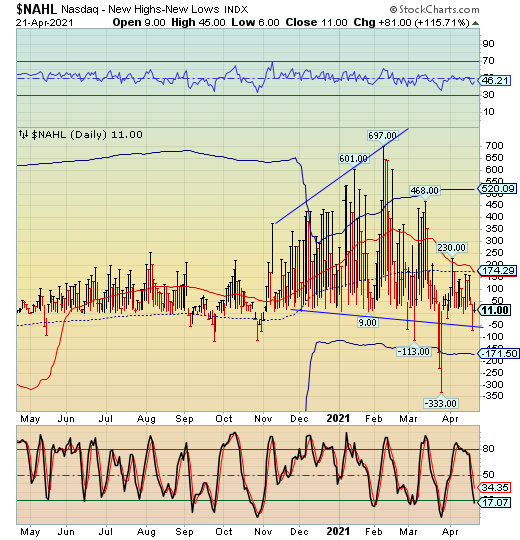
The VIX and Hi-Lo are not positioned for a signal.  Could the top be in?  Have a good weekend!


1:00 pm

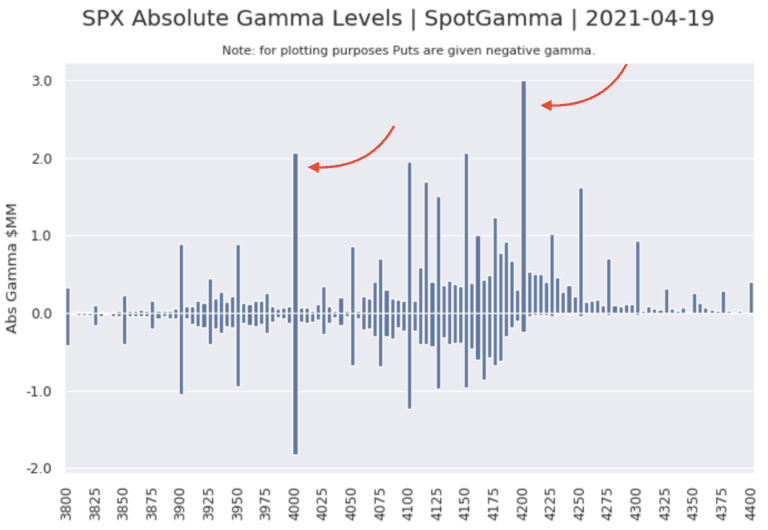
The Triangle formation appears to have been nullified.  Wave [v] seems to be underway.  If so, the Wave structure tells us that the end may come near the Cycle Top (currently at 4226.58) , or as high as 4300.00 in a monster throw-over of the Ending Diagonal.

A most interesting alternative is that the top may already be in, assuming SPX remains beneath the current high.  A decline beneath Short-term support at 4111.57 tells us the confusion may be over.  This rally is already overbought and ripe for a turn.


9:00 am

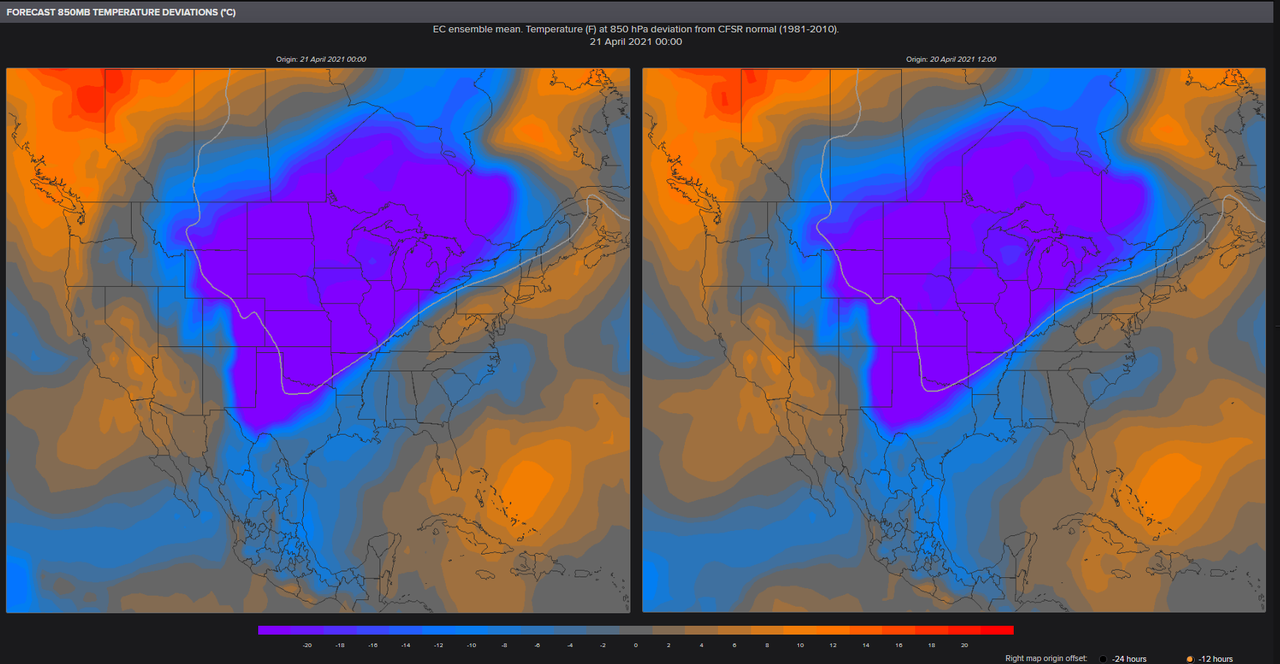
The GSCI Ag Index continues its climb as cold weather and drought take their toll on food production.  Today is day 261 in the Master Cycle.  While not in the “stretched” category yet, it may continue for another week or so to complete the Wave pattern.  It has already exceeded my initial target of 427.00, so I do not have another nearby target to end the Master Cycle.  I plan to report later today on any new developments in this very important index.

ZeroHedge observes, “Earlier this month, French farmers fought mother nature in their attempt to prevent frost from wiping out their crops. It appears their attempts have failed as the damage is extensive and could wipe out nearly a third of French wine output for the year.

In early April, French farmers scrambled to light-controlled fires across their vineyards to stave off frost. Euronews document these efforts in a series of stunning photographs.

A farmer burns a bale of straw in his vineyard to protect grapevines from frost. This picture was taken on April 7 at the heart of the Vouvray vineyard in Touraine, France.

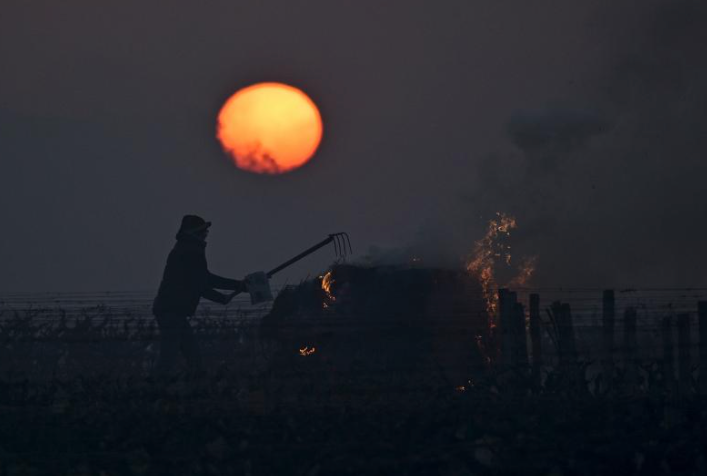
Winegrowers from the Domaine Daniel Etienne Defaix vineyard in Chablis lit fires across their fields. ”


7:50 am

Good Morning!

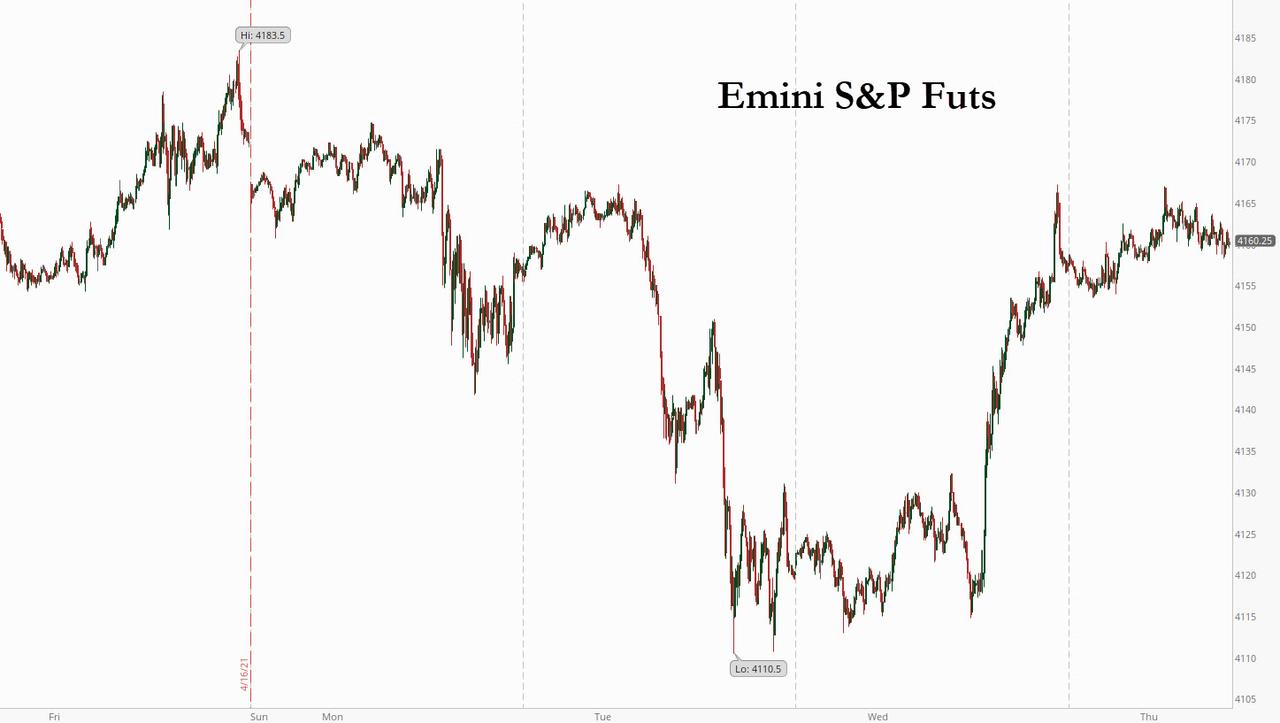
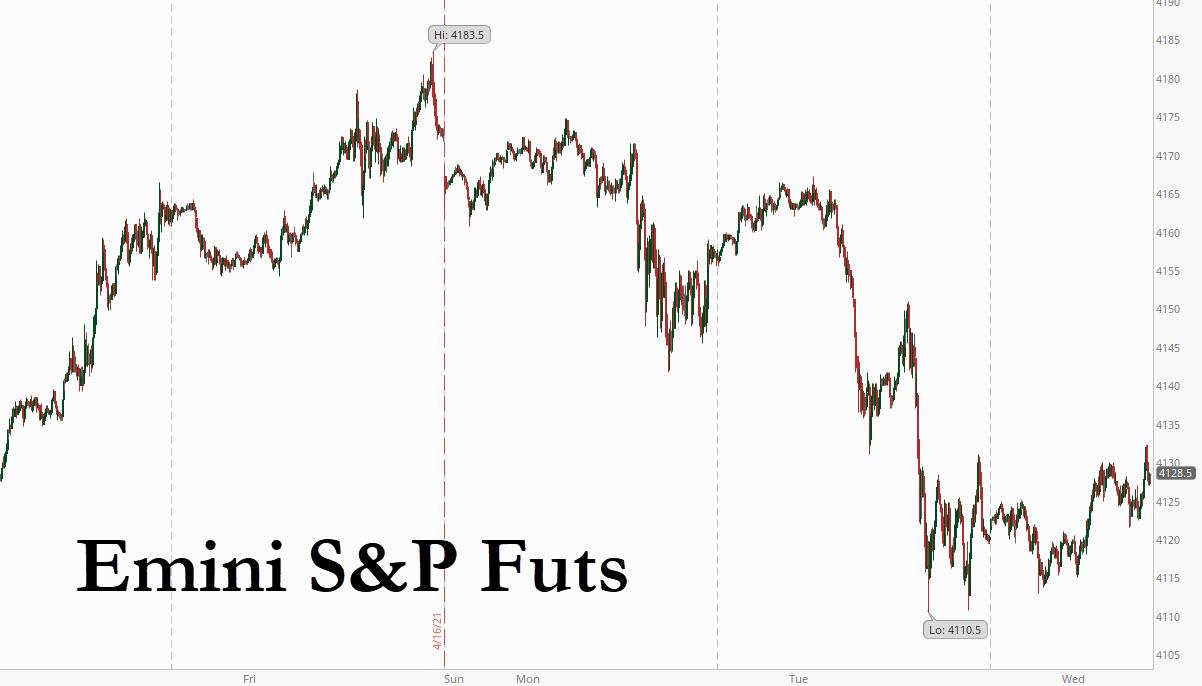
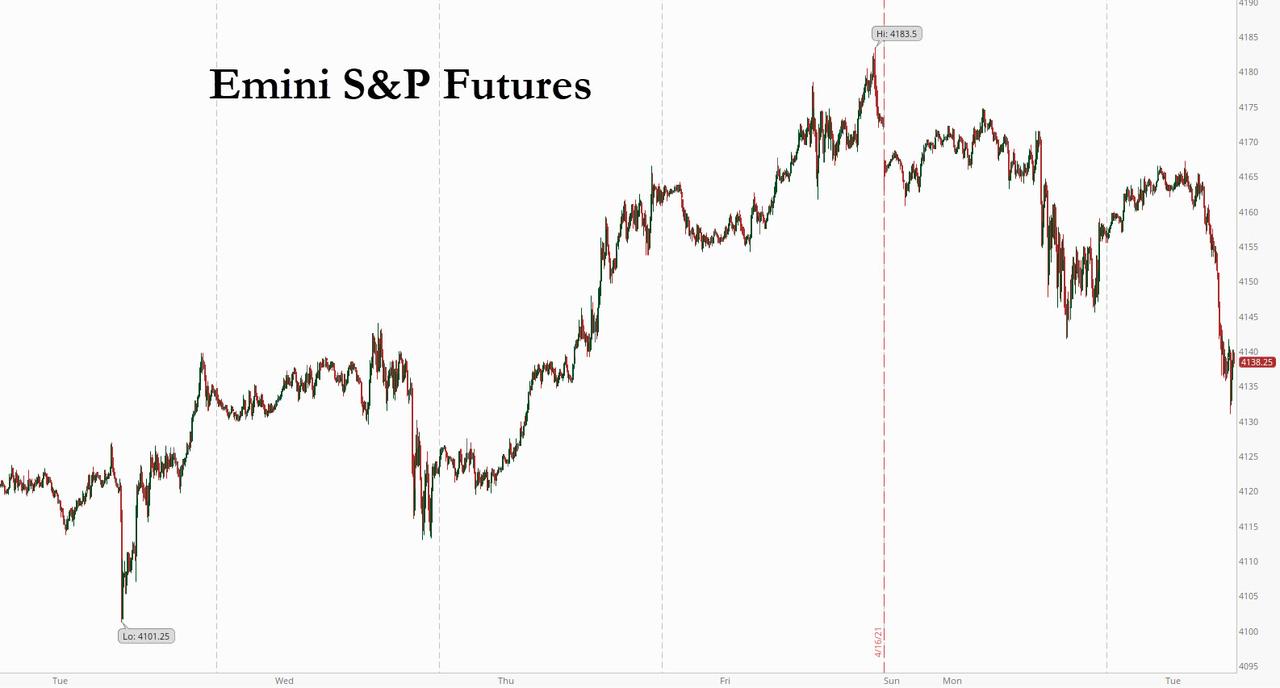
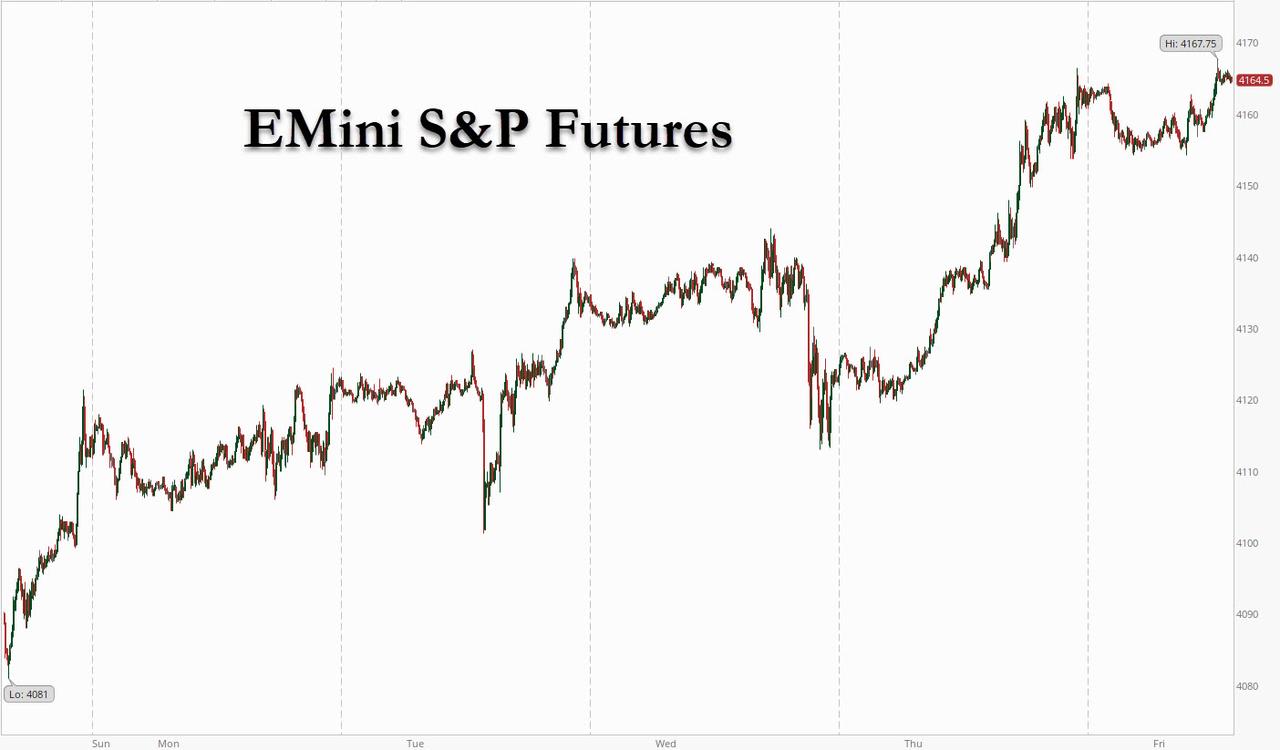
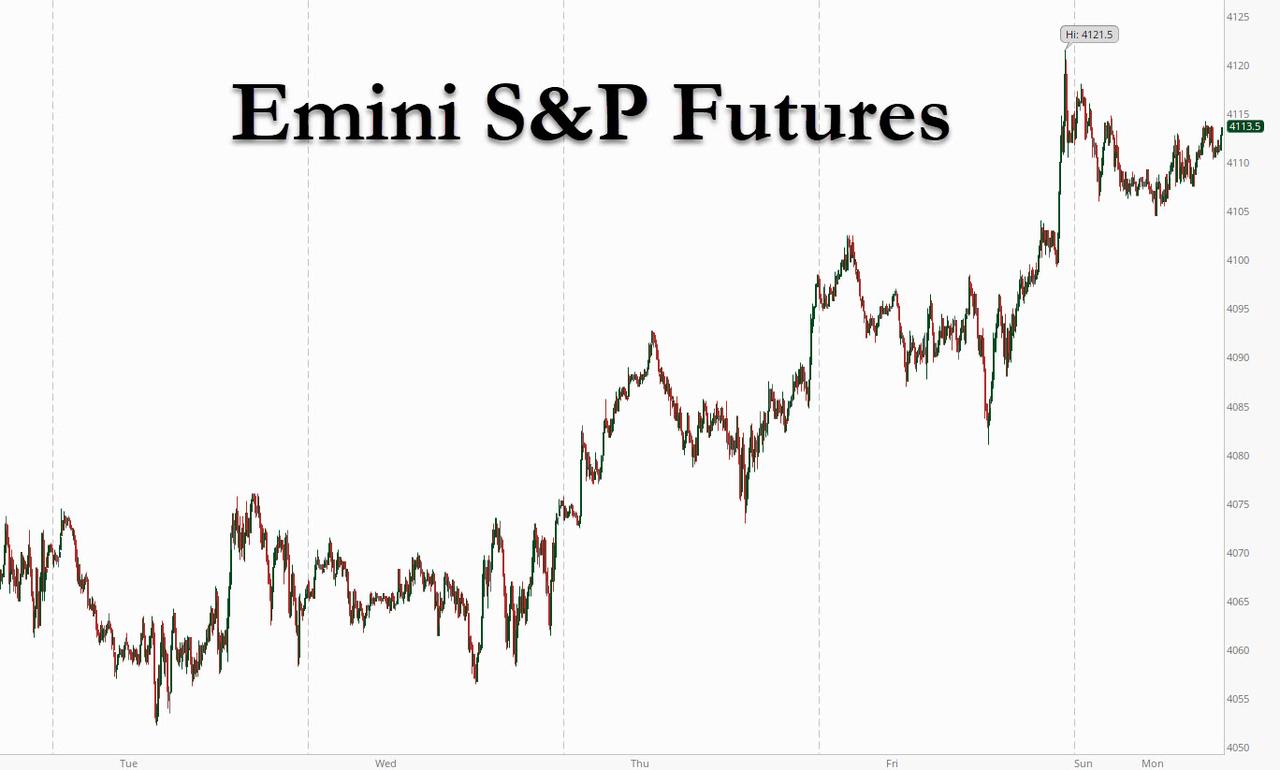
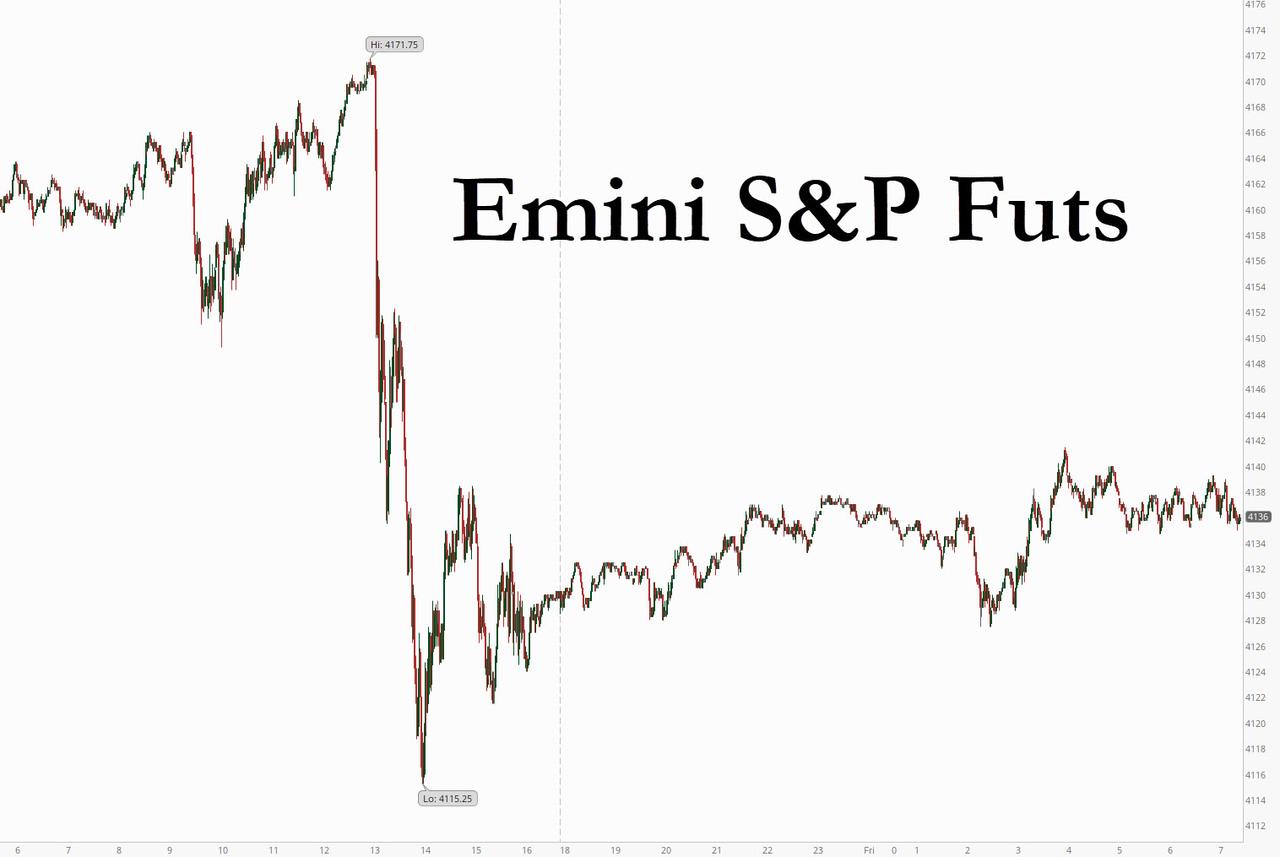
Well, the suspense may be nearly over.  SPX futures rose this morning, adding confirmation to the notion that stocks may go higher in this Wave 5.  Should the Triangle formation be correct, we may see SPX rise to the upper Triangle trendline at 4170.00-4175.00 (Wave (d) today.  Subsequently, Wave (e) falls to 4125.00.  The final surge in Wave [v] may reach the Cycle Top, currently at 4220.75.  Cyclical strength appears to peak near the end of  April.

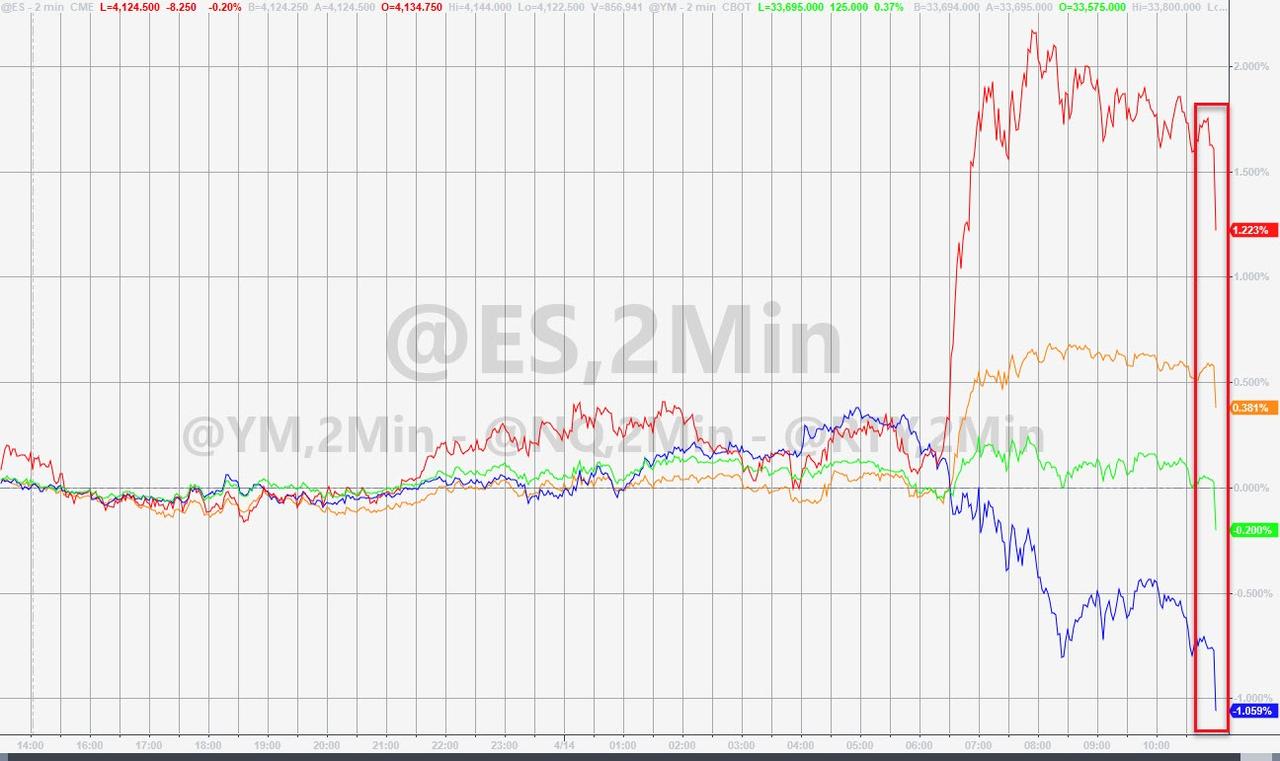
ZeroHedge reports, “US equity futures rebounded Friday following Thursday’s 1% selloff as investors digested a proposal for higher capital gains taxes and realized that i) it is nothing new compared to previous media reports and ii) the most likely outcome is a compromise tax rate (Goldman expects a final number no higher than 28%).  Still, both the S&P 500 and Dow are on course for weekly declines, after four straight weeks of gains. At 730 a.m. ET, Dow e-minis were up 38 points, or 0.11%, S&P 500 e-minis were up 9 points, or 0.22%, and Nasdaq 100 e-minis were up 18.5 points, or 0.14%.”


VIX futures are hovering near the trendline at 18.25.  The EW pattern appears to be complete to the downside.  The VIX has historically been an advance indicator.  We often see the VIX rising alongside the SPX in Wave 5, so that is my expectation at this time.


TNX is testing the 50-day Moving Average at 15.35 this morning.  The Master Cycle low may be put in today, should TNX fall to 15.29 or lower.  Today is day 260 in the Master Cycle, so the timeliness is appropriate.  Stochastics appear to agree.

ZeroHedge opines, “10 year Treasury rates peaked at the end of March at 1.74% after having risen from low of just 0.56% back in the summer of 2020. Now, the rate stands at 1.57% even as economic data continues to come in smoking hot and policy remains incredibly accommodative. In times like this, we have to ask ourselves whether this is a correction within a longer-term uptrend in rates or if we’re currently witnessing peak rates for the cycle. The question is of vital importance to asset allocators of all stripes since a falling/rising rate environment informs equity factor performance ranging from growth/value to small/large to domestic/foreign. Our read of the data suggests we may yet have more to go on the downside for rates, but that this is a correction within a longer-term uptrend.”


USD futures declined to 90.94 as it corrects the initial rally off the Master Cycle low.   The strength of the new trend may pick up next week, but USD appears to hover near the lows for now.


You may be wondering where the idea of a triangle may have come from.  Since Asian stock markets often lead Europe and the US, this might be a harbinger of what may come in the next few (market) days.  The Nikkei 225 Index may have completed its triangle on Wednesday with a Master Cycle low.  It should now be ready for its final blast higher.  While Wave (3) has ridden the Cycle Top higher, Wave (5) may only barely touch it before a reversal.   The Nikkei may have only three weeks left in its final (stimulus induced) probe to the Cycle Top.

ZeroHedge reports, “Update (0750ET): As expected, PM Suga has officially declared the new state of emergency, apologizing to those impacted while offering some reassurances of a 5 trillion yen contingency fund ($46.4 billion) to soften the financial repercussions for individuals. 500 billion yen ($4.6 billion) will also be set aside to support Japanese firms, he said.

  • JAPAN PM SUGA DECLARES VIRUS EMERGENCY IN TOKYO AND 3 AREAS
  • JAPAN PM SUGA APOLOGISES FOR DECLARING STATE OF EMERGENCY AGAIN
  • JAPAN’S PM SUGA: 500 BILLION YEN WILL BE SET ASIDE TO SUPPORT COMPANIES.

The declaration – officially announced by Suga Friday night in Tokyo – was earlier endorsed by a panel of experts advising the Japanese government on COVID-19. Both the governors of Tokyo and Osaka requested the emergency status.”

* * *


Posted in Published | 3 Comments

April 22, 2021

4:00 pm

Suspenseful, isn’t it?


3:00 pm

As the final hour approaches, will we see buyers step up to the plate…or sellers?  The indices bounced back to the short-term trendlines, but have not exceeded them.   Further selling here may turn into a rout, especially if the decline resumes the pace it made on the first decline – nearly 56 points in about 20 minutes!


2:20 pm

NDX has also crossed its short-term trendline.  Further confirmation lies at Short-term support at 13687.87.  While the bears still aren’t out of the woods, sunlight is shining through the thicket.  For those with an abundance of caution, the 50-day Moving Average is at 13320.00.

ZeroHedge remarks, “In a recent note from SocGen’s Andrew Lapthorne, the cross-asset strategist summarizes the ongoing market insanity delightfully, saying that “there is an increasingly large number of weird and wonderful signs of market excess, from surging crypto currencies started as a joke to a single New Jersey Deli trading at $100m market cap.”

To be sure, it’s not just the record liquidity that has pushed the Goldman index of financial conditions to record easy levels…

… there is also a lot of good news, with the economic narrative improving and vaccination programs accelerating worldwide, with most now hoping that the worst of the pandemic is behind us. At the same time, global profit expectations are being revised upwards and earnings growth is forecast to jump by a third in 2021.

Given this almost euphoric market backdrop, Lapthorne correctly notes that “anything bearish is met with groans.”

ZeroHedge passes this info along, “With stocks tumbling following the report that Joe Biden is considering a proposal that would double the capital gains tax, as investors dump in hopes of locking in existing cap gains rates – an exercise in futility if Biden and the socialists in Congress decide to make such a tax change retroactive to all of 2021 – Bloomberg quickly polled several Wall Street traders who focused on the policy’s implications for investing, and concluded that while it was too soon to panic, prospects of a higher levy on stock profits could spark near-term selling as investors look to skirt a higher rate.”


1:20 pm

SPX appears to be breaking down through the trendline at 4145.00.  Further confirmation of the reversal occurs at 4100.00, where Short-term support may be broken.   VIX is picking up, now back above the trendline at 18.30.   The SPX appears to be at a near-total loss of liquidity, as it is gapping down.

NDX breaks is short-term trendline at 13800.00, while Short-term support lies at 13677.71.  Take appropriate action.

ZeroHedge tells us, “The reality of the Biden administration’s ‘soak the rich’ plan is finally hitting markets as the details of his new capital gains tax plan are hitting

As Bloomberg reports, President Joe Biden will propose almost doubling the capital gains tax rate for wealthy individuals to 39.6%, which, coupled with an existing surtax on investment income, means that federal tax rates for investors could be as high as 43.4%, according to people familiar with the proposal.”


8:30 am

Good Morning!

SPX futures are flat this morning, suggesting the type of correction it may be (either a flat or a triangle).  It closed above the Cycle Top support at 4161.00, indicating a probable continued rally in Wave (v) of 5.  Speculators seem to be chasing whatever seems to be moving, so this is a confusing time.

ZeroHedge observes, “U.S. index futures traded flat on Thursday morning, rebounding from some early weakness ahead of today’s ECB meeting, as investors assessed earnings from companies, including Southwest Airlines and AT&T, while awaiting weekly jobless claims data for clues on the pace of recovery in the U.S. labor market. Treasury yields steadied near a five-week low.

At 7:30 a.m. ET, Dow e-minis were down 15 points, or 0.04%, S&P 500 e-minis were down 5 points, or 0.11%, and Nasdaq 100 e-minis were down 22 points, or 0.16%.”

ZeroHedge maintains, “Earlier today we showed that hedge fund leverage – both gross and net – has hit record highs according to Goldman’s Prime Brokerage.

It’s not just hedge funds. As Deutsche Bank’s Jim Reid writes in his “Chart of the day” note from this morning, with European equity markets seeing their worst day of the year yesterday and the US market suffering saw noticeable declines across the board “it’s worth being aware that US discretionary equity positioning is now at a record high according to our Equity strategists.”


NDX futures rose in the early morning, but have come down a bit since then.  A decline beneath yesterday’s low may put an end to the rally.

NorthmanTrader observes, “Has the bubble already popped and we haven’t realized it yet? I recognize it could be considered a ludicrous question to even ask considering indices just made new all time highs last Friday and we’re barely down 2% on $SPX.

And frankly I don’t know the answer myself here, but in context of the peak liquidity question I am submitting some data points that suggest that the speculative part of the bubble may have already popped back in February/March.”


Despite the rally in the NDX yesterday, the internals have been awful in the NDX Hi-Lo Index.  As mentioned yesterday, smart money may have been using the rally to reduce their exposure to the NDX.  This is a good indicator of that move.


VIX futures have been consolidating between 17.02 and 17.37 this morning.  It made a 65% retracement of its first rise from the Master Cycle low.  The next rally above the trendline at 18.30 will likely continue above the 50-day Moving Average.


Today is day 259 of the Master Cycle for TNX.  I have indicated that it may have bottomed on April 15 (day 252), but the corrective pattern does not appear complete.  Short-term trend intensity appears to peak tomorrow, so we may see a lower bottom then.

ZeroHedge reports, “After eight consecutive auctions which saw the yield on the recently reintroduced 20Y Treasury rise, moments ago we got the latest 20Y bond auction (in the form of the 19-year 10-month reopening of CUSIP SW9), which saw the first sequential decline in the auction yield, and with a high yield of 2.144%, the April 20Y auction not only was below the March 2.29% high, but also stopped through the When Issued by 0.9bps.

The Bid to Cover was less exciting, dropping from 2.51 to 2.42, which still was above the six-auction average; the internals were mixed, with Indirects taking down 58.7%, down from 61.4% last month and below the recent average of 59.7. But while Indirects were muted, Directs jumped to 20.2%, the highest since the 20Y auction was reintroduced last May. That meant that Dealers were left with just 21.1% which in turn was the lowest since the reintroduction of the 20Y auction.”


USD futures have eased down to an overnight low of 91.00.  The Master Cycle low appears to be in on Tuesday (day 263).  The USD may strengthen as investors increasingly pile into cash.

ZeroHedge reports, “According to a new E-Trade survey shared exclusively with CNBCwealthy investors with at least a million dollars in investable assets are becoming less bullish on stocks in early April than they were at the start of 2021. The survey also revealed the number of respondents who went to cash nearly doubled. 

  • Overall sentiment among millionaire investors slipped as respondents who say they are bearish jumped six percentage points, from 36% to 42%.
  • The survey was conducted from April 1-12 when main US equity markets powered to new highs.
  • One surprising find in the survey was the number of respondents who went into cash more than doubled from 7% to 16%.
  • Still, the majority (58%) of these wealthy investors remain bullish.

The survey findings reveal some insight into the world of retail who have been on a stock and option frenzy since the beginning of the virus pandemic, which began right around the time the Federal Reserve pumped financial markets with trillions of dollars and the federal government unleashed helicopter money and gave tens of millions of folks stimulus checks, where some took the free money and gambled in the stock market casino.

Wealthy investors, some of whom fear a pullback in stocks, are protecting gains by going into cash. Simultaneously, the number of institutional desks warning about market turbulence is increasing. ”


Shares in the NIkkei 225 Index bounced overnight after declining more than 5% since early April.  It is on a sell signal and today’s bounce may offer positioning to sell longs/short Japanese stocks.  Did the BOJ blink?

ZeroHedge comments, “Something happened on Tuesday that hasn’t happened since 2016: Japan’s Topix index (which is widely viewed as more representative of Japanese equities than the Nikkei) tumbled by 1.2% in the morning session…. and the BOJ did not intervene.

Why is this notable? Because – in a world where everyone is now completely used to Plunge Protection Teams and central bank bailouts as if it is a perfectly expected event –  this was the first time since at least 2016 that the Bank of Japan did not make an ETF purchase after the Topix fell more than 1% in the morning session.”


Posted in Published | 3 Comments

April 21, 2021

12:24 pm

SPX has made a 59% retracement of the decline thus far.  A move above this level suggests that the “short squeeze” may have turned into a buy-the-dip fest by retail investors.  The result may be a rally to the Cycle Top at 4212.42 or higher.  However, the daily Cycle Top (not shown) is at 4161.11 where the rally has stopped.  It may also be a retest of support-turned-resistance in the daily chart.

A decline back beneath the trendline at 4130.00 may indicate a failure of the so-called “short-squeeze.”  This could be an effort on the part of dealers and hedge funds to get a better position to short the market themselves.  (I am not suspicious at all!)

ZeroHedge writes, “Less than a week ago we reported that after Morgan Stanley and BofA, Deustche Bank joined the growing bandwagon of sellside researchers warning that the market is facing a period of severe turbulence, investors appear to be heeding the caution in what BofA calls a significant shift to the “increasingly euphoric sentiment.”

Yesterday we reported that according to the latest institutional and HNW client data published by Bank of America, the bank’s flow desk just had seen the biggest outflows in five months as clients were net sellers of a whopping $5.2BN in US stocks last week – the biggest sales since mid-Nov. and fifth-largest on record – which took place just as the S&P 500 reached new highs.”


10:50 am

The GSCI Ag Index continues to move higher on day 259 of its Master Cycle.  It is now above the Head & Shoulder neckline, which may provide some support.  This has already been a strong week for the Ag Index, but supply and demand may keep the index pinned to the top of its range, especially as it begins a Primary Wave [3].  There are indications that it may extend higher before making a top.  An alternate view proposes a “running correction” that may, at worst, revisit the 50-day Moving Average at 392.11 or, at best, remain above the Head & Shoulders neckline.

ZeroHedge considers, “An unusually cold front moved into the Central US early this week, spilling Arctic air throughout the Plains, Midwest, and Tennessee Valley. By Wednesday morning, “record-shattering cold” temperatures have been reported.

From the Canada–US border to Texas, unseasonably cold air has been recorded. For many states in the Central US, temperatures are over 20 degrees below average.

BAMWX meteorologist Kirk Hinz wrote in his latest note that cold air spans from southern Canada to near Mexico on Wednesday morning. He posted a chart of dozens of locations in the Central US that set various cold record lows (some were daily and or monthly records).

ZeroHedge also adds, “Throughout U.S. history, there have always been droughts in the western half of the country from time to time, but what we are dealing with now is truly alarming.  Scientists tell us that a multi-year “megadrought” has developed in the southwestern portion of the country, and this is the worst year of that “megadrought” so far by a wide margin.  If conditions do not radically improve soon, we are going to have a major agricultural disaster on our hands.  Some farmers have already decided not to plant crops at all this year, but many others have decided to plant anyway knowing that if enough rain doesn’t come their crops will certainly fail.”


7:50 am

Good Morning!

SPX futures are flat this morning, hovering near yesterday’s close.  I have illustrated the potential situation in the chart.  There is an (a)-(b)-(c) decline thus far which allows the SPX to go higher in a potential Wave [i]-[ii]-[iii]-[iv]-[v], should it stay above the trendline at 4120.00.  If it declines beneath it, then the current Wave structure prevails and the bear market may begin.

ZeroHedge reports, “S&P futures were little changed, paring earlier declines with the Nasdaq underperforming following dismal Netflix guidance, which saw the company report its worst quarter in 8 years sending the stock 8% lower.  At 7:00a.m. ET, Dow e-minis were up 13 points, or 0.04%, S&P 500 e-minis were up 0.50 points, or 0.01%, and Nasdaq 100 e-minis were down 27 points, or 0.20%.”


NDX futures are down, but may not have yet broken through yesterday’s low at 13730.00.  Keep an eye on this indicator.  A breakdown here may add a fifth wave to the decline, tilting it towards the bear market.

ZeroHedge considers, “A tsunami is a wall of water that wipes out everything in its path, typically caused by earthquakes. But first, the water actually disappears from the usual shoreline, leaving land where there should be sea.

If you are on the shore and see that happen, the correct response is to run for high ground. Tragically, though, people often rush toward this new and unusual sight. It’s hard to blame them; we humans are drawn to the unknown. This impulse explains much of our progress, but it has costs, too.”


The NASDAQ Hi-Lo Index closed at -70.00, giving a sell signal.  The VXN (NDX Volatility Index) is hovering at 24.37, just above the lower trendline of its Ending Diagonal, but beneath the 50-day Moving Average at 27.59.  A pop above the 50-day may confirm what the Hi-Lo Index is telling us.


VIX futures are at  a high of 18.82 and rising.  This portends a lower SPX.  If so, we may also see the 50-day Moving Average being challenged and a potential confirmation of the VIX buy signal.


TNX is hovering just above its April 15 low.  Today is day 258 of the aging Master Cycle.  The 50-day Moving Average at 15.21 may still be exerting a pull to make the  Master Cycle low there, as the Wave pattern appears incomplete.


USD futures are advancing, confirming the Master Cycle low at 90.84 yesterday (day 263).  Tis opens the way for a month-long rally in the USD to the Broadening Wedge trendline at 96.00.  You may have noticed that the USD strengthens as the markets correct.


WTI Crude made a morning low of 61.01, declining beneath both Intermediate-0term support at 62.00 and the 50-day Moving Average at 61.28.  A new sell signal has been made for crude oil.


Posted in Published | Comments Off on April 21, 2021

April 20, 2021

11:55 am

ZeroHedge Reports, “Less than a week ago we reported that after Morgan Stanley and BofA, Deustche Bank joined the growing bandwagon of sellside researchers warning that the market is facing a period of severe turbulence, investors appear to be heeding the caution in what BofA calls a significant shift to the “increasingly euphoric sentiment.”

According to the latest institutional and HNW client data published by Bank of America, the bank’s flow desk just saw the biggest outflows in five months as clients were net sellers of a whopping $5.2BN in US stocks last week – the biggest sales since mid-Nov. and fifth-largest on record – which paradoxically took place just as the S&P 500 reached new highs (“paradoxically” because most investors tend to stay with momentum and buy even more at record high levels).”


10:45 am

SPX has finally declined through its Cycle To support at 4154.38.  This ascending support has been keeping the SPX above it for the past three weeks.  We may see some acceleration to the downside now that this support is broken.


9:40 am

The GSCI Ag Index appears to have made a breakout above its Head & Shoulders neckline on day 258 of its Master Cycle.  There is more overhead resistance at 427.09 (not shown on the daily chart), so it may extend above the neckline.  Whether it extends or not, it may be due for a potentially shallow retracement.

ZeroHedge observes, “Commodities have been the talk of the town over the past several months, with grains, energy, and metals reaching new multi-month highs over the 12 months.

And this has lead to concerns over input costs… and inflation.

That’s where today’s chart comes into play. It is a 25+ year “quarterly” chart of the Thomson Reuters Core Commodity Index.

As you can see, commodities have been in a broad downtrend channel since peaking in 2007-2008. As well, the 25-year stretch has produced an important support/resistance pivot line (marked by red & green arrows).

So why does this matter to the Commodity Index and several select commodities showing strength?”


7:50 am

Good Morning!

NDX futures continue to make new lows hitting 13816.00 at 6:30 am.  There has been a small bounce, but appears corrective.  The breakdown becomes more noticeable and will receive more commentary beneath the 50-day Moving Average at 13295.57.

ZeroHedge comments, “Big Banks Get Stuck… Then Unwind

Before presenting our view on the next potential “gamma squeeze”, we want to share a theory of what may have driven the strong stock market performance over the last few weeks.  On March 25th, it was revealed that a large fund, Archegos, had blown up. Archegos did what many large investment houses do – they traded their position on a SWAP basis.  This essentially means that the brokers (banks) hold Archegos investments, and in this case, the banks were left holding Archegos investments when the fund imploded.  As a result, several banks, including Credit Suisse, were left facing large losses.

At SpotGamma, we are making the assertion that these banks would have been forced to hedge out the long exposure of these SWAPs.  After placing these hedges, we now think that (through a tangled web of counterparty risk and hedging) unwinding them could be the driving force behind the recent market rally. The Archegos debacle could have created a larger immediate hedging reaction across any comparative SWAP position, which amplifies the rate of the unhedging action by the banks.

For evidence, the price movement has been steady and progressive since the start of April.  Specifically, the S&P500 is up 5%, with 15/16 positive days to start the month. The bid feels mechanical, and each day begins with major blocks of stocks trading as big bank losses are revealed.”


The NASDAQ Hi-Lo close down yesterday, but not in the sell zone yet.  We await a closing reading below 0.00.  However, you can see the weakness in the NDX by this indicator.


SPX futures made a low of 4131.38 before a small bounce.  The Chart Model shows the next confirmation at Short-term support at 4063.69, while the two-month trendline is at 4025.00.  Most investors will view the decline as a “slight correction” until those lines are breached.

ZeroHedge reports, “S&P 500 and Nasdaq 100 stock futures extend declines for a second day, with both down about 0.5% as of 7:00 am in New York as travel and leisure stocks led the move, indicating fresh concerns over reopenings. US futures tracked Europe’s Stoxx 600 index which was 1.1% lower, its biggest drop in a month as a growing tally of virus cases primarily in emerging markets tempered enthusiasm for a global growth rebound. Bond yields fell. ”


VIX futures jumped to a new high at 18.77, above the lower trendline at 18.30 and approaching the 50-day Moving Average at 20.99.  It is on an aggressive buy signal and accumulating shares is advised.  The NYS Hi-Lo closed at 204.00 yesterday, down from an intra-day high at 314.00.  We await the Hi-Lo to close below 50.00 to get a sell signal.


TNX appears to be consolidating above its April 15 Master Cycle low.  The Cycles Model suggests a potential period of strength begins today and lasts through the week.  A buy signal lies at Intermediate-term resistance at 16.29.

Bloomberg reports, “The rising tide of U.S. Treasury sales may be cresting — and not a moment too soon.

Steep increases in the size of U.S. government bond auctions over the past year are showing signs of making it difficult to drum up demand.

February’s auction of seven-year debt produced a record low number of bids for the amount being sold. That showed the pool of buyers was taxed after sales of the maturity swelled by $3 billion a month since April 2020 to $62 billion by January. Last month’s auction wasn’t that much better. And 20-year bond offerings have struggled, too, since they returned in May.

But the size of such auctions are poised to start declining later this year, some Wall Street strategists predict, ending a torrid pace of increases as the federal government spent heavily to soften the hit of the pandemic. It would be the first such slowdown since 2016, potentially easing the pressure on a market where yields surged during the first three months of the year on speculation that the economic rebound and federal spending increases will cause inflation to accelerate.”


USD futures have been rising this morning after making a Master Cycle low yesterday (day 262).  This gives the new Master Cycle approximately a month to reach its target at the Broadening Wedge trendline at 96.00.

ZeroHedge comments, “Apparently all it takes to replace a global reserve currency is a digital currency alternative just waiting to be released any moment… and a deep-seated desire to do so.

As regular readers know, China is leaps and bounds ahead of every other central bank and indeed plans to release a digital Yuan in the near future, but for now it supposedly has no interest in dethroning the dollar as the reserve currency… at least according to China.”


Crude Oil made an overnight high of 64.37, then pulled back to 63.38 this morning.  It appears that the Master Cycle high is being put in today at day 273.00.  If so, a breakdown at Intermediate-term support at 61.91 gives us a sell signal.

ZeroHedge comments, “The transition to a global energy system that runs on renewable energy rather than finite and dirty coal, oil, and gas is arguably the number-one topic in the media, sometimes eclipsing even the pandemic. Yet, for all the enthusiastic talk, it seems that we are nowhere near accomplishing the transition—and it may already be too late to do anything about climate change anyway, according to some climate scientists. “Embedded power structures and support for a dying industry”: these are the factors that are keeping oil and gas as the world’s main sources of energy, according to the chief executive of one environmental nonprofit organization.

Speaking to CNBC, Carroll Muffett from the Institute for Environmental Law said, “It is not a matter of the absence of the technology or the inability to do it. If you actually look at what are the cheaper sources of the energy supply right now, it is not really even a matter of economics. It is much more about embedded power structures and continued support of dying industry.” 


Gold futures declined this morning after  making a potential Master Cycle high yesterday at 1790.40 (day 259).  A sell signal is confirmed beneath the 50-day Moving Average at 1753.57.


Posted in Published | 1 Comment

April 19, 2021

2:32 pm

VIX has been challenging its trendline at 18.30 today.  While most investors won’t infer a buy signal in the VIX until it rallies over 25.00, crossing the lower trendline suggests the decline is over.  It may be a good idea to start accumulating VIX futures, options and ETFs at this point.

ZeroHedge relays this information, “After Friday’s big option expiration, SpotGamma points out that both QQQ and IWM start the week at/in a negative gamma position, which implies higher relative volatility in those indices.

There is also now a very wide range in distribution of SPX gamma (gamma is shallow and evenly dispersed 4100-4200 with a large “void” from 4100-4000).”


12:55 pm

SPX has declined beneath its trendline and retested it.  The decline has not yet gone through the Daily Cycle Top support at 4147.88, so caution is advised.  We will see how many layers of support get broken today.  To most investors, this is just another pullback an the road to higher prices.


10:25 am

NDX has broken its Ending Diagonal trendline and may be considered on an aggressive sell signal.  There’s a long way to go for confirmation, so this is for the not faint of heart.  However, at this point, one is not likely to be bothered by raids on short sellers.

RealInvestmentAdvice proclaims, “There is no way this bull market doesn’t end very badly. We all know that is the reality of this liquidity-fueled market, but we keep investing for “Fear Of Missing Out.”

An excellent example of investor exuberance came recently in “Investors Go All In:”

“More importantly, over the past 5-MONTHS, more money has poured into the equity markets than in the last 12-YEARS combined.”

Bull Market End Badly, There Is No Way This Bull Market Doesn’t End Very Badly

If that chart alone doesn’t get your “Spidey senses” tingling, I am not sure what will.”


10:00 am

BKX is challenging the six-month trendline at 123.00 this morning.  Once the trendline is broken, the reversion may go back to revisit last year’s low.  It has been 12.9 months from the 2020 low.  The Cycle Top was broken in March.

ZeroHedge comments, “There was a remarkable disclosure in the latest JPMorgan earnings report: the largest US bank – an entity that historically has best been known for making loans to the broader population – reported that in Q1 its total deposits rose by a whopping 24% Y/Y and up 6% from Q4, to $2.278 trillion, while the total amount of loans issued by the bank was virtually flat sequentially at $1.011 trillion, and down 4% from a year ago.

In other words, for the first time in its history, JPM had 100% more deposits than loans, or inversely, the ratio of loans to deposits dropped below 50% for the third quarter in a row after plunging in the aftermath of the covid pandemic:


8:12 am

Good Morning!

The Shanghai Composite rallied to test the 50-day Moving Average at 3484.48 during its cash session, reaching a high of 3479.01.    There is a small probability of a new high, but the Cycles Model suggests not.  While on a longer-term sell signal, the shorter term dictates patience until the SSEC declined beneath its mid-Cycle support at 34.52.

ZeroHedge comments, “Still recovering, but losing steam

Summary

  • China’s economic growth surged to 18.3% y/y, broadly in line with expectations
  • A big part of this is due to the lower base in Q1 2020
  • Although the overall first quarter growth was driven by production, more recent data suggests that services are taking over, while production growth is slowing
  • We think the recovery will lose steam as the initial pent up demand dies out and because policy support is being scaled back
  • Moreover, trade will not help economic growth as much as it did in the past few months as China’s trading partners are slowing coming out of the pandemic and are requiring less working-from-home and other coronavirus-related exports from China.
  • That is why we stick to our GDP forecast of 7.7% this year
  • Despite the relative positive short term outlook, we remain gloomier for the long term as China’s ageing population, high debt load, weakening productivity growth and increasing international tensions will keep growth below the levels of the past 15 years.”


SPX futures declined to 4170.75, testing the Wave [c] Ending Diagonal trendline.  The daily Cycle Top support (not shown) is at 4140.00 and the Wave (iv) of [c] low is at 4120.00.  These three levels constitute varying degrees of weakness.  Actual sell signals may occur at Short-term support at 4040.00 or the two month trading channel at 4000.00 where the probability of confirmation from the VIX and Hi-Lo Index may support the signals.

By the way, the Cycle which began at the low on March 23, 2020 will have lasted 12.9 months should the turn occur today or tomorrow.  This may constitute a Cyclical sell signal.

ZeroHedge reports, “US equity futures slipped from record highs, European stocks held steady at the start of a new week and Chinese stocks soared the most in five weeks, as investors awaited a fresh round of corporate earnings with global shares sitting at record highs. The dollar slid following the crypto rout over the weekend. Gold rose and oil was flat.

At 07:30 a.m. ET, Dow E-minis were down 81points, or 0.24%, S&P 500 E-minis were down 10.75 points, or 0.26%, and Nasdaq 100 E-minis were down 46points, or 0.3% after briefly rising above Friday’s close during the European morning. Notable movers included Activision Blizzard and PayPal which fell in premarket trading. Tesla slid 1.6% following a deadly crash involving a 2019 Model S that no one appeared to be driving. IBM and United Airlines are due to report.”


NDX futures may (again) be leading the decline.  The morning futures have thus far made a low of 13956.00, handily breaking the short-term Ending Diagonal.  It has a long way to decline before giving a chart sell signal.  However, it was deflected from the daily Cycle Top at 14125.00 and thus may have given a Cyclical sell signal.  In addition, as I pointed out last week, the NASDAQ Hi-Lo is very weak and a decline beneath 0.00 would confirm a sell signal.

ZeroHedge observes, “Archegos shows how leverage is the great accelerator of stock prices on the way up, and on the way down. One of its bets, ViacomCBS, after skyrocketing, collapsed by 60%.

Vast, unreported, and at the time unknown amounts of leverage blew up Archegos Capital Management, dishing out enormous losses to its investors, the banks that brokered the swaps, and holders of the targeted stocks. The amount of leverage became known only after it blew up as banks started picking through the debris. ViacomCBS [VIAC] was one of the handful of stocks on which Archegos placed huge and highly leveraged bets, thereby pushing the shares into the stratosphere until March 22, after which they collapsed by 60%.

Archegos is an example of how leverage operates: It creates enormous buying pressure and drives up prices as leverage builds, and then when prices decline, the leveraged bets blow up as forced selling sets in. Most of the leverage in the markets is unreported until it blows up. The only type of stock-market leverage that is reported is margin debt – the amount that individuals and institutions borrow against their stock holdings as tracked by FINRA at its member brokerage firms. Margin debt is an indicator for overall leverage, and it has reached the zoo-has-gone-nuts level.

FINRA reported on Friday that margin debt jumped by another $9 billion to $823 billion in March, having soared by $163 billion in five months, and having exploded by 72% from March 2020 and by 51% from February 2020, to historic WTF highs:”


VIX futures surged to 17.25, a new high since the Master Cycle low last Wednesday.  It has risen above the Cycle Bottom support at   15.83 and will start getting confirmation above the trendline at 18.50.  The 50-day Moving Average is at 21.14, last seen in February 2020.


TNX is rising again, reaching 16.15 this morning.  Intermediate-term resistance is at 16.24, above which lies a buy signal.  Further confirmation lies at the Cycle Top resistance at 17.16.  Should it break through, the new Master Cycle may continue through the month of May.  Resistance may be found at 19.71, the high achieved in November 2019.


Posted in Published | 1 Comment

April 16, 2021

7:20 am

Good Morning!

NDX futures lagged in the overnight session until 6:00 am, when it began to surge to a new futures high, just in time for Index options expiration at the open.  Open interest in index calls at 14000.00 is 691 contracts.  Open interest in 14000.00 puts is 120 contracts.  Open interest falls off dramatically in either direction for both puts and calls.  It appears that big money has a lot hanging on the NDX 14000.00.

ZeroHedge reports, “The following is an excerpt from a recent Market Comment featured on The Felder Report PREMIUM

As most readers should be well aware, one of the things I monitor most closely is insider buying and selling. Nobody knows more about the bullish and bearish developments of a business and its valuation relative to those developments than the company’s top executives. Now some believe that, while insider activity may sometimes be a good indication of future price movements in individual stocks, in aggregate it doesn’t have any meaning at all. In addition, many suggest that, while insider buying may be predictive at times, insider selling is not. Both of these positions, however, are contradicted by the data.

As Nejat Seyhun, Professor of Finance at the University of Michigan, has demonstrated in his book, Investment Intelligence From Insider Trading, the aggregate selling-to-buying ratio over certain periods of time has a very good track record at predicting future returns in the stock market. In his words, “Aggregate insider trading predicts aggregate stock returns.” Furthermore, “Aggregate insider trading predicts changes in future economic growth up to two years ahead.” So not only are insiders better market strategists than those on Wall Street, they are also better economists.


The NDX Hi-Lo Index shows a a singular lack of interest as only about 4.25% of NASDAQ stocks are making new 52-week highs as of yesterday.  Point 6 was made in March and it appears that the NASDAQ is on the verge of a sell-off.  A NASDAQ sell signal is made below 0.00. It doesn’t have far to fall.


SPX futures are making a new all-time high at 4168.38 as of 7:52 am.  There is open interest of 11003 contracts for the 4150 calls, 7500 contracts for the 4175 calls and 13178 contracts for the 4200 calls this morning.  There are 7903 put contracts at 4150, but it drops off to 154 put contracts at 4175. All of these contracts expire at the open.

ZeroHedge reports, “US equity futures and global stocks rose to new record highs and oil climbed after strong U.S. and Chinese economic data bolstered expectations of a solid global recovery from the covid pandemic. At 7:00 a.m. ET, Dow e-minis were up 34 points, or 0.1%, S&P 500 e-minis were up 5 points, or 0.11% to a new all time high of 4,167, and Nasdaq 100 e-minis erased a decline of as much as 0.4% to trade little changed as of 7:20am in New York.

The benchmark S&P 500 and the blue-chip Dow are on course for their fourth straight week of gains, while the Nasdaq is less than a percent below its own all-time peak despite some turbulence last month. With the first-quarter corporate earnings season under way, focus will be on results from Morgan Stanley after bumper earnings earlier this week from JPMorgan, Goldman and Bank of America that reinforced hopes of a swift economic rebound. Oil companies, mainly Chevron Corp, Marathon Petroleum, Exxon Mobil Corp and Occidental Petroleum, gained between 0.3% and 1.1% as oil prices rose.”


VIX futures dove to 16.30 this morning as the options expiration surge is underway.  Options expiration occurred on Wednesday for the VIX, although ETF options do expire today.  At 8:00 am VIX bounced and appears that it may opend in positive territory.


Banks’ earnings season has not given the BKX a boost needed to finish the Master Cycle at a new all-time high.  Today is day 248 in the Master Cycle.  Further erosion may cross the Ending Diagonal support line and 50-day Moving Average at 120.31, giving it an early ending.   This may also put an end to the liquidity surge evident since last September.

ZeroHedge rpeorts, “Bank earnings season concluded as usual with Morgan Stanley reporting record earnings that smashed on the top and bottom line, but as with other banks the stock dropped for two reasons: i) MS was, naturally, priced to perfection and ii) it reported an unexpected $911 million loss tied to the collapse of Archegos which marred an otherwise pristine quarter.

First, the big picture:

  • Q1 EPS $2.19, Exp. 1.70 and up from 1.01; tax rate was 22% up from 17.1% a year ago.
  • Q1 Revenue 15.7BN, above the exp. 14.09BN.
    • Investment Banking Revenue: 2.61bln (exp. 2.01bln)
    • Wealth Management Revenue: 5.96bln (exp. 5.72bln) “brought in flows of 10bln”
  • Net Interest Income (NII): 2.03bln (exp. 1.51bln)
  • CET1 Ratio: 16.8% (exp. 17.48%)”


TNX appears to have reversed higher after yesterday’s Master Cycle low on day 252.  A buy signal is given above Intermediate-term resistance at 16.19.  Once it breaks free from its Cycle Top at 17.08, it may progress to its next resistance level at 19.71.

ZeroHedge observes, “Amid the worst quarter for Treasuries since 1980, there was at least one big buyer.

For the 4th straight month, China bought US Treasuries in February (the latest period for which we now have data). That is the biggest holding since July 2019 and the longest buying streak since 2017.

Source: Bloomberg

But overall, foreigners were net sellers of Treasuries in Feb, dumping $65.5bn.”


USD futures appear to have reversed at the 50-day moving Average at 91.55 yesterday on day 258 of its Master Cycle.  The next move appears to be another attempt at the Cycle Top resistance at 94.83 or the Broadening Wedge trendline at 96.00.


Posted in Published | Comments Off on April 16, 2021

April 15, 2021

12:00 pm

An interesting move in TNX on day 252 of the Master Cycle.  It may be declining to 14.97, the bottom of Wave [a] to create an Expanded Flat correction.  As usual, the trend-followers have tired of their UST short positions and are taking profits…at precisely the wrong time!  The move appears to be finished but may need another day of decline to  finish its retracement.  That may also put the reversal in stocks on hold for another day.

ZeroHedge reports, “Despite soaring vaccination rates, surging economic data and spiking inflation prints, Treasury yields have been (unexpectedly) plunging in the last few days with 10Y, for example, down 15bps this week alone, to its lowest in five weeks…

Source: Bloomberg

Yields are tumbling across the entire curve as 30Y seemed to find resistance at the Nov 2019 highs just too much to break…”


11:09 am

The NASDAQ Hi-Lo Index appears much weaker than the NYSE.  The first major foray beneath the lower trendline was on March 4 at -113.00.  However, it appears that the decline on March 25 may have been the “real Point 6.”   A dip below 0.00 creates the sell signal.  It appears that the Mega-Tech stocks are dominating again to make a new all-time high.


10:30 am

Earlier this week I hade mentioned that several indicators suggested the end is closer than one would surmise.  This is one of them.  The NYSE Hi-Lo made its Master Cycle low on March 24 at -144.00.  This low appears to be “point 6” in the Orthodox Broadening Top formation.  “Point 7” appears to have been made on April 5 at 499.00, a 76% retracement of the prior decline.  While this retracement is larger than the expected 38.2 – 50% retracements normally seen in this formation, the pattern remains true to form.  That suggests we are very close to activation with a potential minimum of 2450.00 stocks making new 52-week lows over the next month, compared to 2375.00 new 52-week lows in March 2020.

Wave E of the Triangle formation may have been made yesterday (unless today’s rise goes above 488).   In either event, a decline below 62.00 gives a potential sell signal.


9:55 am

The Ag Index opened higher, then receded beneath round number support at 400.00.  Should it rise above a long-standing resistance/neckline at 410.00 we may see a rise matching or exceeding the last nine months.  However, the inability to rise above the trendline suggests a possible deeper retracement during May before moving higher.

ZeroHedge reports, “Chicago corn futures rallied to 2013 levels Wednesday as concerns about cold weather slowing US seeding caught traders’ attention, according to Reuters.

Temperatures across the Corn Belt, mainly in the midwestern US, roughly covering western Indiana, Illinois, Iowa, Missouri, eastern Nebraska, and east Kansas, will experience well below average temperatures through this weekend. On a separate note, we covered how the cold spell has led to another Texas power crisis.

The cold blast has likely delayed seeding across the Corn Belt as farmers wait for warmer temperatures. Planting corn in cooler climates is still possible, but colder soil can take corn kernels much longer to germinate and increases the risk of seedling death. ”


8:45 am

Contrary to ZeroHedge’s claims, NDX futures have not made new all-time highs in the overnight session.  The futures made a near-Fibonacci 63% retracement of yesterday’s decline.  Should it turn down before reaching 14000.00, the indications are that the decline may have begun.  The NDX appears to be following the weakening lead of the Chinese Tech stocks.

ZeroHedge observes, “On the surface, markets appear very strong and healthy. Many broad indices are making new highs, expectations are for another quarter of strong earnings, and the tactical backdrop in terms of flow remains very supportive. More importantly, many of the “old” bear arguments around valuation, duration of the bull market and extreme sentiment & positioning have not worked at all for the past few months and feel pre-historically irrelevant (even though of course they should not as they one day will matter). However, when we peer a bit closer there are some early signs that would signal caution. This might not be the optimal time to increase risk but rather trim it.

1.      Hedge funds not chasing key leaders

Net flows in Cyclicals have turned towards selling globally over the past 3 weeks and Growth is also not being bought. Hedge funds are not chasing mega cap TMT, manifested through selling of semis for over a month now and selling of software over the past week. This means that two of the most important “leading” segments of the market are not feeling the love from the smart-money community.

JPM Position Intelligence team goes further: “The biggest pain trade appears to be a broad market decline that leads to more absolute losses, especially if Defensive outperform vs Cyclicals and Growth”.


The Shanghai Composite broke down beneath its mid-Cycle support at 3400.33, confirming the sell signal. A decline beneath the trendline at 3250.00 indicates a continuation to point 6 in the Orthodox Broadening Top.  The Cycles Model suggests the first stop in the decline may occur in the first week of May.  The estimated target appears to be 2900.00 – 2950.00.

11:15 am

ZeroHedge reports, “The ongoing decline in China’s credit impulse, which we have discussed extensively here in recent weeks, just made its latest appearance and the market was not happy.

Chinese stocks fell on Thursday, after the central bank underscored its intention to contain leverage and pursue policy normalization by adding just enough cash to maintain medium-term liquidity.

On Thursday, the PBOC injected 150 billion yuan ($23 billion) into the financial system on Thursday with its medium-term lending facility. That was slightly less than the medium-term lending facilities due in April even as liquidity is set to tighten this month, with 100 billion yuan due and 56.1 billion yuan of targeted loans maturing on April 25.

The PBOC withdrew a net 40.5 billion yuan of one-year funds in the first quarter, as policy makers address the twin challenge of a buildup in leverage while supporting the economic recovery from the pandemic. The tightening ricocheted through markets, with the main equity gauge falling from the highest in more than a decade while the benchmark money-market rate jumped to a three-year high in February.”


SPX futures beat yesterday’s high by three points this morning.  It remains to be seen whether the cash market will do the same.  A typical pattern may be that the hedgies and dealers set their algos loose in the early morning to see if they can get a rise out of the retail market.

ZeroHedge reports, “Despite a bevy of banks now warning that this is as good as it gets and a sharp market correction is imminent, nothing could spoil the markets party overnight, overnight we saw futures reverse a modest weakness and rebound back to all time highs as investors cheered solid earnings reports from companies including Bank of America and BlackRock and waited what should be a blockbuster retail sales report.

At 8:00 a.m. ET, Dow e-minis were up 161  points, or 0.47%, S&P 500 e-minis were up 22.25 points, or 0.56%, and Nasdaq 100 e-minis were up 114.75 points, or 0.83%.

“We are probably entering the last stage of the pricing of the growth acceleration, and we see encouraging signs suggesting the ‘reflationary’ environment can continue and be supportive for risky assets in the near term,” Goldman Sachs Group Inc. strategists led by Alessio Rizzi wrote in a note. “Across assets we continue to prefer equity over credit, and favor a pro-cyclical stance within equity.”


TNX appears to have completed its retracement this morning at 15.90 on day 252 of the Cycles Model.  In other words, a turn may be imminent.  Should TNX rise above 17.00 in the next two days, all hell (literally) may break loose as options owners and dealers scramble through expiration to avoid losses.

Investing considers, “It will be gradual, with ample advance notice. And it’ll only begin once the economy has “fully recovered.” That, at least, is the plan for raising interest rates at some point in the future, Federal Reserve Chair Jerome Powell explained late last month. The key question: Will the economy cooperate?

More specifically, will inflation remain sufficiently tame to permit Powell and company to slowly take away the monetary punch bowl?

“We are strongly committed to inflation that averages 2% over time,” the Fed chair says. “If it were to be higher or lower than that, then we’d use our tools to move inflation back to 2%.”

Fed Vice Chair Richard Clarida also outlined the current plan for gradual policy tightening, explaining that the central bank is intent on leaving rates unchanged until inflation’s running at 2%. “We are not going to lift off until we get inflation at 2% for a year. … We are trying to tie our hands. We are saying we are not going to hike until we get to 2%.”


USD futures challenged the 50-day Moving Average at 91.50, then appears to have bounced, suggesting the new Master Cycle may be bullish.  If so, it has another 30 days to go for a Master Cycle high .  The target appears to be between the Cycle Top resistance at 94.88 and the Broadening Wedge trendline at 96.00.


Posted in Published | 1 Comment

April 14, 2021

3:04 pm

Using the Cycle Top trendline as an Ending Diagonal, we may take a small (aggressive) short position here.  There’s a long way to go to get confirmation, so patience is still the key word.

ZeroHedge observes, “Having surged from an open at $381 to almost $430, COIN has tumbled back to $375…

And the moment COIN broke its opening print, US equity markets appeared to puke…

Is this really the market now? …as goes COIN, so goes US stocks?

Bitcoin also legged lower…”


8:10 am

Good Morning!

The Ending Diagonal has narrowed down to an impossibly thin space (24 points).     SPX futures have been confined to an even narrower space (4130.00 – 4139.00).  EW relationships suggest the final high may be near 4200.00.  Following that, a  breakdown may be imminent, just in time for options expiration.


VIX futures have dipped again, with a possible low at 15.70.  If so, VIX has a new Master Cycle low on day 246 of the current Master Cycle.  There is no surprise here.  VIX options/futures expire at the end of today.

Sven Henrich tells us, “m a very lonely voice in equity markets right now. Technically nothing has really surprised me yet, not the VIX crush to the February gap fill, nor the move toward the 4156 zone on ES, all of these were part of the risk spectrum since the beginning of the year. The only surprise here is the velocity of the prices, the complete lack of respect for any deviating correlations such as moves in the dollar and yields.

Everything continues to be ignored. But because things are ignored doesn’t mean they don’t matter.

Nothing matters inside of a bubble until it does. The phrase new paradigm is becoming ever more prevalent to justify prices and the tape. Truth be told, there is no new paradigm except this one: More artificial liquidity than ever and more debt spending than ever and as a result people chasing stocks into higher valuations than ever.

That’s it. There is no mystery.”


Posted in Published | Comments Off on April 14, 2021

April 13, 2021

9:55 am

NDX just made a new all-time high, confirming the Ending Diagonal formation in it, also.  It appears that the Cycle Top resistance at 14058.60 may be the stopper.  A nearby trendline (not shown) is at 14100.00.  Standby for some fireworks!


8:00 am

Good Morning!

SPX futures are down, making an overnight low of 4101.62.  We await the crossing of the Short-term support at 3997.28 (4000.00) for an aggressive sell signal, unless otherwise indicated by the VIX and Hi-Lo.  I have carefully considered all of the indicators (VIX, Hi-Lo, etc.) and have concluded that the end may be closer than we think.  This observation supports an Ending Diagonal, which has been camouflaged by all the stimulus and liquidity thrown at the market.  An Ending Diagonal may end this week.

ZeroHedge reports, “After trading flat for much of the overnight session in anticipation of today’s key event, the CPI report (due out at 830am ET), US equity futures and European markets tumbled at precisely 7am after a report that the US will pause Johnson & Johnson vaccines amid health concerns, potentially dealing a blow to efforts to reopen the world’s largest economy.

Futures on the S&P 500 fell and reopening sensitive Russell 2000 contracts lost almost 1% after the New York Times reported and FDA confirmed that the US would will call for an immediate pause in use of Johnson & Johnson’s single-dose coronavirus vaccine  after six U.S. recipients developed a rare disorder involving blood clots. All the six recipients were women between the ages of 18 and 48. One woman died and a second woman in Nebraska has been hospitalized in critical condition, the NYT reported.”


The Shanghai Composite just crossed beneath mid-cycle support at 3401.15, which doubly confirms its sell signal.  If my thesis that China equities will lead the decline is correct, this is a warning shot that the air is being let out of the bubble.

ZeroHedge reports, “Last Tuesday we reported that”China Credit Impulse Is Set To Collapse As Beijing Orders Banks To Curtail Loan Growth For Rest Of 2021“, and just a few days later we got the latest confirmation of this critical – for the global economy – transition.

Overnight, China reported that the sequential growth of total social financing (TSF) moderated in March following a strong rebound in January and February, with robust loan growth offset by a contraction in shadow lending.


As mentioned before, the NDX appears to be following the tech-heavy Shanghai Composite.  NDX futures are putting up a valiant struggle, but have not gone higher than 13833.00 in the overnight session.  I am sticking to my guns that the peak was made in mid-February and this secondary high is due for a collapse at any time.   The NDX may lead the domestic equities on their way down by following China’s lead globally.

ZeroHedge observes, “On one hand, the coming earnings season (77% of the S&P 500 market cap will announce results between April 19 and May 7) will be one of the strongest on record at least when measured on a Y/Y basis for the simple reason that Q1 2020 was the first quarter of the covid pandemic. On the other hand, as Deutsche Bank’s Binky Chadha writes, the sellside now expects impressive beats having lifted the bar high enough to where just mere “strong” EPS reports may not be sufficient (incidentally, consensus currently forecasts aggregate sales growth of 5%, margin expansion of 66 bps to 9.9%, and EPS growth of 19%. However, median EPS growth will be only 10%).  Finally, as Goldman notes, no matter how strong earnings are, they will not matter and instead all investors will care about is future guidance which however may be quite disappointing due to the recent surge in input costs which could lead to a big hit to projected profit margins.”


VIX futures appear to be consolidating within yesterday’s trading range.  Options expiration for the VIX is tomorrow and it may perhaps continue range-bound until options expire.


TNX hit an overnight high at 17.03 before pulling back.  With only a week left in the Master Cycle, it appears that the path of least resistance is down to the 50-day Moving Average.  Nervous investors in stocks may still think of treasuries as the primary “safe haven,” pushing down yields as they exit stocks.

ZeroHedge observes, “The Fed tipped its hand today, and unveiled its “viral reaction function” revealing the timetable according to which the Fed will start talking about QE tapering.

As discussed previously, James Bullard, president of the St. Louis Federal Reserve, said in an interview with Bloomberg Television that getting 75% of Americans vaccinated would be a signal that the pandemic was ending, which is a necessary condition for the central bank to consider tapering its bond-buying program. According to our calculations, extrapolating current vaccination rates would mean that – all else equal – we could see the Fed’s 75% bogey be hit in just two short months.”


USD futures appear to be testing Intermediate-term support at 91.89.  Should the support hold, USD may end its Master Cycle at the Cycle Top at 95.02.  There are two weeks left in this session and a liquidation in the equities markets may find solace in the cash dollar.


Gold futures bounced this morning, but did not break out of yesterday’s trading range.  It appears that the April 8 high at 1759.40 was the end of the Master Cycle (day 248), unless something dramatic happens in the next week or two.  If my observation is correct, the next Master Cycle low is due in early June.  The whipsaws of the past nine months may give way to an utter collapse in that period, ,due to the multiple bearish formations.


Posted in Published | Comments Off on April 13, 2021

April 12, 2021

1:23 pm

The tension may have eased with the TNX today after a mediocre auction.  At least no sparks were flying.  The current Master Cycle ends on options expiration.  We may see a test of the 50-day Moving Average at 14.54 b then.

ZeroHedge reports, “Shortly after today’s first bond auction, the $58BN in 3Y notes which saw brisk demand at 1130am ET this morning, moment ago the US Treasury held the second coupon sale for the day when it sold $38 billion in a closely watch 9-year 10-month reopening.

This auction was less enticing to buyers, stopping at a yield of 1.680%, which was the highest since January 2020 and also tailed the When Issued 1.678% by 0.2bps.

The bid-to-cover of 2.36 was in line with recent auctions, which have averaged 2.39 in the past 5 months, if the lowest since December.

The internals were a little better, with Indirects taking down 59.6% of the auction, up from 56.8% and in line with the recent average of 60.0%. And with Directs taking down 16.2%, or the lowest since December as well, Dealers were left holding 24.2%, almost exactly on top of the recent average.

Overall, a mediocre, forgettable auction, however good enough to avoid a market puke, and certainly nowhere close to the devastation unleashed by the catastrophic, infamous 7Y auction at the end of February which started the March bond market turmoil.”


8:30 am

Good Morning!

Its funny how just a few points can make a big difference in the outlook of the Waves and Cycles.   SPX futures have faded this morning, but no significant moves yet. I cleaned up the chart to reflect more accurately what may be transpiring.  Minute Wave [iv] appears to be imminent.  Looking ahead, trending strength appears to peak at the end of this week, just in time for options expiration.   That suggests just a few days of weakness leading up to the final push higher.

ZeroHedge reports, “Global stock markets and US equity index futures dipped modestly with shares in Europe and Asia as traders weighed inflation risks, an uneven global recovery and the latest upbeat economic outlook from Washington. After sprinting to close at an all time high on optimism that vaccination programs and the easing of lockdowns to combat COVID-19 would bode well for an economic rebound, S&P 500 futures were cautious to start the new week as investors waited to see whether U.S. earnings would justify sky-high valuations, while a rally in bonds could be tested by what should be strong readings for U.S. inflation and another round of blockbuster retail sales this week.

MSCI’s All Country World Index was down 0.25% after the start of European trading, off Friday’s record high. The gauge’s price-to-earnings ratio is at its highest level since early 2010. At 07:30 a.m. ET, Dow E-minis were down 43 points, or 0.13%, S&P 500 E-minis were down 5 points, or 0.13% and Nasdaq 100 E-minis were down 38 points, or 0.27%.


VIX futures rose to a morning high of 17.52.  A move above 18.50 will cross above the trendline.  A good start.  VIX may be back to its role as a leading indicator as VIX may now rise as stocks are rising.

ZeroHedge asks, “Will the real consensus number please stand up?

Perhaps the most important question for equities in the coming weeks is what the “real consensus” is into Q1 numbers.

DataTrek: “The Street is looking for 24.5 percent S&P 500 earnings growth in Q1 2021 versus Q1 2020, but the market likely has its eyes set on something closer to 30-35 percent growth. Heres why:

Wall Street analysts have consistently guessed way too low in terms of corporate earnings since their trough in Q2 2020. The average quarterly beat since the pandemic lows has been 13 points”

Deutsche Bank is onto the same theme. Binky Chadha writes: “the consensus is for a modest 1.5% qoq sa growth, down from +27.1% in Q3; and +8.6% in Q4. From a top-down perspective, we note that this 1.5% growth in earnings is about the GDP growth expected by DBs economists in Q1, and looks too low considering a typical multiplier of 4x”.”


TNX rose above its Cycle Top support at 16.73, but slipped back beneath it.  With the current Master Cycle due to end in the next week or so, it is possible that it may end at a low (Wave 4).  This opens the possibility of TNX testing the 50-day Moving Average at 14.54 as a prelude to Wave 5.


USD futures slipped beneath mid-Cycle support at 92.19, suggesting a new Master Cycle low by mid-May.  A new high reaching the Cycle top has been relegates to an alternate status.  There is no sell signal until ASD crosses beneath the 50-day Moving Average at 91.44.


Posted in Published | Comments Off on April 12, 2021