
11:55 am
ZeroHedge Reports, “Less than a week ago we reported that after Morgan Stanley and BofA, Deustche Bank joined the growing bandwagon of sellside researchers warning that the market is facing a period of severe turbulence, investors appear to be heeding the caution in what BofA calls a significant shift to the “increasingly euphoric sentiment.”
According to the latest institutional and HNW client data published by Bank of America, the bank’s flow desk just saw the biggest outflows in five months as clients were net sellers of a whopping $5.2BN in US stocks last week – the biggest sales since mid-Nov. and fifth-largest on record – which paradoxically took place just as the S&P 500 reached new highs (“paradoxically” because most investors tend to stay with momentum and buy even more at record high levels).”
10:45 am

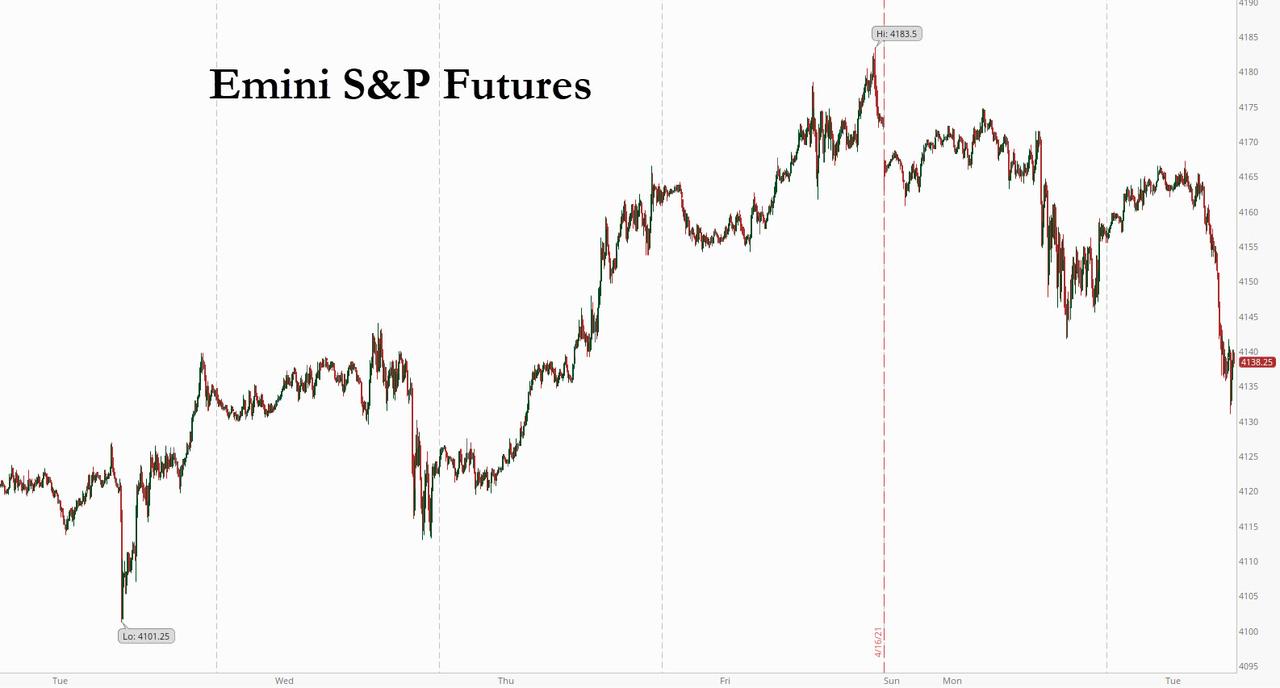
SPX has finally declined through its Cycle To support at 4154.38. This ascending support has been keeping the SPX above it for the past three weeks. We may see some acceleration to the downside now that this support is broken.
9:40 am

The GSCI Ag Index appears to have made a breakout above its Head & Shoulders neckline on day 258 of its Master Cycle. There is more overhead resistance at 427.09 (not shown on the daily chart), so it may extend above the neckline. Whether it extends or not, it may be due for a potentially shallow retracement.
ZeroHedge observes, “Commodities have been the talk of the town over the past several months, with grains, energy, and metals reaching new multi-month highs over the 12 months.
And this has lead to concerns over input costs… and inflation.
That’s where today’s chart comes into play. It is a 25+ year “quarterly” chart of the Thomson Reuters Core Commodity Index.
As you can see, commodities have been in a broad downtrend channel since peaking in 2007-2008. As well, the 25-year stretch has produced an important support/resistance pivot line (marked by red & green arrows).
So why does this matter to the Commodity Index and several select commodities showing strength?”
7:50 am

Good Morning!
NDX futures continue to make new lows hitting 13816.00 at 6:30 am. There has been a small bounce, but appears corrective. The breakdown becomes more noticeable and will receive more commentary beneath the 50-day Moving Average at 13295.57.
ZeroHedge comments, “Big Banks Get Stuck… Then Unwind
Before presenting our view on the next potential “gamma squeeze”, we want to share a theory of what may have driven the strong stock market performance over the last few weeks. On March 25th, it was revealed that a large fund, Archegos, had blown up. Archegos did what many large investment houses do – they traded their position on a SWAP basis. This essentially means that the brokers (banks) hold Archegos investments, and in this case, the banks were left holding Archegos investments when the fund imploded. As a result, several banks, including Credit Suisse, were left facing large losses.
At SpotGamma, we are making the assertion that these banks would have been forced to hedge out the long exposure of these SWAPs. After placing these hedges, we now think that (through a tangled web of counterparty risk and hedging) unwinding them could be the driving force behind the recent market rally. The Archegos debacle could have created a larger immediate hedging reaction across any comparative SWAP position, which amplifies the rate of the unhedging action by the banks.
For evidence, the price movement has been steady and progressive since the start of April. Specifically, the S&P500 is up 5%, with 15/16 positive days to start the month. The bid feels mechanical, and each day begins with major blocks of stocks trading as big bank losses are revealed.”

The NASDAQ Hi-Lo close down yesterday, but not in the sell zone yet. We await a closing reading below 0.00. However, you can see the weakness in the NDX by this indicator.

SPX futures made a low of 4131.38 before a small bounce. The Chart Model shows the next confirmation at Short-term support at 4063.69, while the two-month trendline is at 4025.00. Most investors will view the decline as a “slight correction” until those lines are breached.
ZeroHedge reports, “S&P 500 and Nasdaq 100 stock futures extend declines for a second day, with both down about 0.5% as of 7:00 am in New York as travel and leisure stocks led the move, indicating fresh concerns over reopenings. US futures tracked Europe’s Stoxx 600 index which was 1.1% lower, its biggest drop in a month as a growing tally of virus cases primarily in emerging markets tempered enthusiasm for a global growth rebound. Bond yields fell. ”

VIX futures jumped to a new high at 18.77, above the lower trendline at 18.30 and approaching the 50-day Moving Average at 20.99. It is on an aggressive buy signal and accumulating shares is advised. The NYS Hi-Lo closed at 204.00 yesterday, down from an intra-day high at 314.00. We await the Hi-Lo to close below 50.00 to get a sell signal.

TNX appears to be consolidating above its April 15 Master Cycle low. The Cycles Model suggests a potential period of strength begins today and lasts through the week. A buy signal lies at Intermediate-term resistance at 16.29.
Bloomberg reports, “The rising tide of U.S. Treasury sales may be cresting — and not a moment too soon.
Steep increases in the size of U.S. government bond auctions over the past year are showing signs of making it difficult to drum up demand.
February’s auction of seven-year debt produced a record low number of bids for the amount being sold. That showed the pool of buyers was taxed after sales of the maturity swelled by $3 billion a month since April 2020 to $62 billion by January. Last month’s auction wasn’t that much better. And 20-year bond offerings have struggled, too, since they returned in May.
But the size of such auctions are poised to start declining later this year, some Wall Street strategists predict, ending a torrid pace of increases as the federal government spent heavily to soften the hit of the pandemic. It would be the first such slowdown since 2016, potentially easing the pressure on a market where yields surged during the first three months of the year on speculation that the economic rebound and federal spending increases will cause inflation to accelerate.”

USD futures have been rising this morning after making a Master Cycle low yesterday (day 262). This gives the new Master Cycle approximately a month to reach its target at the Broadening Wedge trendline at 96.00.
ZeroHedge comments, “Apparently all it takes to replace a global reserve currency is a digital currency alternative just waiting to be released any moment… and a deep-seated desire to do so.
As regular readers know, China is leaps and bounds ahead of every other central bank and indeed plans to release a digital Yuan in the near future, but for now it supposedly has no interest in dethroning the dollar as the reserve currency… at least according to China.”

Crude Oil made an overnight high of 64.37, then pulled back to 63.38 this morning. It appears that the Master Cycle high is being put in today at day 273.00. If so, a breakdown at Intermediate-term support at 61.91 gives us a sell signal.
ZeroHedge comments, “The transition to a global energy system that runs on renewable energy rather than finite and dirty coal, oil, and gas is arguably the number-one topic in the media, sometimes eclipsing even the pandemic. Yet, for all the enthusiastic talk, it seems that we are nowhere near accomplishing the transition—and it may already be too late to do anything about climate change anyway, according to some climate scientists. “Embedded power structures and support for a dying industry”: these are the factors that are keeping oil and gas as the world’s main sources of energy, according to the chief executive of one environmental nonprofit organization.

Speaking to CNBC, Carroll Muffett from the Institute for Environmental Law said, “It is not a matter of the absence of the technology or the inability to do it. If you actually look at what are the cheaper sources of the energy supply right now, it is not really even a matter of economics. It is much more about embedded power structures and continued support of dying industry.”

Gold futures declined this morning after making a potential Master Cycle high yesterday at 1790.40 (day 259). A sell signal is confirmed beneath the 50-day Moving Average at 1753.57.