
2:32 pm

VIX has been challenging its trendline at 18.30 today. While most investors won’t infer a buy signal in the VIX until it rallies over 25.00, crossing the lower trendline suggests the decline is over. It may be a good idea to start accumulating VIX futures, options and ETFs at this point.
ZeroHedge relays this information, “After Friday’s big option expiration, SpotGamma points out that both QQQ and IWM start the week at/in a negative gamma position, which implies higher relative volatility in those indices.
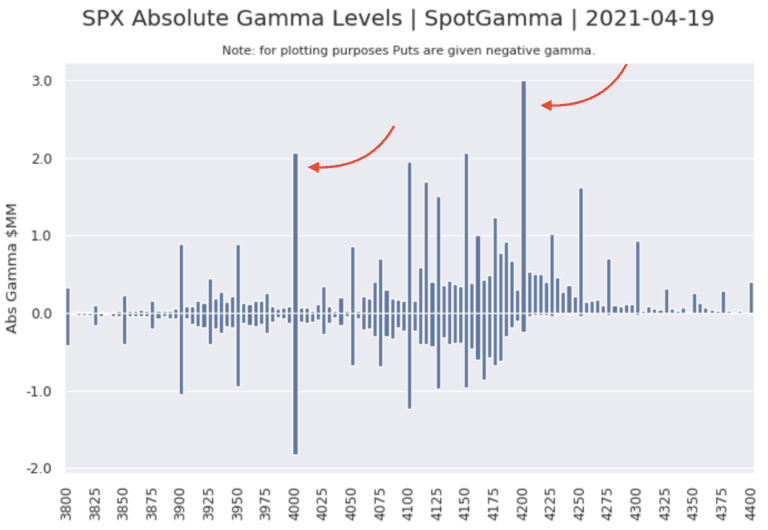
There is also now a very wide range in distribution of SPX gamma (gamma is shallow and evenly dispersed 4100-4200 with a large “void” from 4100-4000).”
12:55 pm

SPX has declined beneath its trendline and retested it. The decline has not yet gone through the Daily Cycle Top support at 4147.88, so caution is advised. We will see how many layers of support get broken today. To most investors, this is just another pullback an the road to higher prices.
10:25 am

NDX has broken its Ending Diagonal trendline and may be considered on an aggressive sell signal. There’s a long way to go for confirmation, so this is for the not faint of heart. However, at this point, one is not likely to be bothered by raids on short sellers.
RealInvestmentAdvice proclaims, “There is no way this bull market doesn’t end very badly. We all know that is the reality of this liquidity-fueled market, but we keep investing for “Fear Of Missing Out.”
An excellent example of investor exuberance came recently in “Investors Go All In:”
“More importantly, over the past 5-MONTHS, more money has poured into the equity markets than in the last 12-YEARS combined.”
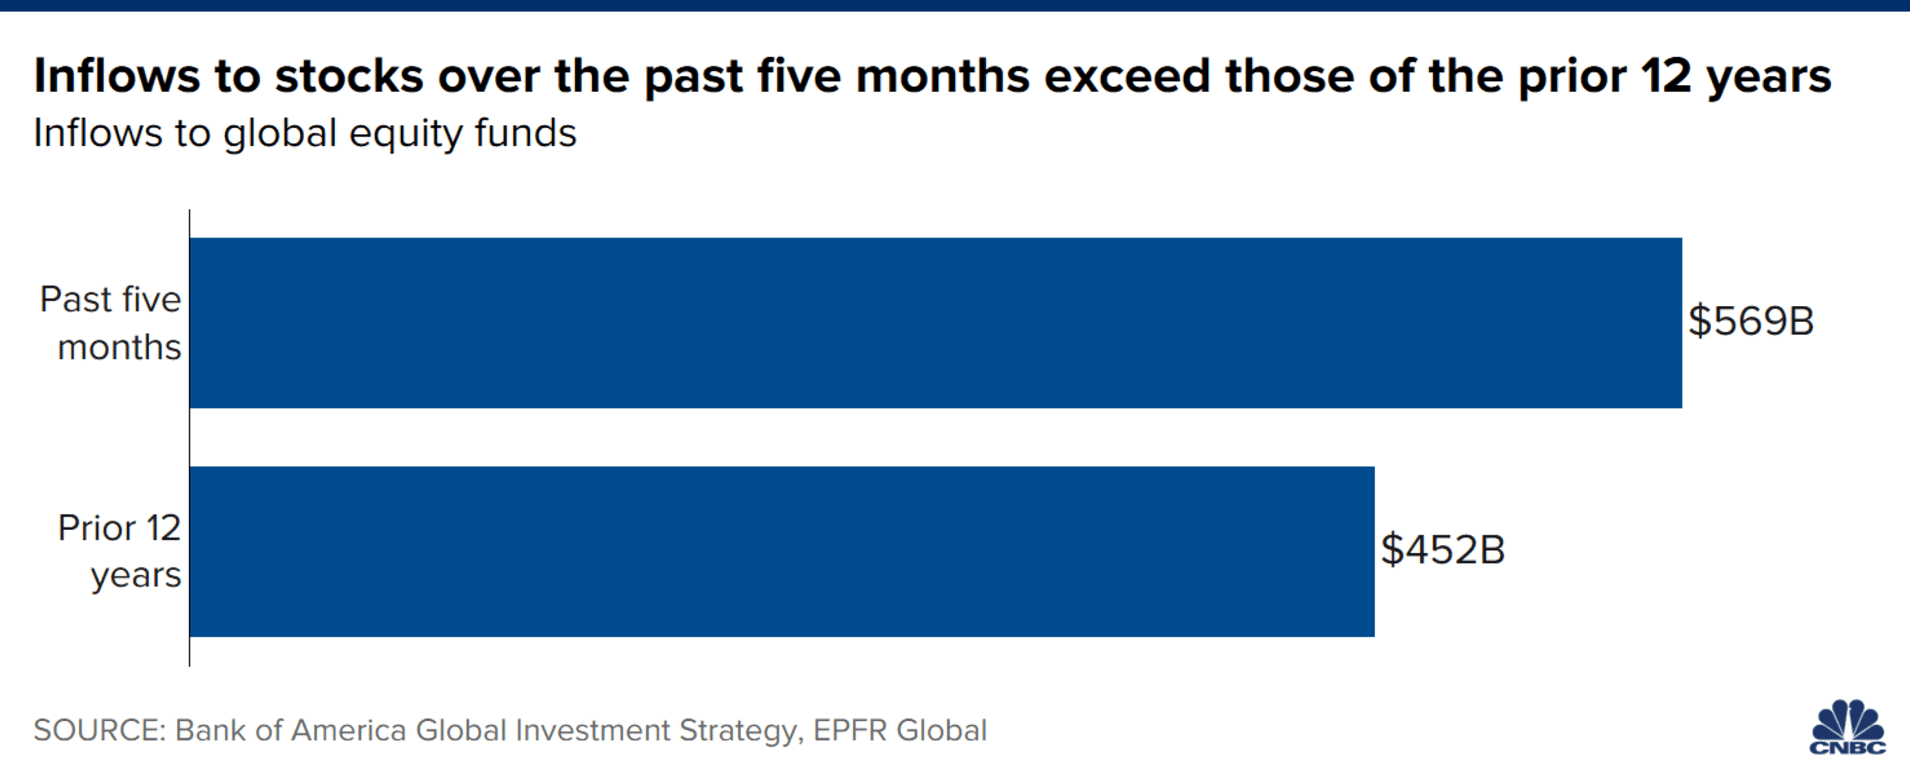
If that chart alone doesn’t get your “Spidey senses” tingling, I am not sure what will.”
10:00 am

BKX is challenging the six-month trendline at 123.00 this morning. Once the trendline is broken, the reversion may go back to revisit last year’s low. It has been 12.9 months from the 2020 low. The Cycle Top was broken in March.
ZeroHedge comments, “There was a remarkable disclosure in the latest JPMorgan earnings report: the largest US bank – an entity that historically has best been known for making loans to the broader population – reported that in Q1 its total deposits rose by a whopping 24% Y/Y and up 6% from Q4, to $2.278 trillion, while the total amount of loans issued by the bank was virtually flat sequentially at $1.011 trillion, and down 4% from a year ago.
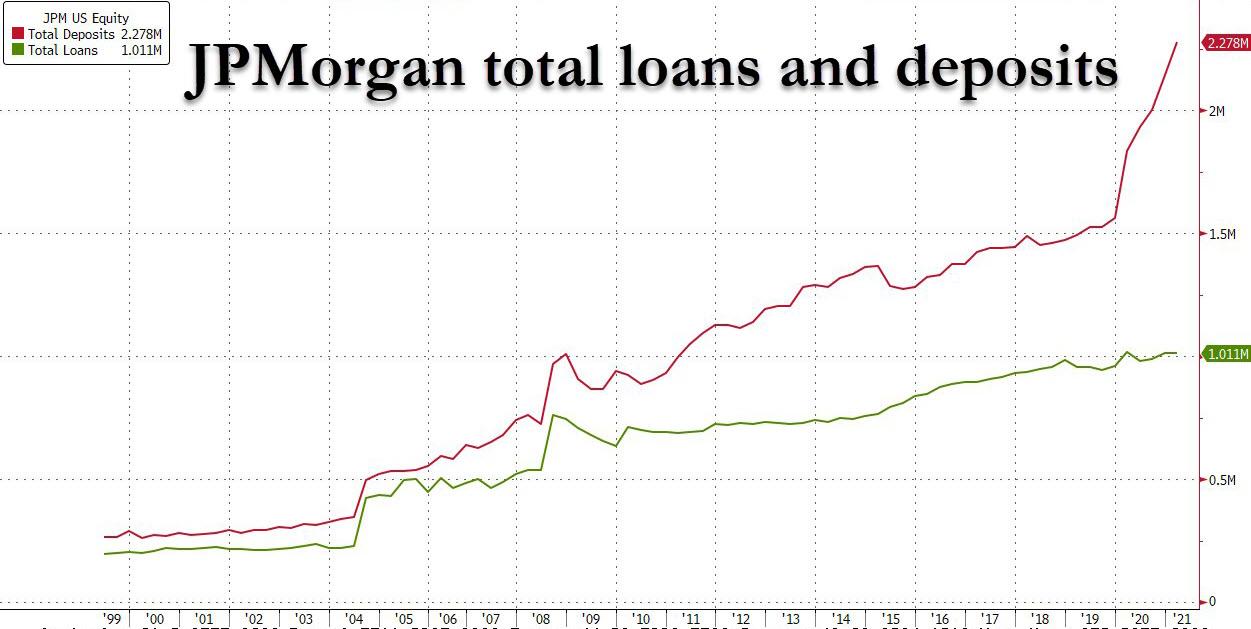
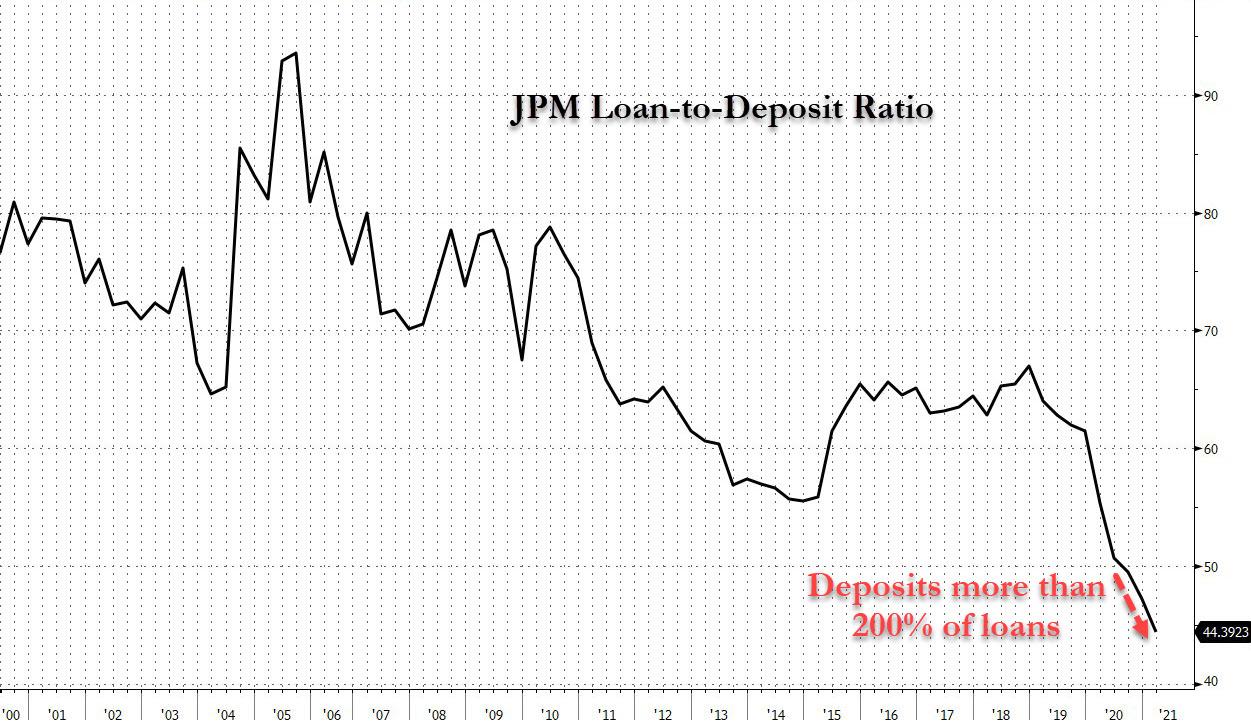
In other words, for the first time in its history, JPM had 100% more deposits than loans, or inversely, the ratio of loans to deposits dropped below 50% for the third quarter in a row after plunging in the aftermath of the covid pandemic:
8:12 am

Good Morning!
The Shanghai Composite rallied to test the 50-day Moving Average at 3484.48 during its cash session, reaching a high of 3479.01. There is a small probability of a new high, but the Cycles Model suggests not. While on a longer-term sell signal, the shorter term dictates patience until the SSEC declined beneath its mid-Cycle support at 34.52.
ZeroHedge comments, “Still recovering, but losing steam
Summary
- China’s economic growth surged to 18.3% y/y, broadly in line with expectations
- A big part of this is due to the lower base in Q1 2020
- Although the overall first quarter growth was driven by production, more recent data suggests that services are taking over, while production growth is slowing
- We think the recovery will lose steam as the initial pent up demand dies out and because policy support is being scaled back
- Moreover, trade will not help economic growth as much as it did in the past few months as China’s trading partners are slowing coming out of the pandemic and are requiring less working-from-home and other coronavirus-related exports from China.
- That is why we stick to our GDP forecast of 7.7% this year
- Despite the relative positive short term outlook, we remain gloomier for the long term as China’s ageing population, high debt load, weakening productivity growth and increasing international tensions will keep growth below the levels of the past 15 years.”

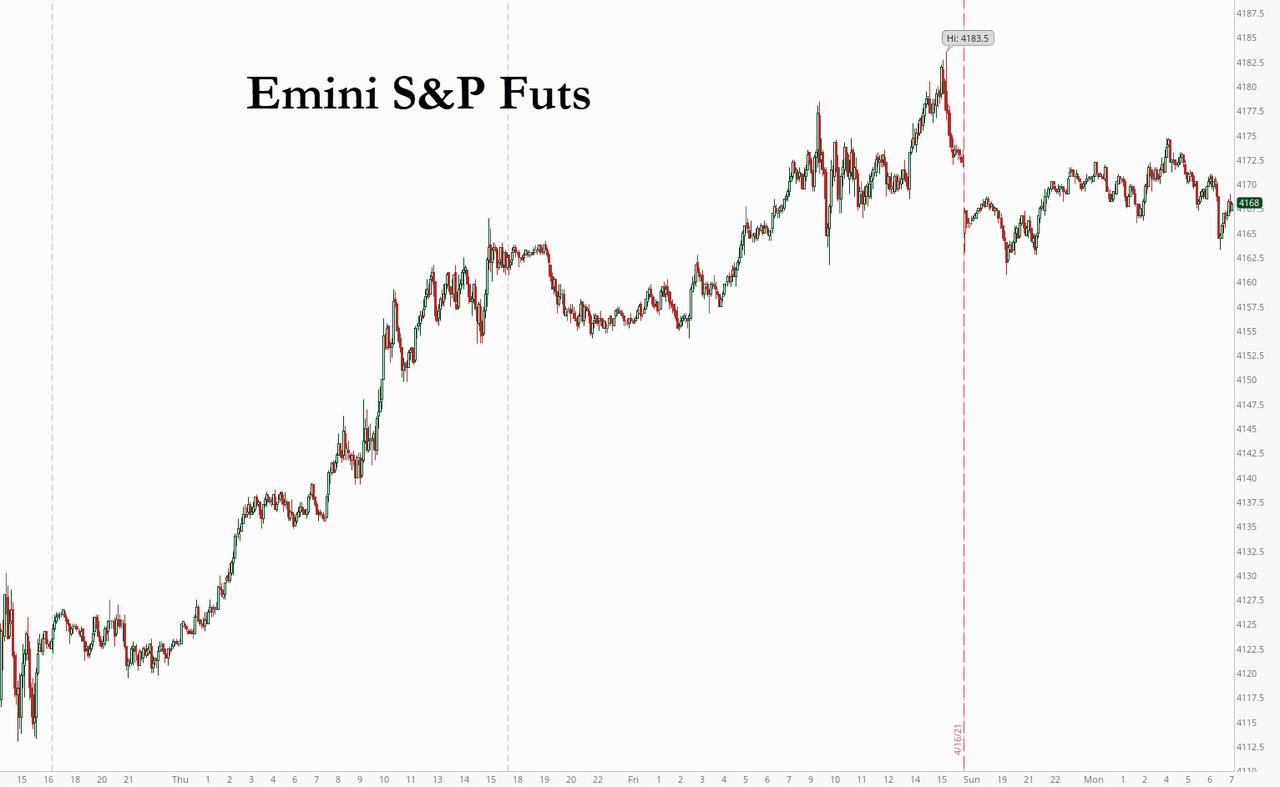
SPX futures declined to 4170.75, testing the Wave [c] Ending Diagonal trendline. The daily Cycle Top support (not shown) is at 4140.00 and the Wave (iv) of [c] low is at 4120.00. These three levels constitute varying degrees of weakness. Actual sell signals may occur at Short-term support at 4040.00 or the two month trading channel at 4000.00 where the probability of confirmation from the VIX and Hi-Lo Index may support the signals.
By the way, the Cycle which began at the low on March 23, 2020 will have lasted 12.9 months should the turn occur today or tomorrow. This may constitute a Cyclical sell signal.
ZeroHedge reports, “US equity futures slipped from record highs, European stocks held steady at the start of a new week and Chinese stocks soared the most in five weeks, as investors awaited a fresh round of corporate earnings with global shares sitting at record highs. The dollar slid following the crypto rout over the weekend. Gold rose and oil was flat.
At 07:30 a.m. ET, Dow E-minis were down 81points, or 0.24%, S&P 500 E-minis were down 10.75 points, or 0.26%, and Nasdaq 100 E-minis were down 46points, or 0.3% after briefly rising above Friday’s close during the European morning. Notable movers included Activision Blizzard and PayPal which fell in premarket trading. Tesla slid 1.6% following a deadly crash involving a 2019 Model S that no one appeared to be driving. IBM and United Airlines are due to report.”

NDX futures may (again) be leading the decline. The morning futures have thus far made a low of 13956.00, handily breaking the short-term Ending Diagonal. It has a long way to decline before giving a chart sell signal. However, it was deflected from the daily Cycle Top at 14125.00 and thus may have given a Cyclical sell signal. In addition, as I pointed out last week, the NASDAQ Hi-Lo is very weak and a decline beneath 0.00 would confirm a sell signal.
ZeroHedge observes, “Archegos shows how leverage is the great accelerator of stock prices on the way up, and on the way down. One of its bets, ViacomCBS, after skyrocketing, collapsed by 60%.
Vast, unreported, and at the time unknown amounts of leverage blew up Archegos Capital Management, dishing out enormous losses to its investors, the banks that brokered the swaps, and holders of the targeted stocks. The amount of leverage became known only after it blew up as banks started picking through the debris. ViacomCBS [VIAC] was one of the handful of stocks on which Archegos placed huge and highly leveraged bets, thereby pushing the shares into the stratosphere until March 22, after which they collapsed by 60%.
Archegos is an example of how leverage operates: It creates enormous buying pressure and drives up prices as leverage builds, and then when prices decline, the leveraged bets blow up as forced selling sets in. Most of the leverage in the markets is unreported until it blows up. The only type of stock-market leverage that is reported is margin debt – the amount that individuals and institutions borrow against their stock holdings as tracked by FINRA at its member brokerage firms. Margin debt is an indicator for overall leverage, and it has reached the zoo-has-gone-nuts level.
FINRA reported on Friday that margin debt jumped by another $9 billion to $823 billion in March, having soared by $163 billion in five months, and having exploded by 72% from March 2020 and by 51% from February 2020, to historic WTF highs:”

VIX futures surged to 17.25, a new high since the Master Cycle low last Wednesday. It has risen above the Cycle Bottom support at 15.83 and will start getting confirmation above the trendline at 18.50. The 50-day Moving Average is at 21.14, last seen in February 2020.

TNX is rising again, reaching 16.15 this morning. Intermediate-term resistance is at 16.24, above which lies a buy signal. Further confirmation lies at the Cycle Top resistance at 17.16. Should it break through, the new Master Cycle may continue through the month of May. Resistance may be found at 19.71, the high achieved in November 2019.