
12:24 pm

SPX has made a 59% retracement of the decline thus far. A move above this level suggests that the “short squeeze” may have turned into a buy-the-dip fest by retail investors. The result may be a rally to the Cycle Top at 4212.42 or higher. However, the daily Cycle Top (not shown) is at 4161.11 where the rally has stopped. It may also be a retest of support-turned-resistance in the daily chart.
A decline back beneath the trendline at 4130.00 may indicate a failure of the so-called “short-squeeze.” This could be an effort on the part of dealers and hedge funds to get a better position to short the market themselves. (I am not suspicious at all!)
ZeroHedge writes, “Less than a week ago we reported that after Morgan Stanley and BofA, Deustche Bank joined the growing bandwagon of sellside researchers warning that the market is facing a period of severe turbulence, investors appear to be heeding the caution in what BofA calls a significant shift to the “increasingly euphoric sentiment.”
Yesterday we reported that according to the latest institutional and HNW client data published by Bank of America, the bank’s flow desk just had seen the biggest outflows in five months as clients were net sellers of a whopping $5.2BN in US stocks last week – the biggest sales since mid-Nov. and fifth-largest on record – which took place just as the S&P 500 reached new highs.”
10:50 am

The GSCI Ag Index continues to move higher on day 259 of its Master Cycle. It is now above the Head & Shoulder neckline, which may provide some support. This has already been a strong week for the Ag Index, but supply and demand may keep the index pinned to the top of its range, especially as it begins a Primary Wave [3]. There are indications that it may extend higher before making a top. An alternate view proposes a “running correction” that may, at worst, revisit the 50-day Moving Average at 392.11 or, at best, remain above the Head & Shoulders neckline.
ZeroHedge considers, “An unusually cold front moved into the Central US early this week, spilling Arctic air throughout the Plains, Midwest, and Tennessee Valley. By Wednesday morning, “record-shattering cold” temperatures have been reported.
From the Canada–US border to Texas, unseasonably cold air has been recorded. For many states in the Central US, temperatures are over 20 degrees below average.
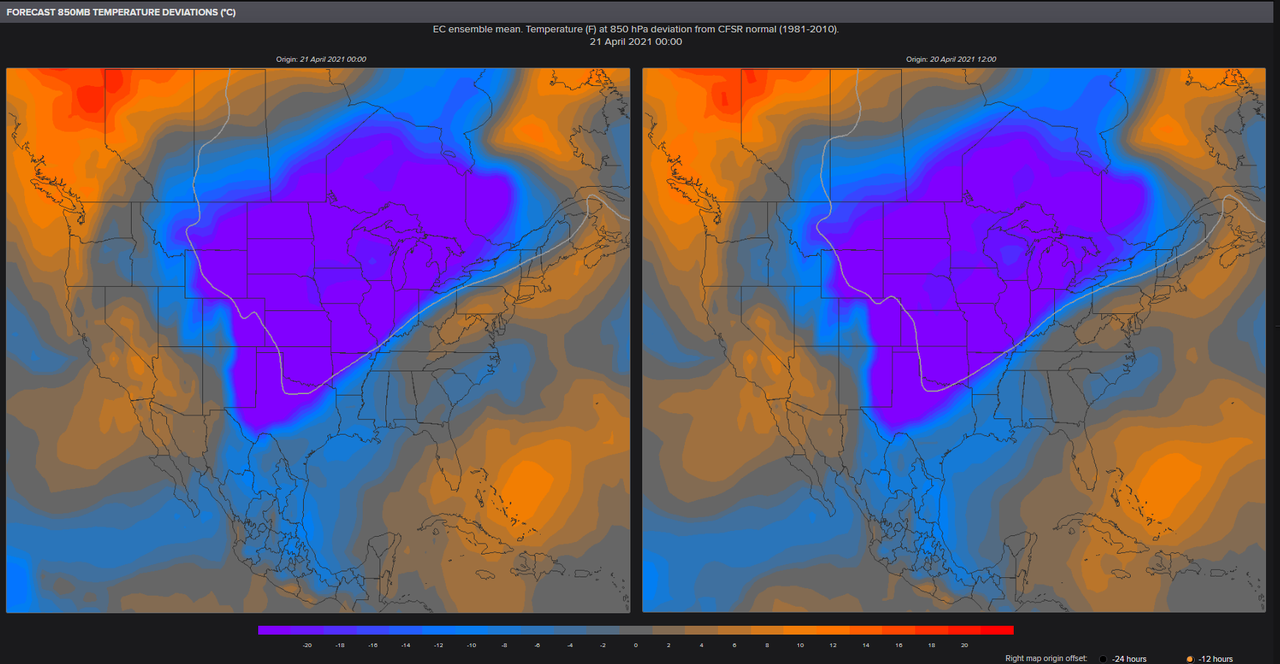
BAMWX meteorologist Kirk Hinz wrote in his latest note that cold air spans from southern Canada to near Mexico on Wednesday morning. He posted a chart of dozens of locations in the Central US that set various cold record lows (some were daily and or monthly records).
ZeroHedge also adds, “Throughout U.S. history, there have always been droughts in the western half of the country from time to time, but what we are dealing with now is truly alarming. Scientists tell us that a multi-year “megadrought” has developed in the southwestern portion of the country, and this is the worst year of that “megadrought” so far by a wide margin. If conditions do not radically improve soon, we are going to have a major agricultural disaster on our hands. Some farmers have already decided not to plant crops at all this year, but many others have decided to plant anyway knowing that if enough rain doesn’t come their crops will certainly fail.”
7:50 am

Good Morning!
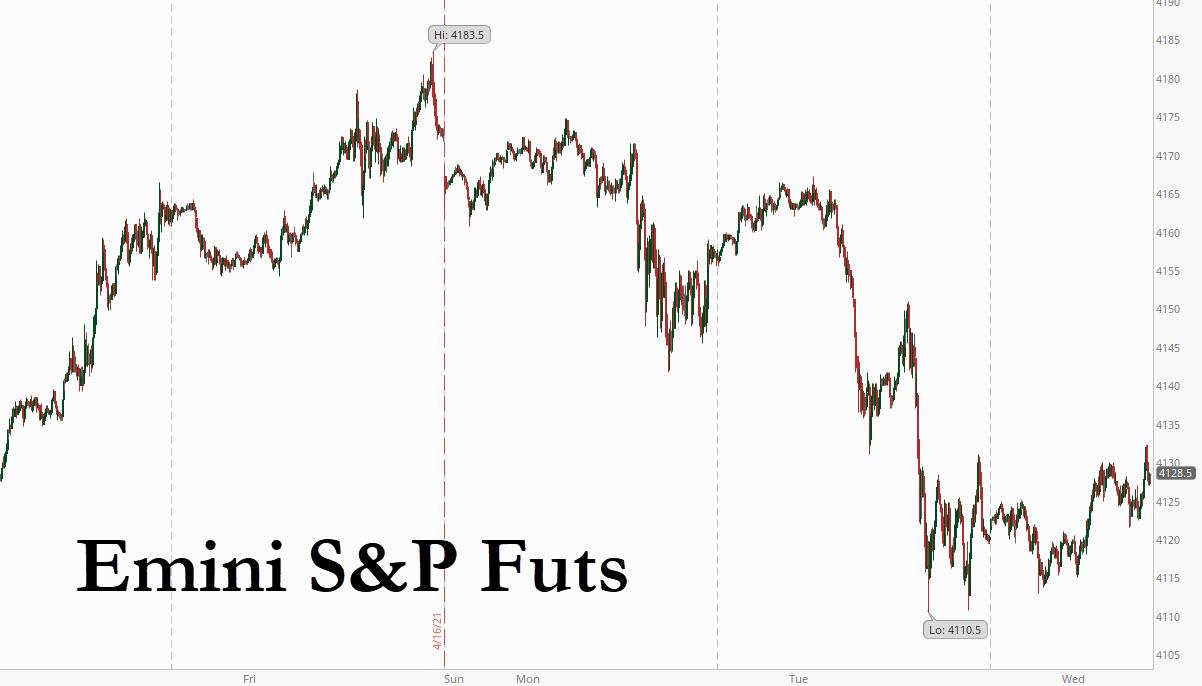
SPX futures are flat this morning, hovering near yesterday’s close. I have illustrated the potential situation in the chart. There is an (a)-(b)-(c) decline thus far which allows the SPX to go higher in a potential Wave [i]-[ii]-[iii]-[iv]-[v], should it stay above the trendline at 4120.00. If it declines beneath it, then the current Wave structure prevails and the bear market may begin.
ZeroHedge reports, “S&P futures were little changed, paring earlier declines with the Nasdaq underperforming following dismal Netflix guidance, which saw the company report its worst quarter in 8 years sending the stock 8% lower. At 7:00a.m. ET, Dow e-minis were up 13 points, or 0.04%, S&P 500 e-minis were up 0.50 points, or 0.01%, and Nasdaq 100 e-minis were down 27 points, or 0.20%.”

NDX futures are down, but may not have yet broken through yesterday’s low at 13730.00. Keep an eye on this indicator. A breakdown here may add a fifth wave to the decline, tilting it towards the bear market.
ZeroHedge considers, “A tsunami is a wall of water that wipes out everything in its path, typically caused by earthquakes. But first, the water actually disappears from the usual shoreline, leaving land where there should be sea.
If you are on the shore and see that happen, the correct response is to run for high ground. Tragically, though, people often rush toward this new and unusual sight. It’s hard to blame them; we humans are drawn to the unknown. This impulse explains much of our progress, but it has costs, too.”

The NASDAQ Hi-Lo Index closed at -70.00, giving a sell signal. The VXN (NDX Volatility Index) is hovering at 24.37, just above the lower trendline of its Ending Diagonal, but beneath the 50-day Moving Average at 27.59. A pop above the 50-day may confirm what the Hi-Lo Index is telling us.

VIX futures are at a high of 18.82 and rising. This portends a lower SPX. If so, we may also see the 50-day Moving Average being challenged and a potential confirmation of the VIX buy signal.

TNX is hovering just above its April 15 low. Today is day 258 of the aging Master Cycle. The 50-day Moving Average at 15.21 may still be exerting a pull to make the Master Cycle low there, as the Wave pattern appears incomplete.

USD futures are advancing, confirming the Master Cycle low at 90.84 yesterday (day 263). Tis opens the way for a month-long rally in the USD to the Broadening Wedge trendline at 96.00. You may have noticed that the USD strengthens as the markets correct.

WTI Crude made a morning low of 61.01, declining beneath both Intermediate-0term support at 62.00 and the 50-day Moving Average at 61.28. A new sell signal has been made for crude oil.