
3:00 pm

SPX has been challenging the 50-day Moving Average at 4237.73 and appears to be breaking through. This opens the probability of a further sell-off to the Cycle Bottom at 4159.81. This could last into the morning open as support may take another hour or so to be established. In the meantime, it is possible that the Wave pattern is not yet complete.
In the meantime, the NYSE Hi-Lo Index remains near zero and The VIX continues to challenge its Ending Diagonal trendline at 24.00.
11:04 am

BKX has finally broken is Head & Shoulders neckline, confirming the market sell signals across the board. Liquidity is draining out of the economy and this signal formalizes that process. Good luck and good selling.
10:28 am

There is some major recognition of a trend change as the VIX rises above its Ending Diagonal trendline at 24.00. Analysts who don’t do charting still look at 25.00 as the breakpoint for a significant rally in the VIX as downside in the SPX.
10:09 am

The NYSE Hi-Lo Index has gone negative for the first time since May 10. This confirms the sell signal in the VIX. While there may be a bounce, cracking the zero line is significant.
8:00 am

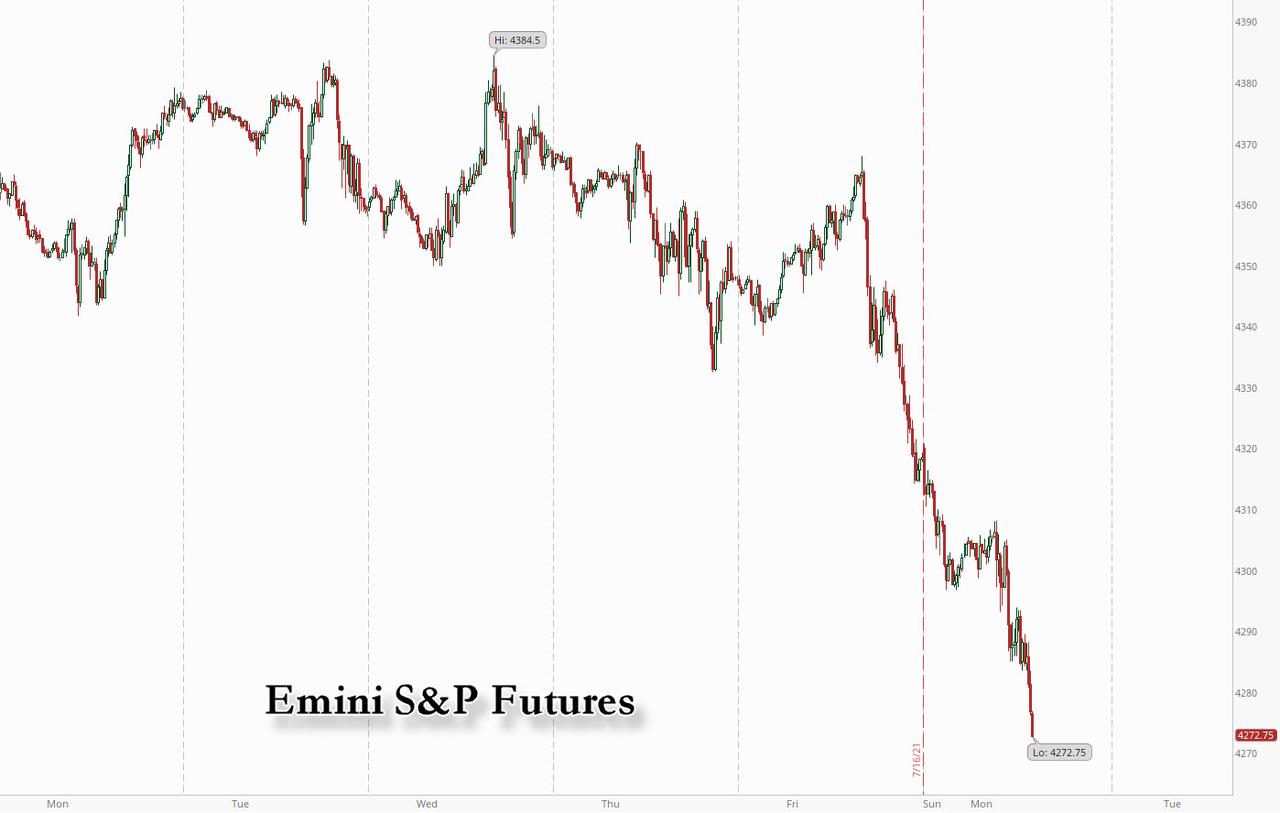
SPX futures have broken their 9-month Ending Diagonal formation this morning, challenging Intermediate-term support at 4274.43 and threatening the 50-day Moving Average at 4236.36. It is on an aggressive sell signal as of Friday afternoon when the VIX gave its buy (SPX sell) signal. The Hi-Lo Index, which closed at 78.0 on Friday appears to be poised to give its signal at the open, confirming the sell signal.
ZeroHedge reports, “The Friday selloff sparked by a huge op-ex expiration which saw up to a third of market gamma rolling off, has accelerated on Monday morning with the narrative goalseeking today’s rout to concerns that the covid resurgence and elevated inflation will weigh on global demand. To help validate this on Friday, US infections surged last week, topping a 16% global increase. At 730 a.m. ET, Dow E-minis were down 357 points, or 1.02%, S&P 500 e-minis were down 48 points, or 1.12%, and Nasdaq 100 e-minis were down 91 points, or 0.63%. The rally in Treasuries continued, sending 10-year yields tumbling below 1.23%. The dollar strengthened, oil dropped and gold and bitcoin was also lower.
“The peak of economic growth rates is behind us and growth worries are back. The good news is that even if the peak of some economic indicators is behind us, equities should continue to perform positively in the medium term in a positive economic environment,” Berenberg strategists said in a note. “However, high valuations, COVID-19 fears, low trading volumes over the summer and high investor equity allocations argue against significantly rising markets for the time being.”
ZeroHedge further notes, “Futures are down (relatively) hard ahead of today’s open with Small Caps leading the charge to the downside…
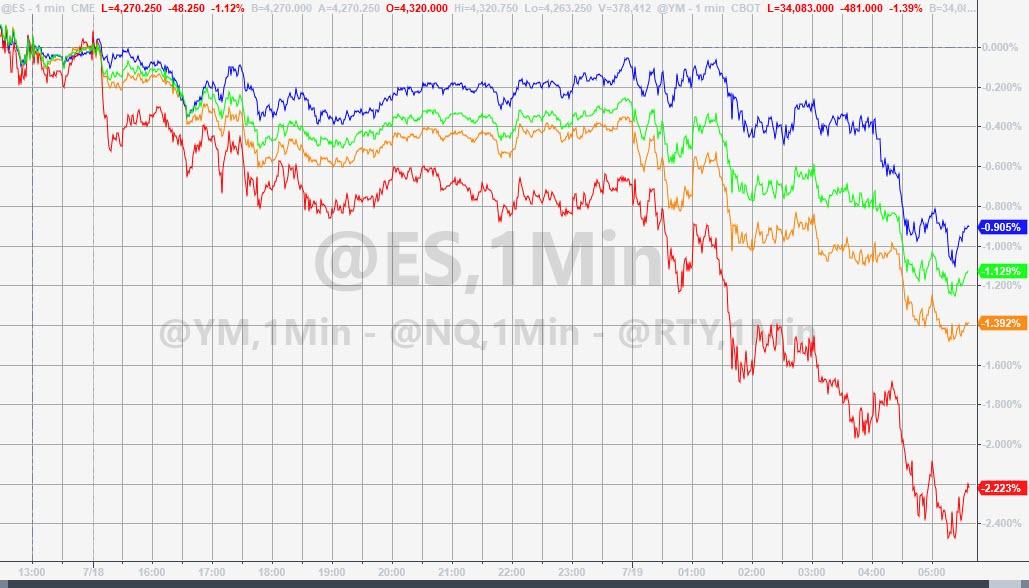
Notably, SpotGamma points out that we start the session in a negative gamma position.
The official gamma flip points are coming in at 4335 but we suggest using 4300 as the key “risk off” level. This is due to fairly large open interest at that strike, which also makes it first resistance this morning. Key levels today are 4300, 4335 (gamma flip) to the upside, with 4240 downside support.
We certainly see the setup for weakness today… and another call to The PPT imminent…”

VIX futures rose to a morning high of 21.90, testing the upper Ending Diagonal trendline near 22.00. A break in trendline resistance may bring recognition to a trend change in the markets and a flood of short sellers.
ZeroHedge observes, “Volatility is exploding.
We are seeing VIX and V2X move sharply to the upside today. Obviously not a shocker given the poor px action.
Regular readers of TME know our stance on hedges and protection; you basically do not chase it unless you think market is crashing.
On June 30, in our note, Protection – time to start planning…, we outlined our view on VIX and protection in general. We wrote;
“We would actively be looking to start using depressed vols for protection. You will probably need to endure some more short term theta pain, obviously depending when you get involved, but this boring market will eventually find the new narrative, and things will get dynamic again.
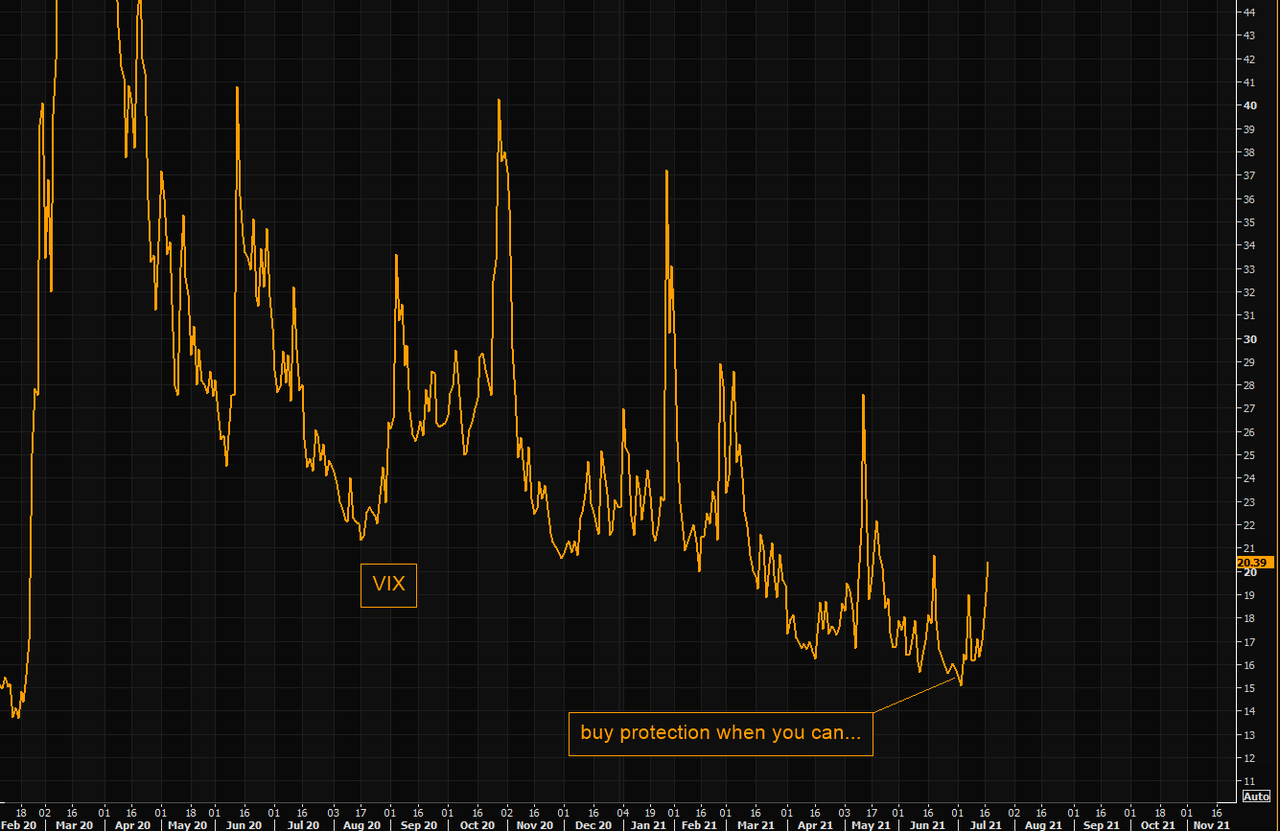
Source; Refinitiv
The 2010-2019 seasonality is with you…and we have earnings coming up as well so time for a gentle reminder;”

TNX has hit a new retracement low on day 265 of its Master Cycle. The money flow from stocks to bonds may persist for a few days, but be warned that the Cycle is ripe for the turning.

USD futures hit a new high at 93.04 this morning as the narrowing Cycle Tope resistance comes into view. The Chart pattern and Cycles Model both infer that this rally may be short, but strong. The initial target appears to be the Broadening Wedge trendline at 96.00.

NDX futures are in decline after testing the daily Cycle Top resistance on Friday. The NDX Hi-Lo Index closed on Friday at -52.00, confirming its sell signal along with the VIX (VXN).
ZeroHedge comments, “The world’s financial graveyards are covered with the career tombstones of those who, over the past decade, have called the end to a tech bubble that not only has yet to pop but has culminated with just 5 tech names – the FAAMGs – comprising 23% of the S&P’s market cap vastly surpassing the lofty dot com days, with a combined valuation of over $7 trillion.

Among those who were steamrolled by the tech juggernaut is Ned David Research, traditionally known for its accurate market timing calls if certainly not this time: two months ago it slapped a sell reco on tech right before it ripped the bears’ faces off and embarked on a 14% rally. And then, just as the FAAMGs fell out of bed late last week, the firm’s strategists pulled a Gartman, and abandoned their underweight stance, expecting that the rotation out of reflation and into growth, coupled with a plunge in yields, will lead to more tech buying when we may well be facing the first market rout since March considering last week’s coordinate selloff.”

BKX has been a tease all last week as it remained above the Head & Shoulder neckline at 18.70. While the BKX is already on a sell signal beneath the 50-day Moving Average, it may have the ultimate confirmation through the Head & Shoulders formation.
ZeroHedge notes, “There was a remarkable disclosure in the latest JPMorgan earnings report: the largest US bank – an entity historically best been known for making loans to the broader population at least until the Fed nationalized the bond market – reported that in Q2 its total deposits rose by a whopping 23% Y/Y and up 4% from Q1, to $2.3 trillion, while the total amount of loans issued by the bank was flat both sequentially and Y/Y at $1.04 trillion.
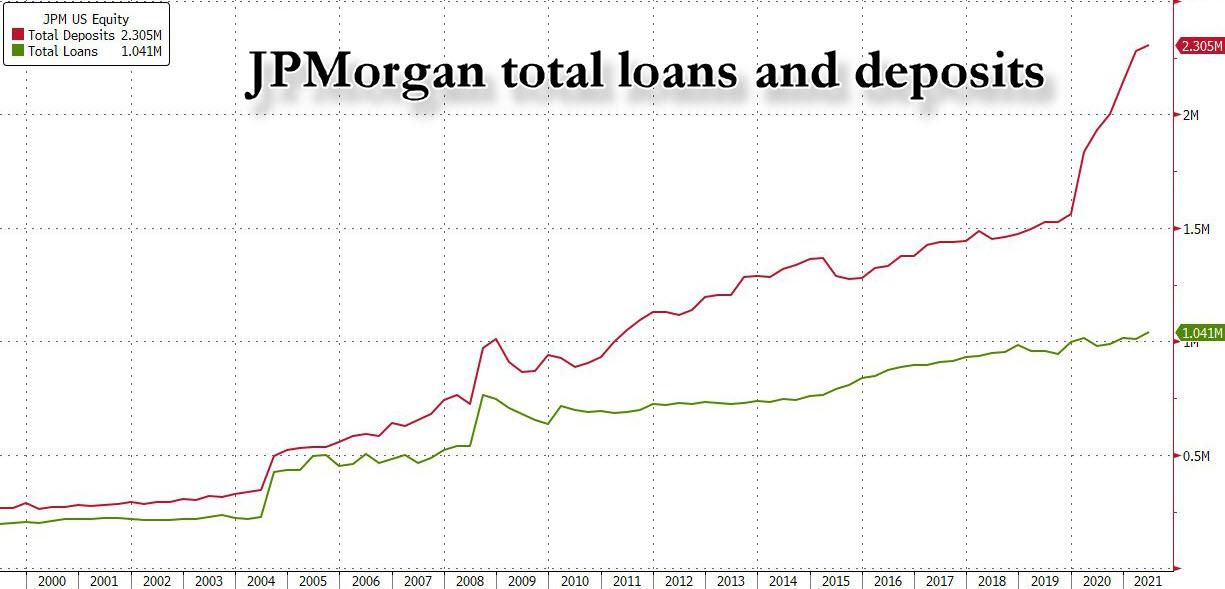
In other words, only for the second time in its history – Q1 2021 being the first one – JPM had 100% more deposits than loans, or inversely, the ratio of loans to deposits is now 50% (it did post a modest rebound from an all time low in Q1).”