September 13, 2021

12:50pm

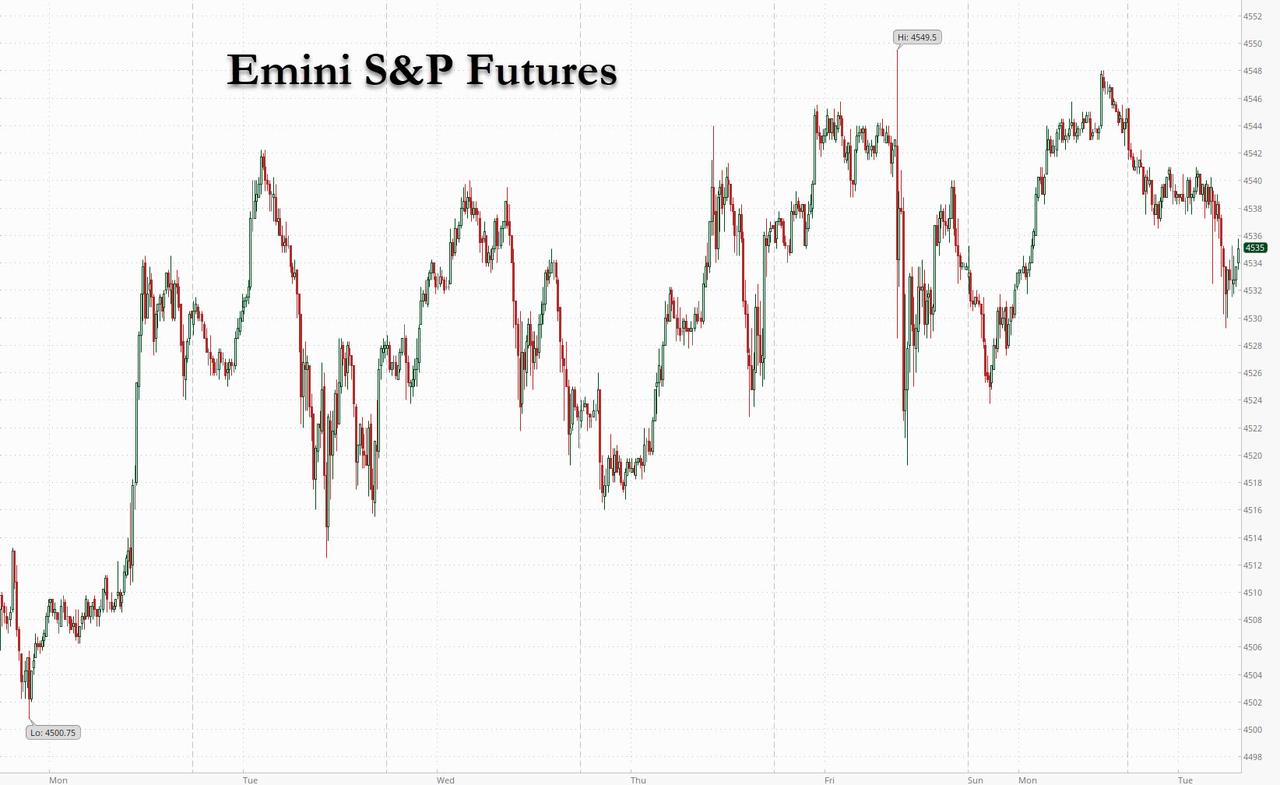
SPX has dropped to 4453.63, a new low nad beneath the trendline at 4463.58.  This is a chart sell signal, having broken the Ending Diagonal formation to the downside. The 50-daqy Moving Average is at 4421.45 and is the next support level.  Most chartists use the 50-day Mofving Average as their sell signal.  I suggest that the accumulation of indicators tell us we may not wish to wait that long.

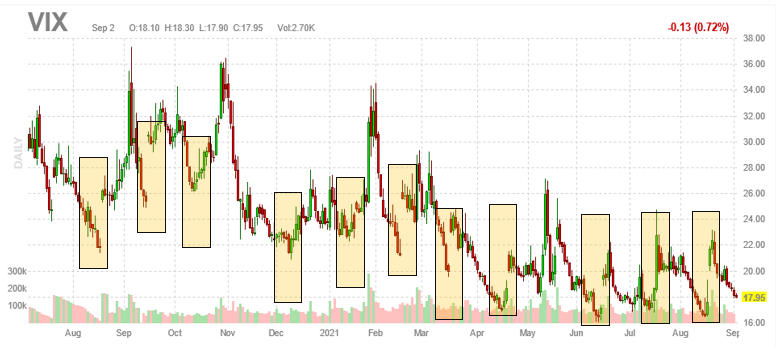
VIX is at 20.02, above the mid-Cycle support at 19.836 and on a confirmed buy signal.  Most chartists us the number 25.00 as their buy/sell signal.  There is an inverted Head & Shoulders neckline at 24.74, so be sure to be long above that number.

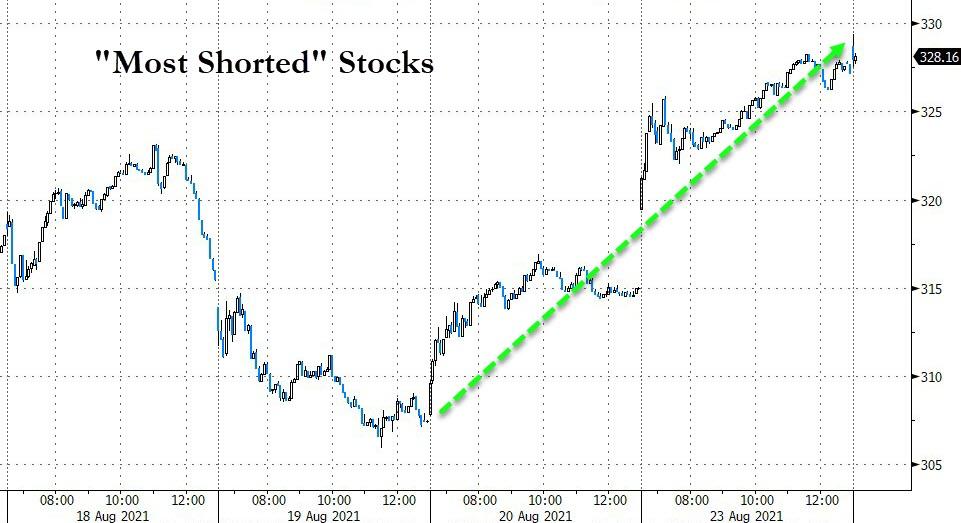
The NYS HiLo Index opened at 50.00 and rose to 91.00.  It appears that smaller companies are attracting speculators who feel they have a chance for a profit here.  Of course, the Hi-Lo closing number is what counts and, since there is a lag in the counting system, we won’t know the final number until tomorrow.

I am researching the source of my inability to show certain charts.  The problem seems to lie with WordPress.  I may have to change platforms.


8:00 am

Good Morning!

I wish to report a troubling situation with WordPress.  It refuses to allow any images of SPX to be presented.  I will use the DJIA as a model despite the fact that there are some differences.  For example, the DJIA topped out on August 16, while the SPX topped on September 2.  It still makes sense, since the point of origin for this Cycle in the Dow  was January 14, 2000, while the point of origin for the SPX was March 23, 2000.  Here we see the all-time highs within just a few weeks of each other.  The NDX ATH was on September 7, 2021.

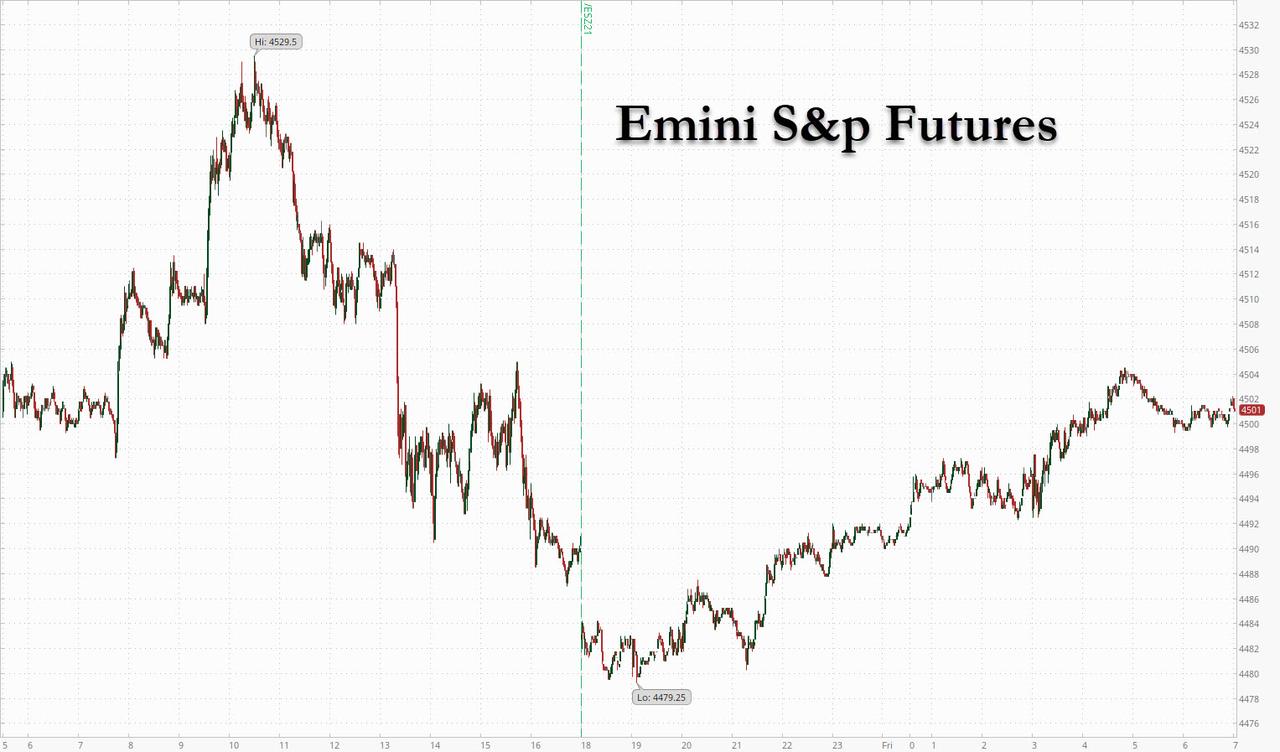
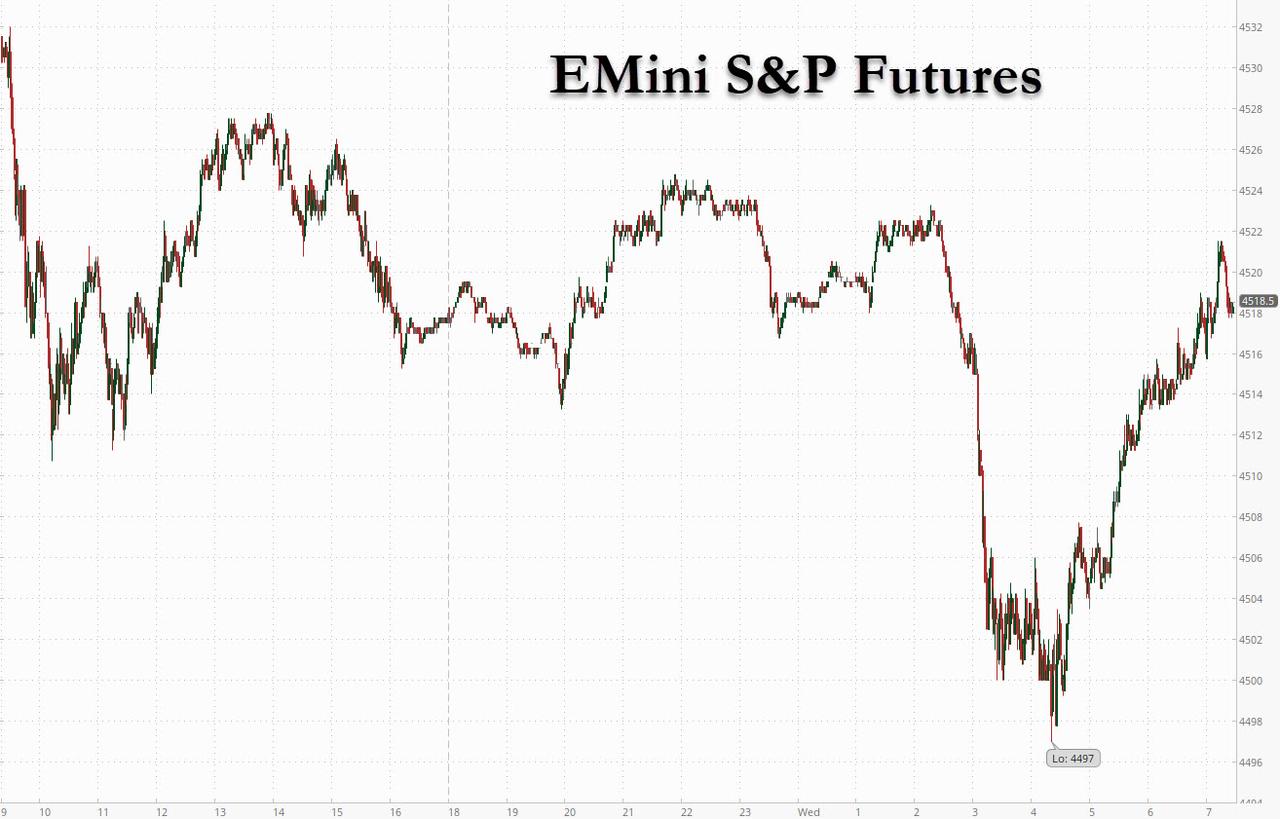
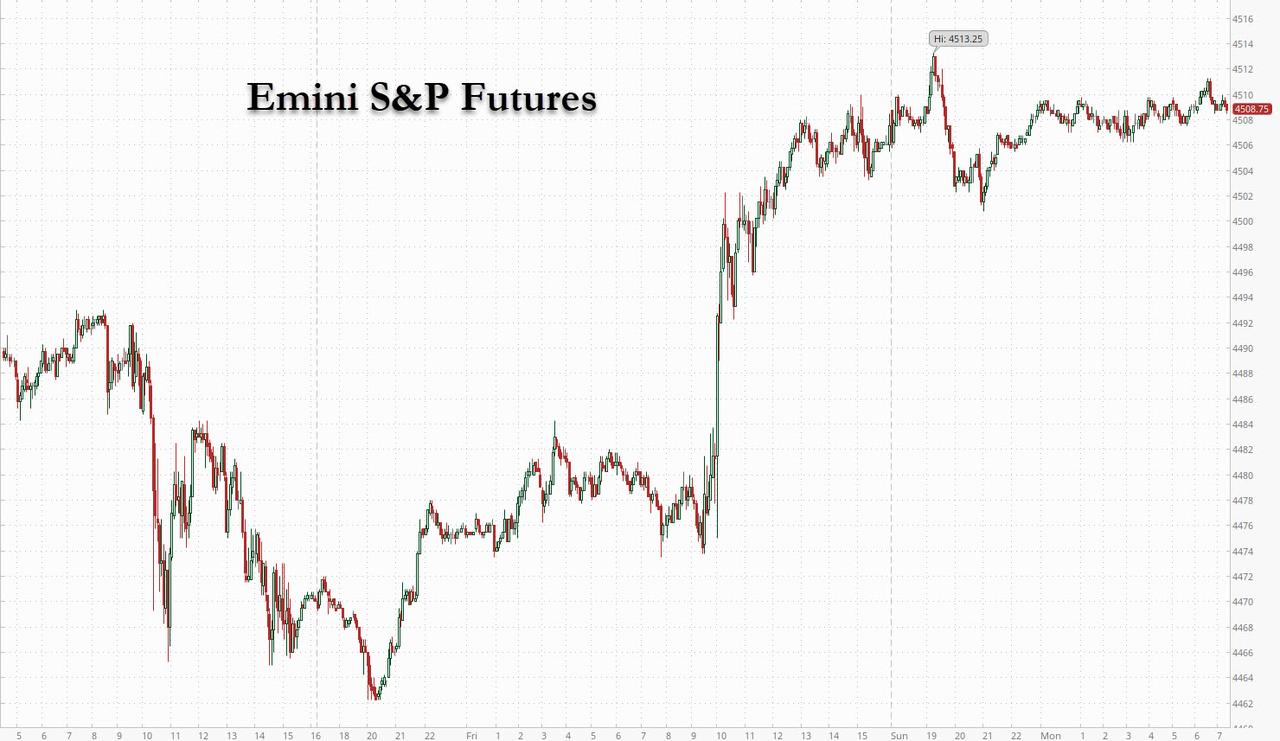
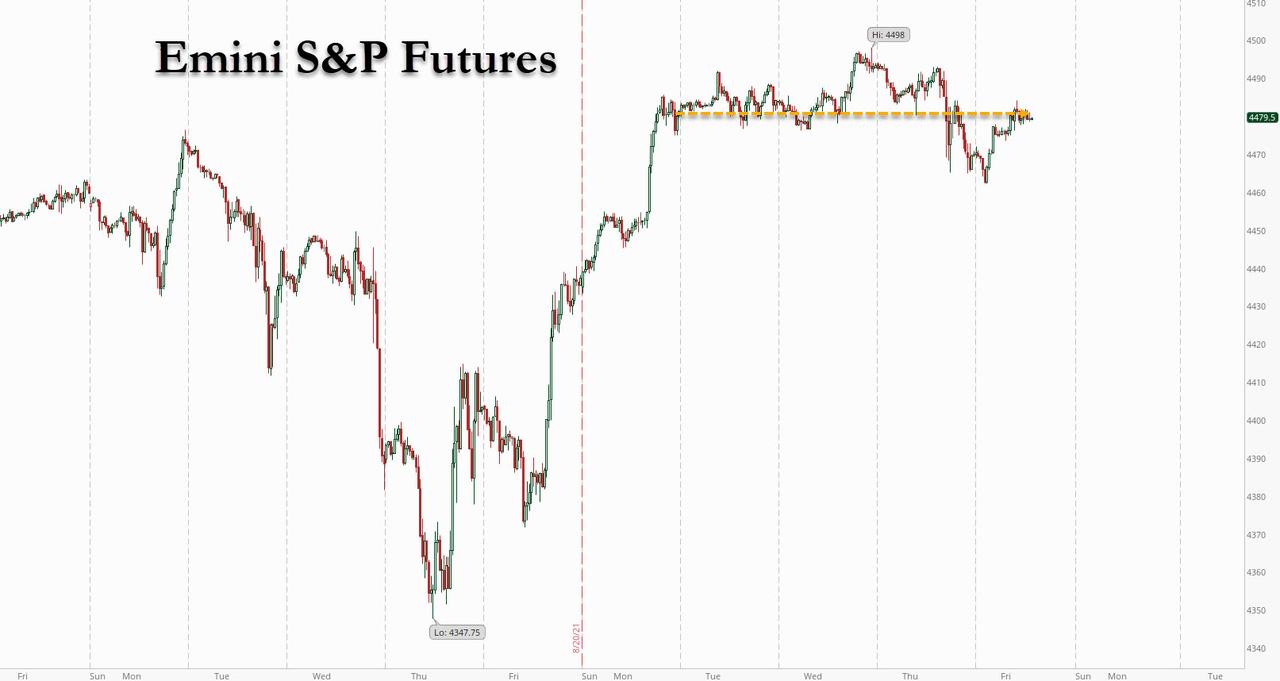
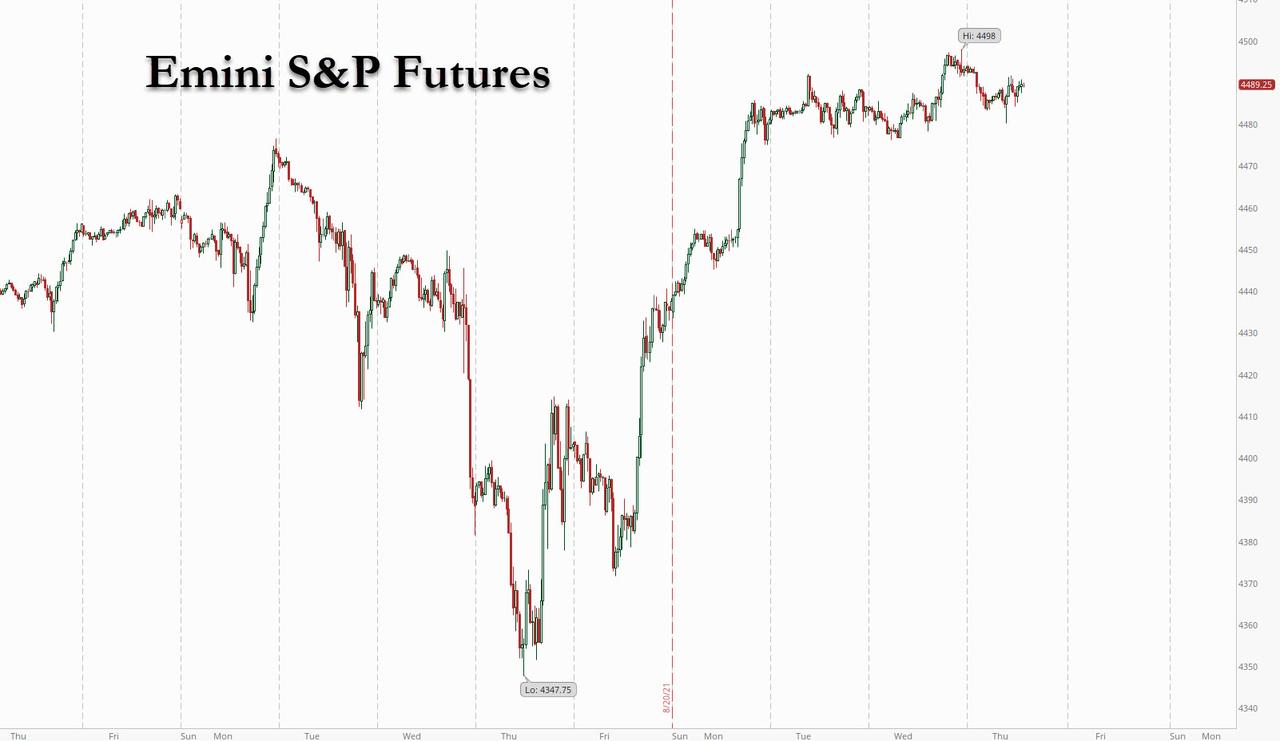
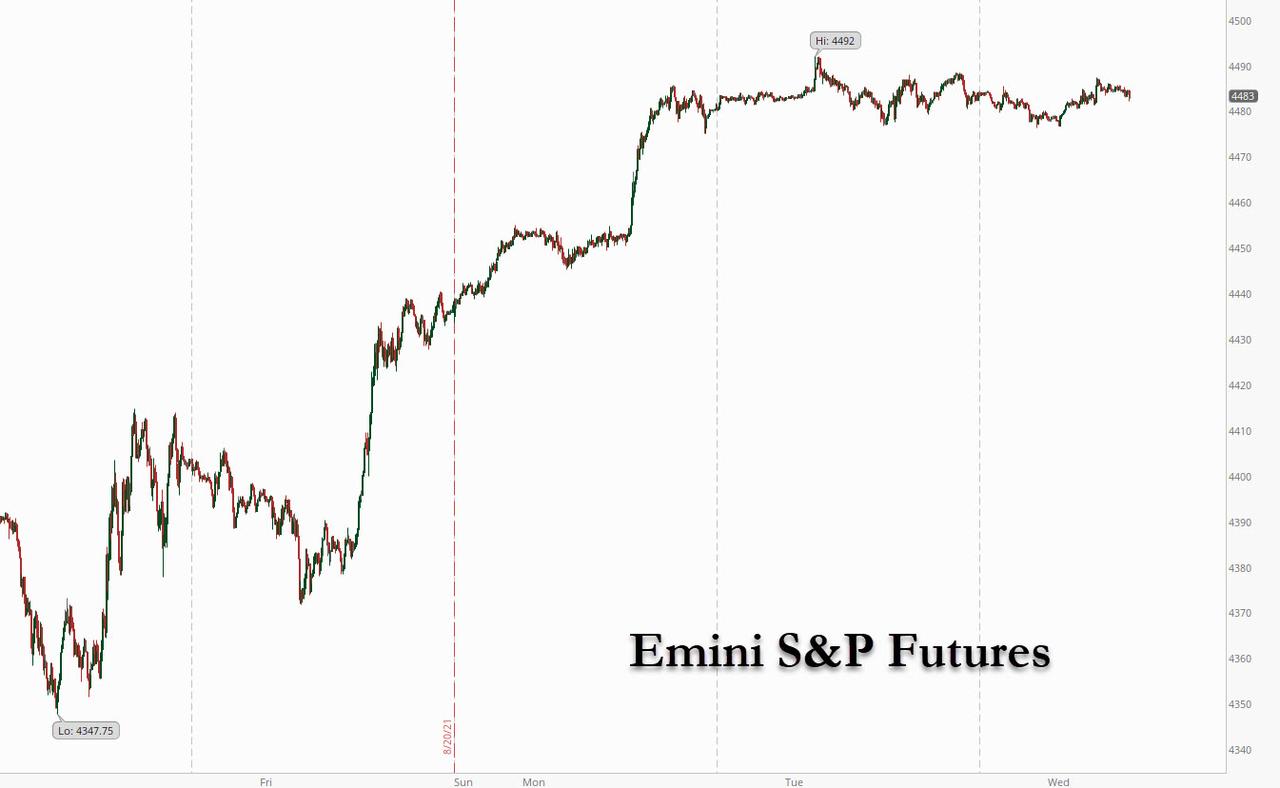
In any event, we see the DJIA futures in a probable retracement bounce to its 50-day Moving Average at 34992.42.  SPX futures, still dominated by the unwind from options expiration is likely to bounce back to 4500.00 as the short positions are unwound.  Short-term resistance is at 4511.09 as a possible alternate resistance.

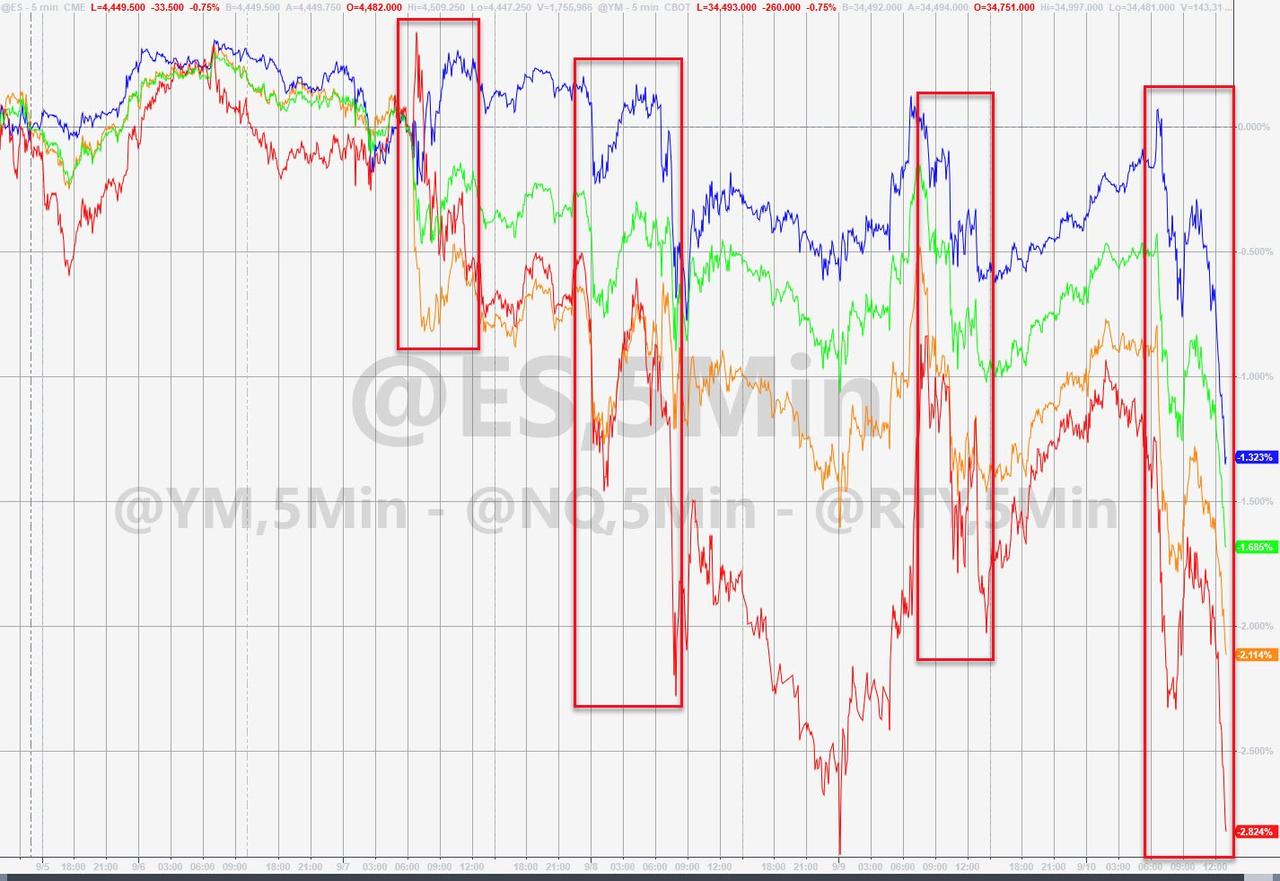
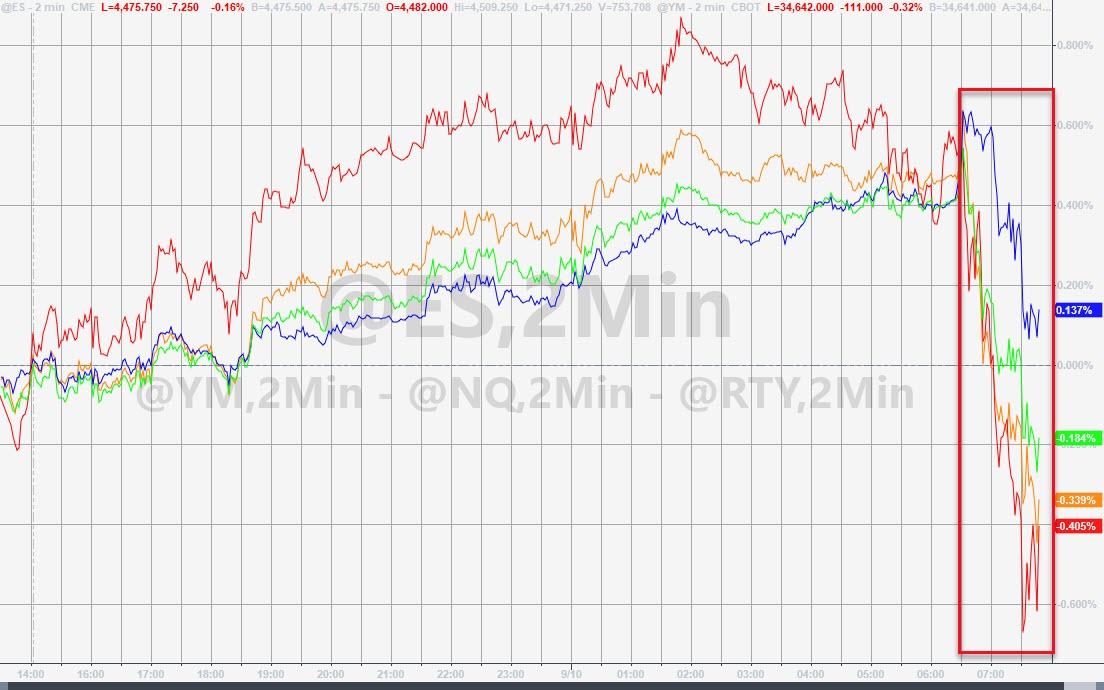
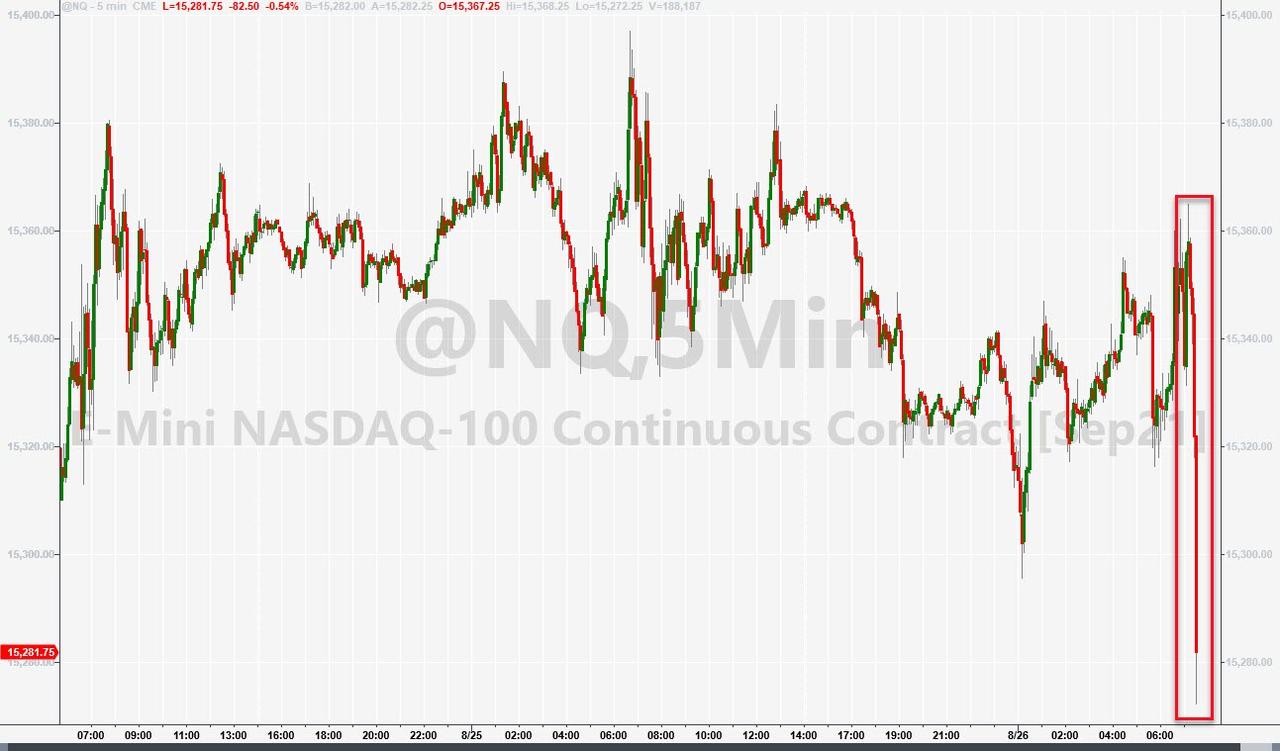
ZeroHedge reports, “World stocks ground higher with US futures and European stocks all in the green after a slow start of the week in Asia, amid concerns over accelerating inflation as well as tax and regulatory pressures on the world’s biggest companies. After five straight day of declines in US stocks, as concerns over the delta variant and tapering of the stimulus cooled risk appetite, and which led Wall Street indexes to lose between 1.6% to 2.2% last week as a surge in August producer prices and a sharp drop in jobless claims spurred fears the Federal Reserve could start unwinding stimulus as soon November, futures on major U.S. equity indexes all rose on Monday as traders await tomorrow’s CPI data. S&P 500 E-minis were up 23.50 points, or 0.53% at 730 am ET, Dow E-minis were up 200 points, or 0.58%, while Nasdaq 100 E-minis were up 78.25 points, or 0.51%. Industrial metals rose, with aluminum reaching $3,000 a ton in London for the first time in 13 years amid supply disruptions.”


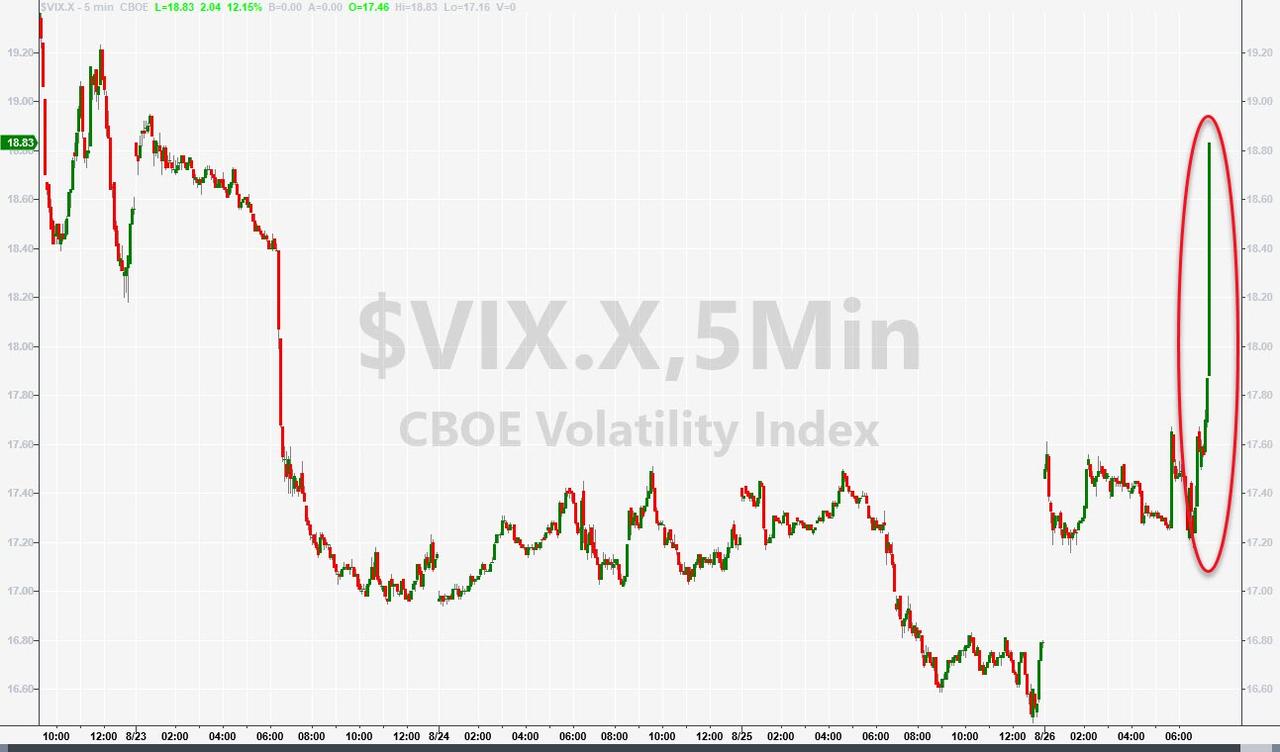
VIX futures declined to 19.10 this morning.  There is critical support at 17.88, just above the 50-day Moving Average.  However, the Wave structure may not allow that deep a correction.  We will know shortly.


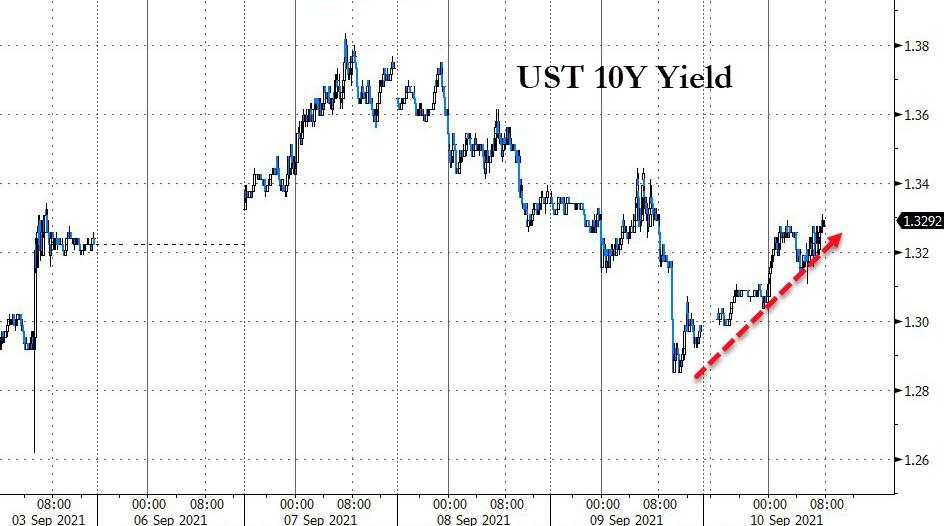
TNX is another chart that has been cut off by WordPress last Friday.  The Cycles Model suggests a week-long decline into its probable Master Cycle low.


Posted in Published | Comments Off on September 13, 2021

September 10, 2021

4:00 pm

SPX gave us a probable sell signal, pending results which may not come in until Monday morning.  Most analysts are expecting a 10% decline.  However, we have 43 calendar days (30 market days) of decline as opposed to 22 market days in the March 2020 decline.  The initial target is the 2020 low.  Good luck and good trading!

ZeroHedge observes, “The S&P just suffered its worst week since mid-June…Small Caps were the biggest losers this week. Nasdaq was the least bad horse in the glue factory…

…threatening to make September the first loss-making month since January…”


1:10 pm

I adjusted the Ending Diagonal trendline down to 4460.00, which is also the location of the Intermediate-Tern support to serve as the trigger for a sell signal.  While the VIX remains elevated, the Hi-Lo Index is still rich (105.00).  Admittedly the first major group of put contracts is at 447.00 in the SPY, equivalent to 4470.00-4475.00 in the SPX.  However, the panic button may not be pushed until larger losses are made, so 4460.00 is likely where the dealers begin to panic.

Monday is when the dealers unwind their (mostly long) hedges, so it may still be wise to have an aggressive short position, even if the market stabilizes.


10:45 am

Still not geting charts.  SPY (448.20) is at the Max Pain level.  However, at 447.00, puts put contracs out number calls 25310 to 2537.  The slippery slope starts here.

ZeroHedge observes, “Equity markets were higher overnight heading into the cash open… but that’s over now…

Bonds are also being sold, yields bouncing higher off payrolls low…”

7:50 am

Good Morning!

I am unable to load charts on to word press this morning.  It appears that SPX futures have completed their retracement to 4514.00, just shy of the 61.8% Fib retracement and may start the decline at the open, if not sooner.  Today’s options espiration is a minefield with puts dominating calls at 4500 and below.  Keep that in mind.   The Trendline at 4475.00 carries the sell signal.

ZeroHedge reports, “Global stocks rose and S&P futures rebounded from a freak selling episode late on Thursday after news that Joe Biden and Chinese leader Xi Jinping held a phone call, prompting speculation of detente between the two superpowers. Additionally, investor concerns eased about central bank stimulus (after the ECB launched a non-taper taper) and China’s regulatory crackdown. At 7:15am ET, S&P futures were up 0.4% or 19.50 points to just above 4,500; Dow futures were up 0.52% and Nasdaq futures were up  0.43%. The 10-year Treasury yield rose 3bps to 1.320%, oil was back over $69 a barrel and gold gained.”

Posted in Published | Comments Off on September 10, 2021

September 9, 2021

7:45 am

Good Morning!

I am dealing with a sprained wrist in a cast, which may explain possible typos in the text.

The September 2 high at 4545.85 on Day 267 remains the high for this Master Cycle.

SPX futures have weakened overnight, dropping to a low of 4487.30.  Friday’s options expiration shows an open interest in calls at 5052 while the open interest in puts is at 8549 at 4500.00.  The gap grows  larger as you go down the strikes beneath that level, especially starting at 4485.00.  The slippery slope begins there.

ZeroHedge repors, “US index futures fell along with European stocks amid jitters that the ECB could taper its asset purchases today as well as growing concerns over the slowing economic recovery while China’s ongoing regulatory crackdown on the tech sector weighed on sentiment. Nasdaq 100 and S&P 500 futures were each down 0.2%, but off worst levels, hinting at further losses after the underlying indexes dropped on Wednesday. Europe’s equity benchmark headed for a five-week low, while 10Y Treasury yields dropped along with the dollar. The dollar dropped, the euro snapped three days of losses and European bond yields steadied ahead of a European Central Bank policy announcement in which investors will be looking for information about bond buying plans for the fourth quarter. Treasuries advanced.”


INDU futures dropped to 34792.10, beneath its 50-day Moving Average at 34998.29.  Note that the high of  35510.70 was made on August 30.  Wave 5 of (5) appears to be truncated.  The probability of a new high lessens the longer the Dow stays beneath its 50-day.  Friday’s options expiration is also day 275 in the Master Cycle, should the attempt be made.  Cycles lasing that long are a rarity, so that option grows dimmer as the day progresses.


NDX futures declined to 15547.00 in the early morning session.  Cycle Top support is at 15574.77.  A breach of that level after being above it for a week is an aggressive sell.  The all-time high of 15701.40 was made on Tuesday, Spetember 7.

ZeroHedge comments, “A seesawing overnight session, and stocks within a point or two of record highs, hides the fact that market internals continue to weaken.

As RealInvestmentAdvice.com warnsBob Farrell’s rule #5 states:

The public buys the most at the top and least at the bottom.”

The graph below from Longview Economics speaks volumes for where the equity markets are in the investment cycle based on Bob’s logic.


VIX futures made a new high at 19.54 before settling down, still above yesterday’s close.  It is on a buy signal, but SPX is not yet confirmed, as the Hi-Lo closed at 60.00 yesterday.  Today’s options expiration in the VIX is telling.   At yesterday’s close open interest was  167,504 puts, vs 24,261 call contracts.  Open interest in calls doesn’t emerge until 22.00, where 64,667 calls dominate 42,998 puts.  Max Pain appears to be at 20.00.


TNX appears to have bounced off the 50-day Moving Averagee at 3.07, but is stalled beneath mid-Cycle resistance at 13.93.  The August 4 low at 11.29 appears to be a truncated Wave 5, but with less than two weeks to go to the Master Cycle terminus, it’s a toss-up on which direction TNX will take.

ZeroHedge reports, “While there was no way today’s 10Y auction could surpass last month’s stunning, blowout, record 10Y auction, today’s sale of $38BN in ten-year paper (down from $41BN last month) was not that much worse.

The auction priced at a remarkable 1.338% – remarkable not only because the yield was a drop from last month’s already stellar 1.34%, making it the lowest 10Y yield since February’s 1.155%, but because the auction stopped through the When Issued 1.352% by a whopping 1.4 bps, making this the fifth consecutive stopping through auction, the longest such stretch in recent history.

While the bid to cover of 2.59 was a modest drop from last month’s blockbuster 2.65, excluding the August blowout auction it was the highest BtC since July 2020. Naturally it was far higher than the six-auction average of 2.47.”


USD futures slipped beneath the 50-day Moving Average at 92.60 in the overnight session.  The options chain in UUP favors the puts by 821 to 100 open call contracts.  The Cycles Model suggests a strengthening USD up to the close of the Master cycle in two weeks.


Posted in Published | Comments Off on September 9, 2021

September 8, 2021

1:42 pm

Today’s action brings us to a pivot point in the charts.  NDX edged to a new all-time high at 15701.40 yesterday while completing an impulsive pattern.  SPX kept its September 2 high at 4545.85 with a sloppy pattern but both sold off to important pivots in regard to today’s and Friday’s options expirations.  For today,  open interest is 1587 call contracts to 1089 put contracts at 4525.00.  At 4500.00, open interest in puts outweigh calls 5341 to 2486.  Should SPX decline beneath 4500.00, gamma forces may outweigh any liquidity injection.  At 4475.00 open interest in puts outweigh calls by 5500 contracts!

It gets more difficult on Friday, as put and call contracts are almost dead even at 4525.00.  At 4500.00 puts outweigh calls by 3474 contracts, while at 4550.00 calls outweight puts by 7764 contracts!

At this point, SPX must maintain Max Pain status beneath 4525.00 and above 4500.00.  Friday’s Max Pain is at 4525.00.  Any deviation above those levels may incite a throw-over, while beneath thos levels begins the bear market.

ZeroHedge reports, “Morgan Stanley, Bank of America, Deutsche Bank, Citigroup, Credit Suisse And Goldman Sachs.

These are some of the biggest Wall Street banks that have issued “red alert” warnings on the US stock market in just the past few days, with some expecting an imminent correction of 10-20%, while others expect a slow burning drift lower over the next few months. Below we summarize the highlights of their surprisingly downbeat views.”


8:20 am

Good Morning!

SPX futures are lower this morning, most likely on their way to Intermediate-term support at 4450.00.  The Next two weeks will be critical, with a potential reversal at any time.  However, it may still have one more surge to the Cycle Top at 4601.80, at a minimum.  It may also “throw over” to as high as 4822.00 in a spectacular show of speculative frenzy as the fear of missing out prevails.

ZeroHedge reports, “World stocks receded from the previous session’s record highs, European stocks were headed for the biggest decline in almost three weeks and US futures were set for a third straight day of losses on Wednesday with the global growth outlook coming under increasing pressure while the dollar hit one-week highs and 10Y yields dipped as investors reduced exposure to riskier assets. S&P futures briefly fell 0.5%, tipping below 4,500 before, recovering losses after the S&P 500 fell 0.34% on Tuesday, while Dow futures were flat and Nasdaq emini futs were fractionally in the red as banks from Morgan Stanley to Citigroup turned cautious on US equities.”


VIX futures reached a high of 19.63 before coming back down to 18.24.  We amay see a rising VIX alongside a rising SPX in the final surge.  So, although the VIX is above its 50-day Moving Average, we still need confirmation from the Hi-Lo Index.  Otherwise the top trendline of the Ending Diagonal at 21.00 or the neckline of the Head & Shoulders may act as a trigger for an SPX sell signal.  In the meantime, the VIX itself is on a buy signal.


TNX futures pulled back this morning and may tag the 50-day Moving Average at 13.14 before moving higher.  TNX may have a show of strength in the latter half of the week which may continue through options week.


Posted in Published | Comments Off on September 8, 2021

September7, 2021

8:05 am

Good Morning!

I spent the week in St.Louis with my mother who was in the hospital.  When I arrived, there were doubts about her condition, which is inoperable for a 90-year ole woman with a heart condition.  However, she rallied and was released on Friday.  The next milestone is her 91st birthday in October, wich I plan to attend.


SPX futures rallied this morning to a high of 4545.40, on their way to 4555.00-4560.00.  The current Fibonacci level is 4541.00, so thee is stiff resistance above that level.  SPX must complete its pattern with a derivative of five Waves.  The sequence is 5, 9, 13, 17… There are currently 7 Waves, so another probe higher may complete the pattern.  The 21.5-year Cycle (258 months) from March 23, 2000 ends on September 23.  The 258th month will reach its halfway point tomorrow, so we may look for a reversal at any time.  Today is day 272 of the current Master Cycle.

ZeroHedge reports, “European bourses dipped in the red and a rally in US equity futures which traded near all-time highs after the Labor Day holiday fizzled, as  investors weighed China’s better-than-forecast trade data against the growing likelihood of fading central-bank support. S&P500 futures traded fractionally in the green and Nasdaq 100 indexes slipped and equity gains in China and Japan were followed by losses in Europe as investors speculated the ECB may get ready to roll back stimulus. The dollar and Treasuries yields rose, gold and cryptos dropped.”


VIX futures rose to a weekend high of 17.40, above the 50-day Moving Average at 17.28.  This has the potential of an aggressive buy signal, provided the Hi-Lo Index goes lower.  The Hi-Lo Index closed at 171.00 on Friday.

RealInvewstmentAdvice comments, “Will the mid-month VIX pattern hold yet again?

The graph of the VIX (volatility) below highlights a fairly reliable pattern that has been occurring mid-month for the last year. As shown, VIX tends to decline into the middle part of most months, rally sharply for a few days, and head lower again. The pattern has been especially pronounced the last three months.  One likely cause is the combination of mid-month options expiration and low volumes. The volume of trades needed to cover and roll options contracts may be enough to push volatility higher at these times.

September is thus far looking to repeat the pattern. A nice short-term trade may again occur if VIX approaches the 16.00-16.50 range later next week. 16 has been the recent floor so if you do get long the VIX and try to take advantage of the pattern, keep risk targets in place below 16.”

employment markets data, Markets Go Nowhere On Weak Employment Data


TNX may be on the verge of a breakout, reachign 13.72, just shy of its prior high at 13.75.  Mid-Cycle resistance is at 13.78, so that might be a more reliable focal point for a breakout.  TNX has only two weeks to its next Master Cycle high., which may break out abov ehte Cycle Top resistance at 18.43.


USD futures are primed for a reversal, with only two more weeks until its Master Cycle high.  It looks like September is going to be an active month. for the USD and TNX.


Posted in Published | Comments Off on September7, 2021

August 30, 2021

3:33 pm

Note:  I have booked an early morning flight to see my mother, who was admitted to the hospital Sunday afternoon.  The needed surgery to correct her condition may not be possible, since her cardiologist is concerned that her heart is too weak to handle that kind of stress.  Their aim is to stabilize her and probably send her home until the next episode.  Although I call her weekly, I think its time to be with her in person.  My apologies, but I may not be blogging until Friday, at the earliest.

As for the SPX, I have run out of  perceivable extensions with Wave (v) at 1.33 times the size of Wave (i).  The SPX is much like the dry tinder on the western forests.  The Fed can be compared to the US Forest Service, ignoring risks and taking the easy way out, until ignition.  Now the /Western forests are out of control with billions in collateral damage.

Take care!  I personally have placed my money anticipating a very large decline.  The next Master Cycle is not due until mid-October.


9:20 am

Note: I have received information that my 90-year-old mother is hospitalized, condition unknown.  I may have to leave for an indefinite period of time to be with her.

SPX futures hit a weekend high of 4516.50, which tells us there may be more.  As of Friday, the new target is 4520.00, where Wave (v) of [v] is equal to Wave (i) of [v].  It may go higher.  There seems to be an upper limit of 4537.00, due to possible structural limitations.  Today is day 264 of the current Master Cycle.

ZeroHedge reports, “After stocks closed on Friday at their 52nd record high of the year, when Powell’s unexpecteldy dovish Jackson Hole sparked a meltup in risk assets and a meltdown in the dollar, on Monday all indications are that we will get the 53rd record high with 2021 set to have a record number of all time highs. At 7:30 a.m. ET, Dow e-minis were up 10 points, or 0.03%, S&P 500 e-minis were up 3.50 points, or 0.07%, and Nasdaq 100 e-minis were up 16.25 points, or 0.11%. Oil dropped then gain, the dollar rebounded from Friday’s mauling and precious metals continued their ramp higher.”


VIX futures are rising, but still beneath the 50-day Moving Average at 17.40.  VIX may have made its retracement low at 16.11, but not confirmed.


TNX is lower this morning and may be reaching it retracement limit.  The Cycles Model suggests a possible burst of strength today.  If so, it may set off a 3-week rally to a new high.  Stand by for a reversal coming soon.


Posted in Published | Comments Off on August 30, 2021

August 27, 2021

1:47 pm

It originally appeared that the SPX at 4500.00 met all the requirements for the rally.  But the Fed will not allow a sell-off before Jackson Hole.  The revised target is now 4520.00 (+/-).  Today is day 261 in te Master Cycle.


8:15 am

Good Morning!

SPX futures tested Short-term support at 4464.98 by declining to 4466.90 in the overnight session.  It has bounced from that support to 4487.40, an approximate 61.8% retracement.  Of course, the SPX may bounce higher, but it may have fulfilled its retracement requirements.

ZeroHedge reports, “US equity futures are trading where they were on Monday evening, having flatlined in a narrow, boring 20-points range on either side of 4480 for the past week, as virtually nobody wanted to take on any major new positions ahead of Jackson Hole. Well, the good news is that in less than 3 hours, J-Powell’s much overhyped speech at J-Hole where he will barely – if at all – mention the taper is almost behind us which hopefully should unlock some volatility in markets. At 700am, S&P futures were up 12.50 or 0.3% to 4479, Dow futures were up 80 to 0.22% and Nasdaq futures were up 50 or 0.33%. Treasury yields dipped, the dollar was flat and bitcoin was flat around $47,500.”


VIX futures declined to a low of  17.66 (an approximate 58% retracement) before bouncing back toward 18.00.  Volatility may be about to be set loose as Powell’s speech disappoints.

ZeroHedge advises, “It appears the investment world is starting to wake up to a message that we have been screaming from rooftops for more than 10 years : the Fed has boxed itself into the largest asset bubble in history.

And there’s no obvious way out.

Since 2009 we have been raising critical questions about how long the Fed would be able to kick the can down the road with its monetary policy, but even we could have never predicted the size and scope that QE would eventually mutate into.

With our Central Bank just casually doubling its balance sheet (and nearly the money supply) in the course of under two years, all markets – housing, bonds, stocks, consumer pricing – have screamed to new highs with no signs of stopping.

As each day goes by, it’ll slowly become more apparent to the public, the investment world and yes, even the rocket surgeons at the Fed, that the notion of bringing the economy in for a “soft landing” from this bubble is going to be far more difficult than ever imagined (assuming the Fed actually ever pondered the situation, which it likely hasn’t). That is to say, it could even be downright impossible.”


TNX sits atop its 50-day Moving Average at 13.35, waiting for the spike that will boost it above the remainder of its resistance zone.  It may drift lower until investors begin to realize that the Fed’s power over rates is overrated, if not non-existent.  The Cycles Model suggests that the 10-year yield may reach 20.00 by late September.  An alternate date may be mid-October.


USD futures appear to be consolidating in range this morning.  There may be a furhter pullback while it appears to be due for a trading Cycle low.  The Cycles zmodel suggests that strength may come back next week and last through options week.


West Texas Intermediate Crude rose to 69.05 this morning as it retraces to 50-day resistance at 70.68.  Today may be a show of strength with another two weeks of possible rally before a reversal, according to the Cycle Model.  The ensuing decline may last through the end of November.

Posted in Published | Comments Off on August 27, 2021

August 26, 2021

11:03  am

SPX is heading for Short-term support, where there may be a bounce.  Should it decline through it, the next support is at the mid-Cycle and trendline at 4411.14.  This jolt to the market may be stronger than originally expected.  The confirmed sell signal, in the absence of the dual VIX and Hi-Lo signal is beneath the trendline.  We are in aggressive sell territory, but the big picture suggests the uptrend is over.


10:38 am

VIX has clearly risen above the 50-day, confirming its buy (SPX sell) signal.   The NYSE Hi-Lo i still rising to 53.00, not confirming.  We may not see a reduction in the Hi-Lo until (after) the market close.  There may be a bounce, but the uptrend is broken.  This may be a good time to sell longs/buy short positions.

ZeroHedge reports, “Just as everyone was settling on for the long sleep through tomorrow’s J-Hole speech from J-Powell, a blast at Kabul’s airport has catalysed some fear and sent VIX exploding higher…

And that has sent stocks tumbling…


10:17 am

TNX rose above the 50-day Moving Average at 13.39 this morning, confirming the buy signal given yesterday.  The Cycles Model suggests strength will dominate this Cycle starting after Labor Day and lasting through options expiration, a good indicator of a Wave 3.

Mish comments, “Let’s discuss the relationship between tapering, Janet Yellen, Jerome Powell, and president Biden.

Fed's Balance Sheet 2021-07-18

Tapering

At long last the world presumes the Fed will finally taper.’


7:40 am

Good MOrning!

SPX futures declined to 4484.10 before coming back to breakeven with the close.  The requisit number of Waves are evident, as is the target for the target for this Cycle, on day 260.  The average Master Cycle is 258 days (8.6 months).  Since Cycles are organic, not mechanical, the variance may be up to 17.2 days on either side.  The prior 4 Master Cycles were 248 to 252 days, putting me on high alert for the past week.  While this Cycle may extend until after Jackson Hole, it is just as likely that the influence of J-Hole may simply keep the SPX in a tight trading range until Monday.  We must watch for deterioration in the other indicators, as well.

ZeroHedge reports, “S&P futures continue to trade as if paralyzed in a tight 20-point range on dismal volumes just below 4,500 for the 3rd day in a row, and overnight they are fractionally in the red although off session lows, with the Nasdaq 100 down 0.2% and S&P 500 -0.1% amid a retreat in tech shares and commodities as markets remained on edge ahead of Friday’s Jackson Hole virtual gathering where Chairman Jay Powell is expected to speak at 10am and give clues on the upcoming taper. The dollar rose, yields were unchanged at 1.34%, oil dipped and bitcoin slumped.


VIX futures challenged the 50-day Moving Average at 17.43, rising to 17.61 in the overnight session.   It is back under the 50-day, but that challenge indicates a rising potential to move above it.  We’re on a tightrope, but the VIX is only two feet off the ground.  This may be a low-risk entry for a trade in VIX options and ETFs. The ne;xt Master Cycle (high) may not be until late October.

The NYSE Hi-Lo Index closed at 105.00, just above its 50-day Moving Average at 104.00.  Nonetheless, we await for the Hi-Lo to fall beneath 0.00 to affect a change to a sell signal.

CharlesHughSmith opines, “The post-bubble-crash phase is already being prepared: ‘no one could have seen this coming’–except anyone who paid attention to anything other than self-interested shills.

It’s really pretty simple to identify a speculative bubble of epic proportions in stocks: if Wall Street says it’s not a bubble, it’s a bubble. As I explained in The Smart Money Has Already Sold, from the long view the entire game of “investing” (wink-wink) boils down to one dynamic:

Wall Street and the Federal Reserve inflate an unprecedented debt-funded speculative bubble and then lure retail “investors” (i.e. gamblers) in with the promise that the enormous gains are just starting, there’s so much more easy money ahead, etc. Then Wall Street distributes (sells over time so as not to alert the complacent herd of retail punters) its shares of overpriced rubbish (“investments”, heh) to bagholders, and then to everyone’s surprise (or not), the market suddenly crashes as the unsustainable bubble pops.”


Posted in Published | 2 Comments

August 25, 2021

2:30 pm

4501.08…That’s all it needs, folks!


11:50 am

SPX has now exceeded its EW target of 4495.00.  It is very likely that it may rise to 4500.00 or higher.  We are very close to a reversal.  It’s time – day 259.

ZeroHedge comments, “Research analysts publish dozens of complex charts that illustrate the bubble of everything continues to inflate away as central banks expand their balance sheets at record paces. These monetary wonks have distorted traditional indicators and made fundamentals obsolete, leading markets into a dangerous melt-up on a post-COVID basis. In our minds, and what we want to convey to readers: simple is better, and that’s why we’re focusing on margin debt.

Margin debt – the amount that individuals and institutions borrow against their stock holdings as tracked by Financial Industry Regulatory Authority (FINRA) – has soared to record levels since the COVID lows of 2020. It’s a simple indicator of stock market leverage. Turning points in markets develop when leverage is unwound, and Bank of America’s Stephen Suttmeier has spotted “potentially a bearish peak for margin debt in June 2021.” 

“Rising leverage tends to confirm US equity rallies. It is not new record highs for margin debt that we worry about. We get concerned when margin debt stops rising to suggest that investors have begun to reduce leverage,” Suttmeier said. “


7:35 am

Good Morning!

NDX futures appear to have made another all-time high at 15393.40 in the early hours of the day, but appears to have sold off to 15338.40 at this time.  Today is day 259 in the current Master Cycle, so we may be seeing NDX lead a probable bearish reversal after Monday’s panic rally.  Make no mistake, this is topping action at its best.  The market must have investors’ maximum exposure on the wrong side before taking them down.

ZeroHedge observes,  “In his latest note on markets, Goldman’s head of hedge fund sales, Tony Pasquariello, muses on the dog days of summer where “market volumes have receded to their lowest levels of the year and 1-month realized volatility on S&P has leaked into single digits.” And given the lack of tactical action – i.e., the Goldman flow desk is dry as a bone –  Pasquariello,  takes a “step back to think bigger picture on where the markets are headed.”

To do that, the Goldman trader writes that “at the risk of severe over-reduction, here’s one of the most bullish scenarios that I can sketch out for the next year or so … and, one of the most bearish…”


SPX futures are clenched in one of the most narrow trading ranges between 4480.40 and 4491.40.  The break may be sudden and dramatic.  However, in the absence of another catalyst, we may see the markets creep along at these levels until after the Jackson Hole Symposium.

ZeroHedge reports, “US equity futures traded flat near all-time highs in a muted session as traders prepared for the Fed’s annual Jackson Hole symposium with little action across markets. The dollar was steady, while Treasurys and bitcoin fell and oil reversed losses. Contracts on the Nasdaq 100 and S&P 500 were fractionally lower after trading in the green for much of the session. Their underlying indexes closed at a record as strong corporate earnings and a rally in commodity prices outweighed lingering concerns about the threat of Covid-19 to the global economy.”


VIX futures rose to 17.49, challenging the 50-day Moving Average at 17.41 before falling back beneath it.  The stage may be set for a lift-off which may begin in anticipation of the Jackson Hole outcome.


USD futures appear to be consolidating within yesterday’s trading range.  The Cycles indicate no directional movementuntil next week, where trending strength may return.


TNX is on the rise again, having risen above Intermediate-term resistance at 12.77.  This puts TNX  on a buy signal with confirmation above the double resistance at 13.41 to 13.61.  This sets the stage for a 3-4 week rally that may approach 20.00.

ZeroHedge notes, “Three weeks ago, moments after the Treasury released its latest Treasury issuance Sources and Uses report which virtually nobody on Wall Street pays attention to, we confirmed  something we first observed months earlierstealth QE – which as we explained early this year is how the Treasury injected $1.5 trillion of liquidity into the market in the past 12 months bypassing the Fed entirely – was not only over but was about to go into reverse as the US Treasury was set to unleash several hundred billion of quantitative tightening.

The reason: after dropping to a post-covid low of $450 billion, the Treasury’s cash balance would first drop to $300 billion, and then continue declining for the duration of the debt ceiling negotiations (which will conclude successfully at some point in the next 2 months despite days of theatrical posturing as the US will not default) before surging to $800 billion by year end.”


Posted in Published | Comments Off on August 25, 2021

August 24, 2021

2:32 pm

It appears that we are now counting “wriggles” in the pattern.  This is a small extension with a probable target near 4495.00.    All trends end in a 5-Wave impulse, down to the last degree.  I am observing at least 8 degrees of trend, some of which aren’t illustrated for lack of space.    Odd as it seems, there is  a pattern that emerges out of this chaos that may surprise even the best of analysts.

ZeroHedge comments, “The last three days in stock-market-land have been somewhat farcical as stocks have exploded higher (dominated by action at the cash market open) while bonds have refused to follow suit…

Source: Bloomberg

What drove this crazy? Simple – as Nomura’s Charlie McElligott notes – A good ol’ fashion short-squeeze:

Source: Bloomberg

The cross-asset-class strategist noted that yesterday our futures imbalance monitor showed the largest 1d “buy pressure” in S&P futures that we’ve seen over the past month across all lot sizes and the 2nd largest “buy pressure” in NQ futures over the past 1m.”


8:00 am

Good Morning!

SPX futures made a new all-time high in the overnight session, but have pulled back beneath yesterday’s cash high.  Today is day 258 of the Master Cycle, so I would expect some resolution in the next 24 hours.  Wave [v] equals Wave [i] at 4495.00, which is also the location of the Cycle Top.  The point is, anything may happen and the catalyst for the reversal may be a complete surprise.

There are five discernible Waves is Wave [v], which usually means the pattern may be complete.  However, there are ways that it can be stretched to reach , for example, 4500.00.  The point is, we are also at reatest risk of a reversal.

ZeroHedge reports, “Another day, another record high in US equity futures as spoos hit a new record high of 4492 just before the European open, with Nasdaq 100 futs also hitting a record as positive news around U.S. vaccination boosted shares of energy and travel-related companies while expectations of a dovish Jackson Hole boosted overall market sentiment. At 7:30 a.m. ET, Dow e-minis were up 57 points, or 0.16%, S&P 500 e-minis were up 7.5 points, or 0.17%, and Nasdaq 100 e-minis were up 39points, or 0.25%.”


VIX futures have risen off the bottom, but not above the 50-day Moving Average at 17.38.  That is a very low bar to hurdle, so today would be a good day to stay alert for that event.

The NYSE Hi-Lo-Index rose to an intraday high yesterday at 150.00, but closed at a more reasonable 42.00.  Again, confirmation of a sell signal lies below 0.00.


TNX rmains steady beneath Intermediate-term resistance at 12.76.  A buy signal remains above that level with a possible target near 20.00.


Posted in Published | Comments Off on August 24, 2021