May 6, 2022

2:41 pm

What’s amazing is how badly the NYSE is being “hollowed out”  and still seems relatively orderly.  That is because a lot of passive investors do not yet realize how exposed to risk they really are.  When that happens, the bottom falls out of the market.

RealInvestmentAdvice counsels, “Buy and hold” investing. Is it truly a “one size fits all solution” to the investing conundrum? Or are there other considerations that would make such a solution less optimal?

I ask the question due to an email I received recently from one of the large Wall Street firms.

“Despite the tumble to begin this year, investors should not panic. Over the long-term course of the markets, investors who have remained patient have been rewarded. Since 1900, the average return to investors has been almost 10% annually…our advice is to remain invested, avoid making drastic movements in your portfolio, and ignore the volatility.”

As shown in the chart below, the advice given is not entirely wrong. Since 1900, the markets have averaged roughly 10% annually (including dividends). However, that figure falls to 8.08% when adjusting for inflation.

By looking at the chart above, it’s pretty evident that you should invest heavily in the market and “fughetta’ bout’ it.”

If it was only that simple.”


2:31 pm

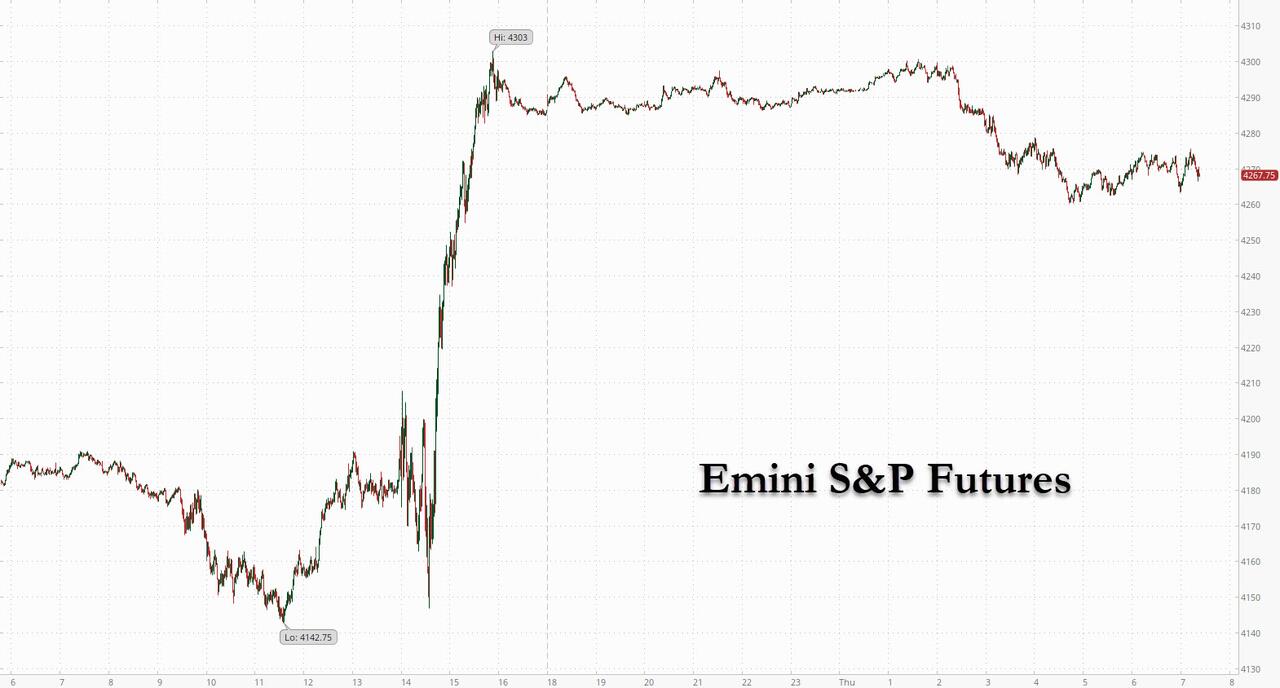
SPX made a lower “irregular” correction barely eking out a  38.2% retracement of the decline from 4307.66.  The correction is over.  Be short or be out.

ZeroHedge informs, “Nomura’s Charlie McElligott was spot on in his explanation for why the market broke yesterday, yet even he is concerned about what is going on today, and writes that in addition to the potential shock of the aforementioned six Fed speakers today (“culminating in tonight’s Hawk-led Bullard / Waller double-banger, where there’s some Delta they could again try to talk-up 75bps hikes”), the week’s crash – which sees the S&P on track for the longest weekly losing streak since 2011 – is also “an Earnings and Valuation story, which is bearing-out again in more “rich” names and (former) favorites of the Growth crowd, and culminating in “absolute scenes” in Growth portfolios, as “obvious liquidations ripple-through the market, with outrageous -2.5- to -3.5-sigma 1-day selloffs yday in bunches of these names, full capitulation.”


7:15 am

Good Morning!

I finally planted my early garden…a month later than usual, due to the cold, wet weather we have been having.  Thank God we have a wood stove that we are still using to take away the chill and damp in our house.  This is not a good start for our local farmers, who still cannot get into their fields, due to the soggy weather.  Corn should be up to 4 inches by now.  Instead, the fields are all brown mud.

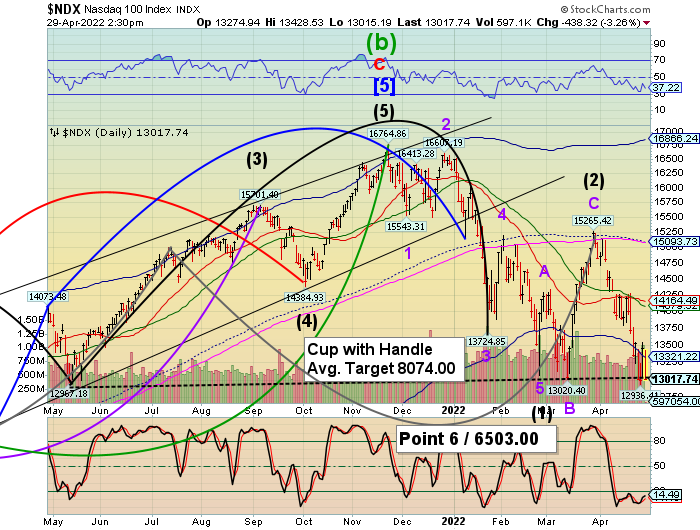
NDX futures made a low of 12742.60 this morning, within yesterday’s wide trading range.  We may see a bounce to test the Cycle Bottom resistance at 13183.86 before a resumption of the decline.  Yesterday was just an appetizer.  The main entrée will be much more substantial.

In today’s expiring options, Max Pain is at 13075.00.  Long gamma may begin at 13100.00, while short gamma starts at 12800.00.

ZeroHedge remarks, “What a crazy 24 hours!

I do want to buy risk into the close, but am still a bit cautious because

  • 1) my childish charts point to more downside on nasdaq
  • 2) so many people expected the FOMC meeting to mark a turning point that money got put to work yesterday and shorts came off, exposing the market
  • 3) and yes, I understand, TQQQ is not “the” driver, I think it is symbolic of risk and buy the dip… it started seeing heavy inflows April 26th. It is lower than at any point since then (down 17% today as I type). On rebalancing alone, it will sell into close, but if we see capitulation from recent dip buyers, we have more downside.

I am the least bearish I’ve been in some time, but too scared to get bullish”


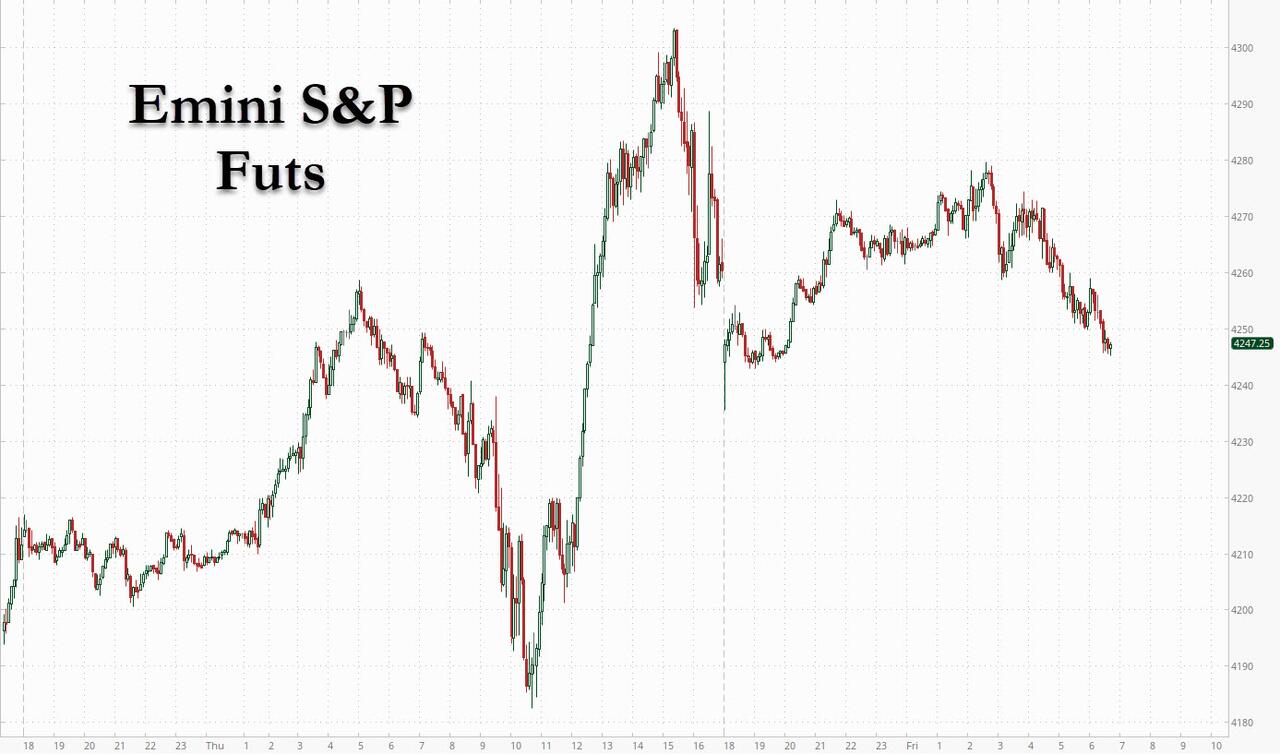
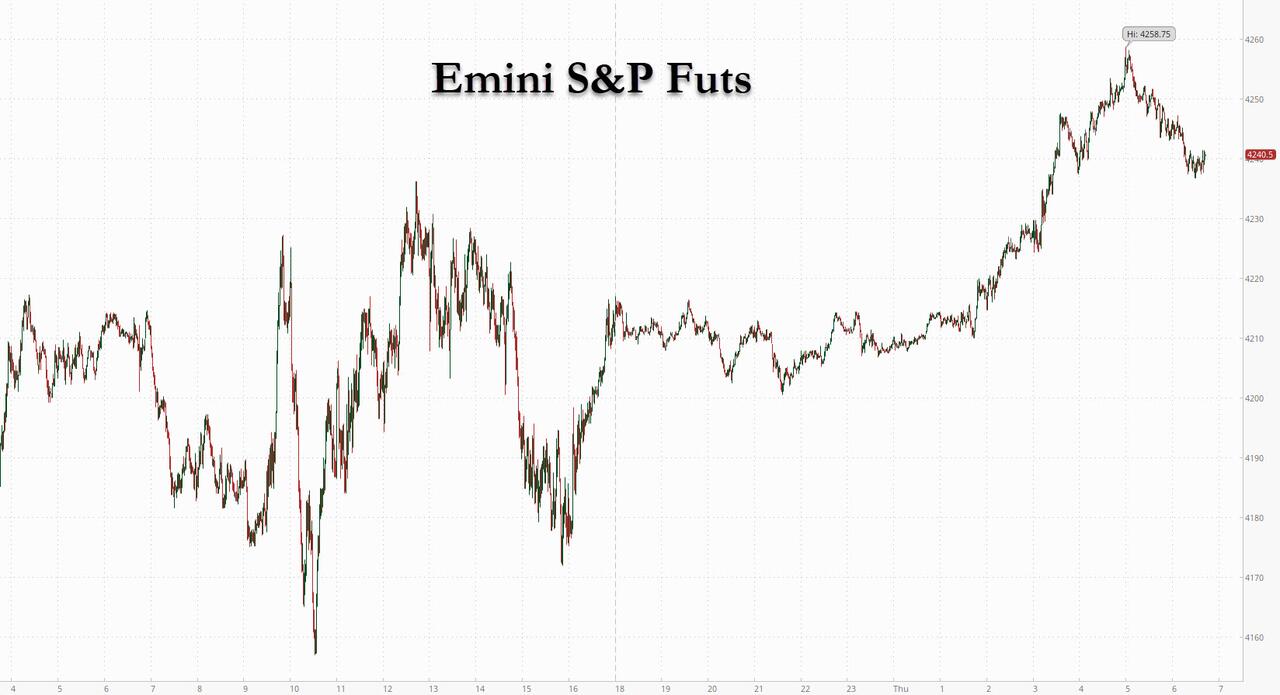
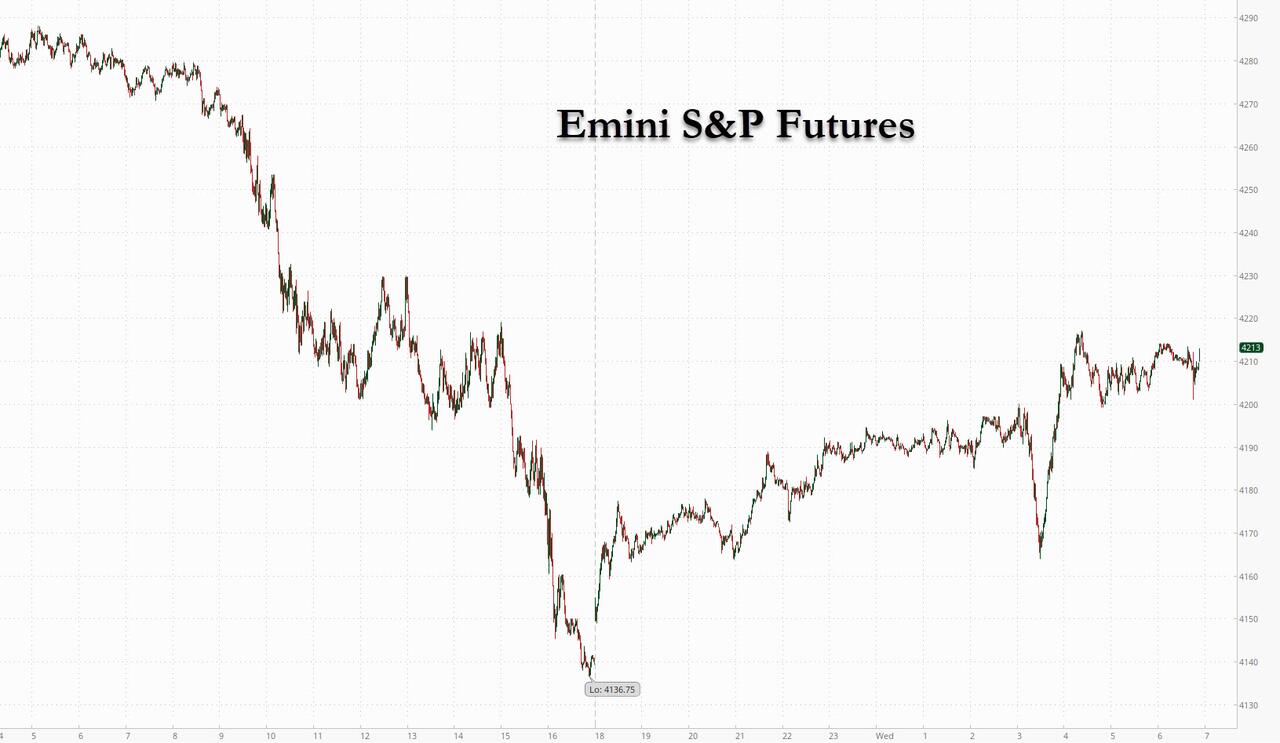
SPX  futures are back down to the Lip of the Cup with Handle, but it may be poised for a brief bounce as high as the Cycle Bottom resistance at 4190.44.  The whole market awaits the BLS monthly jobs report.  A weak report suggests that the Fed may go easier on future rate hikes…or not.

In today’s options expiration, SPX is deep in the short gamma zone beneath 4200.00.  This has the potential of a bloodbath.  As bad as yesterday’s decline was, the NYSE Hi-Lo “only” declined to -326.00.  It has a long way to go to meet its target.

ZeroHedge reports, “The market crash will continue until Biden’s approval rating improves.

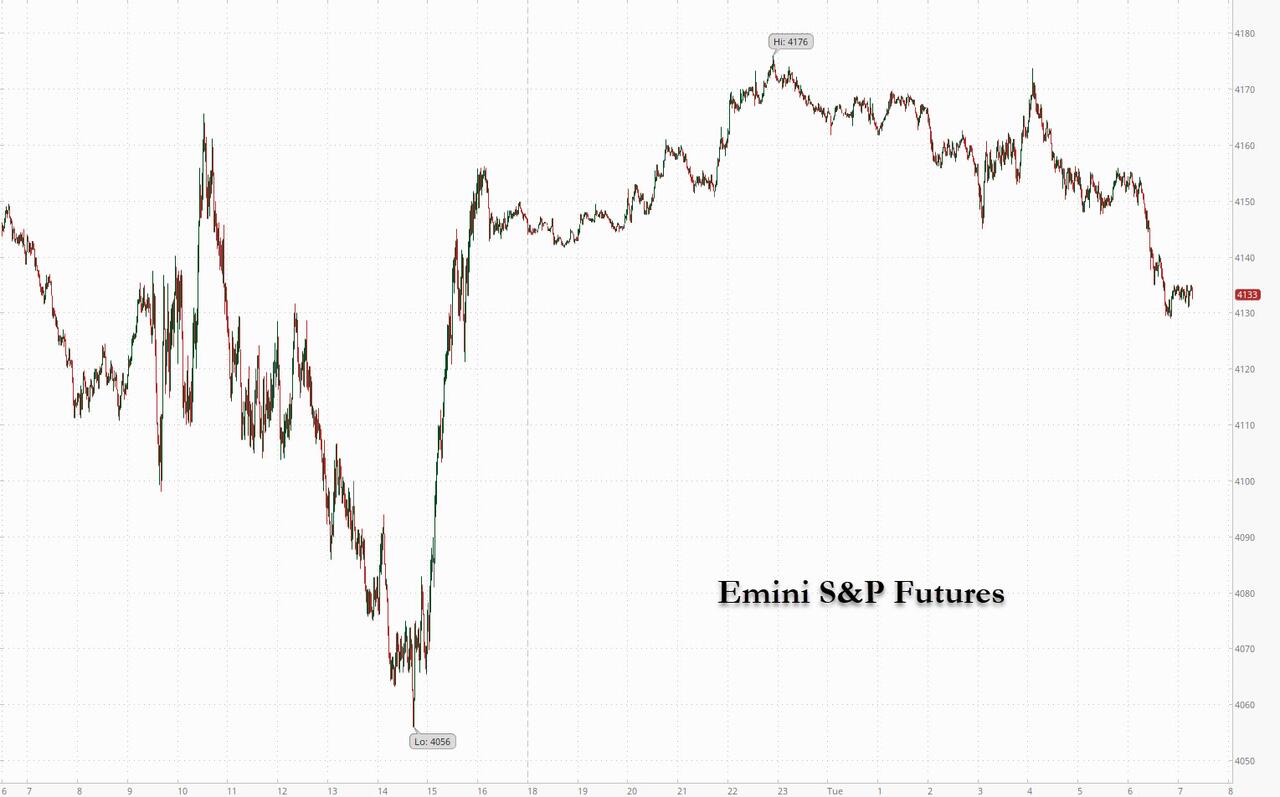
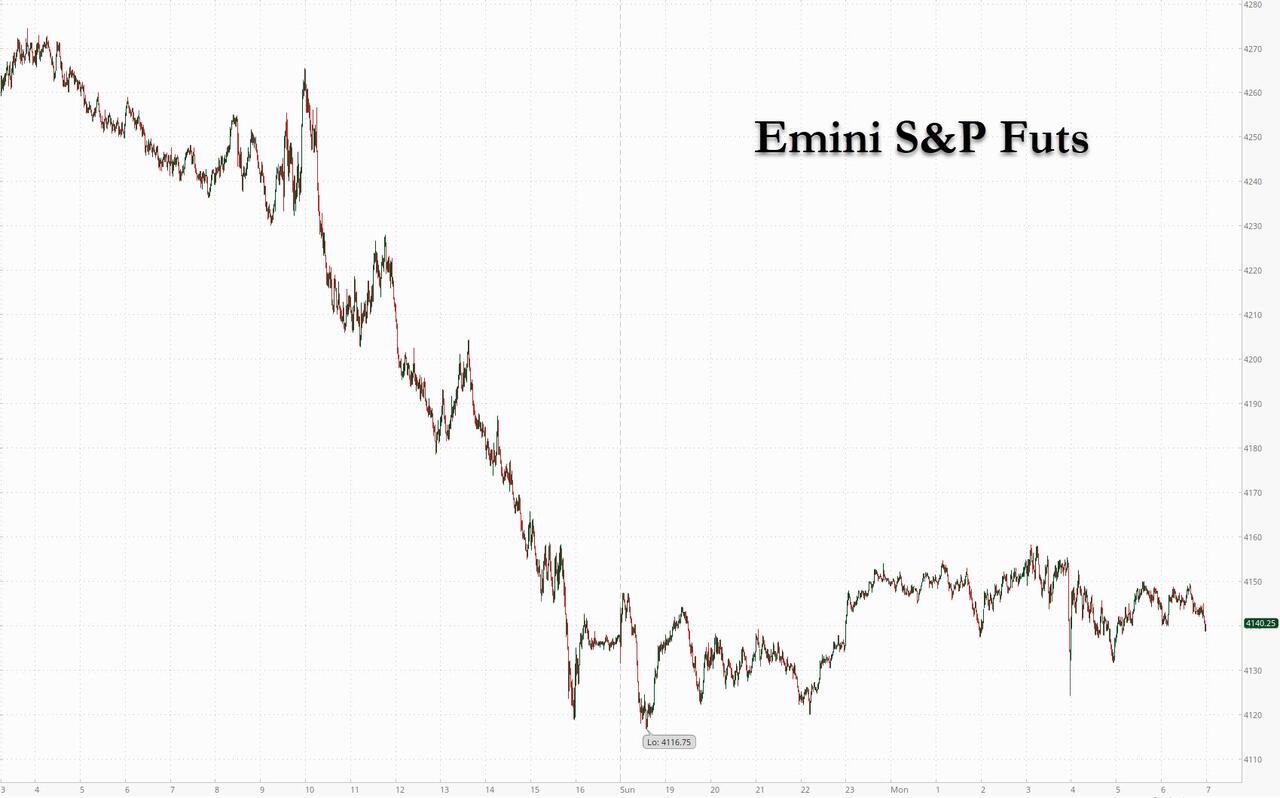
US futures extended their slide on Friday, signaling continuation of a drop in tech stocks following the Nasdaq 100’s biggest selloff since September 2020, ahead of today’s jobs report (which bulls pray comes in at around minus 1 million to put a premature end to Powell’s market-crashing tightening) and ahead of no less than six Fed speakers, as investors grappled with fears of a stagflationary recession against tightening monetary policy. Nasdaq 100 futures were 0.9% lower and S&P 500 futures traded at session lows, down 0.7% as of 7:30 a.m. EDT as panicked traders sell first and don’t even bother to ask questions. Ten-year U.S. Treasury yield continued to climb, trading at 3.1%, near the highest since November 2018. The dollar continued its relentless ascent, while cryptos continued to tumble. Perhaps even more concerning to traders than the jobs report is that six Fed speakers are lined up including Williams, Kashkari, Bostic, Bullard, Waller and Daly.”


VIX futures rose to a new high of 33.39 this morning.  It may be poised to break through the neckline near 40.00 today.  The Cycles Model suggests a VIX high in early June, while it implies the SPX may see a Master Cycle low in late May.  It normally should match the VIX high with the SPX low, so it poses a conundrum.  Which will it be?


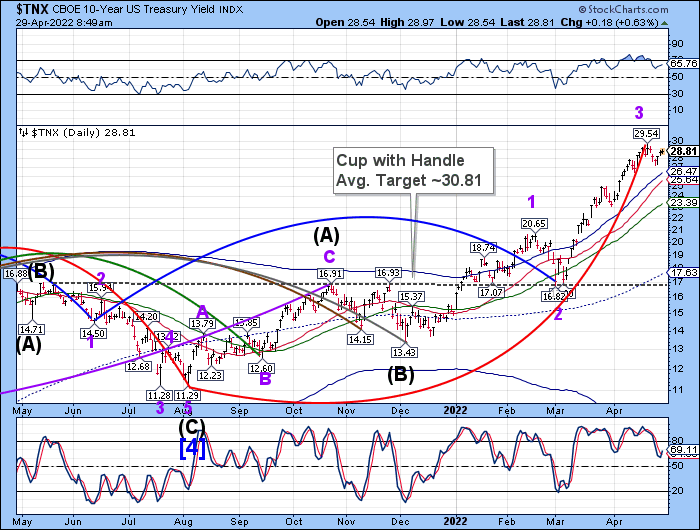
TNX retreated from yesterday’s extended Master Cycle high (day 274) after making the Cup with Handle target.  What follows is a 4-week decline to the 50-day Moving Average at 24.36.

ZeroHedge observes, “We argued yesterday that the sharp decline in front-end yields was exaggerated by the unwind of speculative short positions, but we did not expect for that move to nearly fully reverse today as Treasury yields rose 11-16bp.  Given this reversal, it’s tempting to say the market is coalescing on our view; however, we do not think this represents a more hawkish reassessment of yesterday’s FOMC meeting, as the long-end led the way to higher yields.

Notably, there have only been 6 instances over the last decade in which 30-year bond yields rose more than today: the top 3 were all amid the worst of market dysfunction in March 2020 which forced the Fed to intervene in unprecedented fashion, the fourth was the day after the presidential election in 2016, the fifth was a stronger-than-expected payroll release on a low-liquidity Friday around the July 4th holiday in 2013, and the sixth was in December 2015 when the ECB disappointed market’s expectations for additional stimulus.”


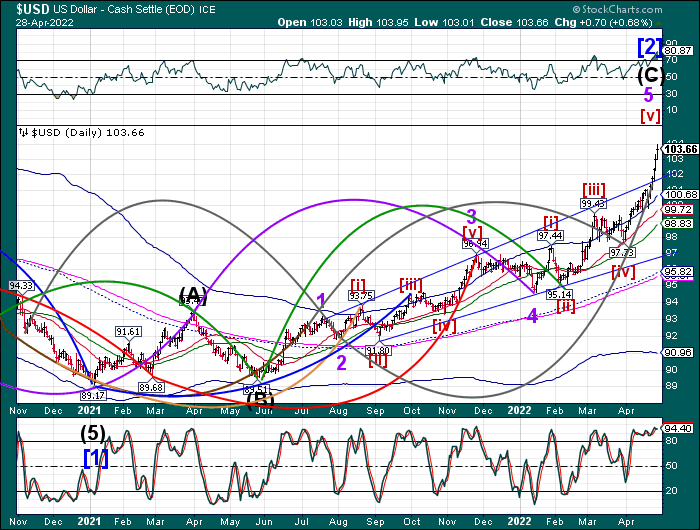
USD futures reversed this morning after marginally beating the March 2020 high both intra-day and closing.  It took 279 days to complete this Master Cycle.  The new Master Cycle may take the USD lower until mid-June.


Posted in Published | Comments Off on May 6, 2022

May 5, 2022

11:05 am

BKX has been in an overlapping, contentious decline from January 13, 2022.  Although there may be different interpretations, the decline may be an extended one, with the worst at our doorstep.  The new Master Cycle is not due to end until the end of June.  Be prepared for the worst.


10:14 am

NDX is testing the Lip of the Cup with Handle formation near 13050.00.  The warning of a quick and sharp reversal was appropriate, as one can see.  SPX may not be far behind.  Most analysts are not aware of the Cup with Handle formation.  Thus, it is in little use in the mainstream.  One of the features is that it is similar to the Head & Shoulders, which is in common usage, but with some differences.  The main one is that the Lip is permeable and may be criss-crossed multiple times, giving the impression of no trendline at all, versus the Head & Shoulders, which has a fairly solid neckline.  Once it is crossed, there is no going back.  Since there is so little recognition of the differences, analysts often ignore the formation, to their detriment.  Another difference is that the target is a Fibonacci calculation, which is often ignored, since it can be higher or lower than the Head & Shoulders target.

NDX is also nearing its Maintenance Margin requirement for many investors.  Those on margin may soon be getting calls as losses exceed their maintenance margin.  This, plus short gamma, may sound the death knell for may overconfident investors.

10:25 am

Note that the NDX has now crossed beneath the Lip and the decline is intensifying.

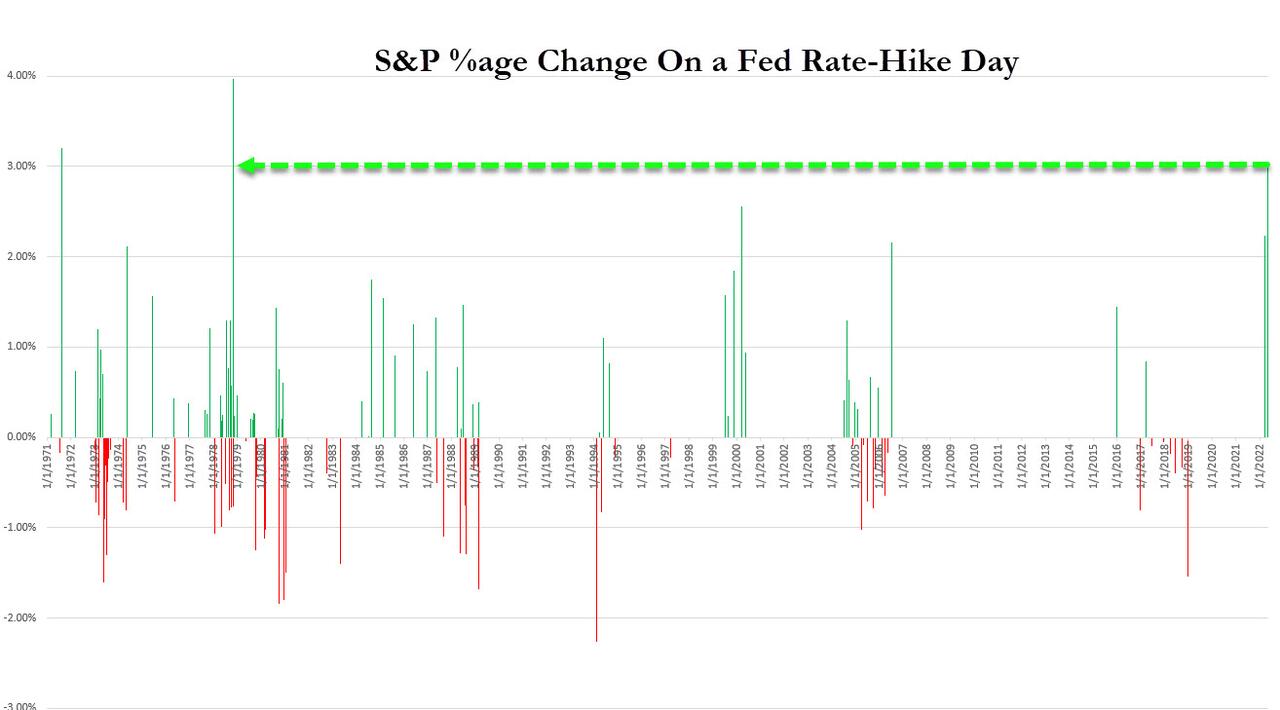
ZeroHedge remarks, “After yesterday’s biggest gain on a Fed rate-hike day since 1978…

It appears short-squeeze ammo and gamma has run out as Nasdaq pukes back all of its gains…

8:00 am

Good Morning!

Where are we?  I have chosen to highlight the weekly chart to show the dimensions of where we may be.

NDX futures promptly reversed after the closing bell and made a low of 13378.30 this morning.  Yesterday’s bounce may have been a purely mechanical event, where a momentum ignition shook out the late comers to the shorting game.  The bounce did not make the 38.2% retracement at 13684.26.  Speculators have been buying short -term puts near the lows with a day-trading mindset, only to have lost it all while dealers have to buy back their shorted shares that would have covered those puts.  The Cycles Model suggests a probable 12,9 more trading days to go in the decline as the next move may break through the Lip of the Cup with Handle formation.   Note that the intended target may be the 10.5-year trendline, which was not broken in 2020.  This target may be met later this month.

ZeroHedge observes, “David Wright is known for his ability to lead his funds through periods of intense volatility, like 2008, where his fund nearly broke even on the year while the major equity index shed half of their value. His losses during the COVID rout of 2020 were also relatively mild.

But those market ructions will likely be remembered as relatively staid in comparison to the selloff that’s just around the corner. According to Wright, who shared his thoughts on the market during an interview with Bloomberg, both of these periods – along with the dotcom crash – both had nothing on the crash that lies ahead.


SPX futures made a morning low of 4265.20 as it begins the decline through its Cup with Handle formation.  In doing so, it may also re-enter the massive Orthodox Broadening Top that ultimately lands at or beneath Point 6 in late Summer.  In this Master Cycle, the Cup with Handle formation makes its play, declining beneath the weekly Cycle Bottom at 2702.32.  Investors think of buying puts as “insurance.”  It’s not.  It is simply a transfer of risk to the dealers and hedge funds.  That is why we have short squeezes, to relieve the burden of carrying the brunt of the short speculation.

ZeroHedge reports, “After yesterday’s torrid, Powell-inspired meltup which saw the S&P soar the most since May 2020 (just days after its biggest drop since June 2020)…

… U.S. futures paused their surge after Jerome Powell eased fears that the Federal Reserve will unleash an even more aggressive tightening path and took a 75bps rate hike off the table. As of 745am EDT, S&P 500 futures dropped 0.6%, while Nasdaq 100 contracts fell 0.8%, as investors digested Powell’s vow to curb inflation, while acknowledging it could inflict some “pain” to the economy. In fact, an example of just what the Fed is fearing came earlier today when the BOE hiked 25bps as expected, but warned a stagflationary recession is be imminent as the central bank now expects GDP to contract while inflation rises double digits in the coming months, which is precisely what happens when central banks are far behind the curve. ”


VIX futures are moving higher, hitting 26.54 earlier this morning.  The next step is crossing the neckline of the Head & Shoulders formation.  The minimum Target for the H&S formation is in the mid-60’s.  However,  note that Wave [3] cannot be the smallest Wave and is often a multiple of Wave [1].  With that in mind, it may be possible to see Wave [3] well over 100.00 by August.   Should that take place, another risk we may face is market closure or stiff restrictions on what we can do in the market, such as no shorting.  Should that happen, it may make matters much worse, since that will leave no buyers at the lows to cover their shorts.

The NYSE Hi-Lo Index closed at -278.00 despite the rally.  That is ample evidence of short covering rather than new money  buying stocks.

ZeroHedge observes,

“Even the most circumspect friend of the market would concede that the volume of brokers’ loans – of loans collateraled by the securities purchased on margin – is a good index of the volume of speculation.”

– John Kenneth Galbraith, The Great Crash 1929

About a year ago, I noted that the “Index of the Volume of Speculation,” also known as margin debt, was in the process of putting in a blowoff top. The absolute level had reached record highs, suggesting that we were witnessing a degree of speculative activity that surpassed anything since the late-1920’s stock market mania Galbraith was specifically referring to in the quote above.

What’s more, it’s important to note that margin debt may be merely representative of a much larger use of leverage in things like asset-backed loans, call options, futures, leveraged ETFs, total return swaps, etc. All told, the total amount of leverage employed in the markets for risk assets may, in fact, be even larger than that earlier, ominous precedent.”


TNX made yet another marginal new high on day 274 of the Master Cycle.  A reversal may be imminent.  Once it takes place, the Cycles Model suggests a decline for the remainder of the month.

Posted in Published | Comments Off on May 5, 2022

May 4, 2022

10:06 am

You may recall that I had suggested a “normal” retracement may go back to 4300.00.  Well, SPX appears to have formed a Triangle this morning at a minute scale that suggests the retracement to 4300.00 may indeed happen.  Or not.  “Someone” may try to ignite a short-covering spree that may go above long gamma at 4250.00.  Then we may see 4300.00.  However, should it fail beneath 4250.00, the decline begins immediately afterward.  A decline beneath 4150.00, where short gamma begins, may propel the SPX into a panic decline.


8:10 am

Good Morning!

NDX futures rose this morning, but did not exceed yesterday’s high at 13178.74.  That may the high for this segment of the decline since it occurred exactly on day 34.4 of the potential 51.6-day decline.  By the way, day 17.2 occurred on good Friday, thus the low was at the Holy Thursday close.  Today’s expiring options turn positive at 13100.00 while long gamma appears at 13200.00.  Options turn short at 13050.00 and short gamma kicks in at 13000.00.

QQQ expiring options (close: 318.82) turn long above 319.00 and long gamma begins at 321.00 while options favor puts at 317.00 and short gamma begins at 317.00.  These are very tight parameters for a day that lends itself to high volatility and tight liquidity.


SPX futures also did not break through yesterday’s high at the 34.4-day pivot of a probable 51.6 -day decline.  This allows 17 calendar days of decline from here.  Should the Cup with Handle formation be accurate, that would give us a probable 40% decline in that period.

Today’s expiring options turn long at 4205.00 and short at 4200.00.  Long gamma begins at 4250.00 and short gamma starts at 4150.00.  These also are very tight parameters for a high volatility day.

ZeroHedge reports, “May the 4th is here, and US futures are up slightly ahead of a key Federal Reserve meeting in which the Fed is widely expected to raise rates by 50bps, the biggest hike since the dot com bubble burst in May 2000, and to release plans for balance-sheet normalization; Chair Powell’s post-meeting press conference will provide guidance on potential for bigger rate hikes at subsequent meetings and policy makers’ assessment of the neutral rate. As DB’s Jim Reid puts it, “if you’re under 43, did 3 years at university and then joined financial markets then you won’t have worked in an era of 50bps Fed rate hikes. This will very likely change tonight as the Fed are a near certainty to raise rates by 50bps. In fact it’ll be the first time the Fed have hiked at consecutive meetings since 2006. So we enter a new era that won’t be familiar to many.”


VIX futures made a new low at 28.86 and bounced, but remains beneath yesterday’s close.  Today is day 30 from the April 4 low, a half trading Cycle is being made.  While the VIX is a rough inverse of the SPX, they do not run on identical Cycles.  The Cycles Model suggests a possible Master Cycle high at or soon after the monthly options expiration on May 20.  There are indications that the high may be stretched until early June.


TNX is hovering just beneath Monday’s Master Cycle high.  The Cycles Model now calls for a probable 30-day decline to the end of May.  A likely target seems to be the 50-day Moving Average at 23.94.  This may be due primarily from the knee-jerk reaction of money fleeing from declining stocks.

Zerohedge reports, “The US Treasury said on Wednesday, just hours before the Fed unveils its balance sheet-busting Quantitative Tightening, that it trimmed its quarterly sale of longer-term debt for a third straight quarter (with the largest cuts coming in the seven-year and 20-year maturities) and also warned that it may make further reductions, citing “strong” federal tax revenues.

The Treasury said it was trimming issuance by smaller increments than in previous quarters based on projected funding needs that include strong tax receipts and potential redemptions of Treasury securities as par tof the Fed’s QT.”

ZeroHedge (Bill Blain) emotes, ““Who’s more foolish: the fool or the fool who follows him?

Central Banks have one real job: avoid inflation! It’s here, and the consequences will be devasting as conventional rate-hiking wisdom is used to fight a wholly exogenous supply side shock. There may be alternatives, but “credibility” is everything to Central Banks.

May the Fourth be with you! It’s Star Wars Day!

Which is kind of apt as the global economy feels like it’s about to do a Death Star impression: exploding in a fireball of incandescent fury… all because someone skimped on the design of a monetary policy exhaust vent… You know the rest…”


USD futures continue to trade inside yesterday’s range as the reversal evolves.  The final bit of strength may have been wrung out of the rally.  The next Master Cycle (low) may occur in mid-June.


Crude oil jumped to a high of 107.39 this morning, giving a buy signal.  The Cycles Model suggests a rally to the week of June 20.  Confirmation comes as it rallies above the Cycle Top, a reliable indicator of a strong Primary Wave [3].

Zerohedge estimates, “With earnings season underway, America’s shale producers are expected, almost across the board, to report stellar earnings, but as Bloomberg reports, they’ll also be taking huge losses from hedging against falling oil prices.

In total, BloombergNEF estimates that through next year, U.S. shale companies will face $42 billion in oil and gas hedging losses, based on 2021 data. That means that while balance sheets might remain intact, companies will spend big to exit positions. ”


Posted in Published | Comments Off on May 4, 2022

May 3, 2022

11:53 am

SPX appears to be weaker than one would expect for a normal retracement.  I would revise the target for the correction to merely rise to 4220.00-4230.00, should current weakness continue.   Be aware that a reversal may be abrupt and strong.  This may be the beginning of a panic decline not seen since October 2008.

ZeroHedge remarks, “The go-to bullish indicators highlighted by pundits these days are the high levels of sidelined mutual fund cash and the AAII investor sentiment survey hitting its highest bearish reading since 2009:

Traditionally, these signals suggest that most of the carnage is priced into markets, indicating that it might be time to buy. However, these data sets only illustrate ACTIVE investor sentiment. Given that passive funds, by definition, do not strategically manage their cash levels nor do index fund patrons pay $40 per year to participate in the AAII survey, these figures give us little insight into the passive investing world. In stark contrast, Vanguard has reported net inflows to their passive vehicles of $400 million for the month of March (i.e. one behemoth is still buying). More evidence that passive investors remain all-in can be found in the lack of redemptions world-wide:”


11:16 am

SPX opted for the reversal above 4037.00 and a swift retracement.  A 38.2% retracement would rise to 4282.00 while a (less likely) 50% retracement may go as high as 4350.00.  Regardless of the target, the retracement should be over in 24 hours.  Whether you step aside to avoid the bounce or not, be prepared to go short again in the next 24 hours.

ZeroHedge warns, ““Clearly you don’t want to own bonds and stocks.”

Those were the ominous words uttered by billionaire hedge fund manager Paul Tudor Jones (PTJ) this morning during an extensive interview on CNBC’s ‘Squawk Box’.

With The Fed expected to hike by 50bps tomorrow (and the short-term interest-rate market starting to price in 75bps for June) and 10 more hikes for the full-year… as financial conditions tighten and the economy contracts, CNBC reports that the founder and chief investment officer of Tudor Investment Corp. believes that we are now in “uncharted territory” as the central bank had only eased monetary policy during past economic slowdowns and financial crises.

Specifically, PTJ warned investors to prioritize capital preservation in such a challenging environment for “virtually anything.”


7:50 am

Good Morning!

NDX futures are retesting the Lip of the Cup with Handle formation this morning.  The bounce from yesterday’s low may be complete as NDX attempts neutrality in the options market.  While options are light, tomorrow’s expiration turns long at 13060.00.  Long gamma is likely to begin at 13200.00.  They turn short at 13050.00 with short gamma starting at 13000.00.  Of course, we await the FOMC announcement on Wednesday afternoon.

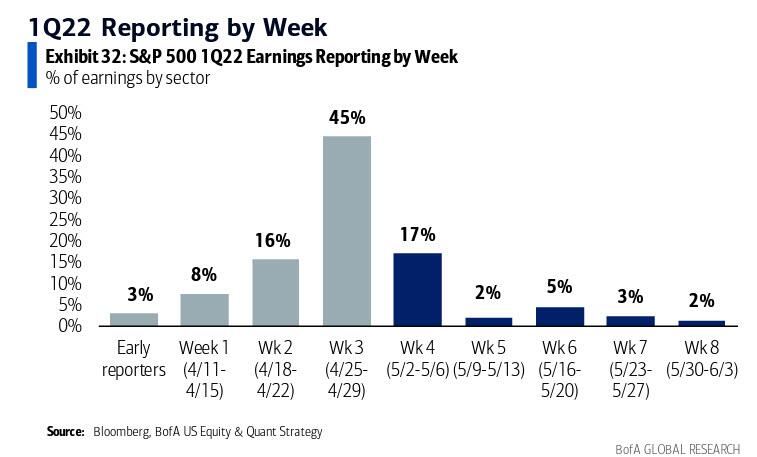
ZeroHedge observes, “Last week, when we commented on corporate earnings ahead of the upcoming “week 3” deluge of earnings where a whopping 46% of S&P500 companies would announce results, we summarized the sorry state of affairs as follows: “Q1 Earnings From Bad To Dismal: Tech Earnings Sliding, Guidance Collapsing.” In the 7 days since, things have only gotten from “dismal” to even worse, and as Bank of America’s Savita Subramanian writes in her weekly Eranings Tracker now that week 3 is in the history books…

…. we have clearly reached the “end of euphoria” phase.”


SPX futures appear to be consolidating between the Lip of the Cup with Handle and the Cycle Bottom resistance at 4203.38.  There are approximately 3 weeks to the next Master Cycle Bottom in which to achieve the Cup with Handle target.  While the bounces are spectacular, the declines are far deeper.

Tomorrow’s options expiration shows Max Pain at 4140.00.  Options turn positive at 4150.00 and long gamma begins at 4200.00.  Expiring options turn short at 4110.00 and short gamma begins at 4050.00.  There is very little wriggle room for the FOMC announcement to tip the market in either direction.

ZeroHedge reports, “After initially trading higher, extending the momentum of yesterday’s last-hour meltup which saw US stocks close near session highs after plunging earlier, on Tuesday US futures hit an air pocket shortly after the European open, and slumped 0.5% at 715am EDT, as investors braced for more hawkish shocks from the Federal Reserve whose two-day meeting start today and is expected to announce its biggest rate hike since 2000. Tightening turmoil slammed bond markets: 10Y TSYs traded just below 3% after hitting the 4-year old milestone on Monday. Germany’s benchmark rate rose above 1% for the first time since 2015, while the corresponding yield on U.K. bonds climbed above 2% earlier on Tuesday. Australian bonds slid, and the currency jumped, after the nation’s central bank hiked rates costs by more than all economists had expected. The US dollar dipped, oil was lower while cryptos and gold traded flat.


VIX futures are hovering near the Cycle Top support/resistance at 32.13.  There may be a final retest of the 50-day Moving Average at 26.31.  However, it may be short-lived.


TNX is pulling back from its Master Cycle high on day 271.  The Cycles Model calls for a month-long decline that may test the 50-day Moving Average at 23.75.  The Cup with Handle target is still active with a july-August time frame for completion.

ZeroHedge remarks, “It was about a year ago, when the calendar was moving from the end of the first quarter of 2021 and into the second quarter, when we first observed something unexpected about the single biggest catalyst behind the forceful emergence of the “reflation trade” in the first quarter, which many interpreted as markets pricing in higher long-term inflation and strong growth. Yet in reality as we reported last year, the move which coincided perfectly with the end of Japan’s fiscal year on March 31..

… was largely, if not exclusively, a byproduct of Japan’s giant pension fund, the GPIF, drastically shifting out of treasuries as it slashed its US Treasury exposure by a record amount.”


USD futures eased down to a low of 103.06 this morning.  While the Master Cycle calls for a reversal, the time for a decline is about six weeks, allowing for a decline to the lower trendline of the Broadening Wedge.  Should the uptrend not be broken, the Cycles Model allows for a resumption of the rally through early 2023.


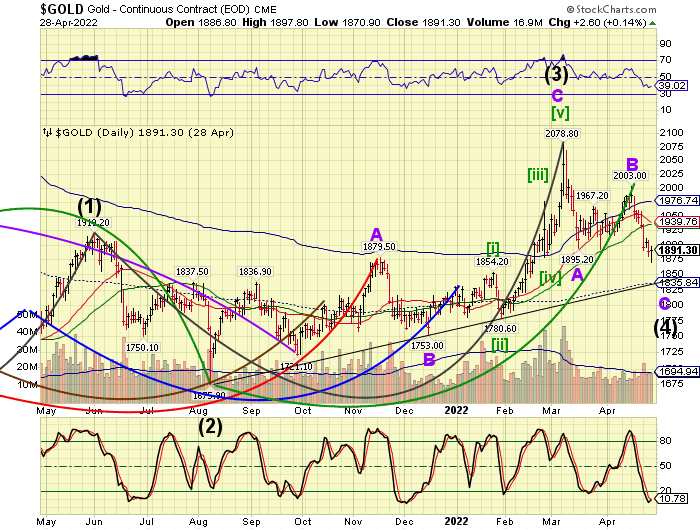
Gold futures may have started a bounce after testing its trendline and mid-cycle support at 1836.94.  The low was made on day 266 of the Master Cycle.  This allows for a final surge to a possible all-time high near 2250.00 by the end of the year.


Posted in Published | Comments Off on May 3, 2022

May 2, 2022

3:19 pm

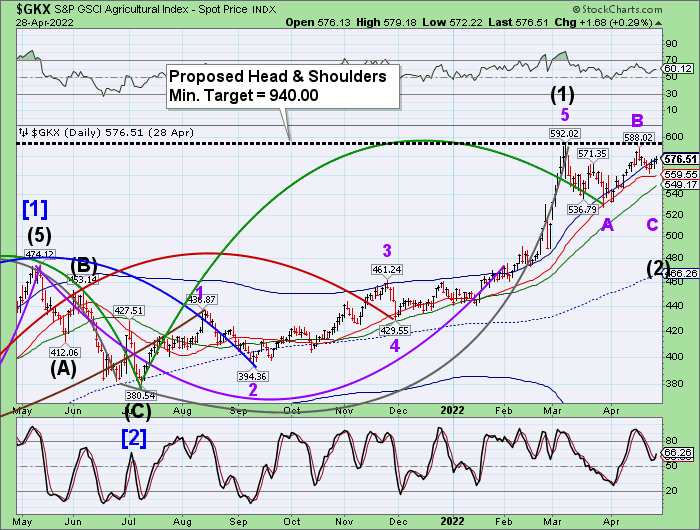
The Ag Index may have just made a very shallow, irregular correction on day 263 of its Master Cycle.  We should await a clear reversal pattern with a probe above the Cycle Top resistance at 580.63 to take action.  Once it rises above that level, the moves may be explosive.  The first Wave above the neckline may last through the end of May.

How about planting a garden?

ZeroHedge comments, “There is growing concern farmers worldwide are reducing chemical fertilizer, which may threaten yields come harvest time, according to Bloomberg. The repercussions could be huge: Lower yields may exacerbate the food crisis. 

There are alarming signs commercial farmers in top growing areas in the world are decreasing the use of essential nutrients — nitrogen, phosphorus, and potassium.

Revealed last week, SLC Agricola SA, one of Brazil’s largest farming operations, managing fields of soybeans, corn, and cotton fields in an area larger than the state of Delaware, will reduce the use of fertilizer by 20% and 25%. ”


3:09 pm

TNX finally hit 30.00, as suggested.  But it may not last.  A sharp reversal taking TNX doen to the 50-day Moving Average may be in the works.

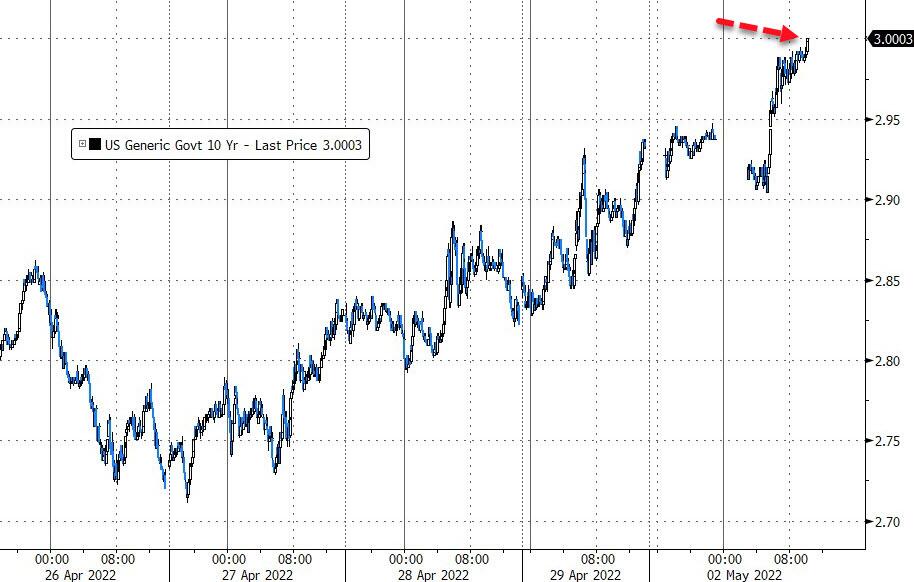
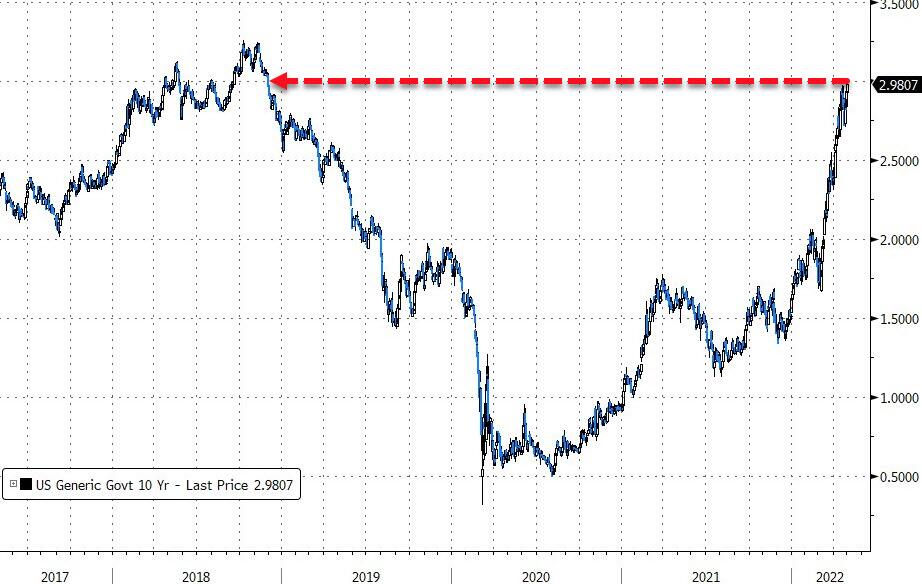
ZeroHedge remarks, “US 10Y Treasury yields just topped 3.00% this afternoon…

That is the highest yield since Dec 2018, right before Powell flip-flopped away from his hawkish stance…


2:43 pm

SPX is approaching a possible target where Wave [v] achieves equality with Wave [i] at 4037.00.  This leaves us with two options.  The first is a possible bounce at that level or higher.  However, should it exceed that level to the downside, the second option of an extended Wave [v] is achieved beneath 3966.00.

ZeroHedge comments, “One week ago, Wall Street’s second biggest bear (after BofA’s Michael Hartnett who turned rather apocalyptic last Friday, and of course excluding SocGen’s Albert Edwards who is in a category of his own), said that “there is no place left to hide” in stocks as the rolling bear markets finally hit the broader index, and warned that the bear market rally (which he was correct about unlike all of his JPMorgan peers) was about to turn “grisly” (or is that grizzly).

Fast forward to his latest Weekly Warm-up note (available to professional subscribers in the usual place), where he takes a prompt, well-deserved (again) victory lap on his latest dismal forecast, and writes that after suggesting last week that the bear market was entering the phase when virtually nothing would work, even defensives, “based on the price action, that seems to be exactly what’s happening” with price action turning “especially vicious” last week as we enter the next phase of the bear market. Indeed, while the S&P 500 dropped “only” 3.4%, the breadth suggested the move was even worse with the cumulative advance / decline line making new lows for this bear market. Defensives were a very modest underperformer for the week (-0.5% relative) even though they remain the unequivocal leader year to date (+15% relative).”


:40 am

Good Morning!

NDX futures are deep within short gamma territory.  There was a bounce over the weekend to 12982.00, but the gains were given back by morning.  Currently the futures are plumbing new lows.  In today’s options expiration, Max Pain is at 13190.00.  Short gamma begins at 13050.00.  The Cycles Model gives us three more weeks to make a Master Cycle low.  Trending strength may be very high during that time.  The Cup with Handle target may be within reach during this Master Cycle.

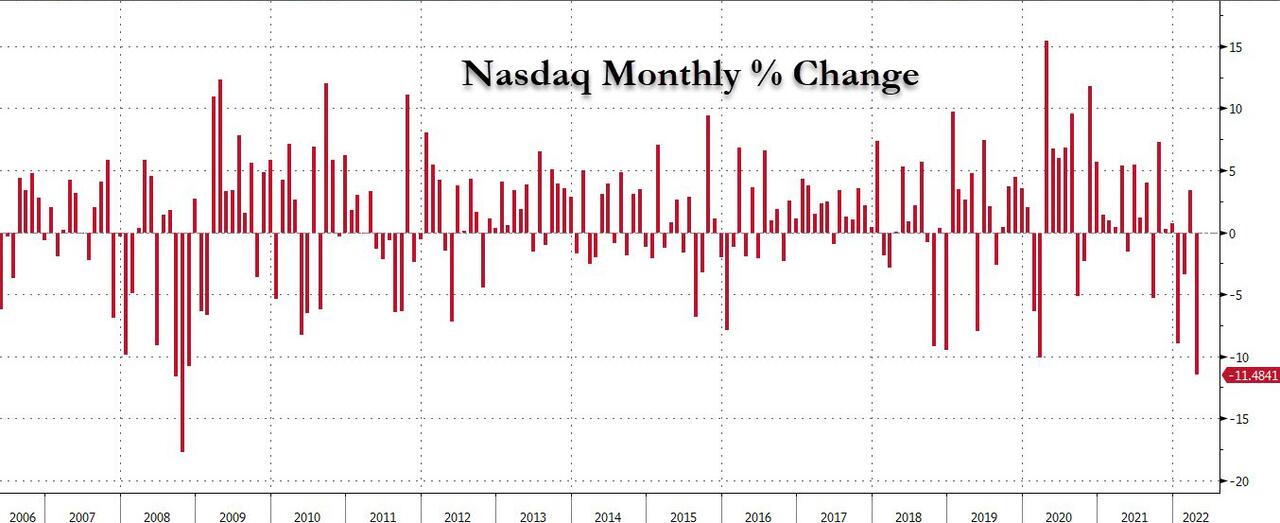
ZeroHedge observes, “The Nasdaq’s 13% plunge in April was its biggest monthly drop since Lehman’s collapse in 2008.

That is the 12th worst month ever. To be the worst month ever you have to beat October 1987 that has a 27% decline. The poster-child of this bear, ARK Innovation, actually managed to (-28% in April).”


SPX futures rose to 4163.10, unable to challenge the Cycle Bottom at 4209.13.  SPX is currently challenging the Lip of the Cup with Handle formation at 4120.00.  Not shown in the Daily chart is that the SPX closed on Friday at the upper trendline of a 3.5-year Orthodox Broadening Top.  A Wave (3) low in May may bring the SPX down to its Cup with Handle target  near 2542.85.  Another potential Master Cycle low in August may bring the SPX to its Wave [1] low near 2100.00.

In today’s expiring options, Max Pain is near 4180.00 while short gamma begins at 4125.00.

ZeroHedge reports, “One trading day after epic carnage shook global markets, US index futures staged a modest recovery on Monday after Wall Street’s worst selloff in almost two years. S&P 500 Index contracts rose 0.1% from an 11-month low, while Nasdaq 100 futures gained 0.4% with volumes thinned by holidays in several markets including the UK, China and Hong Kong. European and Asian stocks fell as disappointing corporate earnings, expectations of global monetary tightening, poor data from China and the prospect of sanctions on Russian oil weighed heavily on risk appetite. The VIX remained elevated, trading above 33, as investors braced for a week that’s likely to see a global round of monetary-policy tightening that will add to concerns about global growth. 10Y Treasury yields pushed higher again, rising to 2.94% before easing ahead of this week’s key event, the Fed’s upcoming 50bps rate hike. The dollar gained as worries over high inflation and China’s Covid lockdowns contributed to investor caution, and sent the offshore yuan sliding to just shy of 6.69m the lowest since November 2020. Gold extended its slump and Brent oil dropped about $2 to trade around $104.50.”


VIX futures rose to 34.87, above its Friday high.  The ;Head & Shoulder neckline may be exceeded as the SPX declines through the Lip of the Cup with Handle formation.  Today is day 262 of the current Master Cycle with a high anticipate in the next three weeks.  As for Wednesday options expiration, VIX is in long gamma territory above 27.00.


TNX hit a new high this morning at 29.67, thus far.  As mentioned last week, TNX is going through a brief period of strength that may push it to 30.00 before a reversal.  From this point, we may see a decline through the month of May.  The proposed target may be the 50-day Moving Average at 23.56.


USD futures are consolidating within Friday’s trading range.  A full reversal may not be recognized until a decline beneath the trendlie at 102.00 occurs.  USD is in limbo.


Crude oil futures declined to 100.30, back beneath the 50-day Moving Average at 102.76 this morning.  This give crude a confirmed sell signal that may last up to 2 months.  The minimal target is the lower trendline of the Broadening Wedge formation at 70.00.  Should it exceed that,  a further decline to 50.00 is proposed by the Broadening Formation.

ZeroHedge comments, “A majority of Americans still don’t believe the Biden administration’s ham-fisted attempts to shove the “Putin’s Price Hike™” narrative down our throats.

According to a new Rasmussen poll, when asked whether Biden or Russian President Vladimir Putin is to blame for higher fuel prices, “76% of Republicans think Biden bears most responsibility for higher fuel prices, as do 24% of Democrats and 54% of voters not affiliated with either major party.”

What’s more, 84% of likely US voters believe the rising price of gasoline, home heating oil and other petroleum products is a ‘serious problem.’ 61% say it’s a ‘very serious problem.'”


Posted in Published | Comments Off on May 2, 2022

April 29, 2022

2:30 pm

NDX is beneath the Lip of the Cup with Handle formation for the second time.  There is likely to be no recovery as the mutual funds are all lined up to sell in the final hour of the day.  A month ago the Cup with Handle target appeared to be dubious.  Today it appears to be realistic…and that is only Wave (3)!

ZeroHedge exclaims, “Earlier today we observed that the Nasdaq was on pace for the worst month since 2008, and judging by the ongoing collapse in the tech index which is now down more than 2% and trading reading near session lows ahead of today’s margin calls that’s pretty much assured.

But thanks to Deutsche Bank we have stumbled on an even more remarkable state.

As the bank’s head of thematic research Jim Reid writes, and sparing us the obvious TS Eliot references, today is the last business day of the month and we could see something in April we’ve only seen three other times since our data starts in 1973: a month where S&P 500 returns fall more than -5% AND US Treasuries fall more than -2%.”


9:50 am

The Ag Index continues its corrective moves with a month-long decline in the works.  The proposed target may be near 520.00-525.00 by the end of May.  The correction is a great place to accumulate shares as the breakout may be powerful.  Time to plant/expand that garden.

ZeroHedge reports, “The effects of pandemic lockdowns, related supply chain strains, and conflict in Ukraine are wreaking havoc on the world’s agricultural system. Readers have heard the likes of the UN warning that Middle Eastern countries are at “breaking points” as food prices hit record highs, and as of last week, the Rockefeller Foundation began the countdown (about six months) to a “massive, immediate food crisis.”

Now, Goya Foods CEO Bob Unanue has issued a similar warning: “We are on the precipice of a global food crisis.” 

In a Wednesday interview, Unanue told Fox Business’s Maria Bartiromo, “Americans will have to tighten their belts and consume less,” in response to her question about a potential food shortage crisis.”


9:44 am

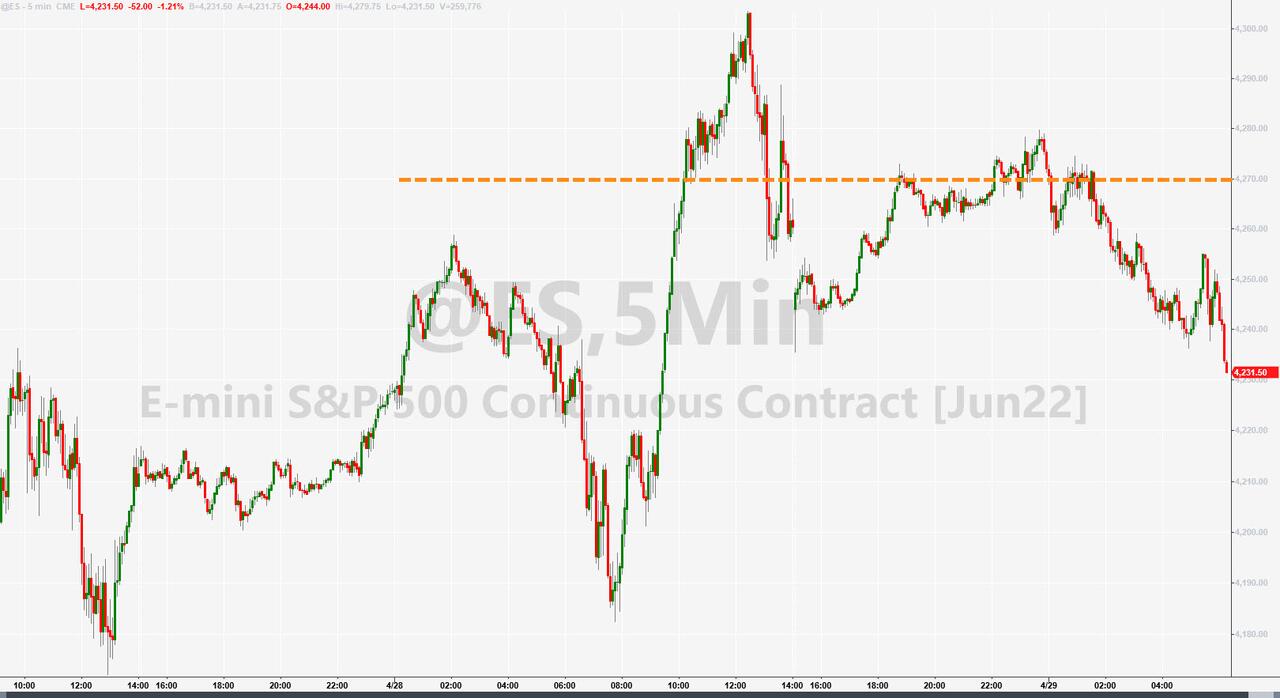
SPX is back in short gamma territory beneath 4270.00.  This elevates the probability of a meltdown beginning today.

ZeroHedge notes, “As we noted yesterday, options positioning was extreme and provided a lot of fodder for a short-squeeze (which we saw in yesterday’s panic-bid in US equities). However, AAPL and AMZN stole the jam out of that donut overnight and as Nomura’s Charlie McElligott notes, the pivot level which folks will be watching is ES 4270, where the Street is short 9100x Put at that strike that expires today (as part of a customer’s monthly Put Spread Collar program – where they are long 9100 SPX 29Apr 3600 / 4270 PS vs short the 4695 calls, a ~$4B hedge), which obviously lost Delta into yesterday’s booming rally and was clearly a large part of the “Short Gamma” scramble and hedging-squeeze higher in the market yesterday (the 4270 Put went from an 80 Delta put at 10am to a 46 Delta put, so Dealers had to buy ~$1.25B in futures to remain neutral).

But as we all know, “Short Gamma” goes two ways, so as the Put has now gone from a 46 Delta to a 57 Delta with the move overnight, this has created ~$600mm+ of Incremental selling pressure as well; FWIW, the customer tends to roll to a similar Put Spread Collar in June month-end around 11am (h/t J Pierce and H Homes)”


8:00 am

Good Morning!

NDX futures slipped beneath the Cycle bottom support at 13359.51 to an overnight low of 13181.40.  The retracement rally, strong as it was, is over.  The question is, how long will it take to make new lows beneath the Lip of the Cup with Handle near 13030.00?

As for today’s options expiration, Max Pain is at 13460.00.  However, the gamma-weary dealers and hedge funds were delivered a serious blow after hours with diminishing liquidity.  Short gamma begins at 13300.00, so the battle lines have been drawn.  QQQ options (closing price; $328.01) offers Max Pain at 327.50 and short gamma begins at 325.00 with reinforced selling every 5 points beneath it.

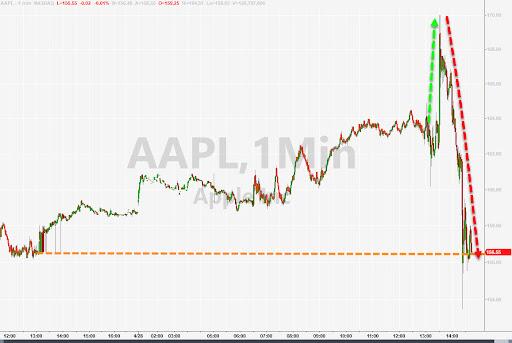
ZeroHedge observes, “Update (5:45pm EDT): Just when it seemed that AAPL stock would provide the much needed pillar of support to offset the tumbling AMZN and keep the Nasdaq from plunging tomorrow, with its stock initially jumping after hours, AAPL has since sunk, fading an $8 AH gain and dropping as much as 6% to $152, after it warned on the earnings call that supply constraints would cost the company $4 billion to $8 billion in the current quarter, casting a pall on record-setting results that the company just reported.

Covid restrictions, which have swept China in recent weeks, will take a toll on the June quarter, the company said on a conference call, and even though last quarter’s sales and profit had topped analysts’ estimates, fueled by strong demand for the iPhone and digital services, and the company announced $90 billion in new stock buybacks, the stock has staged a nearly $20 reversal lower in the after hours session.


SPX futures declined to 4240.00, threatening the Cycle Bottom support at 4215.65.  Yesterday was a Cycle turn date at 30.1 days from the March 29 high at 4637.30.  In today’s options expiration, Max Pain is at 4325.00.  Short gamma begins at 4270.00.  Short covering left the SPX near short gamma territory.  Should the markets fail today, the decline may be swift and deep, regardless the oversold condition.  There are 22 days left to the bottom in this Master Cycle.  The entire 2020 crash only took 22 days.

ZeroHedge reports, “It has been an illiquid, rollercoaster session on the last day of the week and month, which first saw US index futures modestly rise alongside European stocks propped up by surging Chinese and Asian markets following Beijing’s latest vow to use new tools and policies to spur growth, however the initial move higher quickly faded as markets remembered that not only did Amazon report dismal earnings (with Apple also sliding on weak guidance) but the Fed is set to hike 50bps (or maybe 75bps) next week, and put a lit on any upside follow through. As a result, S&P500 futures dropped 0.9%, while Nasdaq futures retreated 1.1% on the last trading day of April, adding to their 9.3% decline so far this month and on pace for the worst monthly performance since November 2008 as fears of rising rates hurt bubbly growth shares and fuel risks for future profits. The yen snapped a slide while staying near 20-year lows. The yuan, euro, pound and commodity-linked currencies made gains while the dollar dipped. 10Y TSY yields rose, rising by about 4bps to 2.87% while gold moved back above $1900. Bitcoin tumbled as usual, and last traded back under $39,000″.


VIX futures declined to 28.62 as it consolidated within yesterday’s trading range.  Normally VIX would decline to the 50-day before moving higher.  However, yesterday was day 17 (a turn date) from the Wave(2) low.  The possibility of fireworks today is very high.

The NYSE Hi-Lo Index closed at -501.00.  This is not a time to be bullish.


TNX is approaching its peak this morning as a brief period of strength may push it to 30.00.  TNX is still in a correction phase and is likely to resume its decline next week, making this move a red herring.  The Cycles Model suggests a decline may last through the end of May.

ZeroHedge reports, “After a strong 2Y, and a subpar 7Y auction earlier this week, we end the week’s coupon issuance with an auction of $44BN in 7Y paper which came in just right.

The high yield of 2.908% was  a whopping 41bps higher than the March auction and was the highest since Nov 2018, just before the Fed panicked and ended its tightening (of course, inflation back then was well lower). And even though yields have been grinding higher all day, the auction tailed the 2.891% When Issued with a “decent” 1.7bps tail, the biggest since December.

The 2.41 bid to cover was in line with recent prints, and while it dipped from last month’s 2.44, it was above the 2.34 six-auction average.”


USD declined this morning, leaving the high in debate as yesterday’s close was 103.66 vs 103.61 on March 19,2020.  The intraday high on March 17, 2020 was 103.98 vs 103.95 yesterday, day 272.   The Cycles Model calls for a 6-week decline which may take it to the mid-Cycle support at 95.82.  If it stays above that level by the end of June we may see a resumption of the uptrend through early next year.


Crude oil continues its consolidation above the trendline.  It may test the Cycle Top resistance before a two-month decline.  A decline beneath the 50-day Moving Average at 102.59 gives a sell signal.


Gold futures offered some hope in the overnight market by bouncing to 1921.86.  However, is is giving up that gain and may quickly slide back beneath 1900.00 as it continues its correction.  The Cycles Model suggests that gold may continue its decline through mid-June.  The uptrend may be preserved should it remain above the mid-Cycle support at 1635.84.


Posted in Published | 7 Comments

April 28, 2022

3:42 pm

BKX, our liquidity proxy, is proof that liquidity is being drained from the markets.  the Cycles Model suggests the new Master Cycle may decline through the last week of June.

ZeroHedge observes, “As three of America’s largest banks kicked off the US financial industry’s annual gatherings this week, conservative activist investors are pummeling them over “woke” Marxist agendas, as corporate boards have become swept up in “stakeholder capitalism” – the World Economic Forum–endorsed concept that companies shouldn’t just serve their shareholders, but society at large.”


3:30 pm

SPX may have reached a Minute Wave [iv] this afternoon at the 4300.00 resistance level.  With all the short covering done, there is little energy to go higher.  Money flow is negative, as the NYSE Hi-Lo Index is at -362.00.  Once the dealers and hedge funds realize there is no new cash coming into the market (in fact, money is exiting), they will begin to gamma hedge.    In fact, it may begin this afternoon.

Some analysts are calling this rally bullish,  However, the retracement was less than 42% of the decline from 4512.94.


8:30 am

Good Morning!

The SPX futures roller coaster continues as they ranged from a low of 4205.0 to a high of 4263.00.  The cash market is poised to open at the 61.8% retracement of the decline from 4300.00 at 4245.45.  The Cycles Model does not anticipate reaching 4300.00.  Instead, the decline may resume to cross the Lip of the Cup with Handle near 4125.00.

Dealers are struggling to get SPX to close at Max Pain today above 4300.00 for tomorrow’s options expiration.  However, the problem is that speculators/hedgers have gotten smarter and have bought large put positions all the way up to 4300.00, while calls are lackluster beneath 4300.00.

ZeroHedge reports, “U.S. index futures, European bourses and Asian markets all rose as “good enough (if hardly stellar)” earnings reports from Facebook parent Meta Platforms and Qualcomm boosted sentiment (just don’t look at the collapse in Teladoc). As we hit the peak of earnings season, with Apple, Amazon and Twitter set to report earnings today, S&P futures jumped 1.5%, while he Nasdaq futs jumped 2.2%, fuelled by a nearly 20% surge in Meta, which would be its biggest post-earnings jump since 2013. Investors were happy after Facebook added more users than projected in the first quarter, even if revenue growth slowed to just 7%, the lowest since the IPO. The dollar continued its relentless ascent, boosted by a plunge in the yen (more here) rising to the highest level in more than five years thanks to nominal US yields which are the highest in developed markets. WTI futures traded at around $102 a barrel. The 10-year Treasury yield was down some 2 basis points to 2.8147%. Bitcoin climbed, trading just below $40,000.


VIX futures declined to an overnight low of 29.35, but have bounced back above 30.00 this morning.  This appears to be a consolidation that may still test the 50-day Moving Average at 25.96 before moving higher.  The panic buying on Tuesday must be worked off  for another day or two.

Options expiration shows Max Pain in the May 4 expiration is at 26.00, so the move back down (at least temporarily) to the 50-day makes sense.  However, the Cycles Model shows VIX “heating up” in the month of May.

The NYSE Hi-Lo closed at -574.00 yesterday.  Despite the mechanical short-covering rallies, the NYSE is decidedly weaker.


TNX is tracking higher this morning and the Cycles Model shows a surge in trending strength through the weekend.  We may se TNX hit 30.00 over the next week before moving back down through the end of May.  This may be a fake-out catching some off-guard.

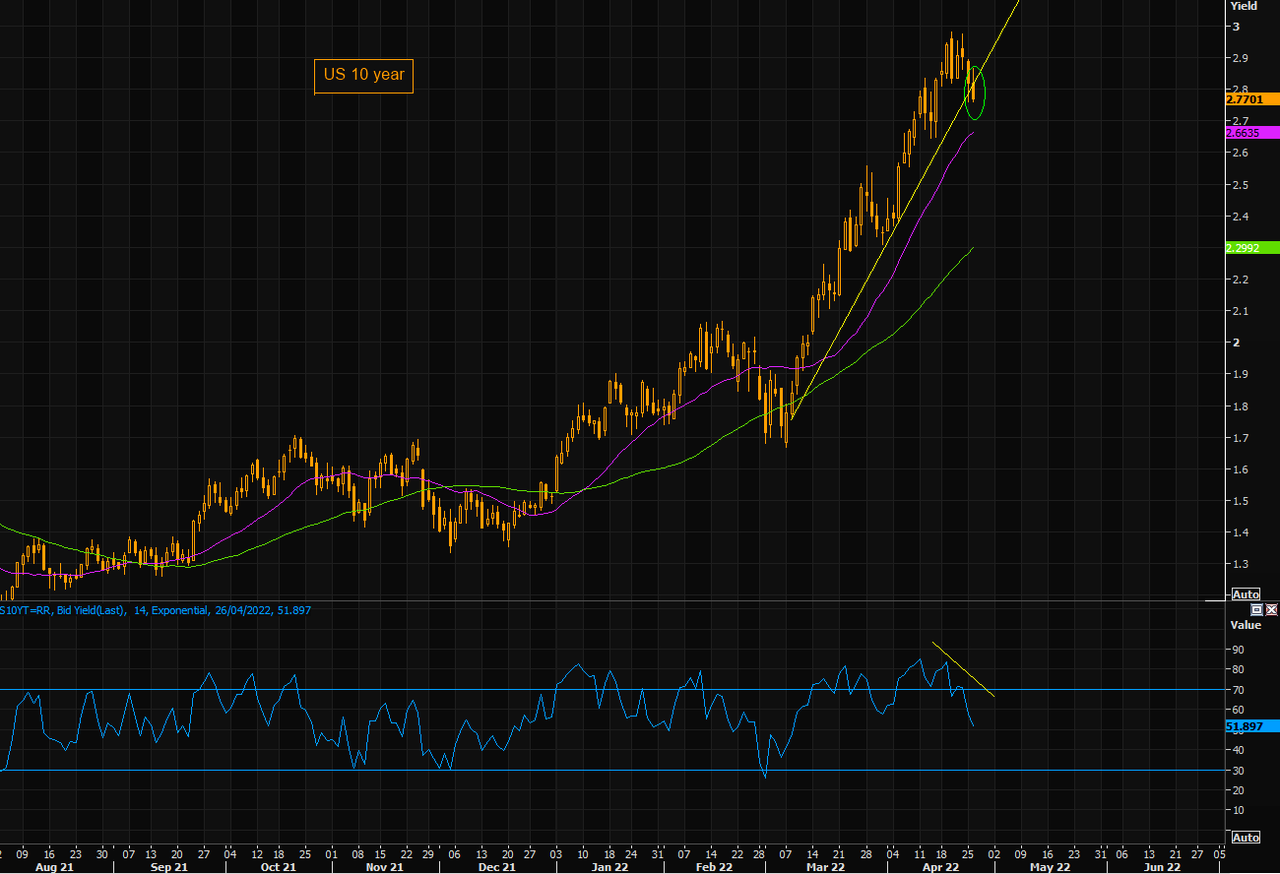
ZeroHedge (TME) comments, “Rates reversing?

The move lower in yields continues getting very little attention. So far the move is relatively small, but we are about to close below the steep short term trend line. 21 day is at 2.66% and 50 day is at 2.3%! Note the negative RSI divergence.

Source: Refinitiv

US 5 year – breaking below the trend?

A close here or lower in the 5 year (yield) and the steep trend line is broken. First support is the 21 day at 2.71. 50 day is all the way down at 2.3%. The negative RSI divergence is of concern for those looking at yields moving higher in the short term.


USD futures made an overnight high of 103.95, nearly breaking out above the March 2020 high, as seen in the weekly chart.  Today is day 272 in a rather stretched Master Cycle.  Should it exceed the 2020 high, the next target may be the April 2001 high at 121.21.

I may have mistakenly marked the March 2020 top as a completed Cycle Wave II.  However, the latest moves may make that high as Primary Wave [A] of Cycle Wave II.  Primary Wave [C] of Cycle Wave II may not be complete until March 2023.  The 61.8% retracement of the USD decline is 126.87.


Posted in Published | 1 Comment

April 27, 2022

7:20 am

Good Morning!

I am leaving early to assist a son in a project that may take all day.  I’ll do my best with the little time I have.

SPX futures declined further to 4154.70 early this morning.  It has since made a 38.2% retracement of the decline from  4299.02 to the futures low at 4154.00.    Futures have since slipped back beneath 4200.00 where short gamma prevails.  The incursions into short gamma territory  beneath 4200.00 have tested the resolve of the dealers to remain bullish.  They may be throwing in the towel.  If so, a new low near 4000.00 may be in the cards in the next 48 hours.

ZeroHedge reports, “After the worst day for stocks in a long time, which saw the Dow plunge 800 points or 2.2% and the Nasdaq tumble almost 4% to the lowest level in nearly a year, it seemed that Wednesday would be another puke fest, with Google tumbling as much as 10% afterhours after reporting mixed earnings that missed on YouTube revenues and EPS, and dragging the Nasdaq with it. However, solid results from Microsoft as well as some long overdue stability in Chinese markets helped to reveres the dour mood, and aside for a brief but sharp selloff around the time Europe opened, US equity futures have been a diagonal line up, with the Nasdaq recovering from its lowest level in nearly a year, as dip buyers returned on corporate earnings and “all out” stimulus pledges by China.  As of 7:00am ET, S&P 500 and Nasdaq 100 contracts each rose around 0.8%, 10Y yields rose 3bps to 2.77%, the dollar rose again and Brent was flattish around $105.”


VIX futures made a low of 30.33 this morning, but appears to be resuming its climb back above its Cycle Top at 31.45.  The next target appears to be the neckline of the Head & Shoulders formation at 38.94.   Should that barrier be exceeded, the H&S target may be achieved as early as the third week of May.


TNX futures continue their decline as the correction unfolds.  The Cycles Model implies the correction may last through the month of May, so a likely target may be the 50-day Moving Average currently at 22.89.  However, the correction is very shallow thus far and a period of strength may be emerging to run TNX still higher, possibly to 30.00, in an expanded correction as early as this weekend.


USD futures made a new high at 102.83 this morning on day 271 of the Master Cycle.  The Cycle is stretched, but still within normal parameters.  It is approaching its early 2020 high at 103.96.  Should it breach that level, the next target may be the Monthly Cycle Top at 105.26.


Posted in Published | Comments Off on April 27, 2022

April 26, 2022

4:00 pm

NDX just took out the March 15 low at 13020.40 and is now officially in a bear market with a loss of 22.4%.  The chances of a recovery are nil.

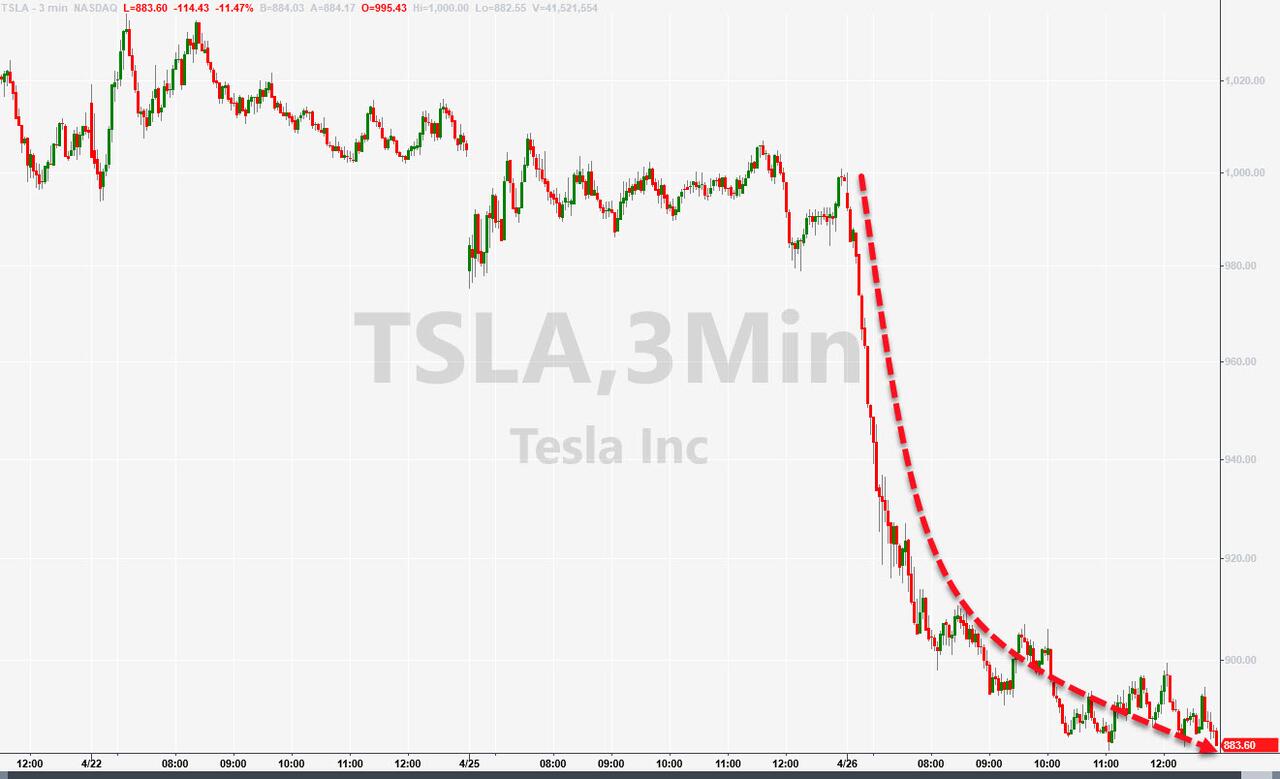
ZeroHedge observes, “As Elon Musk made yet more headlines today – by doing nothing today apart from tweeting this…

It appears someone decided he needed to be punished for daring to preserve free speech (oh the horror!) as TSLA shares tumbled over 11% today, raising questions from many on who was behind this move…

As Trey Henninger (@TreyHenninger) detailed, “If $TSLA stock hits $570, Elon Musk will be margin called on his Twitter purchase loan. If that occurs, he’ll have two business days to either pay the entire $12.5 billion margin loan, post $3.57 billion USD in CASH, or sell his $TSLAQ collateral shares. So, Soros has to short TSLA to 570 to kill the deal.”

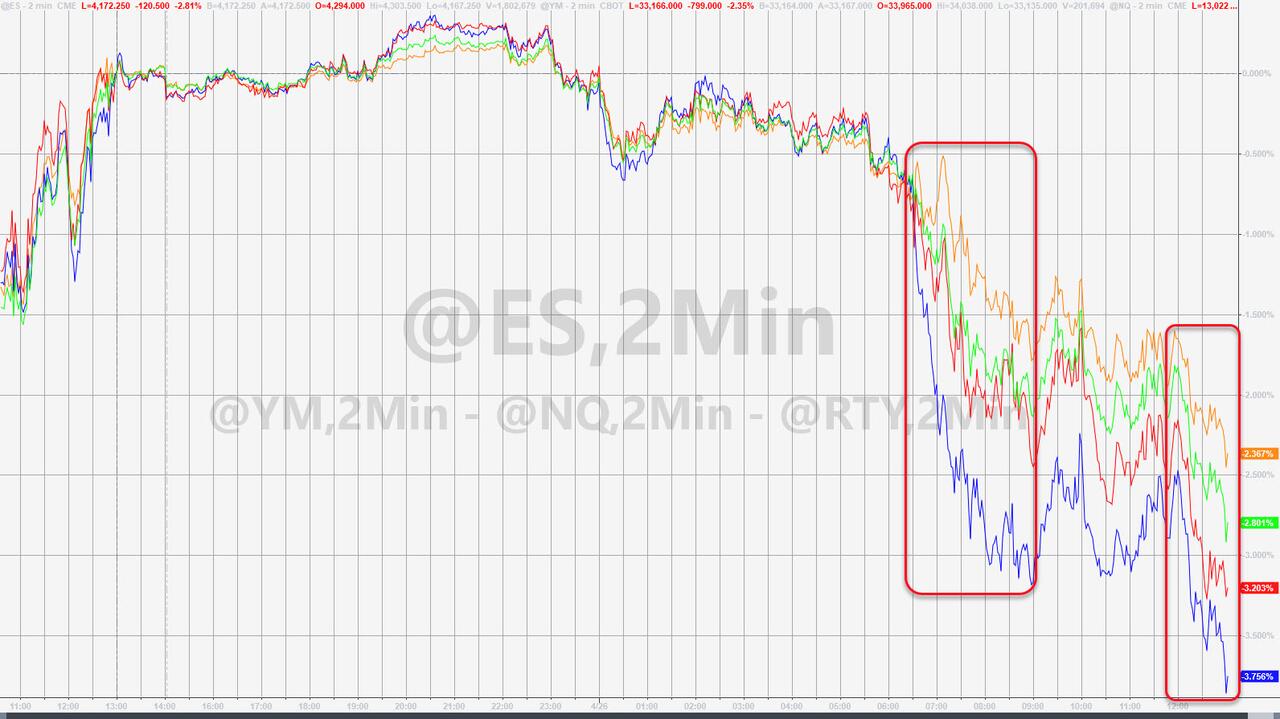
TSLA’s tumble weighed heavily (given its weighting) on the major indices, with Nasdaq clubbed like a baby seal today, back below March’s lows (down 3.5% today)…Nasdaq’s worst day since Sept 2020


3:09 pm

SPX is pressing down on 4200.00 to see if it holds.  Unfortunately, the declining impulse, consisting of 5 Waves, may finish near 4033.00, where Wave [v] achieves equality with Wave [i].  A probable alternative is that Wave [v] may be a multiple of Wave [i], due to short gamma beginning at 4200.00.

ZeroHedge (TME) is afraid to say the “B” word, “SPX approaching must hold levels

SPX is closing in on the huge 4200 level. The index has remained stuck inside the 4200/4550 range for months, with a few occasional over/under shootings. Note the 100 about to cross the 200 day moving average…not a great longer term development.

Source: Refinitiv

NASDAQ – to hold or not to hold

NASDAQ has been stuck inside the 13k/15k range since late January. We are currently at the big 13200 support, and we have seen tech under shoot down to the 13k level before reversing violently. Let’s see how this develops from here, but since the 100 day crossed the 200 day, things have been rather “fluid”.”


12:27 pm

SPX bounced at the 2-hour Cycle Bottom at 4203.00 just after the European Market close.  It has since rallied and may attempt to reach Max Pain at 4310.00 at the close.  However, the NYSE HI-Lo is at -230.00 and sinking fast, suggesting that the short covering may not last.  This is a market to stay short for the duration, possibly 51.6 days from the March 29 high.

ZeroHedge remarks, “US equity markets are extending losses this morning, taking out yesterday’s lows and testing back down toward March lows…

As stocks catch down to the extremely hawkish reality priced into STIRs…

Bond yields are also tumbling and crypto is reversing alongside big-tech with Bitcoin back below $40k…


7:15 am

Good Morning!

All eyes are on China as the Shanghai Composite Index continues plumbing new lows.  The Cycles Model suggests that, while there may be a temporary bounce in the next week, the decline may not be over until the end of May.

ZeroHedge observes, “The slothlike trade moving out of Shanghai has created a short supply of raw materials traveling on the all-important intra-Asia trade route. Countries that make up this trade pipe — Vietnam, Malaysia, Taiwan, Japan, Korea, Indonesia and Cambodia — have factories waiting on crucial raw materials needed to finish goods ranging from apparel and footwear to furniture.

This pipeline saw an expansion in the trade as more American importers diversified their manufacturing out of China as a way to work around the China tariffs.

But what this pandemic has revealed is even with this “manufacturing diversification,”  the dependency on China has never been fully severed. Major raw materials such as jute, cotton, silk, wool and manmade fibers used by the textile and apparel industry are sourced in China. ”


NDX futures plunged to an overnight low of  13433.50 before rising back above the Cycle Bottom support at 13463.88.  NDX is flirting with the bear market at 13400.00, a 20% decline from the top.  Open interest in tomorrow’s options expiration is light with calls favored above 13500 and puts favored beneath 13250.00.  The Cycles Model calls for at least three more weeks of decline, with growing trending strength.

The NDX Hi-Lo closed yesterday at -595.00, the lowest since mid-March.

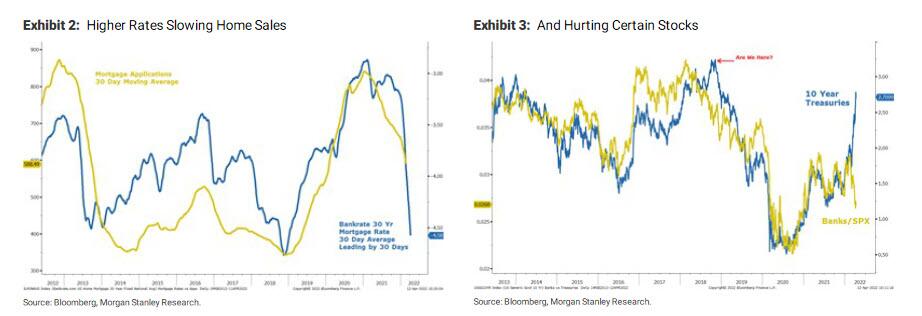
ZeroHedge remarks, “The last time we heard from Morgan Stanley’s chief US equity strategist Mike Wilson one week ago, he was plumbing the depths of bearishness (as much as Morgan Stanley would permit him of course: as we have long noted, Bank of America’s own in house “Michael” strategist –  that would be Hartnett – has been far more bearish), and he concluded that soaring inflation is no longer a positive catalyst for either earnings growth or stocks, to wit: the “positive effects of inflation on earnings growth have reached their peak and are now more likely to be a headwind to growth, (particularly as inflation forces the Fed to remain uber hawkish) and in that context, the growing rise in back end rates is having a meaningful impact on interest rate sensitive areas of the economy and market, like housing and impacting stocks.”


SPX futures declined to 4272.80 in the overnight markets, keeping above Cycle Bottom support at 4227.41.  Yesterday, SPX attained the 17.2-day mark which I calculate to be one-third the 51.6-day decline that the Cycles Model proposes.  A decline beneath the Cycle Bottom and the trendline at 4115.00 to 4120.00 activates the Cup with Handle formation with devastating results while liquidity tightens.

The NYSE Hi-Lo Index closed at -427.00 yesterday, a new low since the March 15 low.  Tomorrow’s expiring options turn positive above 4320.00 and negative beneath 4305.00 with Max Pain at 4310.00.  While yesterday’s cash market closed near 4300.00 as suggested, should SPX remain above the Cycle Bottom support at 4227.41, there may be another attempt to reach Max Pain at the end of the day.

ZeroHedge reports, “One day after stocks staged a remarkable rebound and closing well in the green after sliding as much as 1.5% (ostensibly after getting a boost from the latest bout of bearishness from Dennis Gartman), index futures are trading lower again despite another attempt by China’s central bank to reassure investors overnight that China’s sliding risk assets will rebound, with investors once again preoccupied by risks from aggressive monetary tightening. S&P500 futures contracts were 0.4% not too far off the worst levels ahead of a busy session of earnings releases including Google, Microsoft and Google; Nasdaq 100 futures declined 0.3%. Treasuries were steady and the dollar gained.”


VIX futures rose modestly to 27.74 in the overnight session.  The 50-day Moving Average lies near the 50% retracement value.  We should expect that level to be tested before moving higher.

ZeroHedge (TME) remarks, “They did it again?

Let’s see if the crowd managed doing “it” again: loading up on puts just when the market decides to bounce. People continue to buy protection when they must, not when they can. Think of “strategic hedging” like house insurance, you buy it before the house has started burning…otherwise the premium is very expensive. Chart shows the put call ratio vs SPX.

Source: Tradingview

VVIX remains “unimpressed” by the latest VIX surge

The gap between these two is at rather wide levels.


TNX continues its decline toward the Cycle Top support at 25.85.  The final low may be the 50-day Moving Average, currently at 22.89.  The reason for this is that the next Master Cycle (low) is anticipated for the end of May.  UST is beginning a rally due to investors’ knee-jerk reaction of buying bonds while stocks decline.  While there may be some merit in that move, it may not last.

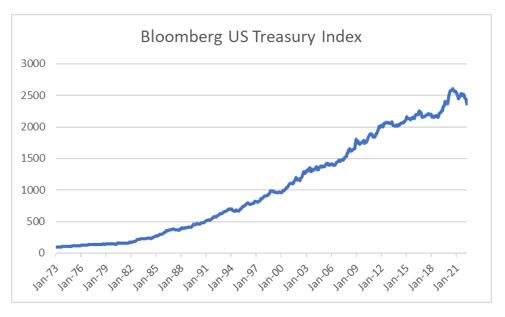
ZeroHedge observes, “If I look at markets through the lens of financial history from 1970 onwards, I should be telling you to buy bonds. As Raoul Pal would say, “Buy bonds, wear diamonds” . Why? Well basically, buying treasuries has rarely lost you money. 2022 definitely stands out at a weak year for US treasury investing, but only after very strong returns during the Covid crisis.

Bonds have been a fantastic asset over the years. Good returns, with limited drawdowns. The financial market view, and one seemingly endorsed by central banks, is that central bank independence and vigilance was the cause of falling inflation and bond yields. The corollary of this view, was less central bank independence and less vigilance would eventually cause inflation, and rising bond yields. So if you were going to be bearish on bonds, then Japanese bonds were the bonds most fund managers chose to short. This was of course very wrong, and most of these funds and fund managers have left the industry, which is why short JGBs trade earned the moniker “widowmaker”.


USD futures have reached 102.00 in a classic throw-over on day 270 of the Master Cycle.  The Cycles Model shows trending strength possibly ending early next week, if not sooner.


Posted in Published | 1 Comment

April 25, 2022

11:20 am

Crude oil futures took a beating today, down over 6% this morning.  Last week I had warned that WTIC is due to collapse in an Intermediate Wave (C) of Primary Wave [2].  The Cycles Model suggests the decline may continue through the month of June.  The preliminary target may be 70.00 but, should it go lower, ultimately the current Master Cycle may end closer to 50.00.  That’s a lot of demand destruction.
 

10:55 am

The BKX has declined beneath the Lip of the Cup with Handle formation in a complex but bearish decline.  Tis is our liquidity proxy and it is signaling a potential crash.  Within the Cup with Handle is a Head & Shoulders formation with a minimum target of 89.00.  Take your pick.  The new Master Cycle may have a duration until the end of June where Intermediate Wave (3) may be completed.
 

10:38 am

SPX has bounced at its 2-hour Cycle bottom, but the decline is not yet over.  The bounce may go to as high at 4300.00 before rolling back over to complete the first impulse (Wave 1) at or near the Lip of the Cup with handle at 4114.65.  SPX is deep within short options territory beneath 4300.00 and short gamma lies beneath 4250.00.  Should SPX decline beneath 4200.00, the Cup with Handle formation may be activated at 4115.00.  Most analysts are too cautious about what is coming next.  See below.

ZeroHedge (TME) cautions, “Remember range?

Before you get too bearish it is worth remembering the following. Firstly, we are getting close to the bottom of some prominent market participants have considered to be the new range. Secondly, some fast money positioning indicators are at extreme levels, same as it was when we bounced in March. Thirdly, some sentiment indicators are at even more extreme levels than when we bounced in March.

Chart showing the SPX range that has basically dictated the entire year. Buy 4200 (or slightly below), sell/short 4550/4600. Time for the mean reversion mind again as we approach the lower part of the range?

Source: Refinitiv

Sentiment screams BUY even louder than at the March low

The Goldman Sentiment Indicator measures stock positioning across retail, institutional, and foreign investors versus the past 12 months. Out of 687 weekly readings (first recording: 2/27/09), there have only been 14 instances in which the sentiment indicator was more negative.”


7:55 am

Good Morning!

NDX futures declined to 13185.40 over the weekend and remains well beneath Friday’s close.  The next level of support may be the Lip of the Cup with Handle formation near 13060.00.  Should that level be breached, the next target is that of the Cup with Handle formation.  The Cycles Model suggests the next Master Cycle low may be on or near May 20.

In today’s options expiration, Max Pain is at 13600.00.  Short gamma begins near 13520.00 and intensifies at 50-point intervals beneath 13500.00.  This doesn’t look good at all.

ZedroHedge notes, “Hedge Fund mega cap tech exposure at 4-year low

Mega Cap Tech has had a sharp reversal lower MTD and has seen renewed selling as we head into the heart of Tech earnings next week. Most of the selling has come from longs and HF net exposure is at the lowest level in over 4 years.

Source: JPM PI

But Retail Army just keeps on buying Tech

Buy-the-dip in tech….Chart shows cumulative Tech flows


SPX futures reached a weekend low of 4220.40 followed by a shallow bounce thus far.  In today’s options expiration, Max Pain is at 4330.00 while options turn negative at 4300.00.  Short gamma starts at 4275.00.  Dealer pain takes a turn for the worse at 4200.00.  Just a reminder, should the Lip of the Cup with Handle become breached, the Cup with Handle target becomes activated.  The Cycles Model suggests the next Master Cycle (low) ends on or near May 20.

ZeroHedge remarks, “This may be one of many revaluations of capital vis-a-vis labor and resources and core vis-a-vis periphery.

You’ve heard the expression “cash is king.” Very true. But it’s equally true that “crash is king:” when speculative excesses collapse under their own extremes, the crash crushes all other narratives and becomes the dominant dynamic.

Everything that the mainstream uses to predict “value,” market action and “the future” is tossed out the window. Price-earnings, “growth,” “innovation,” cash flow, yields, the bat-guano-quatloo carry trade, etc., etc., etc.– none of it stops the crash or makes sense of the crash, which happens for systemic reasons beyond conventional explanations.

In the context of conventional concepts of “value” and central bank power, crashes are impossible. According to conventional explanations, the central banks control the markets and so crashes are brief and shallow because the banks will quickly change course and flood the financial markets with free money.

In the conventional view, markets are rational and liquid: there will always be a a buyer for every seller (i.e. liquidity) because there will always be a rational reason and cash/credit available to buy an asset at the current price.

Crashes reveal this as false: there is no buyer for every seller in crashes because it’s not rational to buy assets which have been grossly overvalued and are resetting at new valuations in a chaotic freefall. Indeed, the entire concept of “value” is in doubt, and as we all know, markets hate uncertainty.”


VIX futures hit a weekend high of 30.05 as investors seek to hedge risk.  The Buy signal is confirmed above the 50-day Moving Average at 25.71.

ZeroHedge remarks, “Put chasers are back…

…and they look “serious”. Let’s see if this time will be different, but the spike in put call ratio is big, and people tend to love puts when they should hate them and vice versa.

Source: Tradingview

VIXplosion is back

VIX moved sharply higher on Friday. The entire term structure curve moved to the upside and the short end of the curve exploded to the upside. This is pure panic as investors decided loading up on short term protection at “any” price. Charts shows the volatility structure today vs how it looked on Wednesday.”

Source: vixcentral


TNX continues ist correction with a likelihood of testing the Cycle Top support at 25.66.  The decline may last through the end of May, so it may have time to tag a lower support.


USD futures are surging higher on day 269 of the Master Cycle.  The Cycles Model suggests another day of strength before a potential reversal.


Posted in Published | 3 Comments