June 29, 2022

3:23 pm

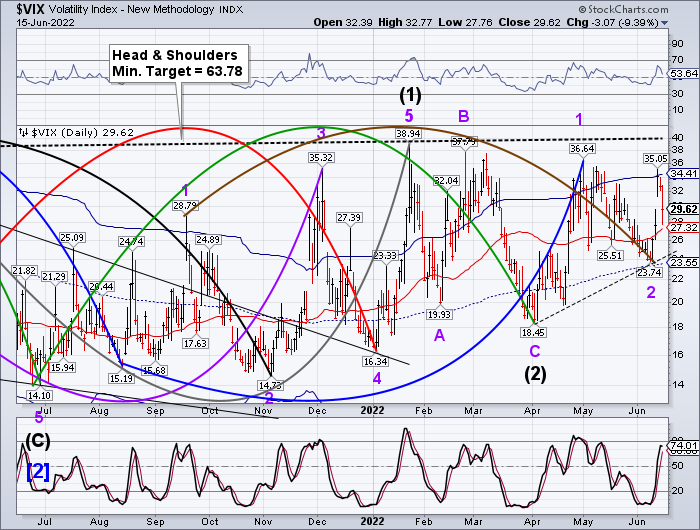
VIX has been straddling the 50-day Moving Average and buy signal at 28.85 today.  The Triangle formation has been in a big stall since late January.  That is precisely what a Triangle is meant to do…buy time.  However, it simply delays the outcome and keeps the investor public unaware of the danger lurking at the breakout.

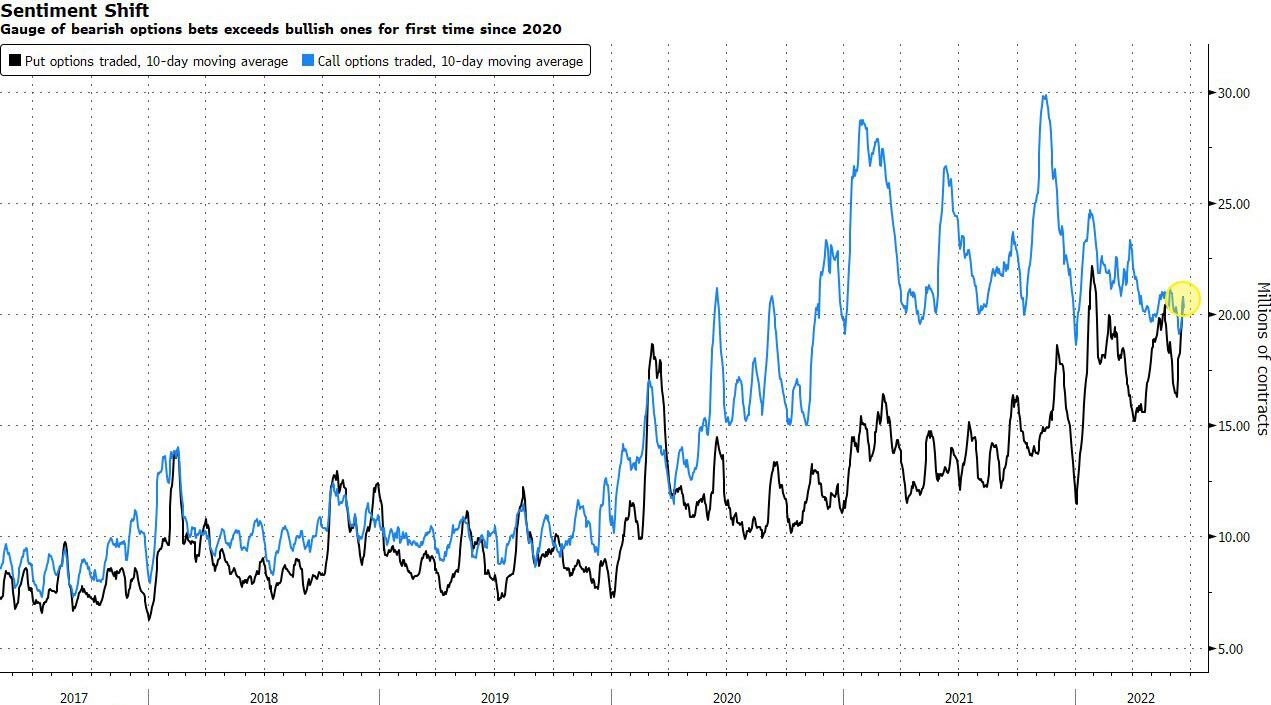
ZeroHedge remarks, “One of the most frequent questions tossed around Wall Street trading desks (and strip clubs), and which was duly covered by Bloomberg recently in “Fear Has Gone Missing in Wall Street’s Slow-Motion Bear Market“, is why despite the crushing bear market and the coming recession, does the VIX refuse to rise sustainably above 30, or in other words, why is the VIX so low?

As Goldman’s Rocky Fishman wrote in a recent note “Option Markets Take the SPX Bear Market in Stride” (available to professional subs), “one of the most popular questions we have received is why the VIX hasn’t surpassed its March peak (36) despite the SPX being lower than it was in March and realized vol being higher than it was in March.”


3:14 pm

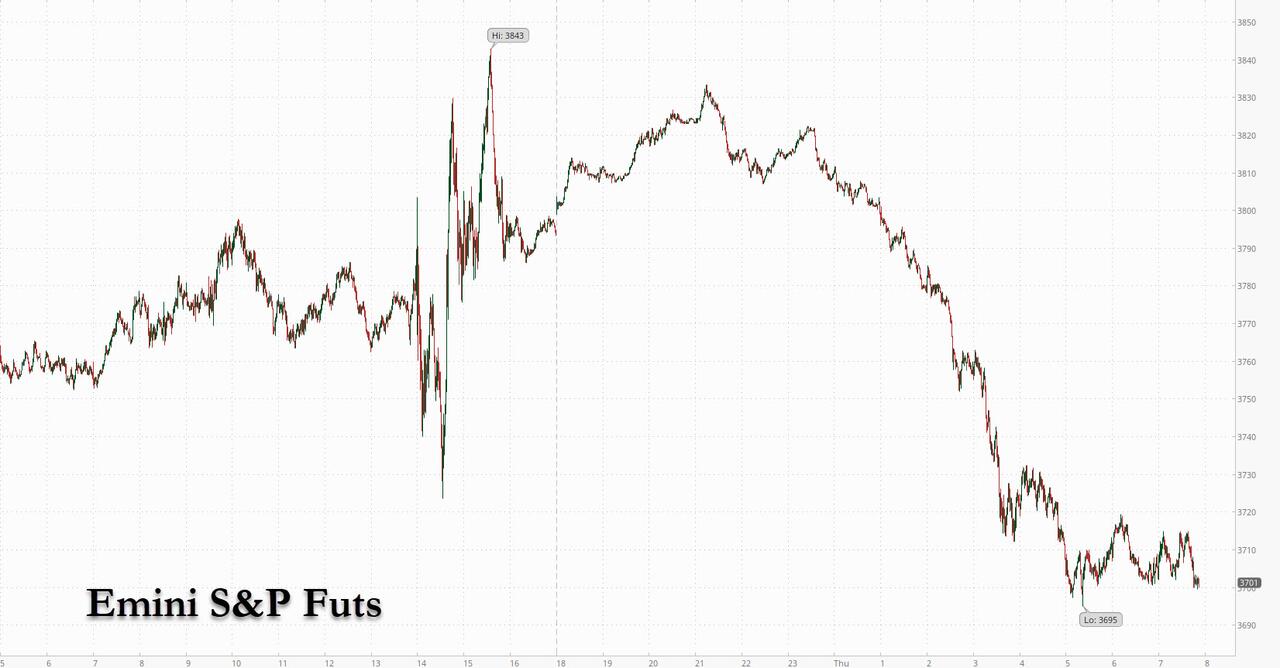
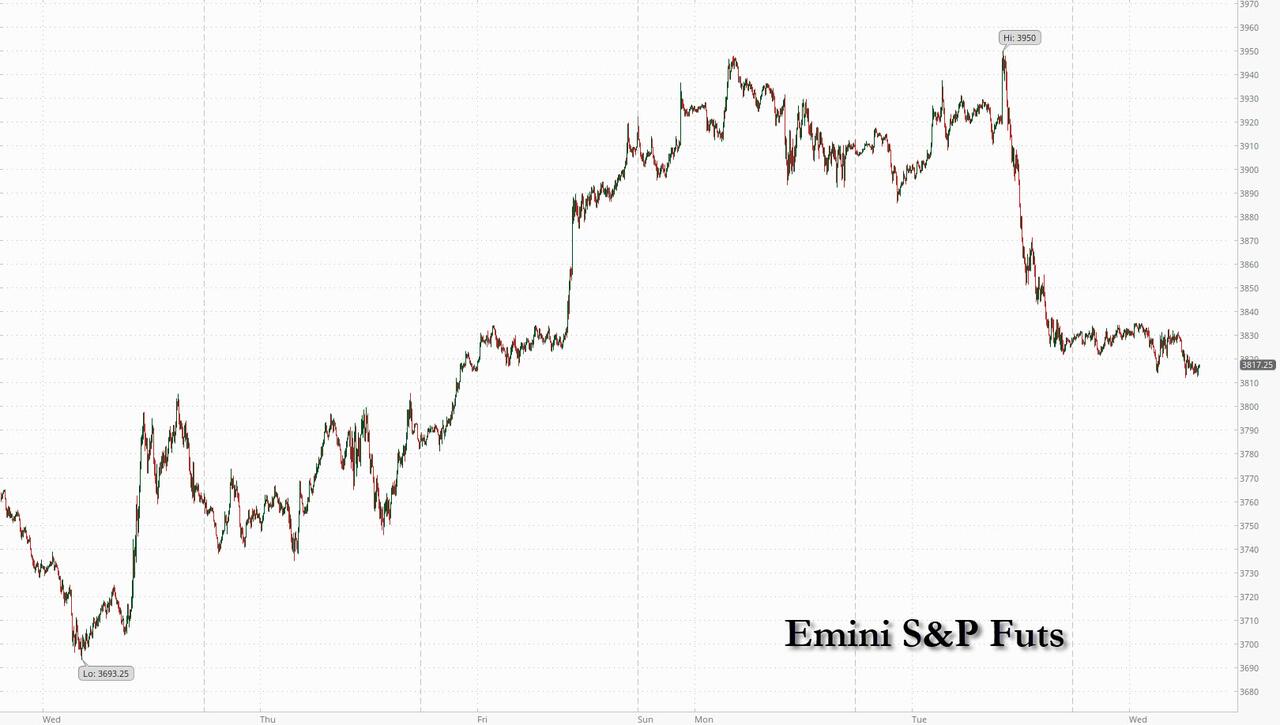
SPX has been avoiding short gamma beneath 3800.00 by bouncing twice at that level.  It may succeed in maintaining that elevation until after the close.  However, a decline beneath that level may be inevitable after the close.  It appears that trending strength may take a dive by the weekend.


7:50 am

Good Morning!

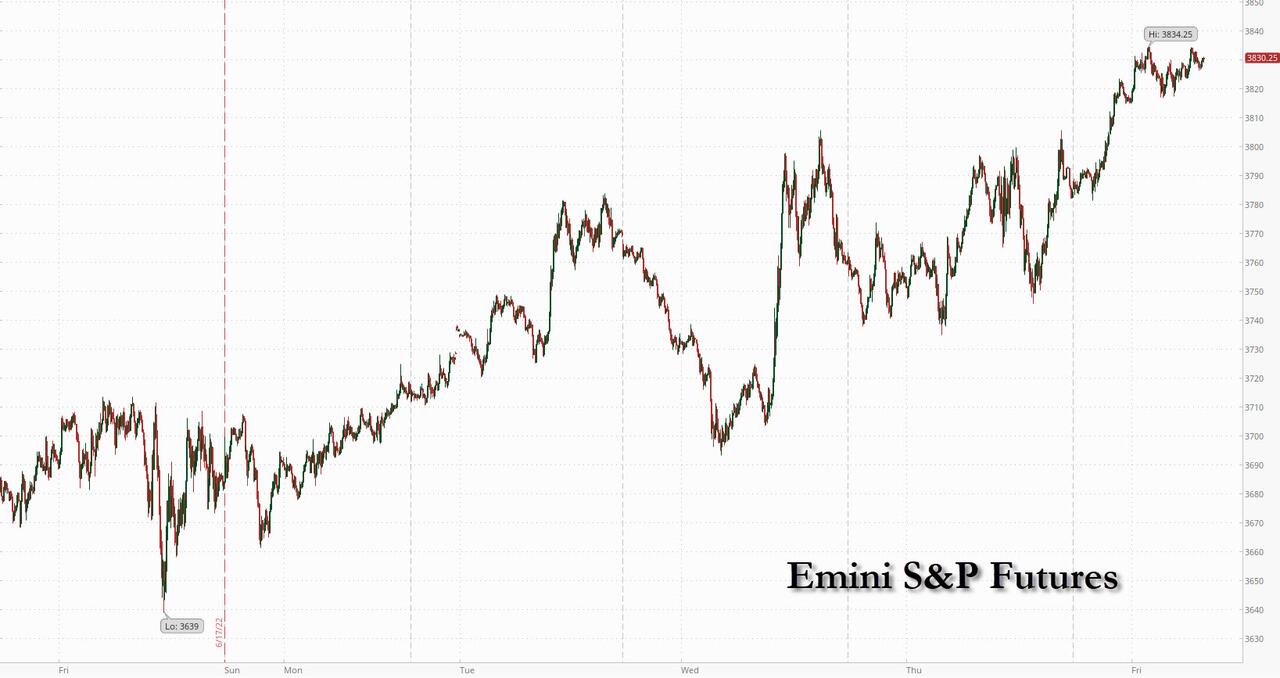
NDX futures declined further in the overnight session to 11583.50 before a bounce bringing it back near the flat line.  Should it bounce at the open, overhead resistance is at 11894.62, near the 50% retracement value.  Lower support is at 11429.51, its Cycle Bottom.  There are two possible scenarios for this decline.  It may be an extension of the old Master Cycle currently shown on June 17.  Today is day 268, which is a bit stretched, but hot unusual.  Or it may be the beginning of at new Master Cycle decline.  I am beginning to think the second option is the more viable.

In today’s op-ex, options are positive above 11650.00 and negative beneath 11500.00.  Both puts and calls are so light that it is difficult to tell where long or short gamma begin.  The QQQ (closing price: 283.54) options expiration are much more bearish, with Max Pain near 294.00.  Short gamma lies at 290.00 – 293.00.  This is a sticky wicket for the dealers and hedge funds.


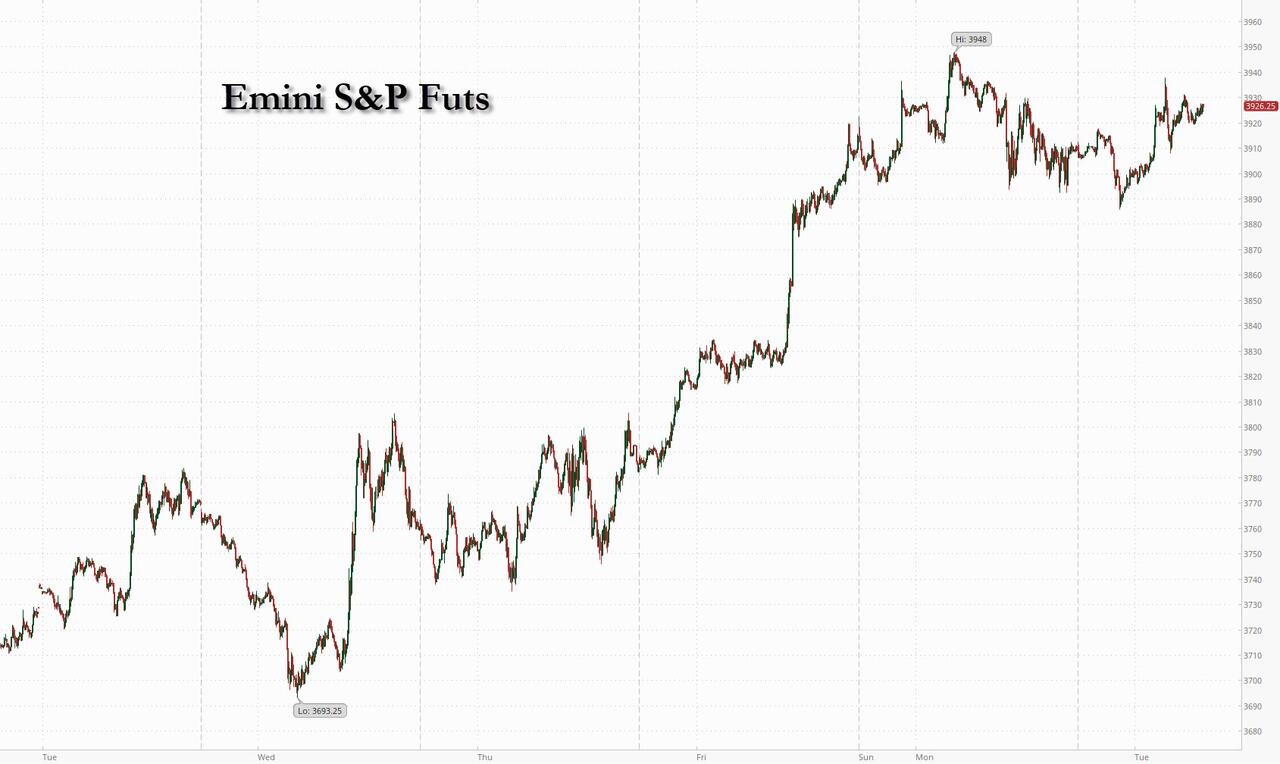
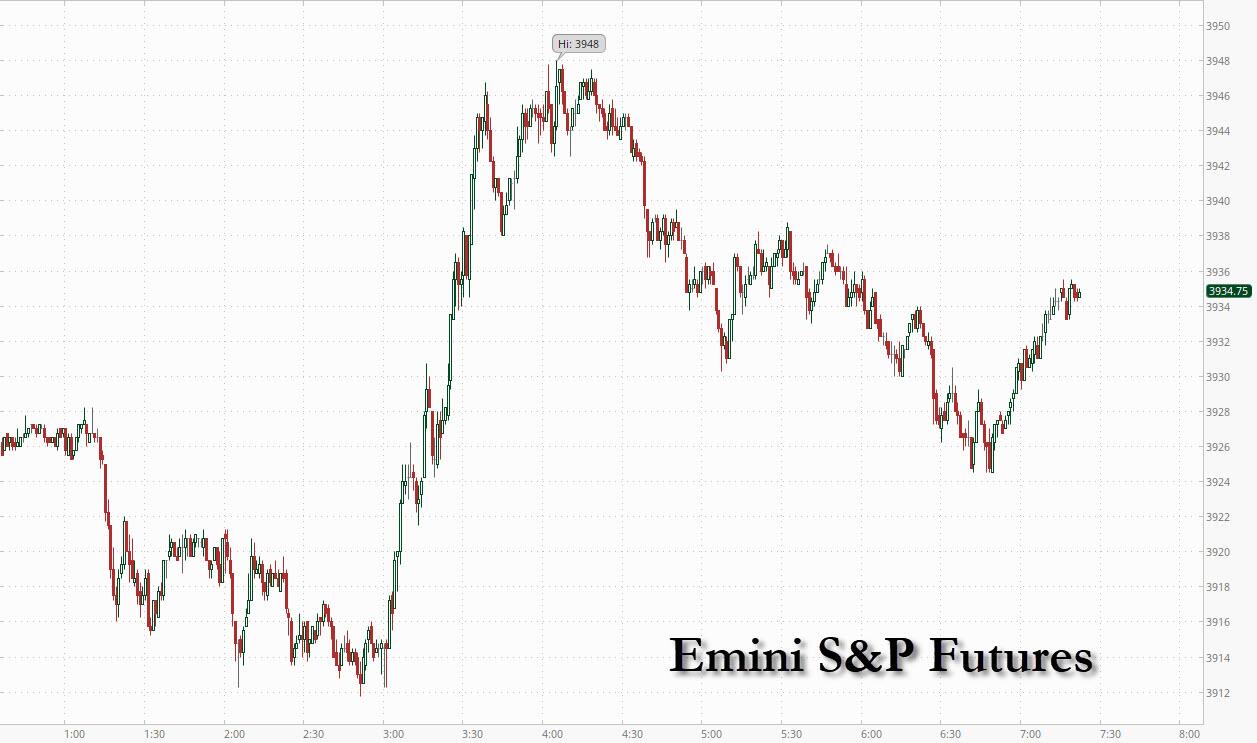
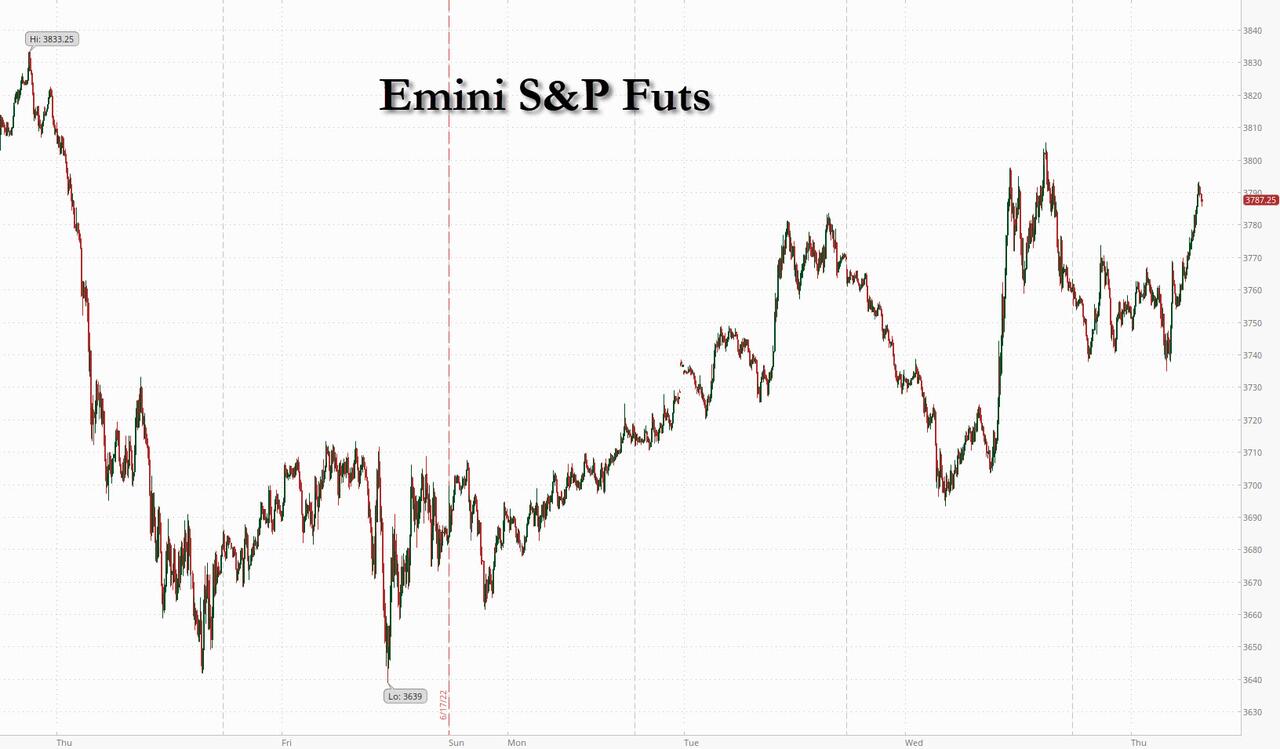
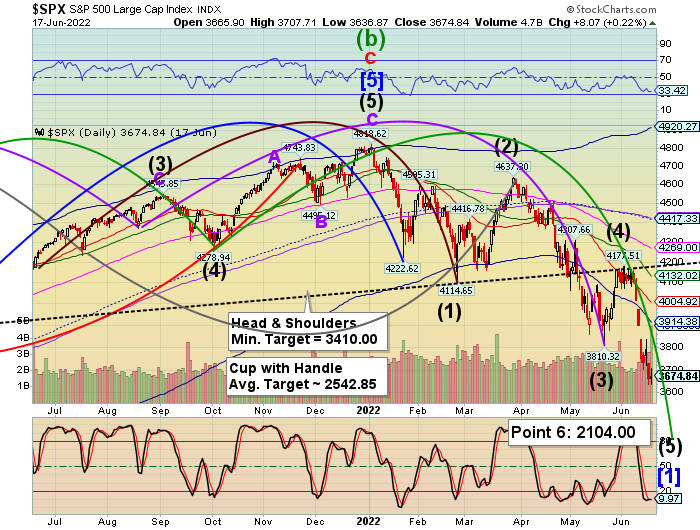
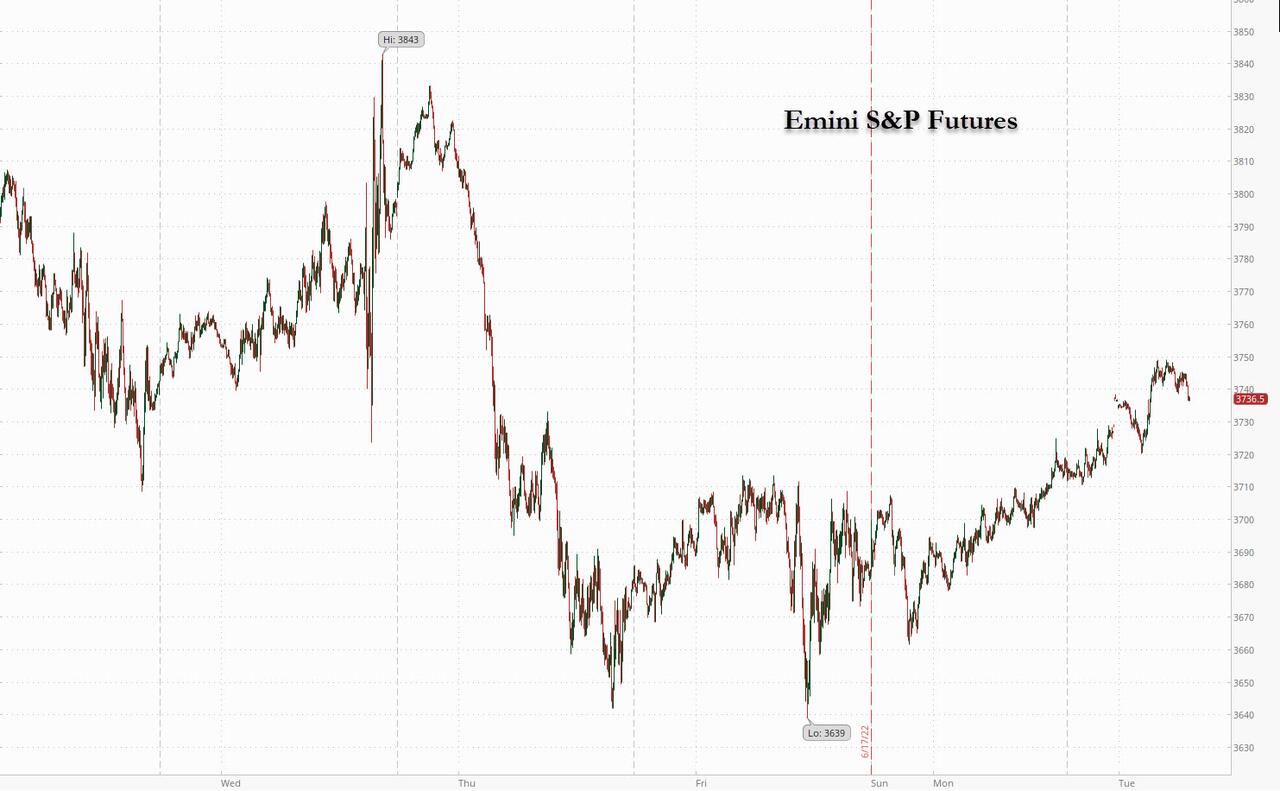
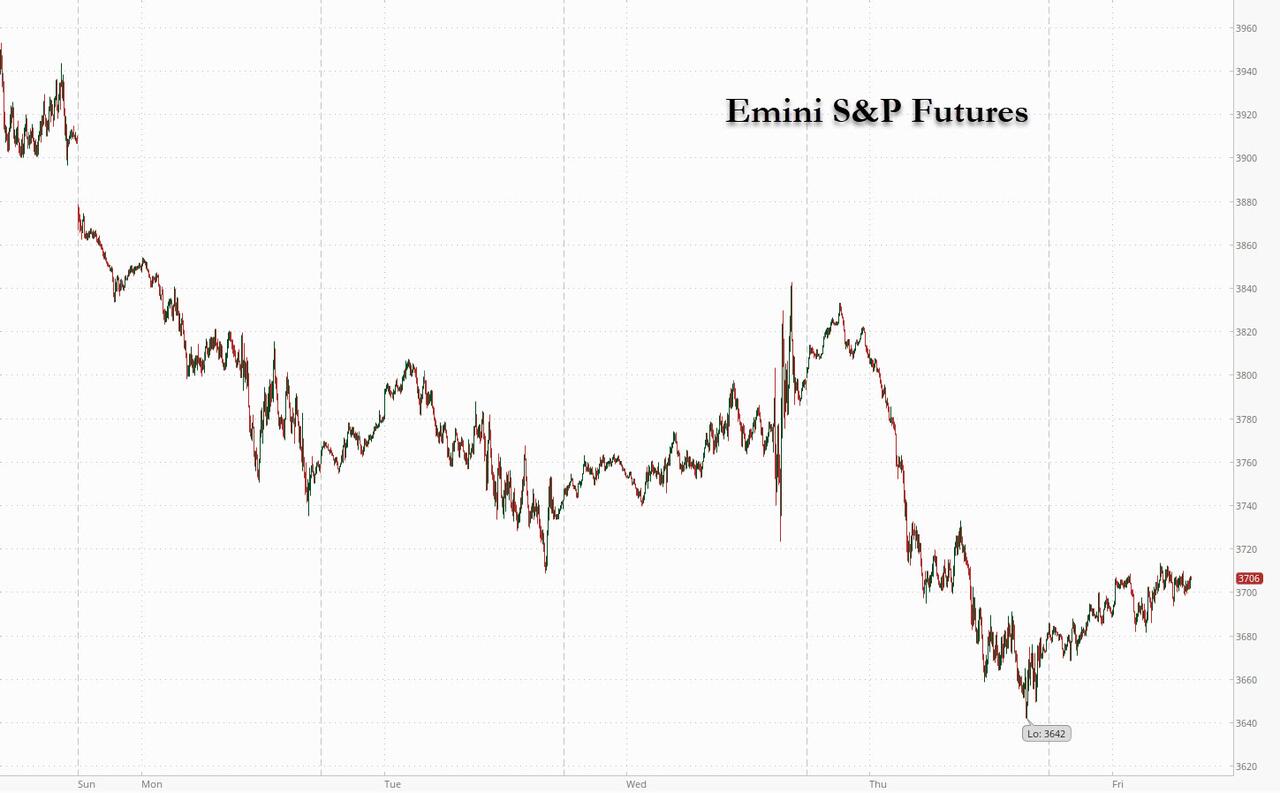
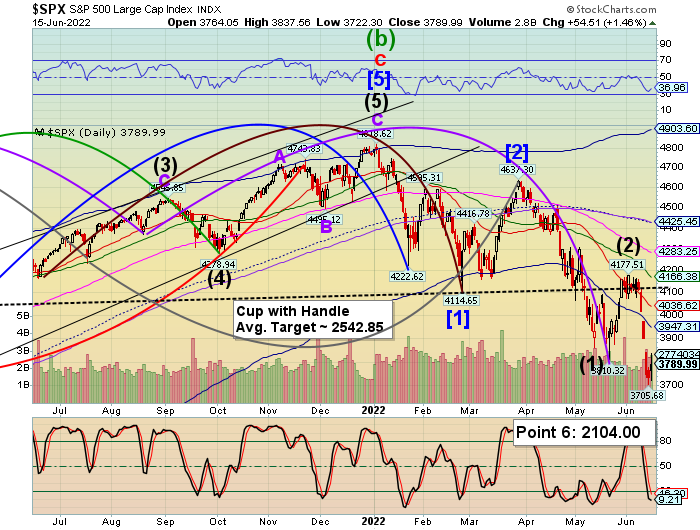
SPX futures tested support at 3810.00 and bounced.  The daily Cycle Bottom lies at 3853.39 and Short-term resistance lies at 3876.39, very near the 50% retracement level.  In Today’s op-ex, calls dominate above 3850.00 an Max Pain is at 3840.00.  Short gamma may begin at 3800.00 in a lightly populated options market. I am modeling the Waves to show the SPX entering Wave 3 of (3) of [3] of I in this decline, very bearish combination.

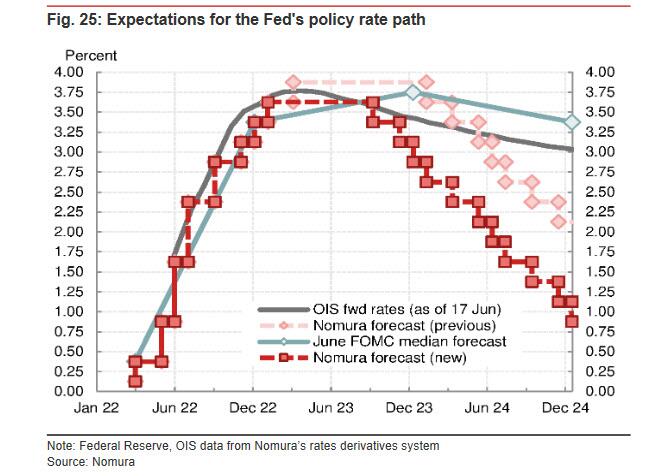
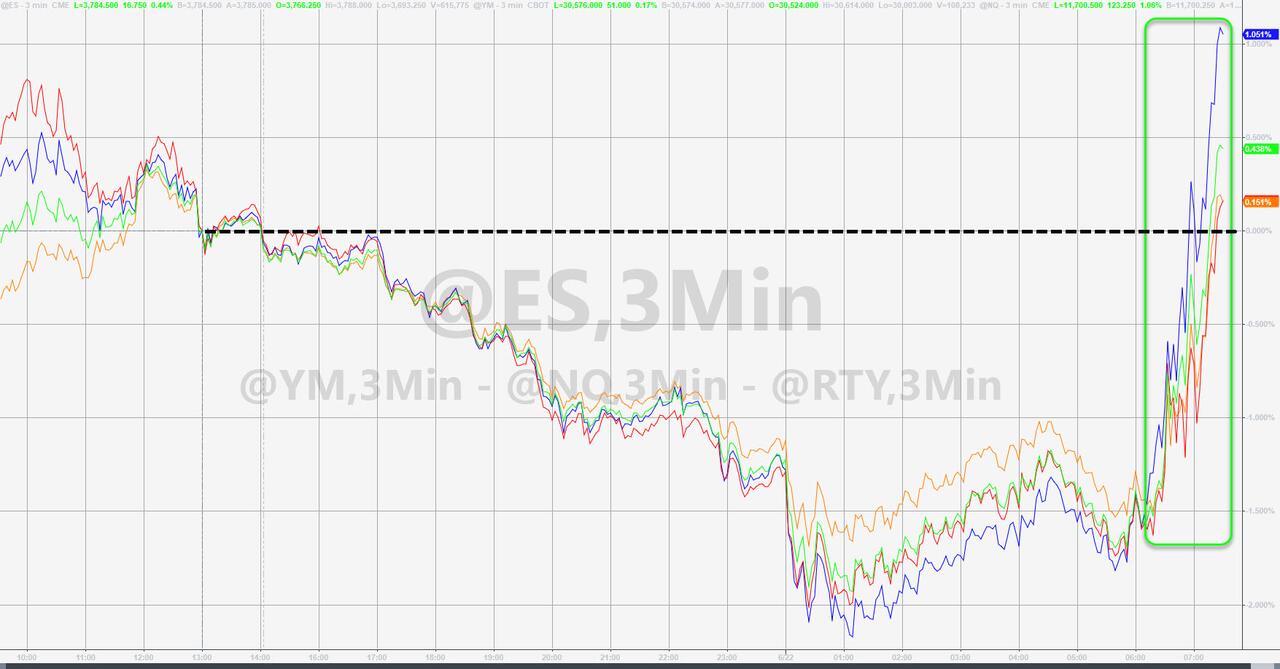
ZeroHedge reports, “One day after futures ramped overnight (if only to crater during the regular session) on hopes China was easing its highly politicized  Zero Covid policy after it cut the time of quarantine lockdowns, this morning futures slumped early on after China’s President Xi Jinping made clear that Covid Zero isn’t going anywhere and remains the most “economic and effective” policy for China during a symbolic visit to the virus ground zero in Wuhan, in which he cast the strategy as proof of the superiority of the country’s political system. That coupled with renewed recession worries (market is again pricing in a rate cut in Q1 2023) even as monetary policy tightens in much of the world to fight supply-side inflation, sent US futures and global markets lower. S&P futures dropped 0.2% and Nasdaq 100 futures were down 0.4% after the underlying index slumped on 3.1% on Tuesday. The dollar was steady after rising the most in over a week while WTI crude climbed above $112 a barrel, set for a fourth session of gains. In cryptocurrencies, Bitcoin dipped below the closely watched $20,000 level on news crypto hedge fund 3 Arrows Capital was ordered to liquidate.

The Nasdaq’s Tuesday’s slump added to what was already one of the worst years in terms of big daily selloffs in US stocks. The S&P 500 Index has fallen 2% or more on 14 occasions, putting 2022 in the top 10 list, according to Bloomberg data.”


VIX futures have clambered back above the 50-day Moving Average at 28.44, making a new high at 28.96 thus far.  To the causal observer, the VIX has a “mild fever’ but nothing to worry about.  However, the coiling action of the Triangle formation denotes a building energy that may soon explode higher.  If my Wave identification is correct, the rally higher may have just begun.  The Wave E of a Triangle is often a rogue Wave, leaving the formation appearing either unfinished or overdone.  The only way we know for sure is when Wave 1 breaks above the prior high.


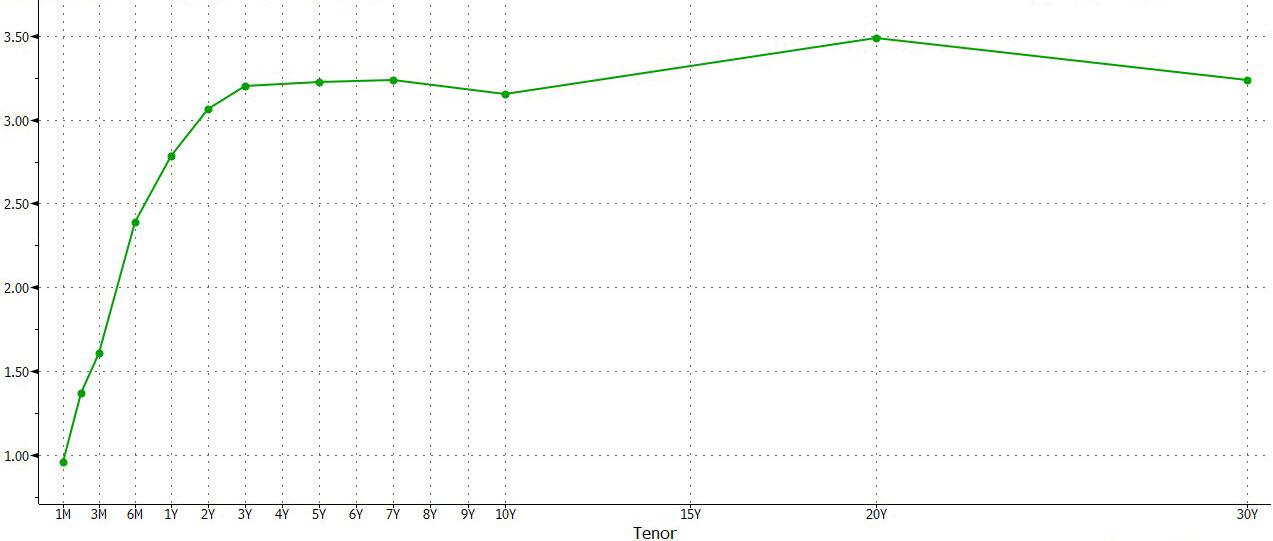
TNX may have begun its final decline to mid-Cycle support.  It may have a little more than a week to accomplish this task.  The sell-of in yields may indicate a migration from equities.

Yesterday ZeroHedge reported, “After one ugly 2Y auction and one catastrophic 5Y sale on Monday, today the week’s truncated auction schedule saw the last coupon issuance for the week when the Treasury sold $40BN in 7Y paper. And while the auction was not as bad as the infamous Feb 21 “failed” 7Y auction but it sure was ugly.

The high yield of 3.280% was just over 50bps higher compared to the 2.777% in the May auction. and was the highest since Feb 2010 when the auction printed at 3.37%. More importantly, the auction also tailed the When Issued 3.259% by 2.1bps, the biggest tail of 2022 (Dec 2021 was 2.3bps).

The bid to cover dropped from 2.690 to 2.481, the lowest since April, but was above the six-auction average of 2.41.”


Posted in Published | Comments Off on June 29, 2022

June 28, 2022

2:36 pm

The equities decline continues.  The next probable support lies at 3800.00, shown in the chart.  Analysts are like deer in the headlights.  Nomura is waiting for the next shoe to drop.  Goldman finally admits “large cuts to earnings” are imminent.  Expectations are being lowered, but no one knows where this will go.  No one can fathom the size of this decline.


11:23 am

SPX has reversed at the 2-hour mid-Cycle resistance at 3949.22 and has slipped beneath Short-term support at 3885.57, giving an aggressive sell signal.  SPX may bounce, giving a better entry point for those who have taken short profits in the last week.  The decline that follows may last up to 53 calendar days (37 market days).  Wave threes typically are where the Head & Shoulders and Cup with Handle targets are completed.


10:47 am

NDX may have completed a 61.2% retracement of its June decline and reversed beneath Intermediate-=term support at 12054.29.  This has created an aggressive sell signal in NDX.  This has been a very short Cycle, only 16 days (10 down, 6 up).  It may be indicative of a Phase Shift, where the decline goes into high gear.  There are 53 calendar days left to the next Cycle Bottom, giving equities another potential 37-market day decline.

I have left the Head & Shoulders and Cup with Handle formations intact, since their targets most often come with the completion of Waves 3 and (3).


9:20 am

Good Morning!

SPX futures are higher, but did not exceed the Monday morning (futures) high.  SPX is clearly at a crossroads, with immense pressure in both directions.  The Cycles Model suggests a resolution by the end of the week.  Remember that the 50%  retracement level of the June decline is at 3905.00, which seems to exert a lot of resistance.  The next Fibonacci level is 3968.70, the 61.8% retracement

In today’s expiring options, calls dominate above 3950.00, while short gamma may begin at 3900.00.  This is a dangerous place to slip, even though options are light.  A rally is needed to keep short gamma from influencing the market, since a decline may catch many off guard.

ZeroHedge reports, “US stock futures rebounded from Monday’s modest losses and traded near session highs after China reduced quarantine times for inbound travelers by half – to seven days of centralized quarantine and three days of health monitoring at home –  the biggest shift yet in a Covid-19 policy that has left the world’s second-largest economy isolated as it continues to try and eliminate the virus. The move, which fueled optimism about stronger economic growth and boosted appetite for both commodities and risk assets, sent S&P 500 futures and Nasdaq 100 contracts higher by 0.6% each at 7:15 a.m. in New York, setting up heavyweight technology stocks for a rebound. Mining and energy shares led gains in Europe’s Stoxx 600 and an Asian equity index erased losses to climb for a fourth session. 10Y TSY yields extended their move higher rising to 3.25% or about +5bps on the session, while the dollar and bitcoin were flat, and oil and commodity-linked currencies strengthened.”


VIX futures made a new low at 26.47 thus far this morning.  It may be headed toward the trendline near 25.00.  However, today is 52 days from the next Master Cycle high, suggesting that the VIX may be near a reversal.


Posted in Published | Comments Off on June 28, 2022

June 27, 2022

8:15 am

NDX futures have completed a 61.8% Fibonacci retracement from the June 17 low.  It is at a crossroads.  Is this a Wave 2 retracement, leading to a fast and furious Wave 3 and complete the 18.5-day Cycle mentioned last week at a new low?  Or do equities go higher, through the end of the month, possibly re-testing the neckline at 13000.00?

Today’s options expiration cannot tell us anything, since it is so thinly populated.  QQQ (294.61 at the close) expiring options turn short at 285.00 and short gamma may  begin at 275.00.  Long gamma starts at 295.00.    In other words, it must hold Friday’s closing price or better.


SPX futures hit a morning high of 3943.60, short of the mid-Cycle resistance at 3954.38.  It has since lost its upward momentum and may open beneath the 50% retracement level at 3905.00. While I had anticipated at downturn on Friday, there is still time for a very fast 4.3-day decline beneath the Head & Shoulders target.  In addition, the Head & Shoulders formation is usually fulfilled at the completion of Wave (3).

Today’s expiring options show Max Pain at 3870.00 with Calls prevailing above 3875.00.  Puts dominate beneath 3850.00 and short gamma begins at 3800.00.

ZeroHedge reports, “Following the best week for stocks in one month, global stocks extended gains on Monday on continued easing of fears for a hawkish Fed; US futures rose, with the Nasdaq 100 advancing 0.5% as by tech giants Amazon, Apple and Microsoft all rose in premarket trading. Tech shares also boosted indexes in Europe and Asia. Treasuries slipped, pushing the rate on the US 10-year note to 3.17%. Yields have retreated from June highs on growth worries, but whether that marks the end of the Treasury bear market is a live debate. The dollar fluctuated while oil and bitcoin rose.”


VIX futures rallied to 28.43, above the 50-day Moving Average at 28.22 and has made a potential buy signal.  In Wednesday’s expiring options, Max Pain is at 29.00 and long gamma starts at 35.00.


TNX rallied this morning beneath Cycle Top resistance at 93.31.  The bounce, while appearing strong, may not last as TNX may be in decline to its mid-Cycle support in the next two weeks.

ZeroHedge explains, “If you’re a ZeroHedge reader, you’ve seen this chart:

Fed hiking cycles end in crisis – every time. The chart also illustrates that, since the 1980s, the Fed has been unable to achieve a Fed Funds Rate (FFR) at or above the peak of the preceding tightening cycle. 

It’s not a mystery why this happens: lower-for-longer rates allow for greater debt accumulation and create an ever-increasing dependency on cheap rollover costs.”


Posted in Published | 2 Comments

June 24, 2022

7:50 am

Good Morning!

I am giving a shortened report this morning due to an outside commitment that may take the rest of the morning.

SPX futures made a morning high of 3831.70, short of the June 15 high of 3837.56.  A higher  probe may change the outlook, but the Cycles Model suggests the turn may come in the first hour of the day.  We may know very soon.  Please recall that today’s op-ex turns short beneath 3750.00 and short gamma may begin beneath 3700.00.  This is a close call, but I’m sticking with it.

ZeroHedge reports, “Futures are pointing to solid close to the week – now that a recession and earlier rate cuts are assured…

…. with a continuation of the rally which has pushed stocks to two week highs, with Tech continuing to lead while Chinese Tech is helping to fuel the global risk-on rally to end the week. Tech-heavy Nasdaq 100 futures added 1% while contracts on the S&P 500 gained 0.9%, trading near session highs  at 3,833 after the main US stock gauge closed near session highs Thursday, adding more than 3% in three days. In Europe, the Stoxx Europe 600 rose 1.5%, with the benchmark set for a small bounce this week. 10-year Treasury yields rose to 3.13% after earlier sliding as low as 3.04%.


VIX futures made a marginal new low at 28.58, challenging the 50-day Moving Average at 28.70.  It may briefly go lower, as a “flat” correction lies at 27.76.  VIX  may have up to 3 more days to complete its rally to the Head & Shoulders neckline before pulling back.


TNX futures bounced off Intermediate-term support at 30.12 to a morning high of 31.30.  However, it is due for a Master Cycle low in the second week of June, where it may hit mid-Cycle support currently at 20.99.


Posted in Published | Comments Off on June 24, 2022

June 23, 2022

5:00 pm

BKX has been making new lows and The Cycles Model suggests that, after a brief show of strength this Friday (weekend?) it may resume its decline through mid-July before a bounce.  Is another Lehmann awaiting?  The news (below) prompted me to highlight this important liquidity proxy.  A June 30 low beneath 3400.00 in SPX may give the banks a fever.

ZeroHedge notes, “It’s that time of year again when the banks face their annual health checks which dictate the required size of each bank’s “capital buffer” – the extra cushion of capital that’s set aside on top of the regulatory minimum needed to support daily business.

The tests also determine how much lenders can return to shareholders in the form of share buybacks and dividends, but banks have to wait until June 26 to reveal their actual dividend and buyback plans as well as confirm the size of their stress capital buffers.

In this year’s test, the Fed is looking at how banks would fare if unemployment rose to 10%, accompanied by a 40% drop in commercial real estate prices, widening corporate bond spreads, and increased market volatility, among other hypothetical scenarios.

All of the banks were still expected to pass, but could be told to set aside slightly more capital than last year.”


2:31 pm

(corrected statement below)

SPX isn’t tracking as I had anticipated.  Based on the speed of the bounce, I had calculated that SPX would go into the end of June at a high.  Instead it lingered near the top of the bounce but not making a new high, leaving 6.15 days until the end of the 18.5-day Cycle (on Thursday).  The Head & Shoulders target re-emerges as a viable target.  Think about it.  June may end with a 30% loss from the beginning of the year.


9:46 am

The Ag Index has stretched its Master Cycle decline to day 286, possibly due to some demand destruction (farmers buying less fertilizer) and market liquidity.  This will only exacerbate the problem of higher prices not so far down the road.  Today is the last day of trending weakness.  The Cycles Model calls for a 2-month rally in prices that may set new all-time records.

ZeroHedge observes, “We are being warned well ahead of time that it is coming.  Joe Biden has publicly admitted that the coming food shortages are “going to be real”, and the head of the UN World Food Program is now telling us that we could soon see “hell on Earth” because the lack of food will be so severe.  Food prices are already escalating dramatically all over the globe, and food riots have already erupted in Sri Lanka and elsewhere.  But most people in the western world are treating this crisis as if it is no big deal.  Many seem to assume that our leaders have everything under control and that things will work out just fine somehow.

Unfortunately, the truth is that everything is not going to be okay.

So far this year, the number of hungry people around the globe has risen to more than 800 million…”

ZeroHedge offers another example of demand destruction,  “Food riot risks continue to soar worldwide as the head of the food-aid branch of the United Nations halved meal rations for refugees. 

On Monday, David Beasley, director of the UN World Food Programme (WFP), released a statement detailing “the heartbreaking decision to cut food rations for refugees who rely on us for their survival.”

“As global hunger soars way beyond the resources available to feed all the families who desperately need WFP’s help, we are being forced to make the heartbreaking decision to cut food rations for refugees who rely on us for their survival,” Beasley said. 


8:05 am

Good Morning!

NDX futures are challenging Cycle Bottom resistance at 11600.52 this morning.  This may lead to a brief reversal, but not necessarily a new low.  However, should it make a new low on day 262, it may vie for the Master Cycle low currently at 11037.21 last Friday on day 256.  Today is not an op-ex day for NDX, so a decline is possible, but may bounce back by Fridays options closing.

ZeroHedge observes, “The bears are taking over the equity options market.

As Bloomberg markets live reporter and commentator, Cormac Mullen, details, the 10-day moving average of put options traded in the US stock market – a gauge of speculative downside protection bets – has pushed above the equivalent for bullish calls for the first time since 2020, according to data compiled by Bloomberg.

The latter was a good measure of speculative individual investor demand for US equities, peaking with the meme-stock waves that bookended last year. That suggests retail traders are shifting to betting against the market, albeit at an intensity well below the peak of meme madness.”


SPX futures reached an overnight high of 3793.40 and have since eased back.  It may decline to the 2-hour Cycle Bottom at 3679.10 or lower before launching in a 4.3-day ramp to June 30.  Thus far June is in horrible shape with a 10% decline (this month) and it must take back the better part of its losses by the end of the month.

In today’s op-ex, Max Pain lies near 3760.00 with calls dominating above 3775.00.  On the other hand, puts dominate beneath 3700.00.  This may be a good day for a pullback today.  Friday’s op-ex is much more populated, with puts dominating beneath 3750.00.

ZeroHedge reports, “In a world where bad news is good news, and where the looming recession means an end to rate hikes and a start to easing, it didn’t take algos long to bid stocks up as treasury yields tumbled after comments by Jerome Powell and dismal PMI data in Europe justified fears that a global downturn is now just a matter of when, not if. After initially sliding more than 1% late on Wednesday, futures rebounded and recovered all losses and were last trading near Wednesday’s session highs, up 0.7% or 27 point to 3,790, while Nasdaq futs were up 0.9% at 11,375 as of 715am ET.


VIX futures are positive this morning with a high of 29.71.  There may be a challenge of the Cycle Top resistance at 34.78 before coming back down to the 50-day Moving Average next week.    Next Wednesday’s op-ex show calls dominate above 32.50 and long gamma sets in at 35.00.  Short gamma starts at 28.00.


TNX continues its decline toward mid-Cycle support currently at 20.99.  The bearish stock investors are being forced (out of habit) to reconsider bonds.  The unfortunate problem is that the decline has two weeks left.   Many investors will not take profits in time and may add to their losses.  Many analysts believe that the next QE is just around the corner, justifying the purchase of bonds.

Yesterday ZeroHedge reported, “Moments ago, the Treasury sold $14 billion Treasuries in a 19-year 11-month reopening of the infamous “kink” tenor in the pancaked US yield curve. “Kink”, because as shown below, the yield on the 20Y remains the highest one across the entire curve..

… and today’s auction only added fuel to the fire.”


USD futures rose to test the Cycle Top resistance at 104.60 this morning. From here it may resume its decline to the lower trendline of the Broadening Wedge and mid-Cycle support at 87.91.  The Cycles Model suggests the decline may be over by mid-August.


Posted in Published | 1 Comment

June 22, 2022

11:40 am

Crude oil futures remain on a sell signal, having made a new low today at 101.58.  The Cycles  Model suggests a continued decline to the last week of July.  There may be a bounce at mid-Cycle support at 92.25.  However, the Broadening Wedge formation shows a potential target near 50.00 later in the fall.

ZeroHedge gives advice best to avoid, “While stocks are dumping (if regaining some ground as Powell fails to surprise, just as we predicted), the biggest change overnight according to JPM’s trading desk is the sell-off within the commodity complex, which the bank’s commodity traders say they would use as an opportunity to buy (despite oil remaining sticky high in comparison to the recent drop in 5Y breakevens).”


10:20 am

Course correction.  It appears that the current Cycle may be a top-to-top Cycle.  Wave [a] of B is completing now.  Wave [b] may go down to the Cycle Bottom at 3686.46 (or lower) where you may exit short positions.  Wave [c] of B may take the SPX to the 50-day Moving Average currently at 3800.00 on or around June 30.  From  there we may see another 37-day decline, where SPX, Hi-Lo and VIX Cycles line up again.  This is like piloting a tanker through the shoals.  The market may not like what Powell has to say.  Use it to your advantage.

ZeroHedge comments, “After an ugly night in the futures markets, US equity markets went into full ramp mode shortly after 0900ET and all the majors are back in the green for the day now…

It’s truly anyone’s guess why but three main triggers are being discussed across trading desks:

1) Federal Reserve Bank of Philadelphia President Patrick Harker said this morning that it’s possible the U.S. economy might see a modest contraction in growth but he expects the job market to remain strong.


8:20 am

Good Morning!

NDX stalled beneath the Cycle Bottom resistance at 11651.77, a dangerous place to close.  This morning’s NDX futures plummeted to 11285.10 followed by a small bounce.  This is very bearish, especially since today’s op-ex is short beneath 11475.00 and possibly at short gamma beneath 11400.00.  The options are still in play, although not as populated as last Friday.  This Friday’s op-ex is in short gamma beneath 11500.00!

ZeroHedge observes, “The most common question among investors these days is when to buy the dip.

Very few market participants seem to be worried about a crisis or deep recession, let alone a nuclear threat.

However, those three scenarios are not unimaginable.

In its Global Data Watch of June 17, JP Morgan says that its internal model only shows a 25% chance of recession in the next year. Furthermore, they clarify that the likelihood would rise to 40% if credit conditions were updated.

Still low, right? We must remember that in January 2008 Reuters reported that “expectations for the weakest consumer spending performance in 17 years during 2008 kept the odds of a recession at nearly 40 percent”.


SPX futures declined to a low of 3690.80 this morning before a small bounce.  In today’s op-ex, Max Pain is at 3750.00.  Beneath that options turn short with short gamma possibly starting at 3700.00.  Most certainly at 3650.00.

I have voiced my puzzlement over the lack of agreement among the Cycles, especially at this time.  After much review, I believe I have the answer, and it isn’t pretty.  First, what have we noticed thus far?  The decline in Wave (1) was 51 days.  The decline in Wave (3) was 52 days.  A very close comparison.  What may surprise you is that each decline took exactly 37 market days.  What is the significance?  I had made a statement that impulsive declines take place in units of 4.3 days.  That would give us 30.1, 34.4 or 38.7 days in an impulse.  However, the declines since January 4 are not impulsive.  They are corrective in a Leading diagonal decline.  

What I have discovered is that corrective moves often happen in units divisible by 18.5 (4.3 squared).  Yesterday was day 12, leaving us with 6.5 more market days of decline, at a minimum.  That makes the probable bottom on June 30.  My warnings of 10% down days are still valid.

Here is what may happen should Wave (5) make a 37+ market day decline.  This illustrates the Orthodox Broadening Top, where the next target may be Point 6.

ZeroHedge reports, “Tuesday’s euphoric market mood has U-turned into sheer despair with most of yesterday’s gains gone overnight as attention turns to the coming US recession (now made official by Bill “The Fed Should Crush Donald Trump” Dudley who just published an Op-Ed “The US Economy Is Headed for a Hard Landing“) and as traders await Jerome Powell before Senate testimony. S&P 500 futures declined 1.2%, down 45 points to 3,722 while Nasdaq 100 futures were down 1.5% by 715 a.m. in New York, indicating more declines for heavyweight technology stocks, which have already been hammered by rising rates.  Treasury yields and oil both slumped while the broader commodity sector tipped back toward pre-war levels, as traders increasingly price in a recession.


VIX futures rose to a morning high of 31.57 before easing  down to 31.00.  The above explanation of the SPX may clear up why VIX has not exceeded its Head & Shoulders neckline.  The next Master Cycle (high) appears during the week of August 22.


Posted in Published | Comments Off on June 22, 2022

Junee 21, 2022

1:55 pm

SPX made a 70% retracement of the June 16 decline.  It has not…overcome the gap left on Thursday open at 3788.19.  It may not have completed  Wave C of (5).  And it has not completed an Cyclical minimum 12.9 days of decline (yet).  It is also short-term overbought.  A 10% down day from here may easily bring SPX beneath the Head & Shoulders target.

VIX shows trending strength next week, which raises alarms that the following correction may extend even lower.  I am not comfortable with this arrangement and wish to warn that this situation may go in any direction.


8:15 am

Good Morning!

SPX futures soared just beyond the 50% Fibonacci retracement value at 3737.22 before dropping back toward the 38.2% Fibonacci retracement at 3713.63.  Investors are coming back in to pick up “bargains” but may suffer disappointment as the decline is not yet complete.  The gap left on June 16 at 3788.19 has been left unfilled, leaving it in a weakened state.  Structurally, there are two more probes lower over the next two days that may bring the Elliott Wave structure and the Cycles to completion.  The declining pattern since January has been a Leading Diagonal made up of A-B-C zigzag patterns most evident in Wave (1).  Wave A of (5) declined from 4177.51 to 3705.68, a 471.83 point decline.  Should Wave C be equal to Wave A, the decline may go to 3232.39.  This matches up with the October 2020 support/low at 3233.94.

This morning’s bounce may be explained by the fact that, in today’s options expiration, options don’t turn long until 3740.00.  Thus, the attempt to boost the SPX into long option range may have failed.  Short gamma may reside at 3700.00 and below, so this is the level to watch.  There are put positions down to 3400.00.

ZeroHedge reports, “Following a relentless rout that erased nearly $2 trillion in market value from the S&P 500 last week, US equity futures have surged, extending their Monday holiday gains just as predicted on Sunday when we said that a “Nasty Squeeze” was on Deck following last week’s “Second Largest Ever” shorting by hedge funds. Nasdaq 100 futures rose as much as 2.2% before trading 1.7% higher as major US tech and internet stocks advanced, poised to extend Friday’s gains; shares of Tesla and Twitter also rose following billionaire Elon Musk’s comments at the Qatar Economic Forum; S&P 500 futures gained 1.8%; the cash market was closed on Monday for a holiday. Asian and European stocks also advanced as did bitcoin which jumped above $21K after sliding below $18K briefly on Saturday. Meanwhile Treasuries and the US Dollar retreated.”


VIX futures may have completed their retracement to 30.13 over the extended weekend and may  venture higher as investors suddenly find themselves buying protection against a decline.  This Wednesday’s op-ex shows VIX options turning long at 32.50 and long gamma beginning at 35.00.  What is noteworthy here is that VIX, which normally does the inverse of the SPX is not “on pattern”  VIX is showing unusual strength beginning this weekend and extending through July.  It may meet its Master Cycle high on its August op-ex on or near August 17.


TNX lingers above the Cycle Top support at 32.69.  A breakdown would launch a decline as far as the mid-cycle support at 20.81.  A Master Cycle low may be expected in the first week of July, an adequate time to allow TNX to meet its target.

ZeroHedge remarks, “Never forget – NOT allowing price discovery for a long period of time – then forcing the process onto markets with a “bayonet in the back” – at an ever-accelerating rate – is a virgin-central bank experiment. It comes at a high price. Never happened before.

Inflation is forcing central bankers to allow price discovery. There was always price discovery before Lehman – but for much of the last 12 years markets have been in a Fed zombie trance. We mean a real – free market – “cost of capital.”


USD futures reached an extended weekend low of 103.72 after a retest of the Cycle Top at 104.43.  The USD is on a sell signal with the Cycles Model calling for a decline to the second week of August for a potential Master Cycle low.  The Target may be the lower Broadening Wedge trendline and mid-Cycle support at 97.80.


Posted in Published | 2 Comments

June 20, 2022

7:40 am

Good Morning!

Due to today’s holiday, I am showing the “big picture” in the main indexes.  The Cycles Model shows a potential for two more market days of decline to reach completion of Primary Wave [1].  The Head & Shoulders target is 9365.00, anticipating an approximately 17% decline.  The weekly Cycle Bottom is at 9427.82, a possible 16.3% decline.  Last week I had suggested the potential for multiple 10% down days.  There is still a potential for at least one such day.  The usual Monday op-ex is postponed until Tuesday.  Wednesday is also an op-ex day, so options may play an important role in how the bottom may be formed.

ZeroHedge observes, “Last week, when we observed that Monday (the day the S&P finally tumbled into a bear market) saw the the fifth largest ‘sell program‘ in history…

… which was promptly surpassed by even more furious selling on Thursday when the TICK hit -2,057, the 4th biggest selling program on record…

… we quoted Goldman’s Prime Brokerage according to which hedge funds – the so-called “smart money” at least until Melvin Capital showed everyone just how dumb said money really was – not only sold US stocks for a seventh straight day Monday but the dollar amount of selling over the last two sessions (Friday and Monday) exploded to levels never before seen by Goldman, which is remarkable because the bank’s records go back to April 2008 which means they capture the chaos from the Global Financial Crisis. In other words, we just saw a more frenzied liquidation than what took place in the immediate aftermath of Lehman!


A similar scenario awaits in the SPX.  It appears that the Head & Shoulders minimum target may be achievable in just two days.  That may still be a near-panic situation for the untested, causing massive selling near the low.  Once accomplished, there may be a very sharp rally back to the trendline near 4215.00.   With all that, the Cup with Handle formation may still be on deck for at later dccline.

ZeroHedge asks, “Is this the bottom?

Oppenheimer “Market Bottom Checklist”

Source: Oppenheimer

Now do Depression…

Equities normally fall 30% in a recession, meaning that we are sort of 75% there…Now do depression…

Source: Barclays

20% further downside?

If real 2Y swap rate goes to zero, stock market sell-off still has 20% to go.”


VIX remains beneath the Head & Shoulders neckline.  However, a 10% down day in the SPX may encourage a breakout in the VIX.  Once above the neckline, VIX can go much further than the H&S Target implies.


Posted in Published | Comments Off on June 20, 2022

June 17, 2022

1:15 pm

Recall that today is day 256 of the Master Cycle.  It may be that, if SPX closes positive here, the decline may be over (First alternate).  However, today is day 11 of the decline from 4177.51.  The greater likelihood is that there may be two more days of decline (second alternate), since the declines have been made in units divisible by 4.3.  Tuesday afternoon would give us 12.9 days of decline.  There may not be a crash yet, since they most often occur in Wave threes.  Thus, the change in Wave Structure shown here.  What follows is the summer rally, probably lasting until July 4.  The most likely target may be the 50-day Moving Average at 4117.50.  However, the Lip of the Cup with Handle is not out of the question.  Stay alert for indications that the bottom has been made.  A new high above 3707.71 is a likely indicator.  The Cycle Bottom resistance is at 3715.00.


11:35 am

Despite the positive open, SPX remained beneath Cycle Bottom resistance at 3722.75 then made a marginal new low.  There appears to be a valiant effort to “hold the line” but short gamma is still the most important consideration.  Should SPX rise over resistance it may have the ability to rally further, so be on the alert.  Today is day 256 of the Master Cycle and I am looking for a significant bounce after this decline.  As long as SPX stays beneath resistance the decline may last until early Wednesday.

ZeroHedge observes, “Two weeks ago, when we previewed today’s “literally massive, repeat massive” $3.4 trillion opex…

… the S&P was trading around 4100 which meant that today’s quad-witching expiration schedule could – and likely would – lead to market havoc as max-gamma clashed with forces that wanted risk either higher or lower.

However, with stocks crashing since then, and with spot tumbling below 3700 while the bulk of open interest remains around 4100-4200 it means that pin risk today is minimal at best…

… as is the risk of continued selling due to technicals and positioning.

Instead, according to some, it is far more likely that traders and market makers will be to cover short positions, due to the unusually benign market setup.That’s because with a boatload of recently purchased puts in the money, dealers who sold these protective contracts and shorted stocks in order to balance their books will need to buy back shares in order to stay market neutral.”


7:45 am

Good Morning!

NDX futures jumped to 11288.70 in a mechanical release of short covering as yesterday’s expiring options were paid.  Once accomplished, the concentration will be on today’s expiring options.  Just a reminder…today is day 256 of the current Master Cycle.  Based on the Cycle and Wave patterns, there may be another 3.3 days of decline.  Be prepared for multiple 10% down days where the equities markets may decline 10% or more.  There is a strong likelihood of possibly three such days if the bearish formations prove correct.

Today’s expiring options are deep in short gamma.  Max Pain is at 11600.00 and long gamma lies at 11800.00.  This morning’s bounce isn’t even close.  It is hard to say where short gamma begins, but it is certainly beneath 11325.00 where there are 555 put contracts.

QQQ (271.39 at the close) expiring options go short beneath 300.00.  Short gamma begins at 290.00 with pockets of puts increasing every 5 points.  The 280.00 strike has 81, 363 contracts.


US 500 futures have also rallied to a morning high of 3709.70.  They have since begun to decline.  The Two hour Cycle Bottom is at 3739.01, providing overhead resistance to the bounce.  Intermediate Wave (3) is where the crash occurs.  There is a high probability of reaching the Cup with Handle target, so do the math.  Several 10% down days are a high probability.  Despite this, wishful thinking prevails.

This morning’s expiration of index options shows 35,780 open put contracts at 3700.00. explaining the rally to avoid serious pain at that level.  However, puts prevail beneath 4000.00 with short gamma likely beginning at 3900.00.  That means there is no morning ramp high enough to reclaim positive option ground.

SPY (366.65 at the close) contracts expiring at the close show put prevailing beneath 386.00 with short gamma starting at 385.00 showing 85,549 expiring contracts.  Short gamma likely starts there.

ZeroHedge reports, “Ending a rollercoaster – but mostly lower – week for risk assets around the globe which saw the Fed hike the most since 1994, a shock Swiss National Bank hike and the latest boost in UK borrowing costs, as well as a bevy of central banks surprising hawkishly, stocks in Europe finally rebounded after hitting an 18 month low earlier this week, while US equity futures were bid Friday after a rout triggered by fears of recession pushed the S&P into a bear market on Monday. S&P futures rose 1% and Nasdaq futures rebounded 1.2% signaling steadier sentiment compared with Thursday’s plunge in US shares to the lowest since late 2020, after the BOJ refused to change its Yield Curve Control conditions, sending the Yen plunging, and helping the dollar snap two days of losses as Treasury yields were flat with the 10Y around 3.21%. The Stoxx Europe 600 index jumped about 1.2% after hitting its lowest level in more than a year.

Friday also brings an absolutely massive triple-witching, and although Bloomberg believes that the roughly $3.2 trillion in options expiry may lead to short covering, which could bring temporary relief for the stock market…


The NYSE Hi-Lo Index is at its lowest since March 2020.  That significant damage may not be able to turn on a dime.  The Cycles Model suggests is could be another month to the bottom of this Master Cycle.


VIX futures have declined to 31.82 in a brief consolidation.  Next Wednesday’s options turn positive above 27.00 and long gamma begins at 35.00.  It is likely that the next move may challenge 40.00, whether it occurs today or Monday.  The current Master Cycle ends during options week in August.


Posted in Published | Comments Off on June 17, 2022

June 16, 2022

9:54 am

The Ag Index finally made its Master Cycle low yesterday, on day 277 of the last Cycle.  This opens the door for a rally that may last until the end of July, the only long opportunity on my radar.

ZeroHedge observes, “There’s nothing like the sweet smell of Building Back Better…

Pennsylvania farmers are being “crushed” by the record cost of diesel – so much so, that questions about a food crisis are starting to loom, the Morning Call reported.

One farmer in Lehigh County is quoted as saying: “I’ve got a tractor hooked up to my corn planter out here, no diesel fuel, and I can’t afford to get any.”

The Heat Wave is taking its toll…

…as furious farmers go viral.

And food processors mysteriously go off line.


9:44 am

BKX, our liquidity proxy, is sinking to new lows in a Primary Wave [3].  The next Master Cycle Bottom appears in the week of July 18, post op-ex.  This suggests that both June and July options expirations may be brutal for liquidity.  Could we see a “no bid” market before the summer is over?  A contracting economy and stock market may make banks more reluctant to loan for any reason.

Zerohedge observes, “Another day, another disappointing macro data point in the US economy. While ‘hard’ data has been tumbling, we now see the usual optimism-filled ‘soft’ survey data giving up hope as Philly Fed’s business barometer plunged into contraction in June (from +2.6 to -3.3), notably missing expectations of a small rebound to +5.0.

This is the first contraction since the COVID lockdowns of 2020…


8:05 am

Good Morning!

SPX futures mad a new low at 3692.30, promising more to come after a brief bounce.  Equities followed their script, sucking in more bag holders prior to the close.   Now they have to make a swift exit as dealers and hedge funds double down deeper into short gamma territory.  Minor Wave 2 ended in an Orthodox Broadening Top, forecasting the possibility of a decline to 2300.00 in this Cycle.  The Cycles Model made a small adjustment, since the 4.3-day decline previously mentioned began at yesterday’s close.  There should be no respite until mid-morning on Wednesday when the SPX completes Waves 3, 4 and 5 of Intermediate Wave (3).  The new bottom may give way to a 3-week rally followed by the next decline into mid-August.  Another decline into mid-October.  And a final decline into early November.  By then investors will be so worn to a frazzle by all the false calls for a bottom, they will refuse to participate.  I know.  I have been there before.

Today’s options are deep into short gamma, with only 909 call contacts at 3750.00.  There are pockets in the thousands of puts every 50 points down to 3000.00 today.  They are lined up like dominoes.  Tomorrow’s options expiration is even more dramatic, with pockets of puts in the tens of thousands.  The number of put contracts at the 3000.00 strike is 55,111.  This is now payback time for all the contracts that expired worthless.  We may see a dealer or two fold.

ZeroHedge reports, “In our preview of how to trade the Fed’s 75bps rate hike, we said to expect a  “kneejerk move higher (especially if we get an outsized hike, hinting the Fed is hoping to catch up to the curve), then a gradual drift lower” (a reco which was later echoed by Goldman).  Sure enough, in the aftermath of the FOMC announcement yesterday, we got the knejerk move higher… and then overnight, the drift lower has also appeared tight on schedule, with futures tumbling in the US, undoing the entire post-FOMC move higher, and dragging global stocks lower as traders come to grips with the realization that 75bps of hikes – far from bullish – means that a recession is now on deck. As a result, S&P futures were down 2.2%, tumbling as much as 130 points from overnight session highs, while Dow futures puked a whopping 600 points as central banks lose control over markets. European stocks headed for a 16-month low and Chinese Internet shares dropped in premarket New York trading”


VIX futures rallied to 32.19 this morning, on its way above the Cycle Top to the Neckline at 40.00.  VIX is now in long gamma with next Wednesday’s open interest at 4498 call contracts at 30.00 and 9131 call contracts at 35.00.  open interest spikes every 5 points up to 50.00, where I stopped my research.  This is a good point at which to buy VIX, as its peak doesn’t come until the third week of August, at options expiration.  The breakout over 40.00 may cause a panic, as it hasn’t been that high since October, 2020.

As mentioned, the NYSE Hi-Lo Index opened at –35.00, but closed at -332.00 as the correction failed.


TNX made a possible new swing high at 34.95 before dropping back beneath the prior high at 34.83.  In any event, TNX is due for a substantial correction lasting until the first week of July.  For those of you who think the Fed is all-knowing and all-powerful, I did a study of all the FOMC moves vs the 90-day T-bill rate.  The Fed never anticipated a single rate increase or decline since 1949.  It has always bee late by an average of 3 months recognizing any changes in trend.

ZeroHedge opines, “The Federal Reserve’s Federal Open Market Committee (FOMC) today announced an increase of 75 basis points to the target federal funds rate, raising the rate to 1.75% from 1%. June’s meeting today was the third meeting this year at which the FOMC has raised rates. Coming into the March meeting this year, however, the FOMC had not raised the target rate since March of 2020, even though price inflation began to accelerate during the second half of 2021.”


Crude oil consolidated in the overnight session, making a low of 114.76.  It may now have entered a serious correction with a bottom near the end of the year.  Note the Broadening Wedge formation.  We may now be entering a demand destruction phase in the market as liquidity dries up.  A 61.8% decline toward the April 2020 low would take crude down to 53.07,very near the Broadening Wedge target.

While the IEA sees a record demand for oil in 2023ZeroHedge interviews Max Berman, who believes that demand destruction may be underway.


Posted in Published | 1 Comment