12:55 pm

The bounce in SPX may have been stopped by Cycle Bottom resistance at 3782.28.    SPX appears to have topped out at 3794.73 and has dropped beneath resistance, creating a sell signal.  The chart shows yet another possible  defective (truncated) rally here.  While there may be a spike at the FOMC announcement, chances are it may be untradeable. A decline beneath 3750.00 confirms this observation.

ZeroHedge opines, “With just a few hours left until today’s FOMC decision, here’s what we know: Powell will hike either 50bps or 75bps, with the market pricing in more than 100% certainty of a 75bps hike today thanks to Monday’s article from the WSJ (which refuted a WSJ article by the same author just 24 hours earlier, so clearly someone at the Fed made a phone call). In fact, as shown below, besides a fully priced in 75bps, the market now prices in 7% odds of a 100bps rate hike…

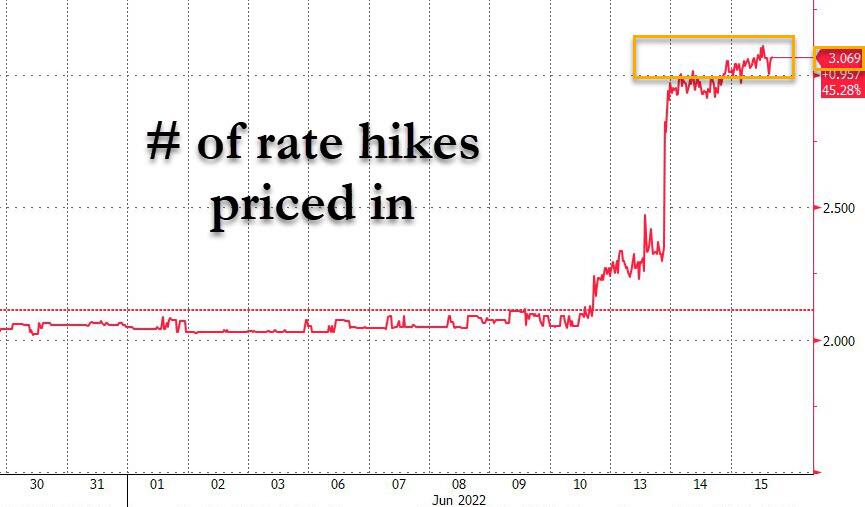
… perhaps in euphoric agreement with Ackman and Gundlach, who overnight said the Fed should hike 100bps…


10:39 am

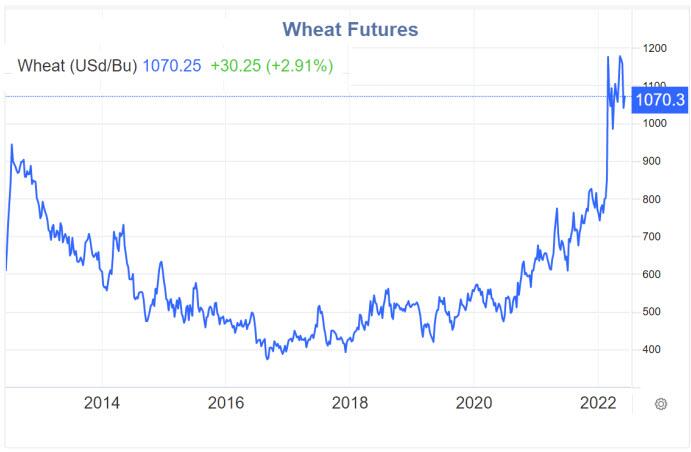
The Ag Index extended its Master Cycle low to day 277 today.  While market liquidity issues may be suppressing Ag prices, supply is being throttled as well.  Pressure is building for a massive rally over the next several months.

ZeroHedge reports, “Another food processing plant went up in flames. According to local news Stevens Point Journal, a fire ripped through a pizza-making plant in Wisconsin on Monday.

More than 70 firefighters from multiple fire departments battled a massive fire at Festive Foods in eastern Portage County that began around 0900 local time. The American Red Cross arrived on the scene shortly after to provide food and water to firefighters. They snapped two pictures of the blaze, showing flames erupting from the facility’s roof and a column of thick dark smoke pouring into the air. ”


10:05 am

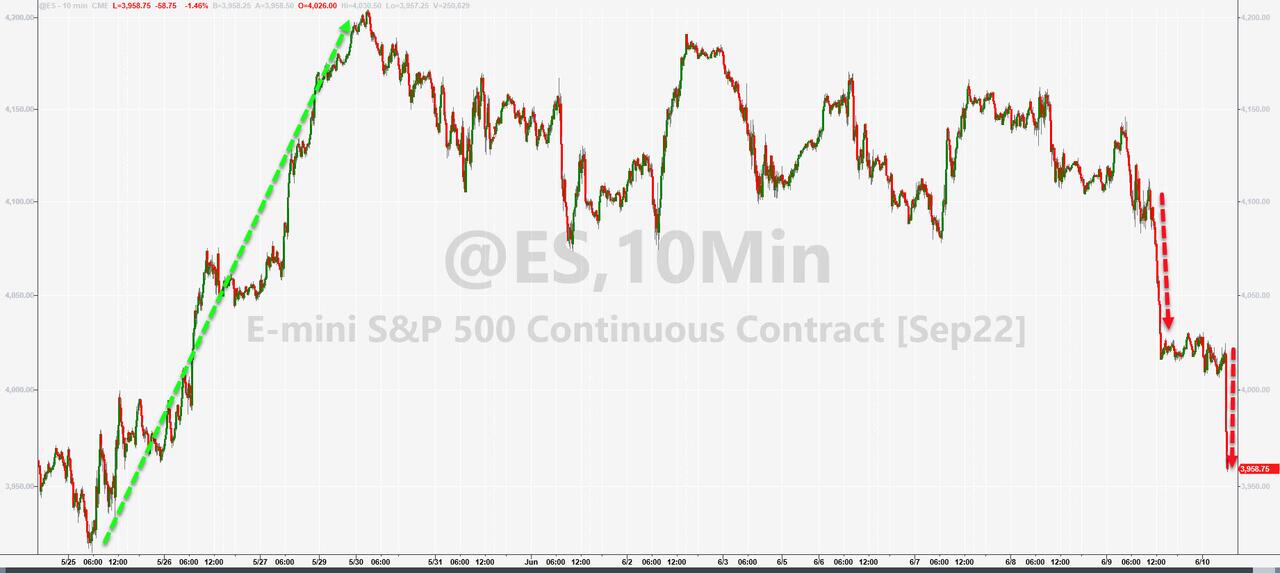
Today’s action in the  SPX has given me an answer to a question about where to measure the top in equities.  The Elliott Wave answer is that question is that Minute Wave [v] ended on June 8 at 4164.86, a truncated (failed) Minor Wave C.  The Cycles Model offered a swing high on June 3 at 4177.51.  The Cycles won the contest.  Today at 1:00 pm will be exactly 8.6 market days from the June 3 high.  That leaves SPX 4.3 more days to finish the current Master Cycle low on Tuesday late morning/early afternoon.  Of course, the decline may start sooner or later, but this gives us a certain amount of precision that may surpass “government work.”

ZeroHedge (Charles Hugh Smith) contemplates, “There would be some deliciously karmic justice if the “dumb money” driving a rally that forced the “smart money” to cover their shorts and chase the rally that shouldn’t even be happening.

Being cursed with contrarianism, as soon as a trade gets crowded and the consensus is one way, I start looking for whatever is considered so unlikely that it’s essentially “impossible.” Sorry, I can’t help myself.”


8:20 am

Good Morning!

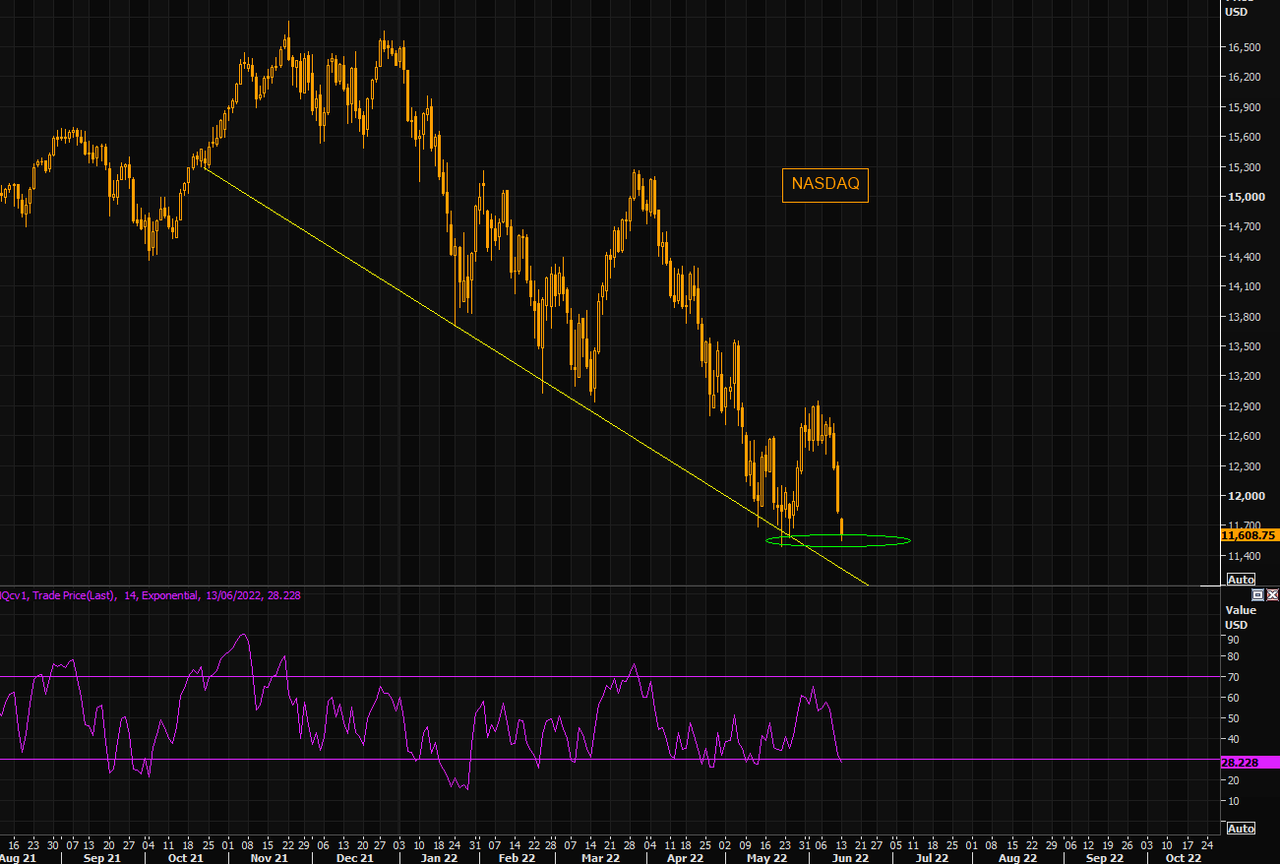
NDX futures hit an overnight high of 11451.00 as it attempts to overcome yesterday’s gap down and avoid short gamma.  It appears that the open will be back within yesterday’s daytime trading range.  Behind the scenes, dealers and hedge funds are positioning themselves for another volatile trading day.

In today’s expiring options, calls dominate above 11500.00, but short gamma starts at 11400.00.  Thus, the push higher this morning.  QQQ (275.91 at the close) is also pushing above 280.00 to avoid short gamma starting at 272.00.  Failure to avoid short gamma today sets up equities for a real beating on Friday.

ZeroHedge observes, “…but next shoe to drop

While waiting for FED, lets focus on something really boring, but really fundamental, earnings. There is increasing focus on forward estimates that seem too high and that they will be the next shoe to drop in the selloff. Pretty consensus that this is the case, but still, time for a thread….and remember, when the real cutting starts we are not far away from a stock market bottom…

Earnings are stretched in the long-term context

Only way is down? Chart shows trailing earnings in US at record highs…

Source: Datastream

Earnings much more above trend than at other peaks

S&P500 EPS vs trend at peaks


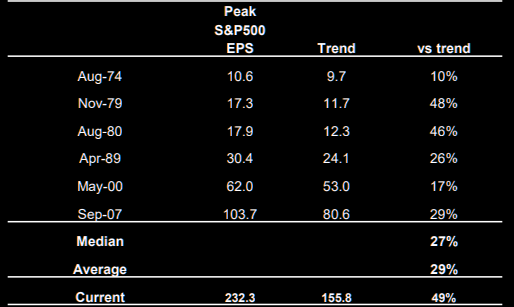
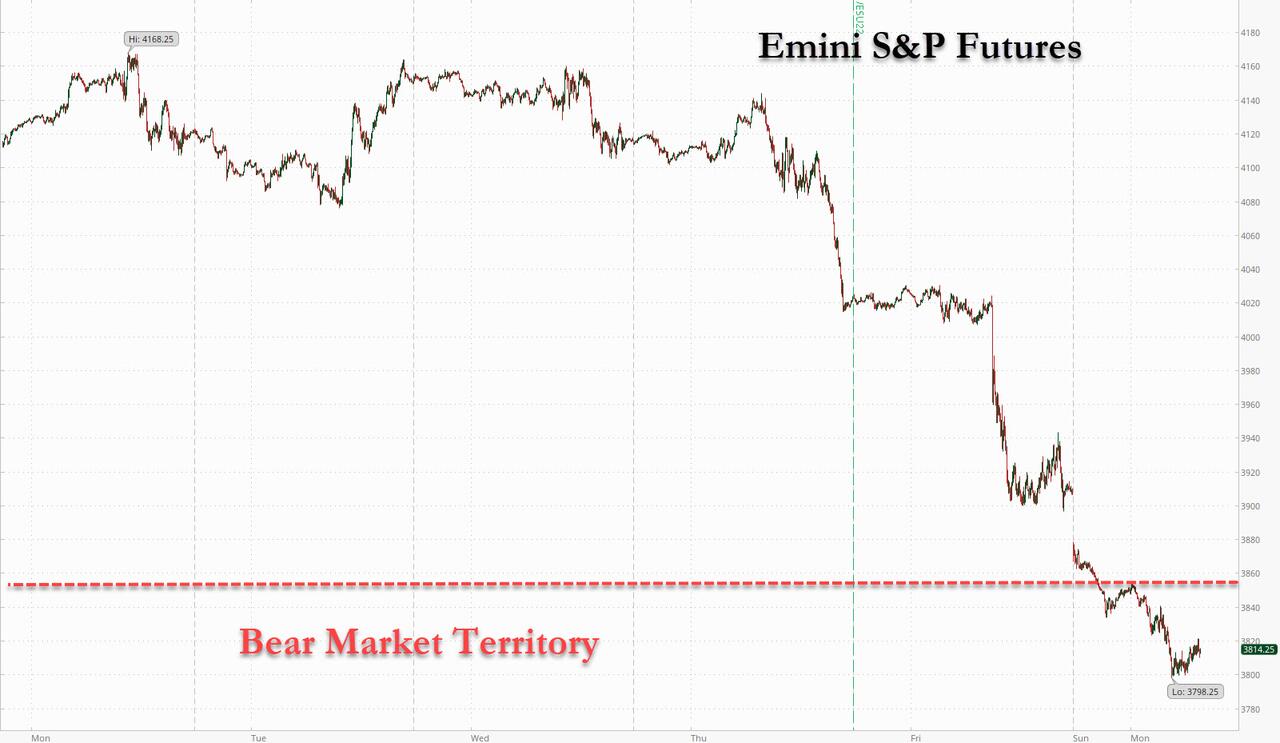
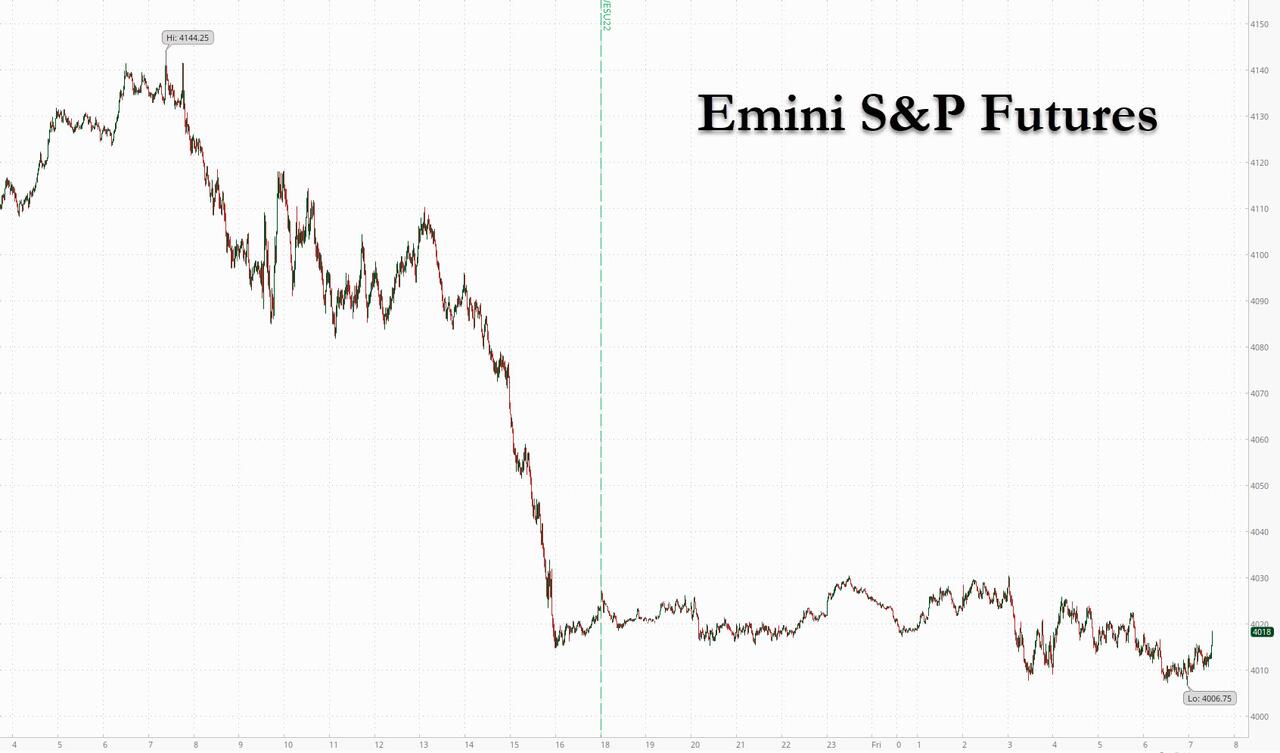
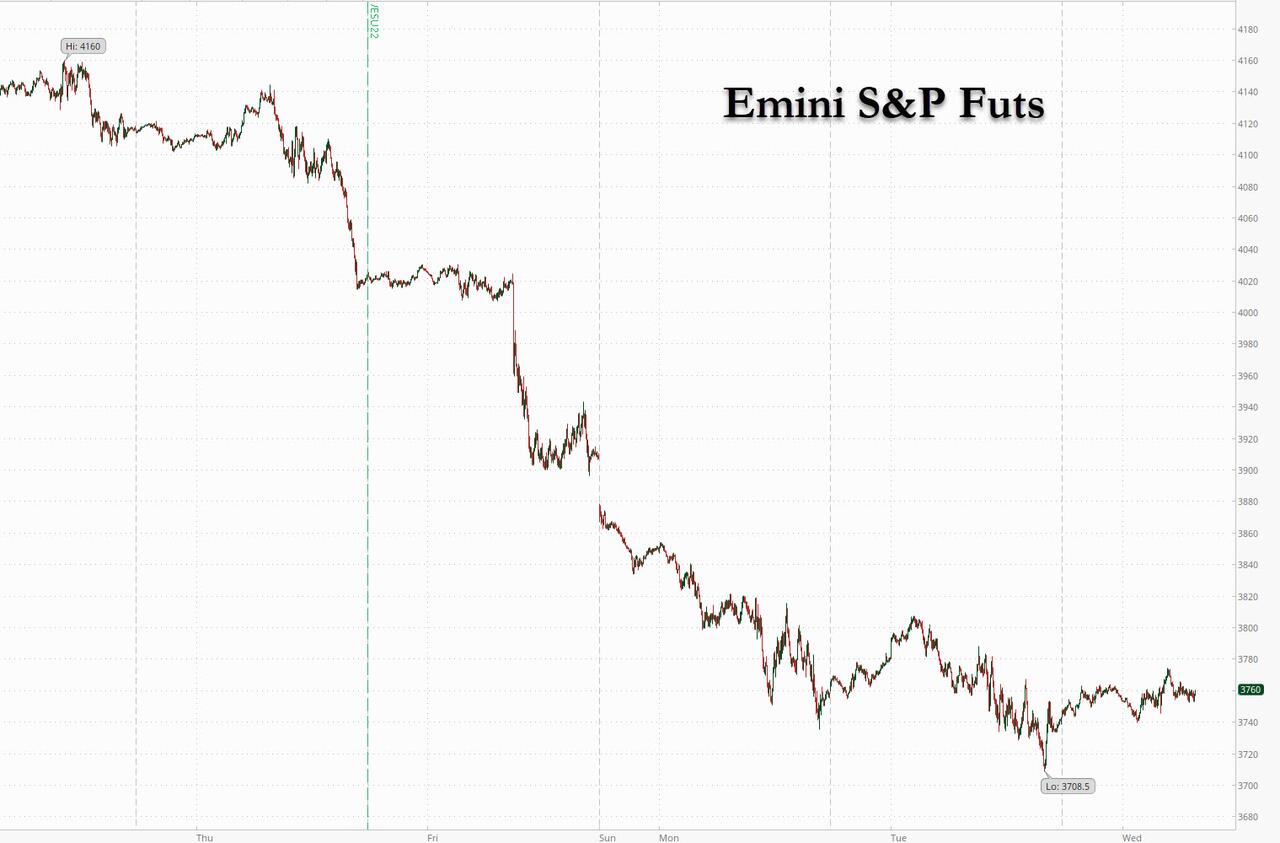
SPX futures are also higher, but mired in short gamma beneath 3800.00.  SPX has four more days to reach the Master Cycle low.  Despite the 12% decline from the Wave (2) high, the next move may be a multiple of that.  The Cup with Handle target is still within reach.

Options expiration today shows puts dominate beneath 3820.00 and short gamma beneath 3800.00.  Try as they might, there just isn’t enough liquidity to overcome this barrier.  Aside from a mechanical profit-taking on yesterday’s options, the dealers may be forced to go short at deeper levels to pay the price of all the maturing puts.

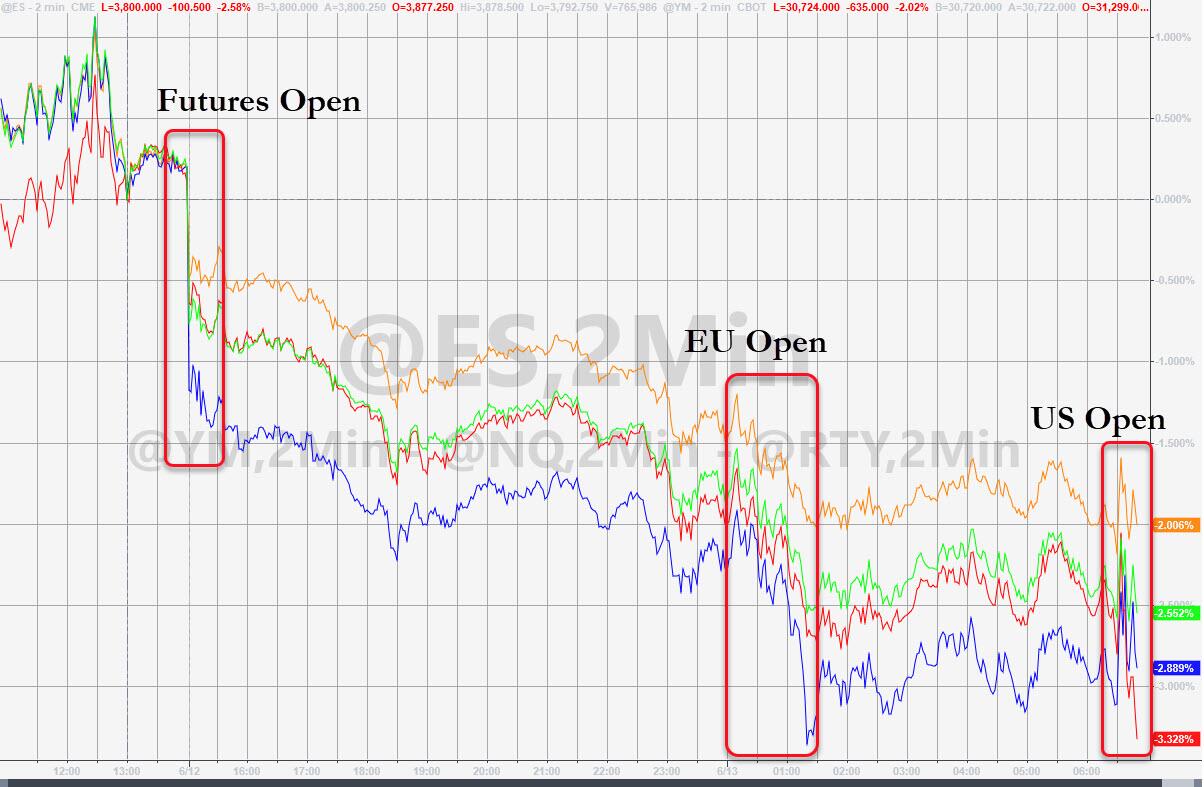
ZeroHedge reports, “After five days of non-stop losses, US index futures finally bounced modestly along with stocks in Europe as the ECB announced it would hold an emergency meeting to undo the damage done by its meeting from last week, and ahead of the Fed which today will hike by 75bps, the most since 1994, and will then scramble to undo the damage from pushing the US into a recession in coming days and weeks.

Contracts on the S&P 500 and Nasdaq 100 posted modest gains, rising 0.8% and 1% respectively, ahead of the Fed, with markets fully pricing in the biggest rate hike since 1994 amid worries about the outlook for the economy. Europe’s Stoxx Europe 600 index jumped more than 1%, snapping a six-day losing streak, while the euro strengthened and the region’s bonds advanced as the European Central Bank’s Governing Council started an emergency meeting. Treasury yields dipped and the dollar retreated from a two-year high.


VIX futures challenged Monday’s gap higher at 32.08 this morning.  However, the lowest it could reach was 32.00.  VIX options turn positive at 30.00 with the long gamma 800 lb. gorilla waiting at 35.00.  While the Cycles Model implied that yesterday was to be a trending strength day, I suspect it may be today, due to the FOMC machinations.


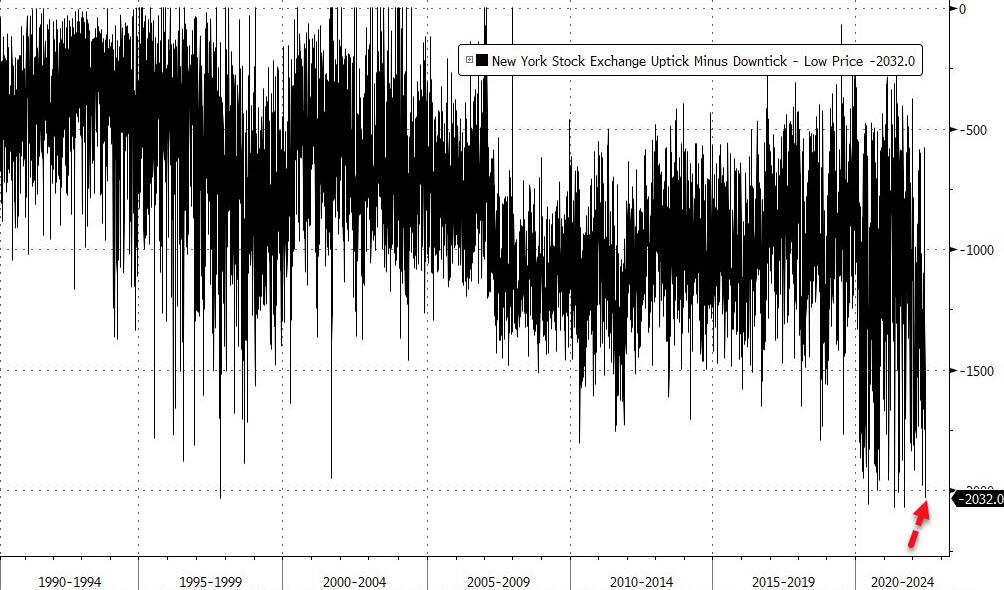
Despite the relative positivity of the NYSE Hi-Lo Index yesterday morning, it flopped miserably.  This morning may be yet a second attempt at reversing the trend.  However, the Cycles Model suggests the downtrend won’t stop until the second week of July.  In other words, this week may be bad, but it may get much worse.


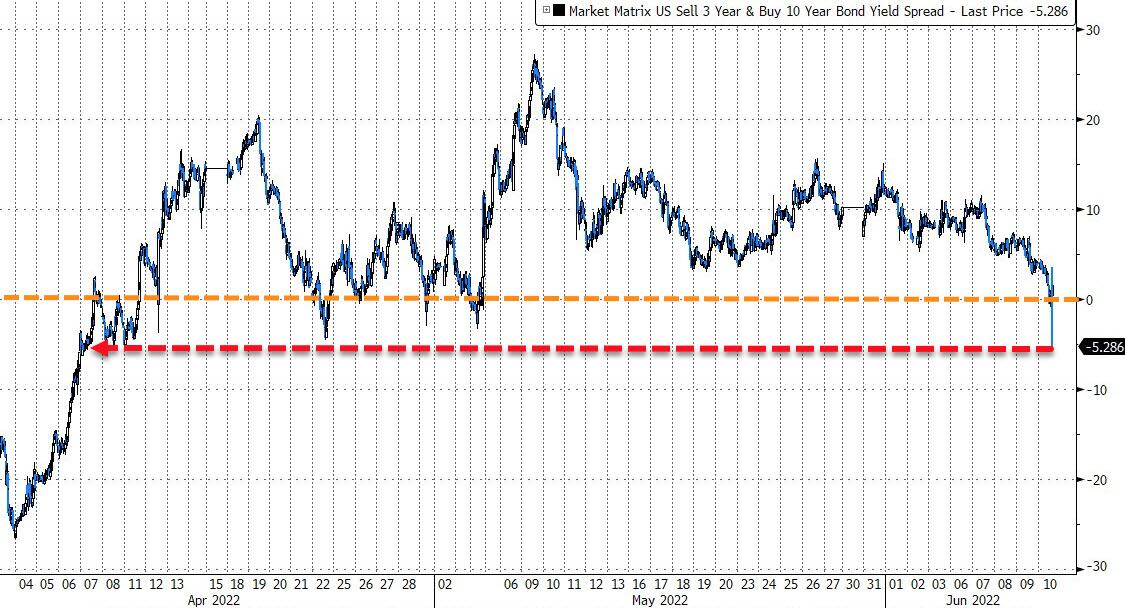
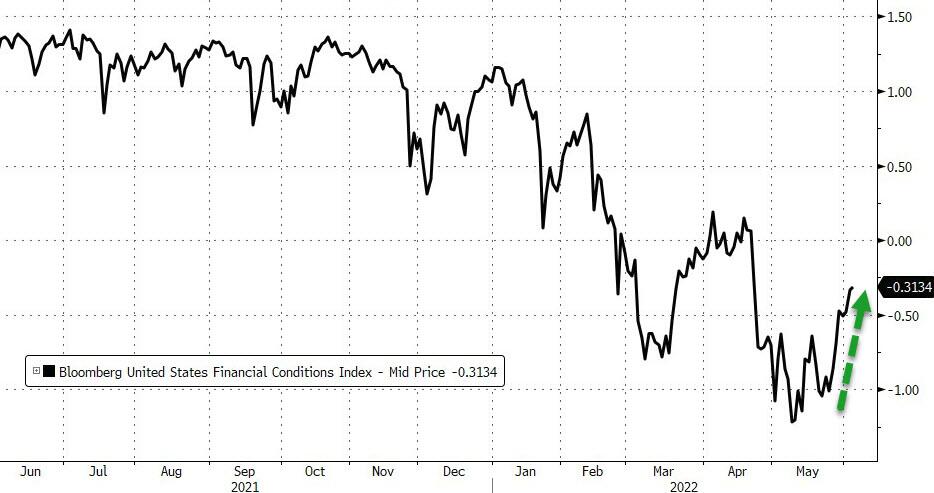
TNX has reversed from its swing high (Minute Wave [b]) to complete its correction near the mid-Cycle support.  This may be evidence of “smart money” anticipating the flow of liquidity from stocks into bonds.  This flow may last three weeks or longer as money seeks a safe haven.  In contrast, European and Japanese bonds are crashing.

ZeroHedge reviews, “Up Until Monday afternoon, the FOMC was been expected to hike rates by 50bps to 1.25-1.50% until the hot May CPI figures, rising consumer inflation expectations and a WSJ article, ignited a wave of 75bps calls to 1.50-1.75%. The Fed guidance initially called for 50bps (both in June and July) had the data evolved as they expected, but after the hot May data, some calls for larger hikes, a ‘Volcker moment’, fuelled speculative market activity leading into the meeting, and given a slew of publications with high-placed sources (WSJ, CNBC, Bloomberg) have come out suggesting a 75bps hike – the biggest hike since 1994 – is indeed possible on the eve of the confab, it is now seen as a base case for many…

  • Barclays +75bps
  • Deutsche Bank +75bps
  • CapEcon +75bps
  • Goldman +75bps
  • JPMorgan +75bps
  • Jefferies +75bps
  • Nomura +75bps
  • SocGen +75bps
  • TD +75bps
  • Wells +75bps
  • BNP +50bps
  • BofA +50bps
  • Citi +50bps
  • Credit Suisse +50bps
  • HSBC +50bps
  • Morgan Stanley +50bps
  • StanChart +50bps

… and a certainty as per market pricing (the Fed has never hiked 100bps in the “modern” or post-Greenspan era, although it did hike 500bps in 1980 under Volcker).”


USD futures may be in reversal after hitting a morning high of 105.23, then declining into the red.  Today is day 258 of the Master Cycle and likely producing a swing high in USD.  Traders may look at this as a breakout, but is more likely to be a trap for the unwary.


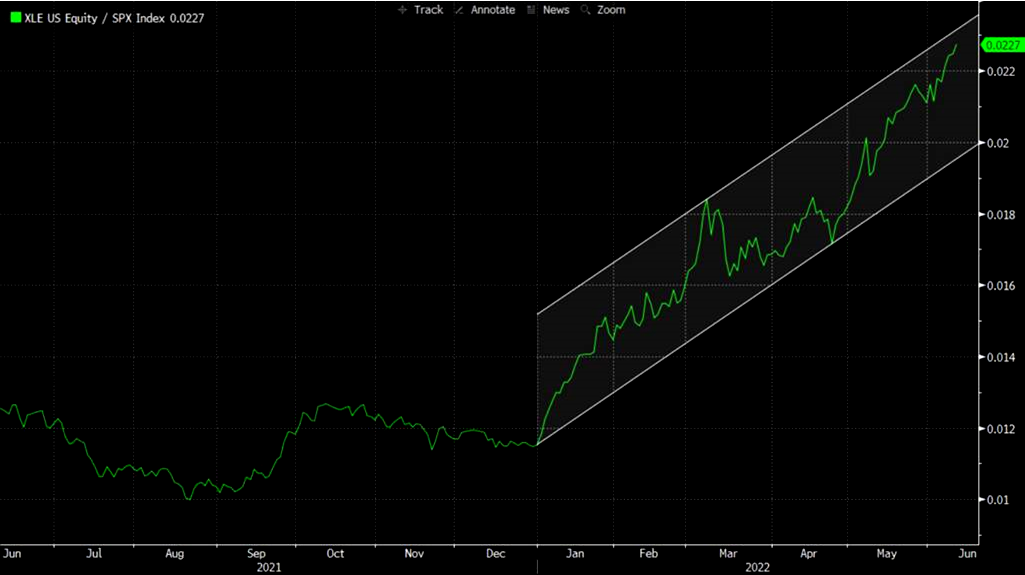
Yesterday West Texas Crude futures finally made their Master Cycle high on day 266  of its Master Cycle.  The Cycles Model shows the new Master Cycle in decline until the last week of July.  If the Broadening Wedge is correct (and it usually is), we may see crude drop to 50.00 by the end of October.


This morning gold futures may have finished its Master Cycle at 1882.50 on June 13 (day 257).  The decline has been sufficient to make a sell signal beneath Intermediate-term support at 1852.36 and mid-Cycle support/resistance at 1846.62.  The Cycles Model shows a possible bottom at the end of June, as gold is likely to imitate the decline in stocks.  I anticipate a decline in that time to the Cycle Bottom at 1713.16.


Posted in Published | Comments Off on

June 14, 2022

11:05 am

SPX inverted and made a new bear market low at 3731.13 just before 11:00 am.  The attempted bounce has failed and SPX is now trading below water.  We can expect a deep dive today, as a new hourly Cycle has begun.

The NYSE Hi-Lo Index opened at -104.00 today and attempted a rally to -99.00.  It has now declined to -573.00.


10:00 am

SPX has opted to rally this morning, but with only an hour of bounce left in the present Cycle.  Overhead resistance lies at the two-hour Cycle Bottom at 3813.52.  Most analysts are too young to realize that the 2009 low was not the lowest stocks could go in terms of earnings multiples.  The SPX earnings multiple in 2009 was 13.7, while the 1982 earnings multiple at the low was under 5!  Goldman took a stab at it when they proclaimed that earnings multiples would bottom out at 14, but the analysis was quickly scrubbed.  You can hardly blame them, since even StockCharts rarely show charts with values prior to 1990.00.  Any real study requires an analyst to dig through the raw data and create their own analysis to get to the truth.

I was fortunate to become securities licensed in 1981.  For an entire year I had nothing to sell but money market funds (no commissions) paying double digit returns while the stock market was piling up losses, thanks to Paul Volker.  On April 23,1982 I had a career-changing interview with Sir John Templeton who opined that the DJIA would hit 1000.00 by the end of the year.  The Dow was retesting its low of April 21,1980 at 759.13 and finally bottomed out in June of 1982 at 811.93.  Sir John was correct and his advice turned into an ongoing (and profitable)conversation with him until his death in 2008.


7:30 am

Good Morning!

This morning the weather service has issued a heat advisory for the State of Michigan.  We are expecting temps in the high 80’s.  Tomorrow we may see triple digit temperatures.  Ah, Summer!

NDX futures bounced to a morning high of 11502.00, a 15% bounce off the bottom after a 12,7% decline from last week’s high.  Normally we would expect a bounce to the Cycle Bottom resistance at 11948.99, a 42% bounce.  That is not likely to happen.  The Cycles Model suggests, at best, two more hours of bounce.  The alternate is the futures bounce may have been the extent of it.

There is no NDX op-ex today.  Wednesday’s op-ex shows only 7 call contracts between 10200.00 and 9500.00.  Put contracts, while not heavy, make a consistent showing every 25 points down to 9500.00.  Friday’s op-ex sows calls have been massively sold, with only 48 contracts left beneath 11300.00.  Compare that to over 4,000 put contracts “expiring” on Friday between 11300.00 and 9500.00.

ZeroHedge remarks, “Short gamma dealers praying for Friday to pass

Lot of short gamma is expiring on Friday. After Friday the destabilization effect becomes much smaller. According to Nomura’s McElligott, these are the statistics:

SPX / SPY expecting 42% of $Gamma to expire Friday

QQQ expecting 56% of $Gamma to expire Friday

IWM expecting 57% of $Gamma to expire Friday

HYG expecting 46% of $Gamma to expire Friday

Never forget – short gamma works both ways

QQQ and SPY are both in deep short gamma land. Gamma does not care about direction, only the “oscillations”. Main point is that given the fact short gamma is so big here, all moves will be magnified. Dealers have been forced to puke deltas all the way down (nobody is that chilled and runs 4% index deltas due to short gamma). Imagine this decided reversing and dealers start buying all those sold deltas much higher. The destabilization effect is huge here and it works both ways. What is the short term pain trade from here?”


SPX futures bounced to an overnight high of 3803.90, then came back down to the closing low.  The same Cycles choices here.  Either the market continues its decline at the open or, at best,  there may be up to two hours of bounce.

Today’s op-ex shows Max Pain near 3880.00 while options turn long at 3950.00 and above.  Short gamma kicks in at 3850.00.  This is not a pretty sight, since a further decline may have dealers chasing gamma down to 3500.00 or lower.  Wednesday’s op-ex is more of the same and Friday’s op-ex appears to be deadly.

ZeroHedge reports, “US index futures staged a feeble, fading attempt to bounce on Tuesday, following Monday’s crash that wiped out $1.3 trillion in market cap and topped a furious 4-day selloff that was the worst since March 2020 and culminated in a bear market amid expectations – even from permabull Goldman – that the Fed’s now accepted 75bps rate hike on Wednesday will hurl the economy into a recession. Futures on the S&P 500 rebounded more than 1% in early trading before fading the gain to just 0.24%, while Nasdaq 100 futures climbed 0.5%.”


VIX futures remained beneath the Cycle Top resistance at 34.22 overnight, but the session appears to be more of a consolidation than a decline.  The Cycles Model show today being a particularly strong trending day.  This suggests the Head & Shoulders neckline may be challenged, if not broken.

Tomorrow’s op-ex shows calls dominating above 28.00 and long gamma  at 30.00.  Long gamma is magnified above 35.00, with puts tailing off.  Lng gamma remains strong up to 90.00.

ZeroHedge observes, “The plunge in the stock market is on mounting risks facing corporate earnings and a Federal Reserve that may have to pivot towards super hawk to combat the highest inflation in four decades. But let’s forget the souring macro backdrop because stocks could face even more downward pressure as a far more ominous development has emerged: A stock buyback blackout begins on Tuesday. 

Scott Rubner, an analyst at Goldman Sachs’ global markets division, told clients Monday that a “US Corporate Blackout window starts tomorrow (6/14).” 

As Rubner wrote, “corporates have been the largest buyer of US equities so far this year ($1.3T in authorizations).” Really this isn’t what bulls and those who’ve been attempting to ‘buy the dip’ want to hear as the S&P 500 tumbles into a bear market.

“We estimate ~47% of the S&P 500 will be in their corporate blackout window. By the end of the week, we estimate ~65% of the S&P 500 will be in blackout,” the analyst said. ”


TNX has begun its decline as it corrects down to mid-Cycle support, currently at 20.39.  This is not the final high, but expectations need to be blunted, if only temporarily.  The Cycles Model suggests a low in the first week of July which eases the the overbought condition before going higher.

ZeroHedge analysesm “For my entire career, Paul Volcker has been deified. In fact, I cannot think of an unelected government official, since the Generals of WW2, who is held in such esteem—which may also be a function of how terrible most government functionaries are.

As JPOW suddenly pretends that Volcker was his boyhood hero, I think it’s worth re-examining Volcker’s inflation fight.

Of course, everyone knows the high-level story; Volcker broke the back of inflation by taking rates into the stratosphere, inducing a recession, taking the heat from politicians and the populace, and sticking to his principles. He had only one mission; defeating inflation. Nothing stood in his way, and he kept at it until the mission was accomplished.

As a result of Volcker’s sacrifices, we’ve since experienced four consecutive decades of economic boom. Or that’s how everyone seems to remember the situation today.

What if there were other contributing factors?


USD futures are lower, suggesting a Master Cycle peak may have been made yesterday on day 256.  The Cycles Model suggests a decline may ensue into the second week of August.  The target may be the lower trendline of the Broadening Wedge formation and mid-Cycle support at 97.55.  From there we may see a blow-off top in the USD lasting through the end of the year.


Posted in Published | Comments Off on June 14, 2022

10:40 am

There is a chance that a bounce may be in order.  SPX has a huge set of (14840) put contracts at 3800.00 and there may be an effort to rise above that level.  The next large population of puts is at 3750.00, with 9868 contracts outstanding.  A close beneath these levels may leave the dealers and hedge funds bloodied.  They may try to “hold the Line” above 3800.00 until closing.

ZeroHedge observes, “US cash equity markets opened with no panic-bid, instead being met with a wall of selling after the ugly overnight futures session.

The selling wave was almost unprecedented, with a TICK below -2000 – the fifth largest ‘sell program’ in history…

As Bloomberg notes, sell programs of this size are typically not single events. They tend to happen in clusters and that probably means stocks might be in store for bigger losses.”


10:06 am

The Ag Index made a new Master Cycle low at 539.77 on day 275 of  the currently overdue Master Cycle.  The new Master Cycle is not due to mature until mid-August.  Be prepared for a monster spike higher, as news may overcome liquidity issues in this index.


9:53 am

BKX , out liquidity proxy, is making new lows this morning as it has triggered the Cup with Handle formation and may have more than a month to go until the next Master Cycle low.  This does not bode well for the rest of the markets as banks seek to limit their exposure.  This is where bank failures may arise, as most have been doing ‘business as usual” until now.  Earnings pre-announcements have become quiet as we count down the days for quarterly earnings to be announced in th e second week of July.


8:05 am

Good Morning!

NDX futures crashed to a new bear market low , at 11435.20 and is hovering near the low.  I don’t have to explain much about the impact that op-ex has, especially when it is in short gamma.  NDX is due for a bounce, but considering the weak bounces thus far, there may not be any incentive to “take profits” on short positions when the outlook is so bleak for the bulls.  Thus, not much chance of a short squeeze.  Commentators imply that the NDX , being oversold, may find a bottom soon.  Unfortunately, those that believe it may be the grist for the next melt-down.  In the meantime, monthly op-ex is looming.  Any mistakes here will be catastrophic, especially with another probable 30% decline still ahead.

ZeroHedge (TME) comments, “NASDAQ – welcome to oversold

NASDAQ has not closed this low in “forever”, but we saw futures trade slightly lower during the May sell off. RSI is very oversold here, but on the other hand oversold can stay oversold for longer than most think. Must hold levels are slightly lower…

Source: Refinitiv

Welcome to max short gamma pain

Both SPY and QQQ continue moving into “deeper” short gamma territory. Dealers must sell more and more deltas the lower we move as short gamma makes them longer and longer on the way lower. Do not forget the inverse will play out should this decide to bounce later. The destabilizing dynamics are in full motion here, and given the (still) awful liquidity, reshuffling big books remains practically impossible. (For more on short gamma, see here).”


SPX futures also made a new bear market low at 3798.50, followed by a shallow bounce.  That bounce may last into the cash market, but most investors will only see the losses and not the attempt to make a bottom.  It may fail quickly as the bounce may be sold before it has a chance to materialize.  As for op-ex, dealers are frantically trying to avoid paying on the 4800.00 strike with 14840 outstanding put contracts.

ZeroHedge reports, “For all those claiming that stocks had priced in 3 (or more) 50bps (or more) rate hikes, we have some bad news.

All hell is breaking loose on Monday, with futures tumbling (again) into bear market territory, sliding below the 20% technical cutoff from January’s all time high of 3,856 and tumbling as low as 3,798.25 – taking out the May 10 intraday low of 3,810 – before reversing some modest gains. S&P 500 futures sank 2.5% and Nasdaq 100 contracts slid 3.1%, in a session that has seen virtually everything crash. Dow futures were down 567 points at of 730am ET.”


VIX futures reached a morning high of 33.24 on its third day from its Master Cycle low.  There may be a pause at Cycle Top resistance at 34.05 this morning.  Wednesday’s op-ex in the VIX shows calls heavily favored at 30.00 and above, while long gamma starts at 35.00.  There may be some incentive to keep VIX out of long gamma before the Wednesday options expiration.

The NYSE Hi-0Lo Index closed Friday at -247.00…and it is not oversold.


TNX futures leaped to a high of 32.86 this morning, with the cash market opening just beneath it.  The oddity created here is that there may be an incentive for cash coming out of stocks to buy treasuries, bringing the yield back down.  The sentiment appears to favor higher rates, but it could lead to the opposite due to crashing stocks.

ZeroHedge observes, “After first Barclays and then Jefferies caused a stir by making a 75bps rate hike this Wednesday their base case, moments ago Standard Chartered head of global FX research and NA macro strategy, Steven Englander, upped the ante once again this morning when he said that while his team expects a 50bps hike at the 15 June FOMC, he does not “preclude a hike of 75bps or even 100bps.”

The reason why such a rate hike shock is even contemplated is because, as Englander explains, neither inflation nor the economy are giving clear enough signals of slowing to deter the Fed from its path of 50bps (or more) hikes for the next couple of meetings.”


USD futures rose to a new retracement high of 104.75 this morning, day 256 of the Master Cycle.  Be prepared for a reversal this week as USD must correct down to the lower trendline as early as mid-July.


WTIC futures declined beneath its Cycle Top at 121.27 to 118.00 this weekend before a technical bounce brought it off the new low.  It has made its Master Cycle high on June 8 and is due to decline over the next six weeks in tandem with equities.  Investors have been crowding into crude, but may be in for a rude surprise.  Sentiment is running high, as one can see below.

ZeroHedge comments, “Energy was the best performing sector once again….


….last week, continuing to demonstrate ‘defensive’ characteristics in a dreadful tape…ultimately outperforming the S&P 500’s -5.1% sell-off by +410 bps, as WTI extended its recent rally by +1.3%. Chart shows Energy vs. S&P 500.

Source: Bloomberg

Back above 5%

The outperformance this week allowed the energy sector to achieve a >5% weighting in the S&P 500 for the first time since mid-’19 (see below)… Morgan Stanley’s excellent energy specialist sales: “this is a key psychological milestone that makes the sector increasing difficult to ignore, as demonstrated by an inbound call this afternoon from a ‘TMT investor’ seeking Energy stock ideas”. Chart shows Energy’s Weighting in the S&P 500.


Source: MS sales

Energy vs. WTI

Energy is now struggling to keep up with WTI’s recent strength, but the glass half-full argument is that the sector now screens even cheaper vs. crude, with E&Ps still only pricing in <$70 bbl. Chart shows Energy vs. WTI’s 12-month Strip.


Gold futures declined beneath Intermediate-term support at 1845.91 an id on a sell signal.  Should it decline beneath the previous low at 1785.00, it may trigger a Cup with Handle formation that may decimate investors.


Posted in Published | Comments Off on

June 10, 2022

10:14 am

The Ag Index may be finishing a late Master Cycle low on day 272 of its Master Cycle.  It may be obvious that the lower liquidity is having an impact on ag prices as well, but nowhere near the influence that lower liquidity is having on stocks and bonds.  I have been urging investors to consider the Ag Index in the accumulation phase just before the breakout above the Neckline of the proposed Head & Shoulders formation.  The Cycles Model suggests the next Master Cycle high may be in mid-August.

Avocado prices are higher.

Fuel, groceries and power are rising at double digit rates.

Soaring fertilizer prices unleash chaos and starvation worldwide.

Mike Shedlock comments, “Talks between Turkey and Russia aimed at providing safe passage for Ukraine’s harvest ended in failure…

Wheat futures courtesy of Trading Economics

Talks End in Failure

Turkey attempted to mediate safe passage in the Black Sea for Ukraine’s grain harvest, but objected to the Black Sea proposal in a statement on Tuesday before the talks in Turkey.


9:47 am

BKX, our liquidity proxy, has gapped down beneath the Cycle Bottom at 107.81 this morning.  While there is no outstanding news on the bank index, earnings season is about to begin.


8:50 am

Good Morning!

SPX futures have gapped down beneath the Cycle Bottom at 3998.96 and then some.  The next support is the prior Master Cycle low at 3810.32.  The real decline has begun.

Today’s op-ex shows SPX deep in short gamma beneath 4050.00 (10,739 put contracts) with massive puts positioned every 25 points beneath it.  For example, the 4000.00 strike has 13069 open contracts.  The dominoes are lined up and falling.

ZeroHedge reported earlier, “After a furious late-day selloff on Thursday as markets digested the probability of another red hot inflation number, S&P Futures traded in a narrow range on Friday ahead of the crucial May CPI Print which will dictate the path of Federal Reserve policy (it means the difference between a 25bps and 50bps Sept rate hike… or 0bps), and which is expected to come in 8.3% Y/Y and 0.7% M/M for headline and 5.9% Y/Y and 0.5% M/M for core. S&P 500 contracts fluctuated between modest gains and losses, while Nasdaq 100 futures rose about 0.4% as of 7:30 a.m. ET. The dollar rose slightly, although it has been trading largely flat throughout the session. The yield on the 10-year Treasury is unchanged at 3.04%, while the 2-year Treasury yield rose about 3.4 basis points to 2.8455%. Gold and bitcoin fell. Oil rose.”


NDX futures gapped from a slight gain to 12337.00 to a loss beneath its Cycle Bottom at 12061.85 this morning.  Today’s op-ex shows NDX deep into short gamma territory.  Although the contracts are fewer in number, they represent a huge cash short position.

Today’s expiring QQQ (299.40) options are positive over 305.00, but turn massively negative beneath 300.00.  Short gamma is certain beneath 296.00.

ZeroHedge comments, “Well that’s not what the market wanted to see…

The hotter than expected CPI print has sparked turmoil in markets with the Treasury curve inverting once again (now its most inverted in over 2 months)…

Stocks are accelerating their losses from yesterday. almost completely erasing the post-Bostic-Pause short-squeeze ramp…”


VIX futures rose to a high of 27.75 this morning leaping above the 50-day Moving Average at 26.40 and confirming the buy signal.  While the SPX may suffer a panic decline to 2542.00 in the next week-an-a-half,   VIX may not stop rising until the third week of August in Minor Wave 3 of Intermediate-term Wave (3) of Primary Wave [3] of Cycle Wave III.   The massive consolidation we have seen since last December is not indicative of the moves we are about to see in the next 4-6 months.

The NYSE Hi-Lo Index opened at -107.00 and is falling.  It has been aon a sell signal since yesterday morning.


TNX leaped to 31.11 this morning, edging closer to the Cycle Top at 31.34.  TNX is now in its trending strength mode through the weekend.  The Cycles Model suggests a continued rally through early July.


Posted in Published | Comments Off on June 10, 2022

June 9, 2022

3:11 pm

SPX has fallen into short-gamma territory.  Short-term support at 4048.00 may provide a bounce, but it remains on a sell signal beneath 4120.00.  Buckle up for the ride.

The NYSE Hi-Lo Index opened at -11.00 and has declined to -44.00, confirming the sell  signal.


7:50 am

Good Morning!

SPX futures retraced to an overnight high of 4144.40 before losing its momentum.  It is likely that the move was a mechanical reaction to dealers and hedge funds unloading their shorts needed to cover yesterday’s op-ex.  SPX is caught in a trading range from 4075.00 to 4175.00, looking for a way out.  Last Friday’s high remains in a countdown to the week of June 20 in the current Master Cycle.  It is possible that this morning may bring a final resolution, since 4.3 market days from the high will have elapsed near 11:00 am, leaving a probable 8.6 market days to the low.

Options buyers appear to be narrowing the range, with 4110.00 being Max Pain and 1063 call contracts at 4115.00 due to expire today.  However, calls dominate above 4150.00 and long gamma starting at 4175.00.  Puts dominate at 4100.00 and below with short gamma beginning at 4075.00.  Thus, long and short gamma are bracketing the trading range.

ZeroHedge reports, “US index futures turned positive on Thursday, even as European stock slipped ahead of the ECB decision at 745am ET, with Nasdaq 100 contracts outperforming as oil prices and bond yields stabilized and strategists at Goldman and JPMorgan gave more bullish comments on equities. Sentiment was boosted after Bloomberg reported that China’s crackdown on internet companies may be easing with a revival of the Ant Group IPO, which boosted the country’s US-traded stocks (the news was since refuted by China, but moments later Reuters re-reported what Bloomberg said). S&P 500 futures traded 22 points or 0.5% higher, and Nasdaq 100 futs were 0.4% higher. The dollar slid, and 10Y rates were flat at 3.02%.

Markets remain fixated on the risk that central banks intent on cooling inflation snuff out economic recoveries in the process. Money markets have priced in 36.5 basis points of tightening to the ECB’s rate by next month’s meeting, just short of a 50% chance of a half-a-percentage point increase, which would be the first since 2000.”


VIX futures dipped to an overnight low of 23.82, then began a recovery into positive territory.  Yesterday’s low at 23.74 occurred on day 261 of the Master Cycle.  It is overdue for a reversal.

Next Wednesday’s op-ex is massively covered with puts ranging up to 27.00.  Calls dominate at 28.00 and higher.  This is a market due to catch the vast majority of investors wrong-sided.  No one seems to be buying protection, except yours truly.

The NYSE Hi-Lo Index made a high of 115.00, but closed at 40.00.

ZeroHedge observes, “Following The ECB’s statement, traders have moved rate-hike expectations up to around 150bps by December 2022…

All eyes will now be on what Lagarde says at the press conference as she tries to thread a needle of a fragmenting European bond market, ending bond-buying, and hiking rates into her own stagflationary forecast (lower growth and higher inflation). As Bloomberg Economics’ Geoff King points out:

“The most closely scrutinized part of the press conference will be any comments made by Lagarde on the likelihood of a 50 bp interest rate increase instead of a 25 bp move. She has published a roadmap for her preferred course of action and it’s consistent with 25 bp increases in July and September. We don’t expect her message to differ, but she’s changed tack before after inflation surpassed expectations.”


TNX is rising this morning, approaching the Cycle Top resistance at 31.18.  However, it may be due for a pullback to the 50-day Moving Average at 28.14 or possibly lower.  It is yet unclear how much influence an equities sell-off will have on rates.  The current Master Cycle ends in 30 days and may target mid-Cycle support.

Yesterday, ZeroHedge reported, “Heading into today’s 10Y auction, one day after yesterday’s mediocre, tailing 3Y and with yields moving back higher after yesterday’s slump, JPMorgan’s rates strategists said that they expected the $33bn auction to be digest smoothly, “given the sector looks rich, has seen a strong move higher in yield, and that the auction size is smaller in size.” They were right, more or less.

Pricing at a high yield of 3.03%, today’s 9-Year, 11-Month repoening of CUSIP EP2 priced at a high yield of 3.030%, rising by 9bps from last month’s 2.943%, the highest since Nov 2018, and tailing the When Issued 3.018 by 1.2bps. The tail, which was somewhat unexpected since there was a generous concession into today’s auction, was the 4th consecutive tail for the 10Y which has seen just one stop through in the past 8 auctions (in Feb 2022).”


USD futures have declined to a morning low of 102.15.  There is about a week left to end the current Master Cycle.  There may be a retest of the Cycle Top resistance at 103.69.


Posted in Published | Comments Off on June 9, 2022

June 8, 2022

1:20 pm

SPX is challenging the Lip at 4120.00 after what appears to be a “failed” Wave [v] of Wave C.  Dealers don’t want to let go of their grip prior to op-ex, but I suspect their hold on the market is slipping.  Sell beneath 4120.00 if you haven’t already done so.

ZeroHedge observes, “Confirming what we reported two days,  SEC Chair Gary Gensler said he has asked agency staff to consider requiring brokerages to route individual investors’ orders to buy or sell stocks into auctions, as part of an effort to increase competition in the market. These proposed (and unprecedented) changes to market structure would make it virtually impossible to frontrun retail orders.

Right now, there isn’t a level playing field among different parts of the market: wholesalers, dark pools, and lit exchanges,” Gensler said in remarks prepared for an event hosted by Piper Sandler.


11:14 am

SPX has completed a second, smaller Triangle formation visible on the hourly or 10-minute charts.  Triangles “buy time” to stall the inevitable final move within a series or formation.  After a bit of fine tuning, the final target may be 4194.00.  Be prepared to go short, if not already positioned.  This rally must be sold.


8:20 am

Good Morning!

SPX futures retreated this morning, but remain well above the Lip of the Cup with Handle at 4120.00.  The Triangle formation is playing out, indicating a final probe in Intermediate Wave (2) before the reversal.  Wave relationships suggest a possible high near 4190.00.  Today is day 248 in the Master Cycle. possibly leaving 8.6 more market days to the low  on day 260.  The Lip is the tripwire for this formation.

We have continually been teased by the grip of options expiration and the dealers’ machinations to avoid more than the minimum payout ()Max Pain for investors).  Today’s op-ex shows Max Pain at 4130.00.  Calls are favored above 4140.00 and long gamma lies at 4200.00.  Puts are favored beneath 4110.00 with short gamma starting at 4100.00.  Today may be a very volatile day in equities.

ZeroHedge reports, “After yesterday’s bizarro rally, US futures and European bourses dipped ending two days of gains, as yields reversed Tuesday’s slide and climbed ahead of highly anticipated CPI data on Friday and a hawkish ECB meeting tomorrow, as traders try to predict the Federal Reserve’s policy path. Nasdaq 100 futures were flat at 7:30 a.m. in New York, with contracts on the S&P 500 and Dow Jones also modestly lower. European markets also dipped, with Credit Suisse shares tumbling after the Swiss bank announced that it expects a loss in the 2Q and is weighing a fresh round of job cuts. Meanwhile, Asian stocks rose as Beijing’s move to approve a slew of new video games bolstered bets that the outlook is improving for the Chinese technology sector. The yield on the 10-year US Treasury resumed its advance, climbing to 3%, while the dollar rose as the yen cratered to fresh 20 year lows, flat and bitcoin traded around $30K again.”


VIX futures are modestly higher, inferring that yesterday’s move may have put in the Master Cycle low at 23.88 on day 260.  In today’s op-ex, puts are favored at 24.00 and below while clls are favored at 25.00 and above.  Long gamma lurks at 30.00.  Short gamma is not discernible.

The NYSE Hi-Lo Index topped out at 110.00at mid-day yesterday, but closed at 32.00.  I’m looking for a reading below zero for a sell signal.

ZeroHedge (TME) observes, “The new JPY crash

JPY continues moving like a small cap stock, despite being the world’s third most traded currency. These moves are serious. Note that JPY 1 month vols have started to move rather violently again. Big currencies aren’t supposed to move like this, unless…

Source: Refinitiv

Will sleepy VIX start to move (again)?

The latest surge in JPY volatility matters. Last time it spilled over with a time lag. Let’s see if VIX decides to focus on stuff beyond the SPX moves. The gap between JPY 1 month vol and VIX is rather wide again.


TNX spiked to 30.40, matching yesterday’s high but not exceeding the Cycle Top resistance at 31.02.  Trending strength returns early next week.  Should TNX not break out this week, it is likely to do so next week.

Yesterday ZeroHedge reported, “Unlike last month’s stellar 3Y auction, today’s sale of $44 billion in 3 year paper, the first auction of the QT era (if not really because the first actual TSY maturity does not take place until June 15), was mediocre at best.

Starting at the top, the high yield of 2.927% was above May’s 2.809% by 12bps, the highest since Nov 2018 and also tailed the When Issued 2.917% by 0.1 basis point, the first tail since march, and only the second tail for a 3Y auction of 2022.

The bid to cover of 2.453 was well below last month’s 2.595 but in line with the six-auction average of 2.470%.”


USD is still consolidating, with a potential Master Cycle low by mid-June.  The next move in the Broadening Wedge formation is a decline to the lower trendline/mid-Cycle support at 97.32.


Posted in Published | Comments Off on June 8, 2022

2:22 pm

VIX made a new Master Cycle low today on day 260 of its Master Cycle.   It may not be finished with its decline, as the mid-Cycle support at 23.29 may be the target.  This reinforces the observation that equities may be going higher.  It is likely that this decline in VIX and rally in equities may end with tomorrow’s options expiration.  It still leaves 8.6 days to finish the Master Cycle in equities.  The actual crash beneath the Lip of the Cup with Handle formation in 1987 occurred in 4.3 days.

The NYSE Hi-Lo Index is at 92.00.  Not a new high, but high enough for another probe higher.


10:53 am

An alternate scenario may be playing out…

SPX may have completed a Triangle formation that could target the 50-day Moving Average at 4255.94 or the 2-hour Cycle Top at 4296.41.  This does not alter the Cup with Handle formation, but may delay the decline a few days.  No one said this would be easy.  This formation has all the earmarks of the options sellers dilemma of keeping the range “corralled” between long gamma at 4175.00 and short gamma at 4050.00.  Short gamma is what they fear the most, thus the bounce at mid-Cycle support at 4076.34.  Investors fear a decline, as well.

ZeroHedge observes, “Investors are terrified. Such is what you would assume from recent mainstream media headlines and CNBC’s continuous run of “Markets In Turmoil.” There are also plenty of indicators suggesting that retail investors are terrified about financial markets. For example, the net percentage of bullish responses from the American Association of Individual Investors (AAII) and the Institutional Investors index (INVI) are near previous bear market lows. Such is despite the sharp rally over the last two weeks.

Despite hopes for a rally, the National Association of Investment Managers (NAAIM) shows the same bearishness.”


8:00 am

Good Morning!

NDX futures have declined to 12442.10 this morning and are hovering near their low.  The peak in the retracement was made near the Lip of the Cup with Handle at 13000.00 and the cash market had declined beneath Intermediate term support at 12695.10, putting it on a confirmed sell signal.  Most analysts lack the technical skills to recognize the plight of the market.

While there is not an options expiration today, tomorrow’s op-ex shows puts dominate beneath 12550.00 and short gamma resided beneath 12500.00.  In other words, NDX may already be in a gamma death spiral.


After having closed above the Lip of the Cup with Handle formation yesterday, SPX futures declined beneath the Lip and 4100.00, confirming the sell signal.  The Cycles Model suggests a significant bottom only two weeks away.  The Cup with Handle formation has been triggered and it is likely that the target may be met.  Some analysts have “recognized” a Head & Shoulders formation and are predicting a bottom at 3400.00.

In today’s op-ex, SPX futures are positive above 4110.00, but long gamma doesn’t kick in until 4175.00.  On the other hand, puts dominate beneath 4090.00 and short gamma starts at 4050.00.

ZeroHedge reports, “It was a relatively quiet session for stocks with futures trading modestly lower overnight as yields eased their Monday surge and when the biggest news was Australia’s unexpected 50bps rate hike (double consensus) before all hell broke loose at 7am, when Target cut guidance for the second time in two weeks due to the infamous bullwhip effect we had warned about just a few weeks ago, sending TGT stock crashing more than 9% and encouraging the cold risk-off wind that pushed S&P futures 0.8% lower to session lows around 4,080…

… while Nasdaq 100 futures fell 1% as Treasury yields hovered around 3.05%, their highest in nearly a month. Europe’s Stoxx Europe 600 Index slipped as telecom and technology stocks weighed.”


VIX futures have leaped above the 50-day Moving Average at 26.11 and may continue higher after a brief consolidation.  It is now on a buy signal that may carry it above the neckline of the Head & Shoulders formation.  The Cycles Model suggests a Master Cycle High in mid-August, suggesting the June low anticipated in equities may not be the final one.


TNX tested its Cycle Top yesterday at 30.88 and may be consolidating this morning.  It is on a buy signal (UST sell) and the Cycles Model suggests a continued rally through the first week of July.  An alternate view suggests that, should the breakout not occur, the 10-year yield may decline in that same period.


USD futures have bounced above Intermediate term resistance at 102.71, suggesting a possible further rally to Cycle Top resistance at 103.57 in the next week.  This appears that it may end in a Master Cycle high.


Posted in Published | Comments Off on

June 6, 2022

7:45 am

Good Morning!

NDX futures are retesting Intermediate-term resistance at 12732.89 after reaching for the Lip of the Cup with Handle formation on Friday.  Friday’s reversal from the Lip may be the triggering event for the new decline over the next two weeks.  It has the same expectation as the SPX, with an anticipated 38.2% decline from the Lip.  It may go deeper.

In today’s expiring options, Max Pain is at 12560.00 and calls dominate starting at 12600.00.  Puts dominate beneath 12350.00 and short gamma starts at 12250.00.  Should NDX not bounce at the Cycle Bottom at 12192.40, the race for the target is on.

ZeroHedge comments, “Yesterday we shared the bullish view from Goldman’s trading desk courtesy of flow trader, Scott Rubner. Today, we take a look at the other side of the trade by way of Tony Pasquariello, Goldman’s head of hedge fund sales, who has been turning increasingly more bearish over the past three months. We excerpt the below from Tony’s latest note available to professional subs in the usual place.”


SPX futures are looking positive this morning, challenging Intermediate-term support/resistance at 4126.11.  Traders may go short with confidence beneath that level, and especially beneath the Lip of the Cup with Handle at 4120.00 which is the triggering event for the Cup with Handle formation.

Today’s expiring options show Max Pain at 4110.00.  Options favor calls at 4150.00, while puts dominate beneath 4075.00 with short gamma lurking at 4000.00.

ZeroHedge reports, “Global markets and US equity futures pushed sharply higher to start the new week (at least until some Fed speakers opens their mouth and threatens a 100bps emergency rate hike) as Beijing’s latest move to ease Covid restrictions injected a note of optimism into markets rattled by inflation and rate-hike concerns. Nasdaq 100 futures climbed 1.4% at 7:15 a.m. in New York after the underlying index erased more than $400 billion in market value on Friday amid renewed concerns about tightening monetary policy, as Beijing rolled back Covid-19 restrictions, boosting global risk appetite after reporting zero local covid cases on Monday while also finding no community cases for three straight days…

… while a Wall Street Journal report that China is preparing to conclude its probe on Didi Global boosted sentiment further, with Didi shares surging 50% and sending the Hang Seng Tech index soaring. S&P 500 futures also climbed, rising about 1% and trading near session highs. Treasuries and the dollar slipped.”


VIX futures reached a weekend high of 25.42, still short of the 50-day Moving Average at 26.04.  The 50-day is the go-ahead for VIX longs.  While the SPX shows a possible “crash low” in two weeks, the VIX does not show its next Master Cycle high until mid-August.  That agrees with the thesis that equities are caught in a complex decline that may not end until the Fall.  The Cycles Model shows the VIX may not peak in Intermediate Wave (5) of Primary Wave [3] until mid-October.


The NYSE Hi-Lo Index has been hovering above its “zero” trigger since making its Master Cycle high on May 31.  I may be monitoring it to see when it declines into negative territory.


TNX is rising, but not yet above Friday’s high.  A breakout above the Cycle Top resistance at 30.72 will confirm the rally.  The next proposed Master Cycle high may be anticipated in mid-July.

ZeroHedge comments, “Since central bankers are enacting monetary policy by acting like market participants, let’s analyze them like investors,” said Lindsay Politi, PM for One River’s inflation-strategy.

“Central banks are the biggest whale in financial market history. And we’ve all seen what happens when a whale needs to exit. The catalyst is always an unaccounted risk, a surprise event, or an incorrect assumption,” said Lindsay. “Whether it’s a margin call that can’t be met, a risk officer shutting it down, or client redemptions; there’s a point where every ordinary investor is forced to liquidate.”

If the position is big enough, a bubble bursts, and risks shift from being idiosyncratic to systemic.”


USD futures are fading after a brief consolidation inside Friday’s trading range.  USD has about two weeks of further decline into the next Master Cycle low.  The most likely target is the bottom trendline of the Broadening Wedge.


Posted in Published | Comments Off on June 6, 2022

June 5, 2022 Special Report

8:30 pm

While other analysts are trying to “map out” the decline based on prior crashes, each one is different.  What I am attempting to do is compare the magnitude of bearish formations, primarily the Cup with Handle.  There are still some noteworthy differences and the final outcome may not be the same.

First, the differences:

  1.  The 1987 crash was an A-B-C/ Wave (4) formation which quickly ended after the crash.  Today’s decline is part of a complex, multi-staged impulse of 5 waves.  The Intermediate Wave (3) we are about to see today is is the same degree as the Intermediate Wave (4) of the 1987 crash.  In other words, we are only comparing a singular move within the larger Cycle, not the entire anticipated decline.
  2. Which leads me to the next point.  The current decline may be a Cycle Wave I of a Super Cycle Wave (c) of a Grand Super Cycle Wave [IV].  For comparison purposes, the entire decline from September 3, 1929 to July 10, 1932 was a Grand Super Cycle Wave [II] with a 90% total loss in the DJIA.  Grand Super Cycle Wave [IV] began on March 23, 2000.  Thanks to the Fed intervention in 2009, the SPX enjoyed a 16.4% annual compound return in Super Cycle Wave (b).   However, the compound return since March 23, 2000 to January 3, 2022 is a sub-par 5.3%.


Now for the similarities:

  1. The 1987 crash [Wave(C)] lasted from October 3 to October 20, 1987.  A 17.2 calendar- day, 12.9 market-day decline.  Today’s decline shows an identical potential with the decline possibly ending June 21 from last Friday’s high.
  2. The Cup with Handle formation in 1987 projected at 38.2% decline.  The same formation in 2022 also projects a 38.2% decline.  And its likely to do so in the same amount of time.
  3. Both the 1987 crash and the projected decline may go through a very heavy op-ex.  See the article below.  Should the SPX decline  beneath 4000.00 before options expiration, all bets are off.
  4. The target is only an estimate.  The decline may go lower or not as low as projected.

In summary, the coming decline is not the end of the bear market, as many believe.  It is a multi-staged event that may last to mid-October or mid-November.  That will only end Cycle Wave I of a 5-Wave Cycle.  I have speculated earlier that the decline may last a total of 2.58 years.  That may be early August, 2024.  An alternate date for an end to the decline may be in January 2026.  The Chart below visualizes the outcome.

ZeroHedge informs us, “A feud is erupting within the Goldman trading floor, where a group of traders led by the bank’s head of hedge fund sales, Tony Pasquariello, are turning more bearish by the day and appear to be set on a ideological convergence crash course with BofA’s Michael Hartnett (of “The Market’s Summer From Hell Begins, And Just One Thing Can Stop It” fame), while what’s left of the bulls finds solace in the weekly musings from flow trader Scott Rubner, who did not disappoint (his fan group) and as he writes in his first June Tactical Flow of Funds note (which is a must read for all bulls, and is accessible to professional subs in the usual place), he is extending his “tactical, unloved, equity rally call for another few weeks into June.” Rubner notes that “the number #1 question to hit my inbox this week: Could we rally through the end of the quarter?, a view which he explains “is not consensus”, and which he answers with a decisive yes, adding that “this is the best market technical set up for a rally that we have seen in 2022, and the buyers come out higher. Outflows just flipped to inflows”, but perhaps more importantly, in less than two weeks the market faces a gargantuan op-ex where over $3.2 trillion (near an all time high) in options expire, and which will spark a historic “gamma unclenching”, which if tactically coupled with a surge in buybacks and a short squeeze, could see this market explode higher into the third fourth of the month.”

Posted in Published | Comments Off on June 5, 2022 Special Report

June 3, 2022

11:41 am

NDX gapped through mid-Cycle support at 12752.97 and retested it on the bounce.  It is on a sell signal with a probable decline to the week of June 20, per the Cycles Model.


10:55 am

SPX has crossed beneath the Lip of the Cup with Handle formation, setting off a sell signal.  It has bounced back to retest the line at 4120.00, but is unlikely to go back above it.  Confirmation may occur beneath the mid-Cycle line at 4088.70.

ZeroHedge offers an explanation, “After ramping for days despite all the ‘bad’ news from US macro data, today’s ‘good’ news from the BLS (with payrolls printing better than expected) has prompted a deeper sell-off in stocks…

It appears that the Fed Hawks have regained the narrative this week, and rightfully so. As Nomura’s Charlie McElligott the Bostic “September Pause” meme last week was a “low Delta” fiction which required multiple Fed-speakers (and Bostic later himself) to forcibly “clean-up” as it created a counter-productive impulse “easing” of financial conditions.”


7:00 am

Good Morning!

I am jotting a few things this morning before an 8:00 am appointment.  I may be returning after the open.

SPX futures declined to a morning low of 4152.50 and is lingering near that low.  This morning’s Employment Situation Summary may be pivotal to a probable reversal.

In today’s expiring options, Max Pain is at 4170.00.  Calls dominate at 4180.00 and above, while puts dominate beneath 4130.00.  Short gamma begins at 4100.00.  The question is, how much control do the dealers have in the event of a bad jobs report?

ZeroHedge observes, “When will the bear market end? That is the question to which everyone wants an answer. While there is no specific answer to that question, there are indicators and technical measures that provide some guidance. From the portfolio management perspective, those are the parameters we must operate from to minimize capital destruction and limit emotionally driven mistakes.

2022 has been a year unlike many investors have seen in their investing lifetimes. While there are some that went through the 2008 bear market, there are fewer still who lived through the “Dot.com” crash. Such is the nature of “real” bear markets that tend to destroy investors and drive them from investing in the financial markets permanently.

While there are many “buy and hold” practitioners suggesting investors just dollar-cost-average their way through a downturn, reality tends to be far different. When markets decline enough, there is a point where every investor changes from “Buy The F***ing Dip” to “Get Me F***ing Out.”


VIX futures are higher after making a probable Master Cycle low yesterday on day 255.  You may notice that the Uptrend remains intact and the correction appears complete.


The NYSE Hi-Lo Index made a small corrective move higher, closing above 0.00 at the end of the day.  However, it is very close to triggering a meaningful downdraft beneath zero after making its Master Cycle high on Tuesday.  The decline in the highs since November is striking.


TNX futures are flat thus far, but the Cycles Model call for a day of trending strength.  A breakout above the Cycle Top at 30.42 may not be out of the question.

ZeroHedge comments, “After Thursday’s ADP employment data, expectations from today’s non-farm payrolls print are somewhat muted. However, unless we get a shockingly low number, Treasury traders may look through it.

The median forecast for jobs expansion in May is 320k, a much slower pace of expansion than the 428k we got for April. However, the scatter of expectations is considerable, ranging from 250k to 450k. If the actual print comes in around the upper end of the forecasts, it would be hard to make a case for an emphatic selloff in rates. The markets are already pricing in almost 200 basis points of increases from the Fed in the remainder of the year. Given that the monetary authority has promised to go at 50-basis point increments both this month and next, we are essentially talking about another 100 basis points from the three subsequent meetings, meaning there is already another 50-basis point move lurking in the calculations. So it would be a really unrealistic ask to go beyond that for now.

If the number is shocking low, say, about four standard deviations away from the mean (giving us a print below 150k), we may get a big rally in rates, for the markets would start worrying about whether the economy can hold its poise amid the Fed’s hiking cycle. However tenuous the correlations are between ADP and NFP, yesterday’s lower-than-forecast print on the former should have already made traders scale down their expectations somewhat.


Posted in Published | Comments Off on June 3, 2022