July 20, 2022

8:00 am

Good Morning!

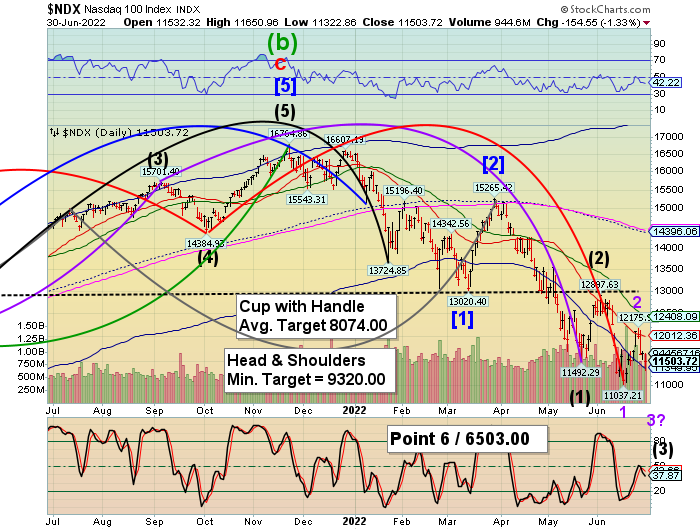
NDX futures rose to 12329.00 this morning before reversing back beneath the upper Rising Wedge trendline at 12250.00.  Yesterday’s action is viewed as a “breakout” by many, when in fact it is a throw-over leading to a reversal.  What is interesting is that yesterday was the end of a Trading (60-calendar day) Cycle beginning May 20 and a 30-market day Cycle from the June 2 high.  Order out of chaos.

In today’s op-ex, Max Pain is at 12090.00,, leaving room for a large decline.  Calls are favored at 12100.00, but not heavily populated.  QQQ ( close: 298.30) op-ex favors calls above 295.00 with long gamma starting at 300.00.  Short gamma starts at 285.00.

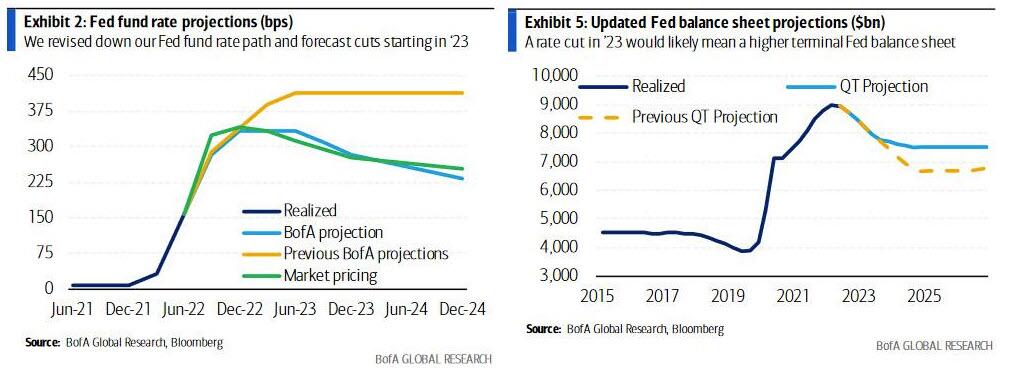
ZeroHedge comments, “The Fed is hiking blindly into an economic downturn, putting pressure on risk assets unnecessarily.

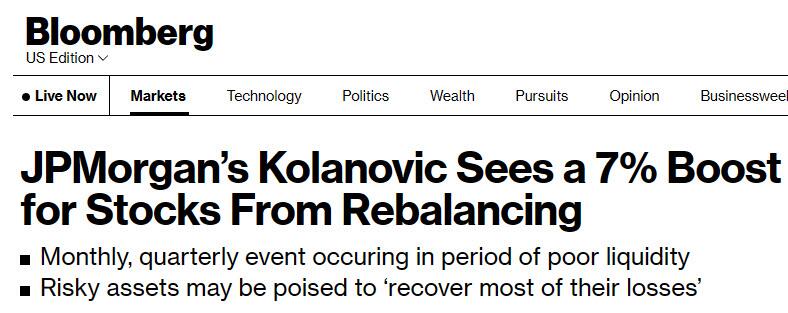
The good news, with cash levels at the highest since 9/11 and equity allocation the lowest since the Lehman collapse, if the Fed stops sooner than many think, the second half of 2022 risk rally will be enormous (ZH: and they will: according to Michael Hartnett, the Fed will pivot in November, while Marc Cabana says QT will end well ahead of schedule).”


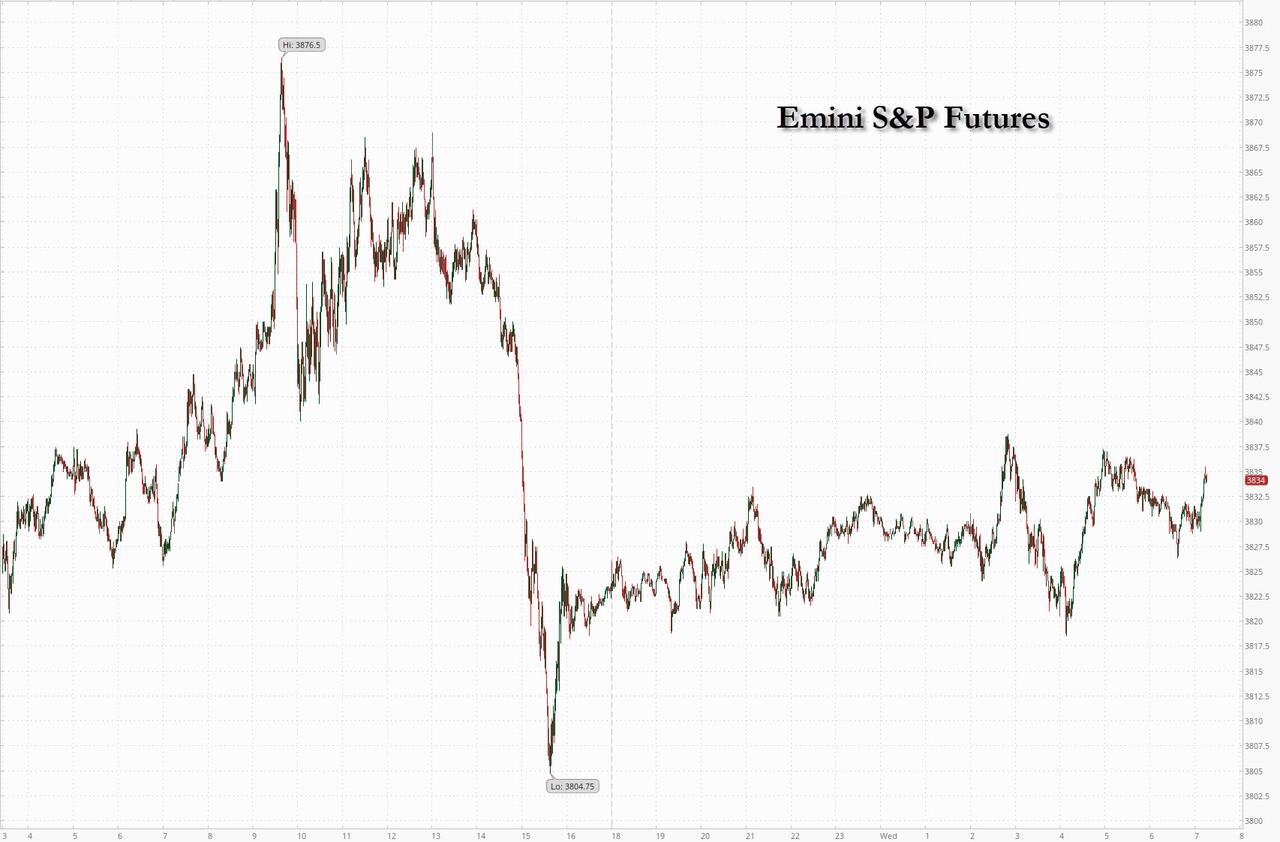
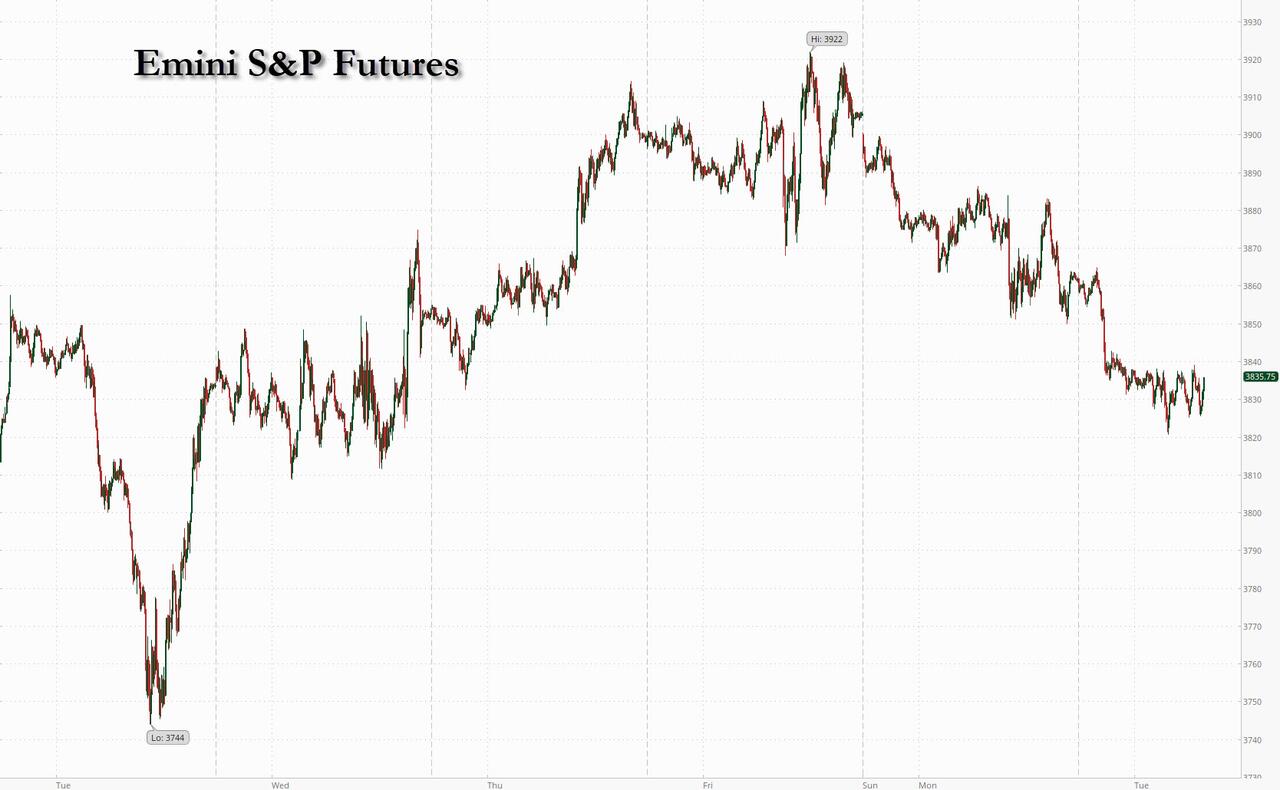
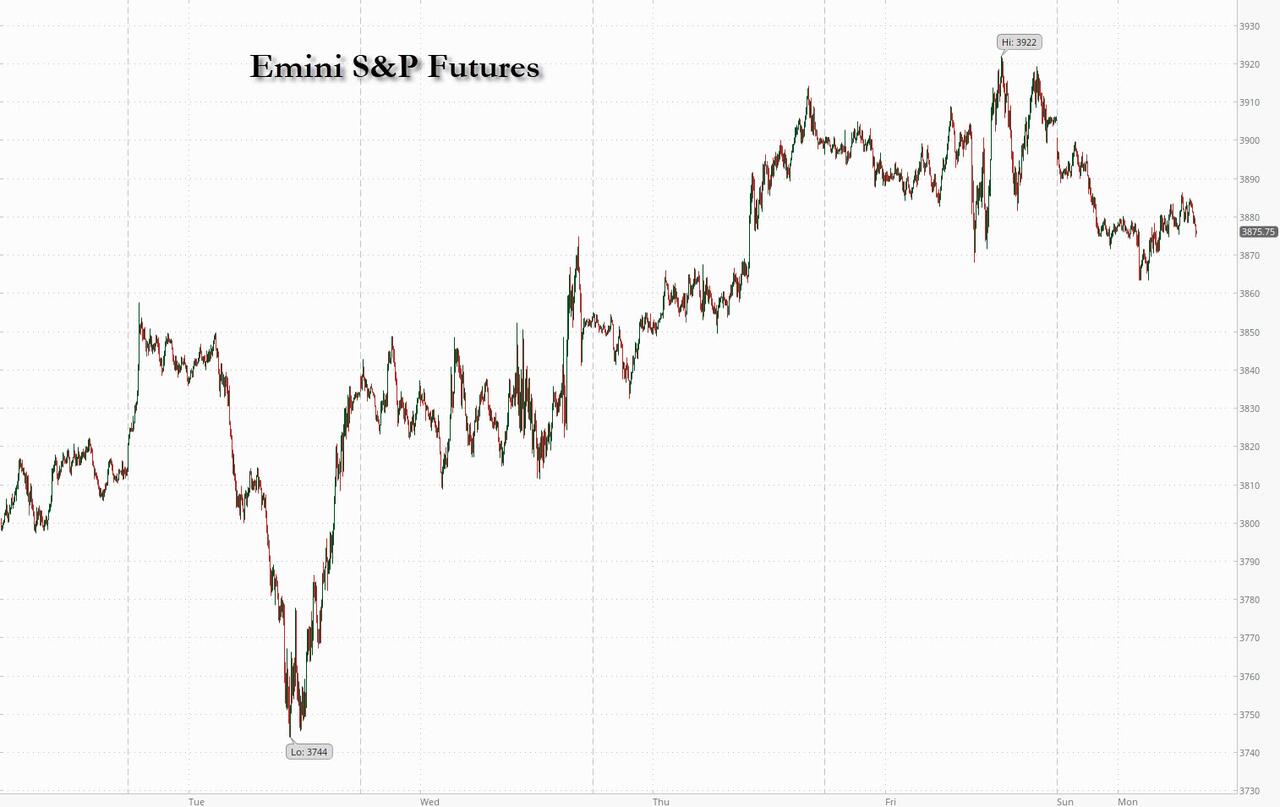
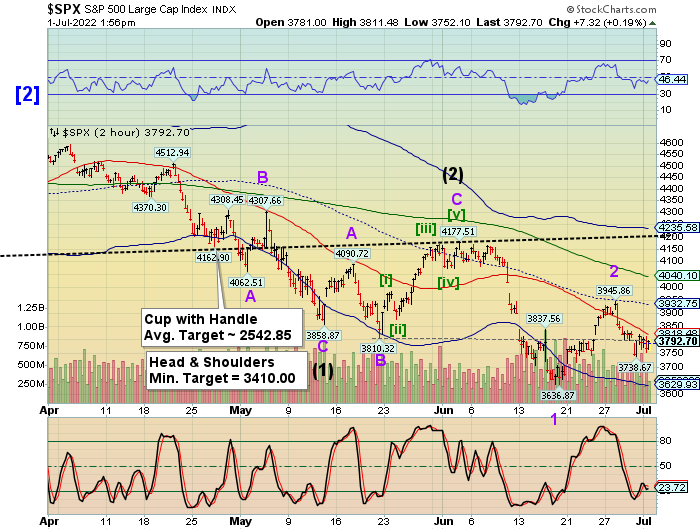
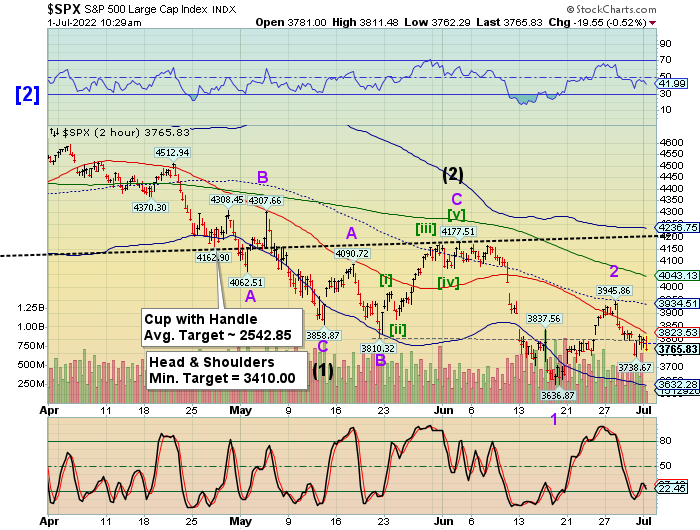
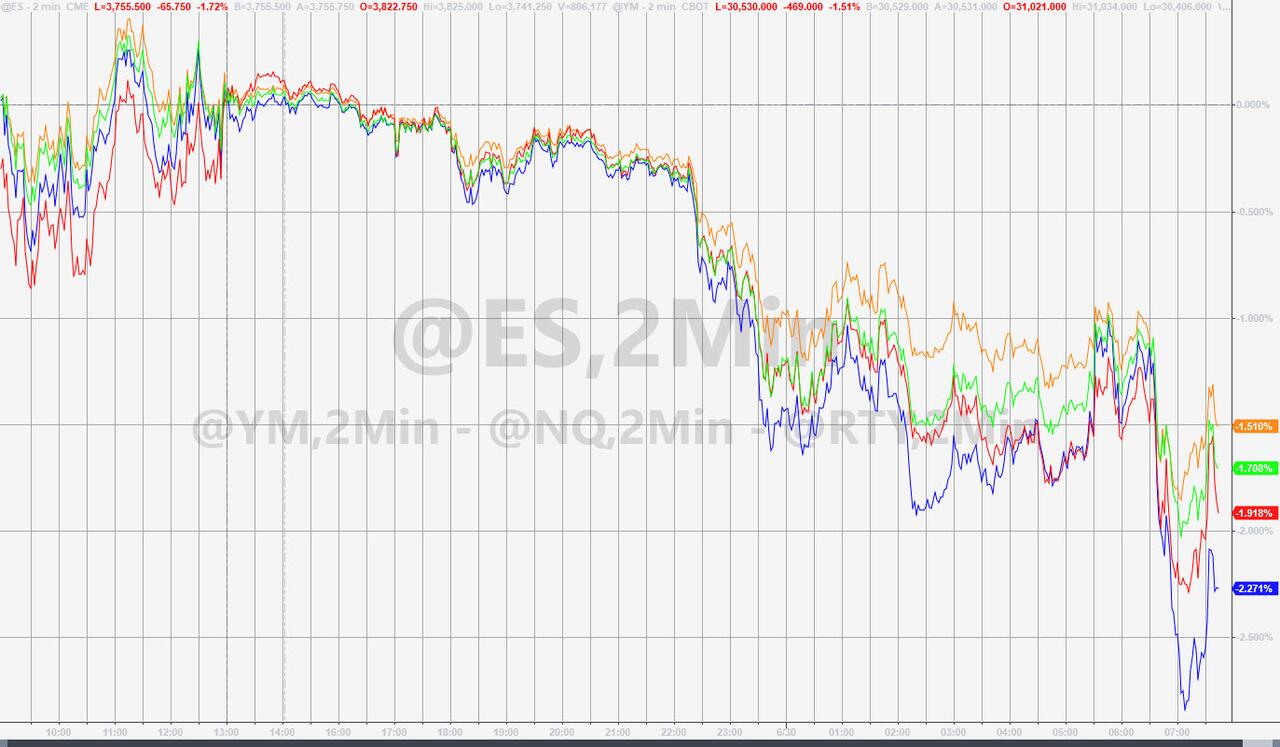
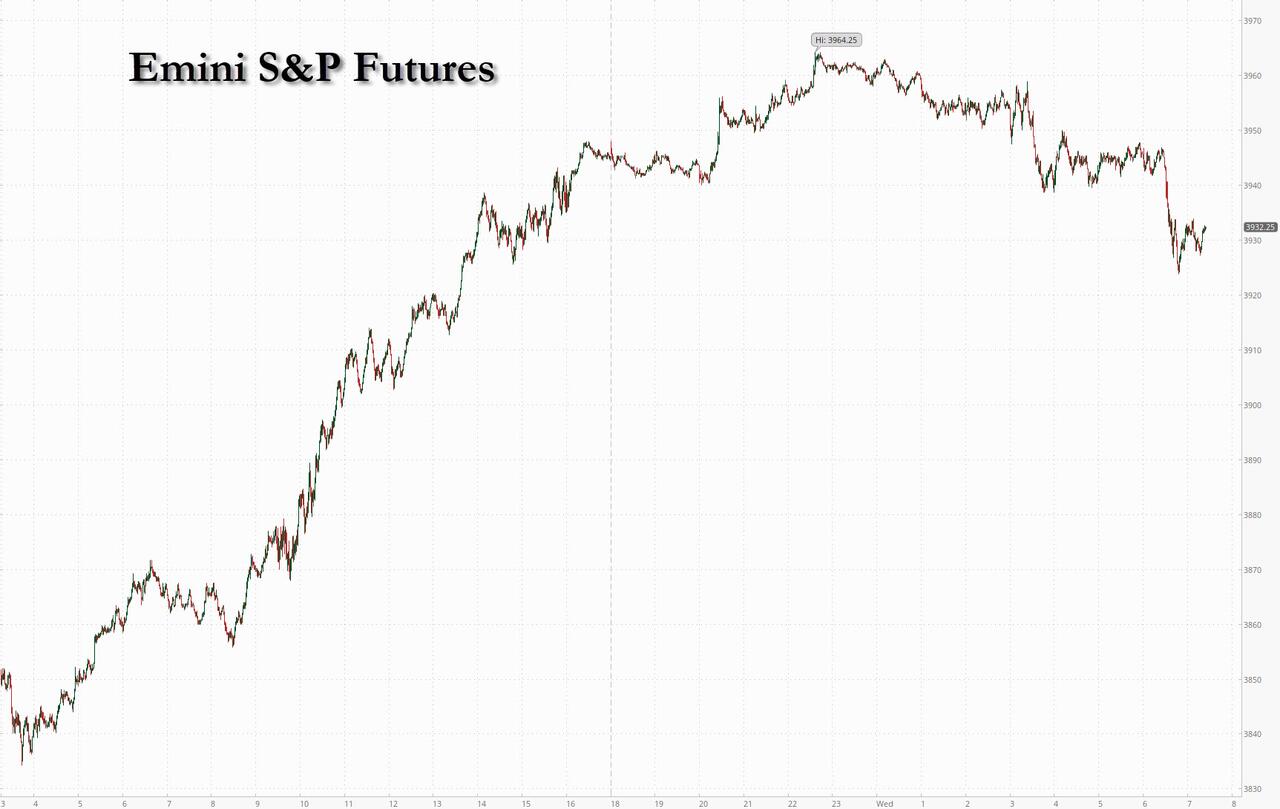
SPX futures rose to 3961.10 in the overnight session, but has since reversed back beneath the 50-day Moving Average at 3935.00.  The Triangle is complete and the new decline is in play.  There is some tension between a 12.9-day or a 17.2-day decline straight ahead.  Since Wave A was 16 days in length, the latter length is favored.

In today’s op-ex Max Pain is at 3895.00.  Long gamma begins at 3950.00, gaining intensity above 4000.00.  There is no short gamma level that is discernible.  An interesting time for a decline.

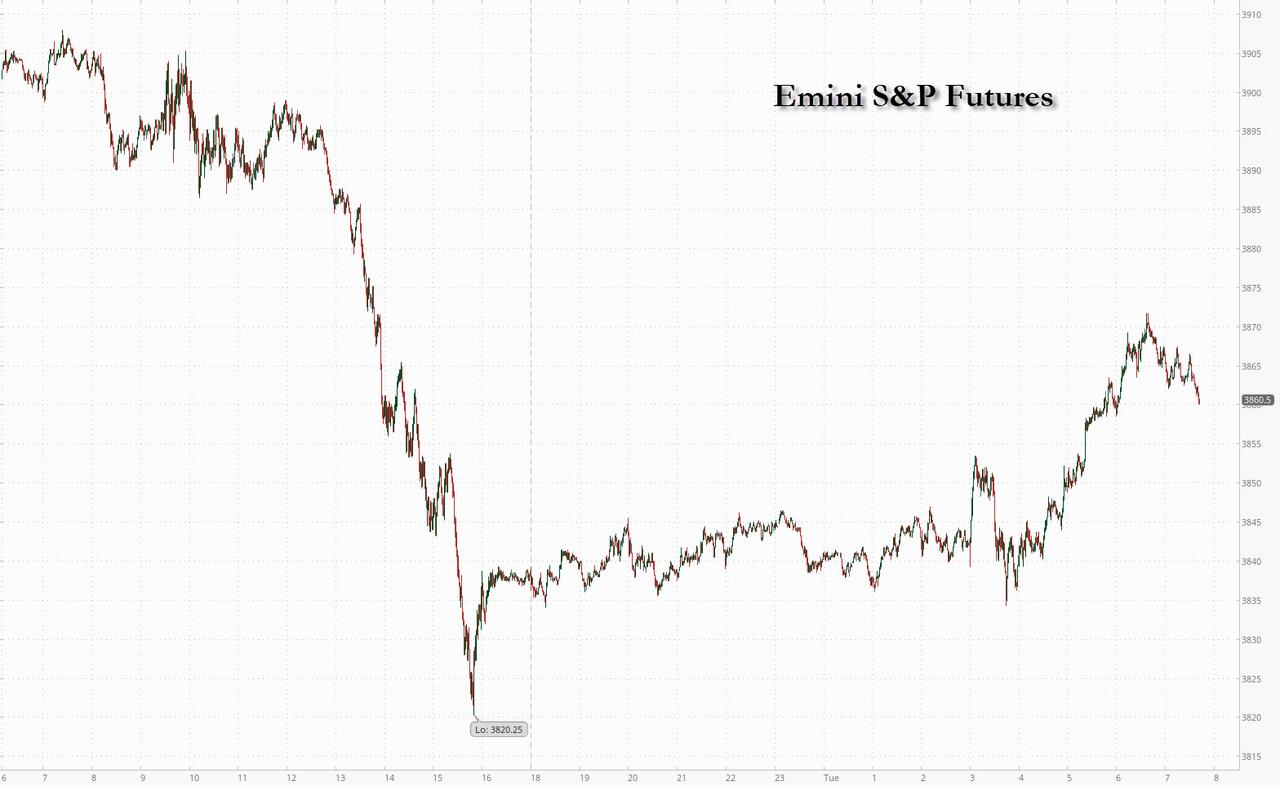
ZeroHedge reports, “What was a solid overnight rally which pushed global markets higher and US index futures as high as 3,964 after a beat in Netflix subs helped further ease market jitters, fizzled and then reversed around 6:30am ET, when the European Union officially proposed that the bloc cut its natural gas consumption by 15% over the next eight months to ensure that any full Russian cutoff of natural gas supplies won’t disrupt industries over the winterwith Commission president Ursula von der Leyen going so far as suggesting the EU would be able to enforce a slowdown in gas consumption.

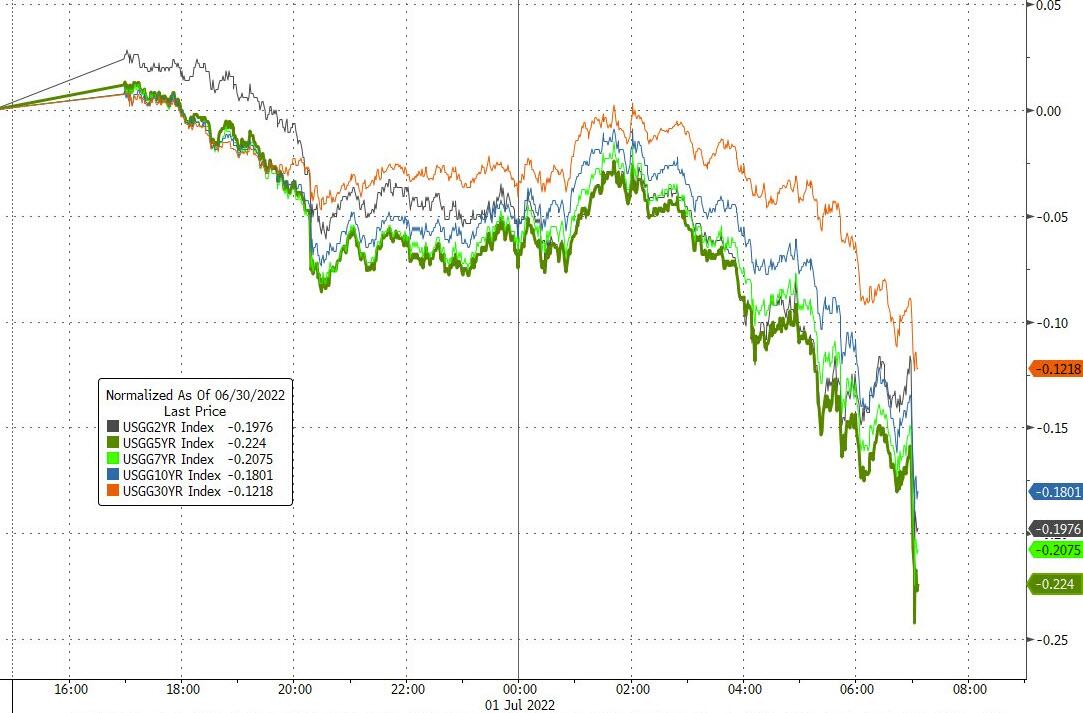
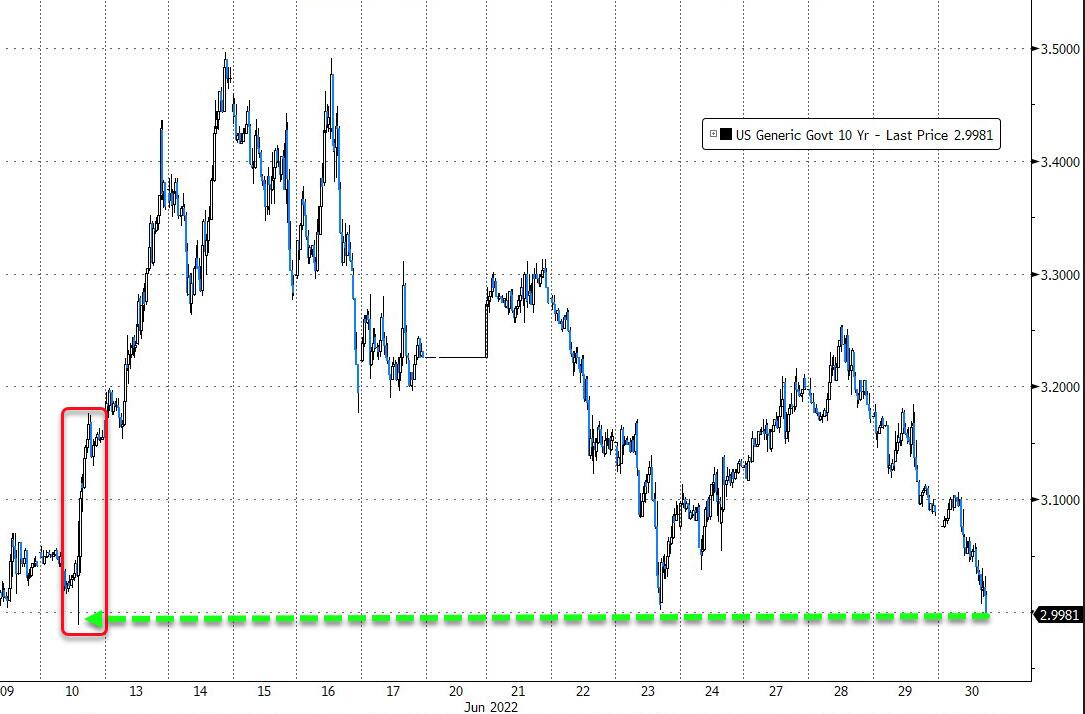
The move which saw spoos slide more than 20 points from 3,947 to below 3,925 before rebounding, and sparked a reversal in haven assets, as Treasuries rose with 10Y yields dropping back under 3.0%, and the dollar index stabilizing after three days of declines…


VIX futures dropped to 24.15 before bouncing back into the green on day 259 of the old Master Cycle.  The threat of a marginal new low is diminishing, although VIX may be sold here to reinvigorate the SPX rally. Today’s op-ex in VIX may be active.  Max Pain is 28.00.  Puts dominate beneath 26.00 with short gamma at 25.00  Long gamma begins at 30.00.


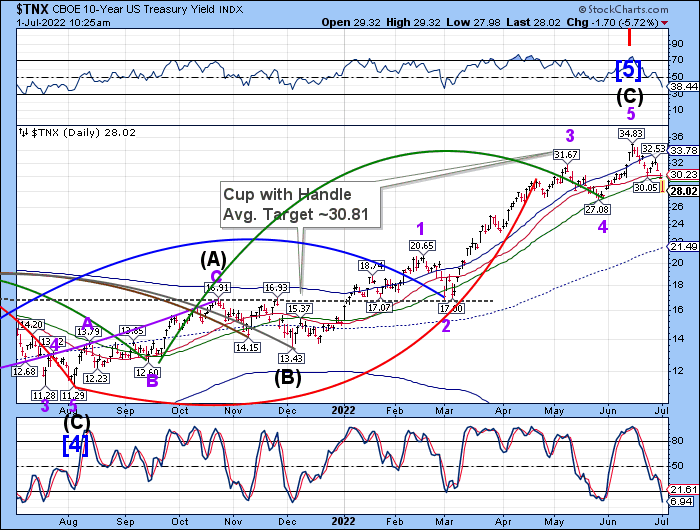
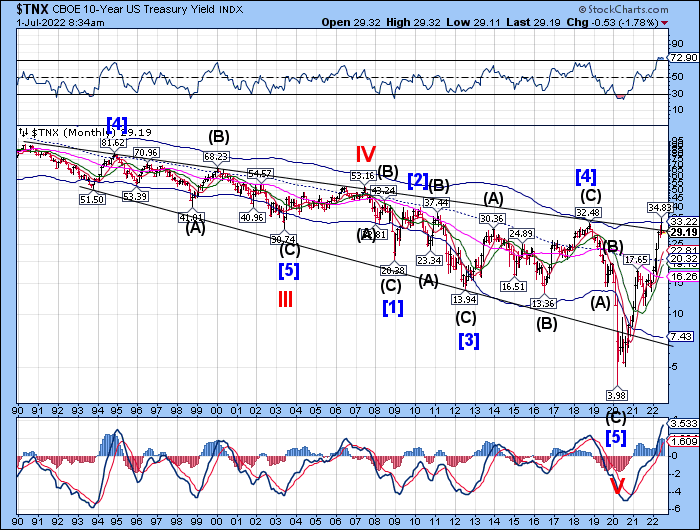
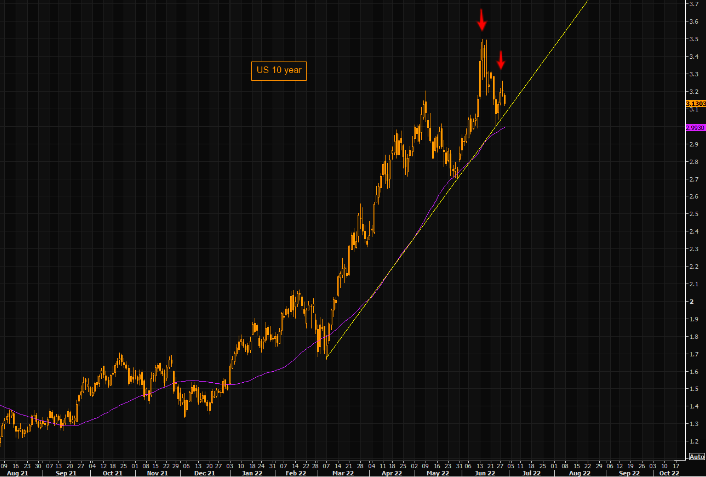
TNX slipped back beneath the 50-day Moving Average at30.06 this morning.  Less than a week remains to complete the rally to the Cycle Top at 34.93.   A rally of that magnitude in such a short period of time may be a real shock to the equities markets.

ZeroHedge comments, “Appearances can be deceptive. Especially those that seem self-evident at first sight.

On the face of it, it would seem that Treasuries around current levels offer investors a good deal. After all, for the better part of the past decade, such seemingly high yields have been elusive. However, at current levels, long-dated maturities show circumspection, but also reflect optimism about the Fed at the same time.

Obviously the current nominal yield of around 3% on 10-year Treasuries would only make sense if an investor believed that — if they held the bond until it becomes due — they would come out ahead if, on average, inflation is well less than the yield to maturity. What becomes of an investor who is buying 10-year Treasuries now?”


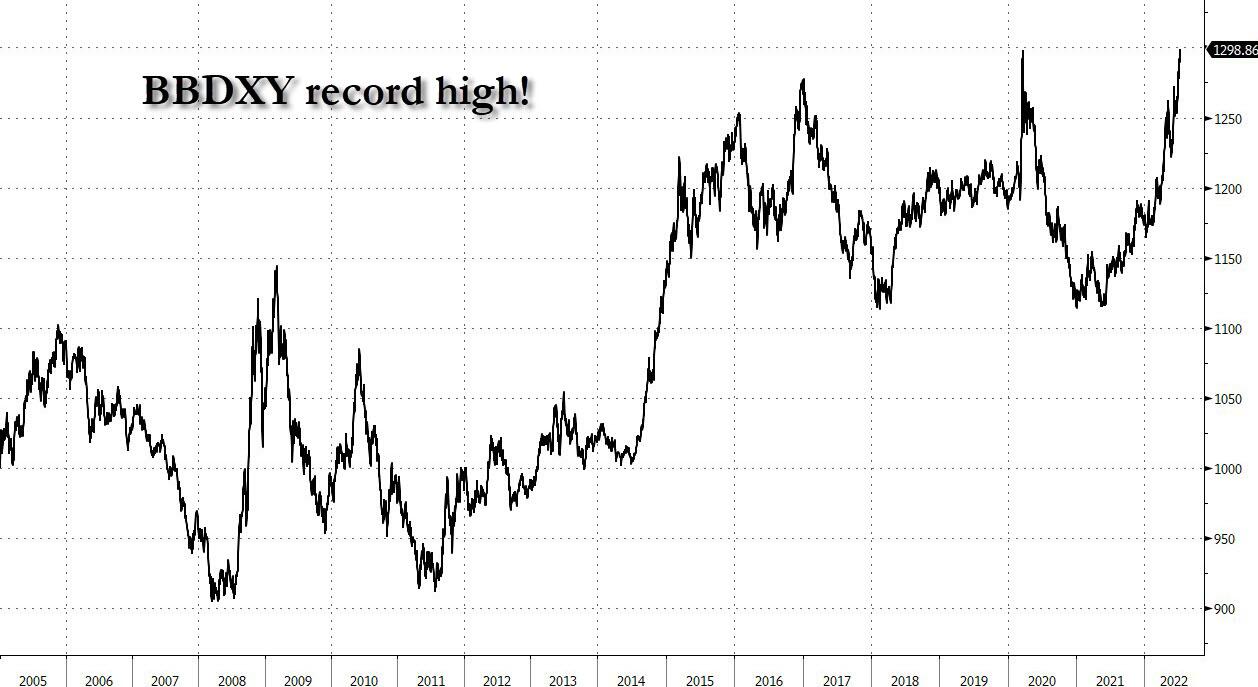
USD futures dipped a tick lower to 106.24 this morning before a bounce brought it back.  Odds are igh that a rally may emerge to bring USD back above the Cycle Top and upper trendline, both near 106.99.  The uptrend may resume beginning this weekend and lasting through the second week of August.  Note that a spike in the 10-year Treasury yield may bring this about.


Crude oil futures have pulled back to 98.50 this morning, possibly on their way to mid-Cycle support at 94.72 before a  rally to the 50-day Moving Average at 109.21 by mid-August.

ZeroHedge notes, “Solid risk-on moves in stocks, a weaker dollar, and a disruption along the Keystone pipeline were enough – in thin liquidity – to send oil prices notably higher (WTI back above $100).

“Right now liquidity is thin, people are away on holiday, there’s more machines than humans,” Amrita Sen, co-founder of consultant Energy Aspects Ltd., said in a Bloomberg Television interview.

“We can continue to trade in this very technical band. But structurally this is a market defined by underinvestment.”

Oil markets have been volatile in recent weeks as traders navigated concerns that a looming recession would hurt demand and the fallout from a stronger dollar against the signs of tight physical supplies.”


Posted in Published | 2 Comments

July 19, 2022

2:46 pm

The bounce in SPX was higher than expected, but the advice is still valid.  The EW format is at the Minute level, so I had not anticipated a move this large.  However, the final Waves of Triangles are often rogues.  I had anticipated that in the VIX, due to a higher degree format.  It has yet to happen.  Fundamental analysis tells us that SPX should rally from here.  That is simply not so.  The Triangle formation is a continuation pattern with the next move, Wave C, equal or greater in size that Wave A.

ZeroHedge comments, “One day after a “sinkhole” slide for US stocks driven by news of an Apple hiring freeze and facilitated by zero market liquidity, the risk now – as Goldman described over the weekend – is of a meltup in the opposite direction as buyback blackout period ends on July 22, at which point some $5.5BN in daily buybacks will return and relentlessly lift offers with little concerns for price…

… and amid the catastrophic liquidity where top-of-book liquidity is a tiny $2 million (meaning a $2MM order can move ES by one tick)…”

ZeroHedge further reveals, “Last Thursday, we reported that after having patiently and bravely bought every (or almost every) f**king dip of the Biden bear market, retail investors were on the verge of throwing in the towel and were ready to capitulate alongside their far wealthier (and much more experienced) institutional peers. One day later, we also reported that while in his latest note the biggest Wall Street bear – and contrarian – BofA Chief Investment Strategist, Michael Hartnett, had not turned bullish just yet, he strongly hinted that he will in the near future as a result of his expectation that the Fed will pivot in the near future, and “the most difficult decision in investing for the rest of 2022 will be to pick which FOMC one should flip portfolio before – Sep 20th , Nov 1st or Dec 13th” with Hartnett saying it will most likely be November when the Fed capitulates.”


9:35 am

As mentioned yesterday, sell the bounce.


8:20 am

Good Morning!

SPX futures rose to 3868.50 in the overnight session, a 60% retracement from yesterday’s low.  Futures are declining as the SPX loses strength.  The Triangle formation is complete and offers a minimum target equal to Wave A, approximately 540 points lower from yesterday’s high.

Today’s options chain shows Max Pain at 3850.00.  Calls dominate above 3870.00 and puts take over beneath 3840.00.  Long gamma exists above 3900.00, while puts do not show a clear level of short gamma in today’s op-ex.  However, short gamma is cumulative and may exert influence beneath 3800.00.

ZeroHedge reports, “After yesterday’s sharp late-day swoon sparked by news that Apple is reining in hiring (which, of course, is expects as the US slides into recession, and is a necessary condition for the Fed to end its rate hikes), sentiment reversed overnight and US index futures climbed to session highs, rising as high as 1% just before 7am ET, as traders remained focused on the earnings season, with tech stocks set to rebound following Monday’s losses.

Nasdaq 100 and S&P 500 contracts were 0.7% higher by 7:30am in New York. Both indexes declined Monday as investors worried over the strength of the economy after Apple joined a growing number of companies that are slowing hiring.”


VIX futures slid to 24.58, still within normal retracement levels.  Friday’s candidate for the Master Cycle low occurred on day 254.  Today  is day 258.  There is a slight chance for a modest new low, but the odds of that happening will decrease over the next few days.  Today will be a good day to accumulate shares in the VIX.


TNX futures rose to 30.13 in anticipation of a final cross above the 50-day Moving Average at 30.06.  The Cycles Model suggests another week of rally in TNX, possibly aiming for the Cycle Top resistance at 34.83.  Overseas investors are selling USTs.

ZeroHedge notes, “Foreign official institutions sold $34.1 billion in USTs in May…

BUT… foreign private investors (not central banks or reserve managers) bought a record $133.94 billion in May…

Most notably, China’s holding of US Treasuries fell below $1 trillion for the first time since June 2010…

Source: Bloomberg

This is the 6th straight month of selling by China for a total of $100 billion over that period.

China was the biggest seller in May (the latest month available) followed by Ireland and Canada.


Crude oil futures declined to 96.53 this morning as it seeks to find support at the mid-Cycle at 94.62.  There is likely to be another probe higher, possibly testing the 50-day Moving Average at 109.24,  just above the 61.8% retracement value.

ZeroHedge reports, “Just hours after Gazprom declared force majuere with a number of its European clients – implicitly cutting off NatGas supply to the continent; Canadian energy firm TC Energy has declared force majeure on some crude shipments on the Keystone pipeline after a power failure at a pump station in South Dakota.

The power failure was reportedly driven by the extreme temperatures spreading across the US (it was reportedly around 20 degrees above normal at around 100 degrees).”


Gold futures slipped back to a low of 1703.20 before a bounce bringing it back to flat line.   Gold is now in a retracement mode where it may rally to the Lip of the Cup with Handle formation, or possible higher.  There are two weeks left in the bounce, per the Cycles Model.

Investing comments, ”

  • Fed officials observe blackout ahead of interest rate decision
  • Unusually light week for US economic data
  • Gold seems to be boxed in a trading range of $10 or less

After saturating the airwaves last week with chatter on the merits and demerits of a super-sized interest rate hike for July, Federal Reserve officials are no longer commenting ahead of the July 27 rate decision.

Will gold bulls find the silence ‘golden’?”


Posted in Published | Comments Off on July 19, 2022

July 18, 2022

3:39 pm

BKX probed to its corrective high this morning before reversing back down on day 257 of its Master Cycle.  I had originally considered Thursday’s low as a possible Master Cycle ending, but today’s rally makes more sense.  The question this morning was, how to explain the jump in stocks after Goldman reported a 47%  decline in profits?

The Cycles Model suggests a long decline through the end of September.

ZeroHedge reports, “Concluding the big banks’ Q2 reports, which had been at best mediocre with more banks missing than beating estimates, on Monday morning Goldman Sachs reported a 47% drop in second-quarter profits, as the Wall Street giant suffered from a slowdown in investment banking fees and plummeting revenues in asset management, offset by a jump in trading.”


2:58 pm

The days of short-squeezes are over.  SPX has reversed out of the call-dominated zone above 3850.00 and is about to enter the short zone at 3840.00.  It is back on a sell signal beneath the mid-Cycle support/resistance at 3882.00 and is challenging short-term support at  3841.08.  In other words, short the bounce.

ZeroHedge lays it on the line, “There is a growing chorus of “hike fast and get it over with” coming from the market with an expectation that getting back to neutral fast will spark a recessionary environment that will prompt a pivot from The Fed back to easing rates and unleashing a fresh round of QE.

As we have recently detailed, BofA’s top Rates strategist, and former NY Fed analyst, Marc Cabana expects Powell to be forced to end QT much sooner than expected

We expect the Fed will stop QT with rate cuts due to the contradictory signal it sends on monetary policy and to simplify policy communications; the Fed will likely not want to be easing with rate cuts but tightening with QT.

Cabana reminds us that the Fed has established a playbook for such an action in 2019 when the Fed cut started cutting rates in July ’19 and simultaneously announced a cessation of QT. “

ZeroHedge further states, “While most analysts and traders were digging through Goldman’s stronger than expected Q2 earnings report which beat on revenue despite a nearly 50% plunge in profits and another quarter of dismal investment banking, but redeemed itself with stellar FICC numbers…

… which sent Goldman stock higher, for the fourth quarter in a row there was troubling disclosure in the bank’s Asset Management division (which overlaps with the verbotten Goldman Prop, which does but doesn’t really exist since banks still aren’t technically allowed to have prop trading post Volcker). Here, after a very disappointing Q3 2021, which saw a $820 million loss from the trade of public equities…”


7:30 am

Good Morning!

NDX futures rose above the 50-day Moving Average at 12090.43 over the weekend session and has since pulled back, still above the 50-day.  A new peak at the open may move Wave 2 over, but the Cycles Model suggests this may be the final probe.  NDX has spent 12.9 market days from the peak at 12175.95 and 43 market days from the peak at 12987.63 as of this morning’s open.  The Model tells us that there may be another 17.2 days of decline to the upcoming Master Cycle Bottom, due the second week of August.

Today’s options expiration shows calls outnumber puts above 11800.00 and potential long gamma above 11900.00.  Institutions are starting to buy calls again.  QQQs (291.87) show calls dominate above 285.00 with potential long gamma at 290.00.

ZeroHedge observes, “On the one hand, what was the most bullish case for markets starting this month fizzled with a bang, when after a solid start to July and the best start to Q3 since 1980, stocks resumed their bear market slide, only to recover some losses toward the end of the week. In any case, the barely 1% rise in the first half of July was at best meh considering the lofty expectations for what has traditionally been the best two-week period of the year…

… for markets.

So as attention turns from what was a big dud of a strong calendar period, to what is already shaping up as a disappointing Q2 earnings season (with virtually all banks missing expectations across the board), the bulls are once again in retreat, and nowhere is this more obvious than in hedge fund positioning which according to Goldman’s Scott Rubner, “is so low, it has officially fallen off my chart.” Rubner then invites readers to take a look at some of this stuff, and points to Goldman’s Prime Broker hedge fund exposure, Futures Positioning, CTA, Risk Parity, noting that “I don’t think there is more marginal position left to sell, given large hedges vs. fundamental positions already in play.”


SPX futures rose to Intermediate-term resistance at 3901.72 and has stalled, possibly ending the Triangle formation that is Wave B.  Should Wave C reach equality with Wave A, SPX would be targeting 3360.00, fulfilling the Head & Shoulders formation.  There is a probability that the anticipated Wave (3) of [3] may go much deeper by the second week of August, when the next Master Cycle low is due.

Today’s expiring options show calls dominate above 3850 and puts crowd out calls at 3840.00 in a thinly populated op-ex.  Gamma levels are not discernible at this time.

ZeroHedge reports, “US equity futures and global markets stormed higher, as the dollar extended its slide from a record high as investors scaled back bets on how aggressively the Federal Reserve will tighten policy in response to growing recession fears which Bloomberg paradoxocially interpreted as “easing recession fears.” In other words, rising risk of a recession lowers the risk of a Fed-induced recession. Lovely.

In any case, Nasdaq 100 futures rose 1.2% and contracts on the S&P 500 added 1%, with spoos trading back over 3,900 and more than 5% above June’s closing low following Friday’s strong rally on renewed hopes that the Fed will end its rate hikes and soon start cutting rates as well as end QT. West Texas Intermediate crude oil also stormed higher, undoing all recent losses and traded near $100 a barrel while the Bloomberg Dollar Spot Index slipped 0.5%, extending a retreat from a record high. The benchmark Treasury yield rose back toward 3%.”


VIX futures are rising in the face of higher stock prices this morning after a probable Master Cycle low on Friday, day 254.  VIX tends to lead the markets and tis may be a sign of an imminent reversal in the SPX.  The final plunge in the VIX on Friday may have been meant to boost stocks in the face of monthly op-ex.

In Wednesday’s upcoming op-ex, Max Pain is at 29.00.  Long gamma comes to life at 30.00 while short gamma dominates below 26.00.

SeekingAlpha observes, “Summary

  • Last week could have been a disaster for the equity market if not for options expiration.
  • The macro backdrop is deteriorating quickly, and that is likely to weigh on stocks heading into next week’s FOMC meeting.
  • Can the market continue to rally, sure? But there continue to be many more reasons for it not to rally.
  • Looking for a helping hand in the market? Members of Reading The Markets get exclusive ideas and guidance to navigate any climate. Learn More »


Sunrise behind the iconic Jet Star roller coaster after hurricane Sandy
Michael Ver Sprill/iStock via Getty Images

Stocks had a solid finish to the week, thanks to options expiration. But if it had not been for the monthly options expiration, last week would have been a disaster. The S&P 500 (SP500) was down more than 4% at its lows on Thursday morning but finished the week lower by around 1%. The end-of-week comeback was aided by the slow melt of the VIX index (VIX).”


TNX is rising again, but still beneath the 50-day Moving Average at 30.06.  The Cycles Model suggests another week of rally, possibly to the Cycle Top at 34.74, before a substantial decline.  The Model often calls for a return to the mid-Cycle support for the decline, but all indications are that it may be much deeper.  The Weekly mid-Cycle support is at 15.30.

ZeroHedge admits, “The debate about recession risk is pointless. We are already in a recession. Real GDP (gross domestic product) in the United States declined at an annual rate of 1.6% in the first quarter.

The Atlanta Fed Nowcast shows a 1.5% contraction in the second quarter. But the underlying figures are scarier. According to the Atlanta Fed, “the GDPNow model estimate for real GDP growth (seasonally adjusted annual rate) in the second quarter of 2022 is -1.5% on July 15, down from -1.2% on July 8”. That is an enormous negative change, -0.3% of GDP, in one week.

They go on to say that “the nowcast of second quarter real personal consumption expenditures growth and real gross private domestic investment growth decreased from 1.9% and -13.7%, respectively, to 1.5% and -13.8%, respectively”.

Investment is collapsing, consumption is barely kept alive and if we look at other components, imports are soaring while exports rise less than expected.”


USD futures pulled back to 107.05, testing the upper trendline of the year-long trading channel.  The rally may resume with strength later this week as it has another three weeks of rally to the Master Cycle Top.


Posted in Published | Comments Off on July 18, 2022

July 15, 2022

2:25 pm

SPY stalled at 384.00 and SPX at 3859.90, a 70% retracement.  The complex pattern is emerging from this mess.  The Wave formation shown above may be correct, should SPX not rally further.  A decline beneath short-term support at 3835.00 may be construed as a sell signal.  Institutional investors usually come back into the market before 3:00 pm.  Their sentiment may become obvious.


10:49 am

This morning I mentioned that SPY options Max Pain was at 382.00.  SPY was rallied up to 384.33 enabling the dealers and hedge funds offering today’s options to go short.  This morning I mentioned that short gamma began at 376.00, near the Cycle Bottom at 374.07.  Since then, short gamma has moved up to 380.00, with 89,175 put contracts in place!  The Alternative is to simply go long and avoid short gamma altogether.  Calls are favored above 388.00 and long gamma begins at 390.00, right in line with the 50-day Moving Average at 388.51 and Intermediate-term resistance at 391.76.


9:45 am

Today may be a whipsaw day, as SPX rose to the 61.8% Fib retracement level at 3843.20, then reversed.  The market may have rewarded the institutional investors who are still long at op-ex, but now has to deal with retail, who are net short.

ZeroHedge observes, “Despite ISM surveys tanking, analysts expected US Industrial Production to eke out a 0.1% gain in June but they were wrong as output slumped 0.2% MoM (and May was revised lower also). There hasn’t been a weaker month since September 2021…

Source: Bloomberg

Only mining (+1.7% in June after rising 1.2% in May) kept the headline industrial production print positive.

Utilities fell 1.4% in June after rising 1.9% in May.”


7:40 am

Good Morning!

While op-ex is an important consideration today, we should not ignore other considerations across the globe.  After Challenging the Lip of the Cup with Handle formation at 3315.00 in June, it has reversed back through it and today is threatening the 50-day Moving Average at 3227.13.  The Cup with Handle formation proposes a potential 40% decline from the June peak to the possible August trough.  Economic conditions in China now suggest this is possible.  Even likely, as liquidity is under attack.

ZeroHedge reports, “On Friday, shares of China’s banks extended their slide to a two-year low amid fears widespread mortgage non-payments would spark contagion within the banking sector (see “China On Verge Of Violent Debt Jubilee As “Disgruntled” Homebuyers Refuse To Pay Their Mortgages“) even after the local banking and insurance regulator said it will maintain continuity and stability of financing policies for the real estate sector.”


NDX futures rose to 11837.70 in the overnight market, a 50% retracement, before easing lower.  The Cycles Model suggests potential weakness in equities today.  The next Cyclical support is near 11000.00.

In today’s morning op-ex it is easy to see why the overnight rally to 11800.00, since a large cluster of expiring puts lies there.  Options are sparse, but predominately short.  QQQ (close 286.67) afternoon op-ex shows Max Pain at 288.00.  Long gamma begins at 295.00, while short gamma starts at 280.00.

ZeroHedge observes, “Retail – which until now was a steadfast buyer of most dips (if with less and less vigor) – is starting to sell its equity holdings according to Bloomberg data, while speculators in futures markets are very short, in a potentially contrarian setup for the market, writes BBG’s Simon White.

While US equity sentiment based on retail investors has been bombed out all year at levels usually associated with market bottoms, the market has continued to remain weak and volatile. However, as White notes, the poor sentiment of retail investors masked what they were actually doing, as their equity allocations continued to remain high.

This is now changing, with average equity allocations finally gathering pace to the downside.”


SPX futures rallied weakly in the overnight session to 3808.50, but have eased beneath 3800.00.  SPX closed above Cycle Bottom support at 3759.52 and must decline beneath it to lose all nearby technical supports.  The weekly Cycle bottom support is at 3058.70.  The Cycles Model suggests a possible bottom during the week of August 8, making a 30-day decline.  However, other indicators suggest an extension of this decline to the week of August 15, for a 37-day decline.

This morning’s monthly op-ex shows Max Pain at 3795.00.  But they don’t go positive until 3875.00.  Puts dominate beneath 3750.00.  SPY closing options (377.91) show Max Pain at 382.00, as retail investors become more bearish.  Short gamma begins at 376.00 and intensifies at 375.00.

ZeroHedge reports, “US futures and European stocks advanced, shaking off data that showed China’s economy expanded slowest pace since the initial 2020 Wuhan outbreak amid pervasive lockdowns…

… while the dollar’s record surge stalled at the end of a week in which markets have been whipsawed by shifting expectations for monetary tightening by the Federal Reserve and worries over global economic growth.”


TNX remains beneath the 50-day Moving Average at 30.06 as it seeks direction on its next move. The Cycles Model suggests a further bounce approaching the Cycle Top at 34.65 in the next week or so.  The scare of a 100-point bump by the FOMC is still being considered.  However, the Cycle Model calls for a dramatic decline to the mid-Cycle support at 22.16 as a possible next move.

ZeroHedge considers, “When BofA’s top Rates strategist, and former NY Fed analyst, Marc Cabana speaks, investors, the Fed – and even his former Fed co-worker and repo guru, Zoltan Pozsar – listen. And what Cabana has to say now is extremely important.

On Thursday morning, roughly around the time BofA’s chief equity strategist Ssavita Subramanian slashed her S&P year-end price target by a whopping 25% from 4,500 to 3,600, Cabana’s rates team published a must read note (which is also available to pro subs in the usual place), in which he wrote that the bank’s rates team “is making substantial downward revisions to our rate forecasts following our US economics team’s new call for a mild 2022 recession and lower Fed funds rate path.”

What revisions?

Well, as of today, in addition to sharply lowering its stock targets, BofA is also slashing its 10y Treasury end ’22 forecast from 3.50% to 2.75% and end ’23 forecast from 3.25% to 2.50%. The cuts come as BofA’s economics team yesterday also slashed its forecast to reflect a US recession in 2022 and materially lowered the Fed funds rate path with the terminal Fed funds rate lowered from 4.00-4.25% to 3.25-3.50%, as the BofA economics team now expects 100bp of Fed rate cuts between Sep ’23 and Jun ’24.”


USD futures are lower this morning, signalling short-term weakness.  The Cycles Model suggests a pullback to the trendline at 107.00 before a final probe to the top of this Cycle, due during the week of August 8.  The “standard” target for the final probe may be 111.00, but it may extend higher.


Posted in Published | Comments Off on July 15, 2022

July 14, 2022

10:53 am

A bounce may be in order here.  The 38.2% Fib retracement is near 3800.00 and the 50% Retracement level is at 3820.00, just beneath Short-term resistance at 3828.94.  Remember, Max Pain is at 3805.00.  Dealers and hedge funds may be positioning the SPX for the smallest payout possible on their options.  Thus far, they may have succeeded, but “accidents and miscalculations” do happen.  The hourly Cycle may last until tomorrow afternoon.  The daily Cycles Model still calls for another three weeks of decline.


9:56 am

BKX, our liquidity proxy, has slipped beneath the neckline of its Head & Shoulders formation this morning at 98.47.  The Cycles Model gives about a week of additional decline in the current Master Cycle.  A lot of damage may be done in that time.  Note that the 2020 low was at 55.40.  A decline beneath that number implies a banking disaster, since the long-forgotten stress tests only accounted for a 20% drop in stock prices.  Earnings season has begun, as we may see below.  My studies show the average target may be (beneath) the 2020 low.

Zerohedge observes, “Hot on the heels of JPMorgan’s disappointing results, Morgan Stanley shares are slumping after the bank reported worse-than-expected Q2 results missing top and bottom-lines and taking a large regulatory charge.

Q2 EPS disappointed (printing $1.44 vs $1.56 expected) but the big headline maker was that revenue of $13.1 billion fell short of expectations of $13.3 billion (with wealth-management revenue of $5.74 billion missed the average estimate of $5.81 billion).

While the bank missed on the top-line, it did manage to deliver better-than-expected results for both its equities and FICC sales and trading businesses. But on the debt capital markets side, revenue disappointed (coming in at $326 million, below the $374 million that analysts expected).”


7:40 am

Good Morning!

NDX futures declined to 11571.20 this morning.  The next level of support is 11300.00.  The Cycle Bottom offers further support at 11056.93.  Tomorrow’s op-ex shows the last level of support for the long options (Max Pain) is at 11700.00.  Options turn short at 11675.00.  Short gamma kicks in with a vengeance at 11500.00.

ZeroHedge observes, “According to Goldman trader John Flood, this morning’s CPI print coming with a much higher than expected 9+ handle will keep institutional investors frozen and the bank expects very little offense to be played over the next few weeks. Furthermore, as discussed earlier, 75bps was thought of as a lock for July but now this: Raphael Bostic signaled the Fed could hike by 100 bps after June’s inflation report. “Everything is in play,” the Atlanta branch chief said. Asked if that included by raising rates by that amount, he replied, “it would mean everything.” Just an hour earlier Nomura made a 100bps rate hike its base case.

As Flood notes, there were “plenty of incomings on the “sharp reversal higher” in the mkt post CPI.” Here is his explanation why stocks ramped:

“We flagged that the level of pre-trading (shorting) into this print was quite noteworthy. Institutional positioning remains VERY light…L/Os running record high cash levels and HFs gross/nets in bottom percentiles on 1, 3 and 5 yr look backs. Does it makes sense for mkt to move higher after a 9.1% print and BOC hiking by 100bps…of course not…but that was max pain trade today and this market seeks max pain. Difficult to truly analyze intraday moves with liquidity stuck at the lowest levels we have seen in years (S&P futures top of book liquidity near $3mm again).”


SPX futures declined to 3746.40, deep into the short gamma zone.  The final support for SPX  is the Cycle Bottom support at 3759.61.  Beneath this is free-fall zone.  The SPX completed the 10th day of a 30-37 day decline.  The Cycle may have shifted into higher gear, shortening the length of the Cycle, but not the intensity.

Today’s op-ex shows Max Pain at 3805.00.  Calls prevail above 3810.00, but long gamma may not kick in until 3900.00.  Puts dominate beneath 3775.00 with short gamma beginning at 3700.00.

ZeroHedge reports, “US futures were already sliding fast as the reality of the Fed’s upcoming 100bps rate hike was fully appreciated by the market, as even Goldman was shocked by the kneejerk move higher yesterday, saying “Does it makes sense for mkt to move higher after a 9.1% print and BOC hiking by 100bps…of course not…but that was max pain trade today and this market seeks max pain.”

Well, this morning the max pain was clearly lower, as US equity futures fell along with stocks in Europe and Asian, while the Bloomberg dollar index rose to a record Thursday, surpassing the record hit during the covid 2020 crash when the Fed launched unlimited swap lines to ease the global dollar crunch…

… after high US inflation hardened expectations for more aggressive Federal Reserve monetary tightening that could trigger a recession.”


VIX futures rose to 28.21 thus far, testing the 50-day at 28.41.  Next week’s op-ex shows Max Pain at 29.00.  Short gamma begins at 26.00.  Long gamma immediately starts at 30.00.

Bloomberg reports, “Perceptions of risk are diverging in perplexing ways among asset classes.

Volatility in bonds is whipping up just as it trails off in stocks. The ICE BofA MOVE Index, a gauge of costs for Treasury options, rose in four of the last five weeks. A similar measure for equities, the Cboe Volatility Index, or VIX, fell for three straight weeks. The MOVE’s premium over the VIX has widened this month to the most since 2009. ”


TNX futures rose to 29.85. testing the 50-day moving average at 30.05.  The Cycles Model shows TNX rising fore two more weeks.  The likely target may be the Cycle Top resistance at 34.56.

ZeroHedge reports, “After a subpar 10Y auction which followed a mediocre sales of 3Y paper, moments ago the Treasury concluded the week’s debt issuance with the sale of $19 billion in 30Y paper in the form of a reopening of the 29Y 10Month TG3 cusip.

The auction was, in a word, spectacular, and not just because of solid top-line results but much more importantly, because the record Indirect demand suggests foreign central banks called the top in long-term yields (i.e., what comes next is deflation).”

On the other hand, ZeroHedge notes, “Earlier today, Fed trial balloon intermediary and Powell’s preferred leaker, WSJ reporter Nick Timiraos was seen as taking a 100bps rate hike off the table – despite today’s scorching, red hot CPI print – in an article titled “Inflation Report Likely to Seal Case for Fed’s 0.75-Point Rate Rise in July” in which he said that “another big increase in consumer prices last month keeps the Federal Reserve on track to raise its benchmark interest rate by 0.75 percentage point at its meeting later this month.”

However, that’s not enough for Nomura which in addition to being the first bank to call for a H2 2022 recession (followed duly by BofA this morning and all other banks soon), moments ago also announced that it now sees a 100bps rate hike as its base case. Impossible? Nope: Nomura was also the first bank to correctly call last month’s 75bps rate hike (which was initially seen as a ludicrous call, only to have Timiraos confirm the outcome during the Fed’s blackout period).


USD futures made a new high at 108.61 this morning, creeping higher toward the 2001. high at 121.21.  I stand corrected (thank you, Seb) that the 2001 high was not the all-time high.  The attached chart shows the all-time high at 164.22 in 1983.  Estimates for this Cycle high range from 111.50 to 120.00.


Gold futures declined to 1705.50, preserving yesterday’s low as the Master Cycle low on day 272.  The bounce may only last until the end of July before the decline resumes.  The immediate target for the bounce may be the Lip of the Cup with Handle formation near 1785.00.   Normal retracement may go to 1850.00, depending how the Cycles play out.


Crude Oil futures are nearing their Master Cycle low as they declined to 92.48 thus far.  There is likely to be a 4-week bounce to the 50-day Moving Average at 109.67 in that time.  On the other hand, should WTIC decline below 86.00, there may be an acceleration of the decline.

ZeroHedge observes, “In this climate of rising inflation, particularly of energy and food, and global central banks in tightening mode, a (political) crisis never is very far away. Sri Lanka has been one of the most prominent examples with its recent default on foreign debt and its President Gotabaya Rajapaksa fleeing the country yesterday has been one of the most prominent examples. Bad economic policy, the Covid-19 shock and, ultimately the global food and energy crisis resulting in serious shortages, tipped the country over the edge. Protests also broke out in Libya earlier this month, where rising ‘cost of living’ problems were cited as one reason. According to FAO statistics, a staggering 29.4% of the world’s population was facing moderate or severe food insecurity in 2020 (up from 25% in 2015) a figure which probably did not improve in recent years.

But the crisis in Sri Lanka also points to broader risks stemming from currency volatilityFor one, the strong dollar has its mirror image in a sharp depreciation of many currencies around the world. There is hardly any developing/emerging market currency that has escaped the stronger dollar. Bear in mind also that dollar-claims (loans and debt securities) on the non-financial sector in emerging markets and developing countries reached a record of nearly USD 4 trillion last year, after more than a decade of easy monetary policy. As such currency volatility in developing markets is something is unlikely to disappear in the foreseeable future.”


Posted in Published | Comments Off on July 14, 2022

July 13, 2022

10:40 am

Along with the food crisis, liquidity is also drying up.  The BKX is testing the Cycle Bottom support at 98.61 on day 252 of its Master Cycle.  In addition, there is an 18-month Head & Shoulders formation at 98.47.   Should it break through both supports, we may see another week of decline that could be devastating to liquidity.  Quarterly earnings season begins on Friday.


10:20 am

The food crisis may be developing new legs as the next, more powerful phase begins.  The Cycles Model suggests rising prices through mid-August.  The proposed Head & Shoulders formation suggests food prices may double over the next several months.

ZeroHedge comments, “The European Union has warned of a new wave of migration caused by a global food crisis exacerbated by the war in Ukraine.

Aija Kalnaja, the newly appointed interim director, told reporters in Prague that the bloc was already prepared for refugees leaving Ukraine, but that the wider problem would likely be an influx of people from other areas of the world.

“We have to prepare also for refugees coming from other areas because of food security,” said Kalnaja.

“You probably know that grain transport from Ukraine is hampered and that will create waves of migration.”

Her warning follows the release of a 27-page internal EU report last month which highlighted the threat of “a catastrophic famine” facing North Africa.”


9:00 am

News of an overheated CPI has caused SPX futures to fall through support at 3810.00 to test minor support at 3750.00, where the next large cluster of (4366) put contracts lie.  There has been a bounce, but the damage may have already been done.  Short gamma may prevail today, sending stocks into a tailspin.

Zerohedge reports, “Well that wasn’t supposed to happen.

It seems ‘peak inflation’ is not here and markets are stunned.

Rate-hike expectations are soaring…

With the odds of a 100bps hike in July now at 30%…”


8:00 am

Good Morning!

SPX futures hit a morning high of 3835.50, remaining near that level until this point.  Traders await the CPI report, which may change the outlook on FOMC actions.

In today’s op-ex, Max Pain is at 3845.00 with calls dominating at 3850.00 and above.  Long gamma may prevail at 3900.00.   Puts hold sway at 3840.00 and below with short gamma coming in strong (7056 contracts) at 3800.00.

ZeroHedge reports, “After yesterday’s last hour stock market puke prompted by a fake CPI “leak” that showed inflation rising more than double digits in June which sent spoos just over 3,800, US index futures advanced ahead of a report that will show inflation hitting a fresh four-decade high according to Bloomberg consensus which expects headline inflation to print 8.8%, ensuring another 75bps rate hike. Contracts on the S&P 500 rose 0.3% by 7:15 a.m. ET after the underlying gauge declined over the past three days. Nasdaq 100 futures were up 0.4% after the tech-heavy index shed 3% this week, reversing most of last week’s gains. The dollar dropped from a 2 year high, bitcoin rose but held below $20,000 and WTI crude oil stabilized at about $96 a barrel after a tumble.”


VIX futures dipped to 27.12 this morning, then recovered somewhat.  The Cycles Model suggests a period of strength may be about to begin, lasting through the weekend.  Although VIX is elevated above its historical norm, there seems to be little alarm about the upcoming FOMC moves and the dual prospect of a recession looming.

Today’s op-ex in VIX shows Max Pain precisely at 27.00 with short gamma at 26.00 and long gamma starting at 28.00.  A very tight spread between risk-on and risk-off.

Bloomberg comments, “Perceptions of risk are diverging in perplexing ways among asset classes.

Volatility in bonds is whipping up just as it trails off in stocks. The ICE BofA MOVE Index, a gauge of costs for Treasury options, rose in four of the last five weeks. A similar measure for equities, the Cboe Volatility Index, or VIX, fell for three straight weeks. The MOVE’s premium over the VIX has widened this month to the most since 2009. ”


TNX remains beneath the 50-day Moving Average at 30.04, but a directional change may be imminent, as a period of strength appears about to begin which may boost TNX back above the 50-day.  The current Master Cycle has less than two weeks to go, with a potential target as high as the Cycle Top at 34.48.

9:18am

The soaring CPI boosted TNX above its 50-day Moving Average as suggested earlier.  Higher rates may now be a real concern for the next two weeks.


USD futures rose to a new high  at 108.39 this morning.  With 4 more weeks to go in its current Master Cycle one may speculate whether it may exceed its prior all-time high at 121.21.  What many investors are unaware of is that money flowing out of stocks is more likely to be parked in the money market (USD) than any other asset.


Posted in Published | Comments Off on July 13, 2022

July 12, 2022

3:17 pm

The sideways frustration may be over, as SPX declines through Short-term support at 3822.13.  Another nearby potential support is at 3810.32.  Should both be surpassed, the doors open to a panic decline as trending strength gathers momentum later in the week.  SPX is challenging short gamma beneath 3850.00.  Short gamma strengthens dramatically beneath 3800.00.


2:59 pm

Here is the long view of TNX.  It has gone coast-to-coast in the monthly trading band, completing a 2.15-year Cycle.  A retracement is underway that may take TNX down 61.8% of that rally to 15.76, or the 43-month moving Average at 16.26 by the end of the year.  The 10-year Treasury yield has slid below 30.00, causing foreign investors to shun it.

ZeroHedge remarks, “After yesterday’s average 3Y auction, moments ago the Treasury sold $33 billion in a 10 Year reopening (technically a reopening of the 9Y-10M cusip EP2), in an auction that could have certainly gone better.

The high yield of 2.96% was down from June’s 3.03%, the first drop since Nov 2021; even so with the lack of concession due to the sharp drop in yields for the past two days, the auction priced with a 2bps tail to the 2.940% when issued, the fifth consecutive tail for a 10Y auction and the 8th in the past 9.

The ugliness continued below the surface, with the Bid to Cover of 2.34 sliding below last month’s 2.41 and the lowest since Oct 2020; obviously it was well below the 2.50 six-auction average.”


10:25 am

The Ag Index has made a 61.8% retracement, fulfilling its pullback requirement.  It may reverse shortly, so this is a good long entry.  GKX may get a boost in its trending strength by the end of the week and may continue its rally through mid-August.  It may reach its Head & Shoulders target by mid-October.

ZeroHedge warns, “The endless drought in the Southwest has become a full-blown national emergency.  If Lake Mead, Lake Powell and the Colorado River keep drying up at the rate they have been, millions of Americans could soon be without water and electricity.  Despite all of our advanced technology, those living in the Southwest continue to be extremely dependent on a handful of critically important water sources, and if those water sources get so low that they cannot be used we are going to have a major crisis on our hands.”

ZeroHedge reports, “Chicago corn soared the most in nearly a year after the sweltering summer heat may dent crop yields.

Bloomberg reports a heatwave over the Midwest grain belt is underway during corn’s pollination period, a flowering stage for the grain, and is the most crucial development period for yield determination. High temperatures and a lack of rainfall during the pollination phase usually result in lower yields. ”


8:15 am

Good Morning!

SPX futures made a new low at 3818.80 this morning.  Support remains at 3810.00 and 3787.25.  8.6 days have elapsed with 28 market days to go in this Cycle.  It’s time to be short, if not already.

Today’s options are relatively light, but in a tight range.  Calls dominate at 3855.00 and above, while puts take over at 3850.00 and beneath.  Long gamma begins at 3875.00.  Short gamma begins at 3800.00.  Tomorrow’s options screen shows short gamma possibly beginning at 3825.00 while long gamma moves up to 3875.00 – 3890.00.  The bears are getting braver.

ZeroHedge reports, “US index futures, global markets, Treasury yields, bitcoin and oil all fell on Tuesday as the dollar continued its relentless ascent to  levels just shy of the March 2020 global crash record high…

… highlighting pervasive trader unease about the economic outlook as high inflation and a looming recession are set to unleash a catastrophic global recession coupled with a worldwide dollar shortage, now with the added boost of China’s renewed struggles with Covid. S&P and Nasdaq 100 emini futures dropped about 0.5% each having slumped as much as 0.9% earlier, as traders brace for an ugly Q2 earnings season which may provide clues on how companies are weathering inflation and recession concerns.”


VIX futures are climbing higher, reaching 27.38 this morning.  VIX shows a longer potential rally than the SPX decline at 75 calendar days and 52 (51.6) market days.

The NYSE Hi-Lo Index closed yesterday at -127.00, creating an aggressive sell signal.  Its Cycle is in agreement with the VIX Cycle.

IG reports, “​Is the recent slide in the VIX index likely to continue?

The Volatility Index (VIX) is again coming off its relatively high 30+ reading as it has done every month year-to-date, except in April, but is another spike higher around the corner?

The Chicago Board Options Exchange (CBOE) VIX, also called the “fear index” by market participants, aggregates 30-day put and call options on the S&P 500 index.

When the index spikes and shows a relatively high reading, it indicates that significantly more put options are being bought than call options, as investors fear a slump in the price of US stocks and their indices and thus hedge themselves by purchasing put options.”


TNX has gone beneath the 50-day Moving Average at 30.01, but may not be on a sell signal.  The Cycles Model calls for another 2 weeks of rally  before a larger decline in August.  This move may not be tradable.

ZeroHedge reports, “To find the last time the US 3 Year Treasury auction priced above 3.0%, one has to go back all the way to May 2007, because not even during the Lehman turmoil in 2008 or the Fed policy error of Nov and Dec 2018 did 3Y yields rise this high. We bring this up because moments ago the Treasury sold $43 billion in 3Y notes at a high yield of 3.093%, up from 2.927% in June and the highest in 15 years. Perhaps it was the surge in yields (because it certainly wasn’t the concession in today’s trade which has seen yields slide across the curve), the prompted a spike in demand by buyers, and is why after last month’s 1 basis point tail, today’s auction stopped through the When Issued 3.098% by 0.5bps.”


USD futures made a new overnight high at 108.41 as it continues its throw-over of the trading channel.  The Cycles Model calls for another month of rally, so the question is, will it exceed the prior all-time high at 121.21?  The Cycles Model calls for a near-term pullback, with trending strength returning at the end of next week.

ZeroHedge (TME) comments, “The DXY looks like a “coin” chart soon. It continues trading inside a positive trend channel and note we are getting rather elevated inside the channel, at least in the short term. 50 day is down at channel lows around 104. 200 day moving average is at 98! RSI is getting very overbought, but as we know overbought can stay overbought for longer than most plan. Let’s see how this develops from here, but people are far from all in on the dollar long trade (chart 2).”

TheEpochTimes reports, “BRICS members call for cross-border payment in BRICS currencies to challenge the U.S. dollar.

In his opening remarks, Xi stated, “We should also expand BRICS cooperation on cross-border payment and credit rating to facilitate trade, investment, and financing among our countries.”


Gold futures made a deeper low at 1721.80 this morning.  The Cycles Model calls for a possible bounce by the end of the week that may last up to 3 weeks.  The target for the bounce may be the Lip of the Cup with Handle.  However, gold is in a very weak state, with a truncated, irregular Wave 2 suggesting more downside.  Should it not bounce this week, the downside target may be near 1680.00.

ZeroHedge tries to explain why gold is acting up, “The current and open fraud regarding the paper gold price in the COMEX market is now as plain to see as the open desperation in the global financial system, which is unraveling in real-time all around us.

As risk assets tumble foreseeably into bear territory before a headwind of deliberately rising rates, precious metals have seen headline-making falls as well.”


Crude Oil futures declined to a morning low of 98.05 and is now bouncing to retest round number support/resistance at 100.00.  Crude has the potential of two or more weeks of further decline into the next Master Cycle.  Despite OPEC’s limitations which would call for higher prices, we may be witnessing demand destruction at work.

ZeroHedge comments, “Use it or lose it – this principle might apply to Saudi Arabia’s oil production capacity that is now eyed by the Western world to fill the Russia-sized gap in supply left behind by embargoes.

However, as Statista’s Katharina Buchholz details below, Saudi Arabia in the past three years only approached its declared maximum production capacity of 12 million barrels per day in one month, casting doubts on the kingdom’s ability to quickly up its production to stabilize world markets. According to Bloomberg, such predictions have come from UAE leadership, who together with the Saudis are the only OPEC members who have spare production capacity – at least on paper.”


Posted in Published | Comments Off on July 12, 2022

July 11, 2022

Good Morning!

SPX retraced most of its decline from the top on June 28, but stopped at Intermediate-term resistance at 3918.11.  The weekend SPX futures remained beneath 3900.00 and this morning are at a loss.  There is a possibility of an attempt at overhead resistance again this morning, but the initial Cycle of this decline starting June 28 may be over in a matter of a couple hours, if not already finished.

In today’s expiring options, Max Pain is at 3885.00 with calls being favored above 3900.00 and puts dominating beneath 3875.00.  Long gamma rests above 3950.00 while short gamma kicks in beneath 3850.00.

ZeroHedge reports, “US equity futures and global markets started the second week of the 3rd quarter on the back foot, with spoos sliding on Monday morning as traders were spooked by fears that Covid may be making a return to China leading to more virus restrictions sending Chinese stocks tumbling the most in a month, amid growing concern about an ugly second-quarter earnings season which begins this week. A closely watched CPI print on Wednesday which is expected to rise again, will also keep markets on edge.

Contracts on the S&P 500 and Nasdaq 100 traded 0.7% lower, suggesting last week’s rally in US stocks my stall as concerns about China’s Covid resurgence weigh on risk appetite. The dollar jumped, reversing two weeks of losses and trading around the highest level since 2020 while Treasuries gained. Bitcoin dropped, oil declined and iron ore extended losses on concern about the demand outlook in China.”


VIX futures jumped to a  morning high at 26.48 and remained near the top of its range after testing mid-Cycle support at 24.16 last Friday.  Note tat mid-Cycle support is strong and rising, offering a platform for the next move higher.  The Triangle formation has lulled investors about market risk.  However, dealers and hedge funds selling options will not want to see VIX rising above the 50-day Moving Average at 28.70.


The NYSE Hi-Lo Index appears to have made its Master Cycle high on Thursday as the NYSE made yet another weaker attempt at a comeback.  While there may be a fleeting chance at a new high this week, the Cycles Model suggests a new (lower) low by mid-August.  The final and deepest low is anticipated by mid-October.


TNX futures slid to test the 50-day Moving Average at 29.99 this morning.  The Master Cycle low was made on Wednesday.  The new Master Cycle may be short-lived, topping out during the last week of July.  UST/TLT may be a buy at that point, as yields may take a nose-dive with a loss of 50% or more through mid-November.


USD futures hit a new high at 107.81 today, throwing-over the Broadening trendline.  The Cycles Model suggests the probe higher may last until mid-August.  Normally Wave (4) would decline to the lower trendline before the final high.  The all-time high in the USD was made in July 2001 at 121.21.  Should USD continue its rally, we may se it approach that level.


Posted in Published | 1 Comment

July 1, 2022

Note: I will be unavailable the entire week of July 4.  The Practical Investor will resume July 11, 2022.

3:15 pm

SPX is at its target zone.  There is a symmetry in the bounce at 3832.00.  Time to be short.  Have a great week!

1:56 pm

Dealers and hedge funds appear to be motivated to keep SPX above 3800.00 until the close.  Max Pain is at 3820.00 while Cycle resistance is 3818.00 to 3825.00.  Will the well-oiled options machine break down?  Regardless of today’s close, earnings come to the fore next week.  The Cycles Model implies trending weakness starting this weekend.  What ever happened to those bank stress tests that were to be announce last weekend?  Inquiring minds want to know.


10:30 am

SPX is back down in short gamma.  It appears that the dealers and hedge funds attempted an elevation above 3800.00 which failed.  Gamma gets even shorter every 25 points beneath 3800.00.  This may become a runaway train


10:26 am

TNX is puking as recession risk soars.

ZeroHedge exclaims, “The 5Y Treasury yield is down 25bps this morning.

Read that again… 25bps!

The entire Treasury curve is re-rating lower as recession risks soar (Manufacturing surveys look ugly this morning)…

The 10Y yield has plunged below 3.00% – now testing 2.80%… (and 5Y yields are also at 2.80%)


7:35 am

Good Morning!

NDX futures declined to 11354.60, testing Cycle Bottom support at 11349.95.  It may have started its next Master Cycle decline, aided by short gamma.  Today’s op-ex shows options favor calls above 11650.00 while favoring puts beneath 11600.00.  While it is difficult to ascertain where short gamma begins due to the light population of puts and calls, it is most certainly short beneath 11500.00.

ZeroHedge (TME) says, “Short gamma pain is back with a vengeance

On Monday we reminded our readers that the dealer positioning with regards to gamma had turned into a sell or sell event (here). Equities have since then sold off sharply and dealers are back into “deep” short gamma territory. This means we are back to the “sell low, buy high” feedback loop, magnifying all moves. Add extremely poor liquidity (here) and you understand p/l pain is back…”


SPX futures declined to 3742.40 thus far, beneath both the 3800.00 resistance line and the Cycle Bottom resistance at 3835.13.  It is on a confirmed sell signal beneath the Cycle Bottom.  While it may be possible to rally, trending strength points down starting today.  The next Master Cycle low appears to be scheduled for the second week of August with a particularly nasty bottom due on the July op-ex (Wave 3?).

In today’s op-ex Max Pain is at 3820.00 with calls dominant above 3825.00.  Puts rule beneath 3815.00 with short gamma possible beneath 3800.00.  This is forcing dealers to sell low and, should a short squeeze develop, buy high.  A nasty conundrum.

ZeroHedge reports, “As DB’s Jim Reid puts it “if you want the good news this morning it’s that H1 is now finally over. If you want the bad news it’s that there’s not much good news around as we start H2 and US equity futures are already down around a percent in the first few hours of the new half year. ”

Indeed, just when you thoughts stocks couldn’t possibly slide any more after just concluding the worst first half in 52 years…

… and with investor and consumer sentiment at record lows, you’d be shocked to learn that futures and stocks started the new month and quarter by plumbing fresh lows as fears of soaring inflation and tumbling earnings boosted concerns about an imminent recession, and the resulting risk aversion lifted bonds and havens and sent risk sliding.  The “Big Short” Michael Burry said we may only be about halfway through the market’s decline…


VIX futures are hovering near the 50-day Moving Average at 28.70.  VIX has been herded in a Triangle formation while SPX has been in decline.  Whether it is due from investor uncertainty (looking for reasons to buy the dip) or outright dealer manipulation is uncertain.  What the Cycles Model is telling us is that trending strength has started on June 29 (its reversal out of the low) and is growing over the next two weeks.  In addition, the next Master Cycle low isn’t due until mid-August.

The NYSE Hi-Lo Index has made a new Cycle low at -330.00 yesterday.


TNX has plunged beneath the 50-day Moving Average at 29.90 as a Wave 3 decline in stocks is developing.  The Cycles Model shows the decline in TNX gathering strength over the next 1-2 weeks, in sync with SPX.  That relationship may develop even more as equities decline over the next several months.

Zerohedge remarks, ” Just when investors were hoping for a month- and quarter-end rebalancing uptick in stocks after the carnage of the last few months, US equity markets are ending the first half of the year on an ugly note with Nasdaq leading the charge lower…

And recession fears have sent the 10Y Yield back below 3.00% for the first time since June 10th’s CPI print…


I just thought you would like to know…

It appears that Cycle Wave I is complete with a breakout above the trading channel in place since before 1990.  The initial decline may go to the mid-Cycle support at 20.32.  The full retracement may have begun which may occur over the next six months.  The 50% retracement value is 19.40.  The 61.8% retracement may go to 15.77.   If correct, the Fed may reverse course as early as August.

However, should a shallow decline take place (above 21.50), there is a potential that TNX may rise above 53.00 in the fall before the full retracement is underway.


Posted in Published | Comments Off on July 1, 2022

June 30, 2022

Note:  I will be absent from the blog during the week of July 4.  The blog may resume on July 11.

10:03 am

BKX, our liquidity proxy, is now about to break into new lows not seen since February 2021.  The next Master Cycle low is due shortly after op-ex on July 15.  It is possible that Primary Wave [3] may be complete by then and, with it, the target for the Cup with Handle may be met.  Bank solvency tests were supposed to be passed this last weekend.  Nothing has been said since Friday.  Is there another Lehmann in the wings?


7:45 am

Good Morning!

NDX futures are testing the Cycle Bottom support at 11396.84.  It is likely that support may not hold.  Today is not an op-ex day for NDX.  Max Pain for tomorrow’s op-ex is at 11790.00 and options turn short at 11750.00.  While options are not highly populated, they are not favorable to a rally.


SPX futures have fallen beneath the support line at 3800.00, but may bounce back for a retest.  There may be further support at 3650.00, but a new Cycle may has begun, giving the SPX up to 37 market days of decline.  The Cycles Model suggests the decline may intensify this weekend with a possibility of a limit down open on July 5.  I will be gone next week, so be warned that the worst may be just ahead.

In today’s op-ex, Max Pain is at 3845, while options turn nominally long at 3850.00.  Optons turn short at 3825.00 and short gamma may begin at 3800.00.  This puts the dealers and hedge funds in a precarious position.

ZeroHedge wryly reports, “It was supposed to be a 7% ramp into month-end on billions in pension fund residual buying.

Instead, it ended up being more or less the opposite, with crypto-led liquidations dragging futures and global markets lower, and extending Wednesday losses after central bankers issued warnings on inflation and fueled concern that aggressive policy will end with a hard-landing recession, which increasingly more now see as being 2022 business, an outcome that now appears assured especially after yesterday’s disastrous guidance cut from RH, the second in three weeks!


VIX futures jumped to 30.09 this morning, a new Cycle high.  The Cycles Model shows high trending strength today, and again during the entire month of July.  That conforms with the emergence of the VIX out of its Triangle (coiling) formation.  Analysts have been trying to figure why the VIX is low in relation to the decline in the SPX.  I posted the following article yesterday, but thought a revisit might be helpful for those who missed it.

ZeroHedge asks, “One of the most frequent questions tossed around Wall Street trading desks (and strip clubs), and which was duly covered by Bloomberg recently in “Fear Has Gone Missing in Wall Streets Slow-Motion Bear Market“, is why despite the crushing bear market and the coming recession, does the VIX refuse to rise sustainably above 30, or in other words, why is the VIX so low?”


TNX is declining in earnest, with approximately a week to finish this Master Cycle at or near mid-Cycle support currently at 21.42.  There is double support at 30.00 which may stall the decline, but events may conspire to assist a break-through.

ZeroHedge (TME) observes, “US 10 year update

So the 10 year reversed on the huge 3% level a few sessions ago, managed retracing around 50% of the move lower from highs and is now approaching the trend line that comes in at 3.10%. A close below 3.10% and things risk go very “dynamic”. Watch that trend line closely as well as the 50 day at 3%.”


USD futures probed higher to 105.31, testing Cycle Top resistance at 105.05.  But it may be rolling over as I write.  Once beneath the 50-day Moving Average at 103.00, the decline may continue to mid-Cycle support ant the trading channel trendline at 98.19..  the Cycles Model suggests a decline to the second week of August.


Gold futures may have made a Master Cycle low yesterday, on day 258.  The Cycles Model calls for a month-long rally in gold.  The first possible target is the 50-day Moving Average at 1862.50.  Liquidity concerns suggest that, should it not rise above the 50-day, there may be a phase shift to a decline through the Lip of the Cup with Handle.  A phase shift only requires 4.3 days of rally.  I do not see gold coming to our rescue in a liquidity-driven market decline.


Posted in Published | 1 Comment