October 12, 2022

10:18 am

BKX, our liquidity proxy, dipped lower this morning before a small bounce.  The current Master Cycle is due to extend to mid-November, indicative of the Panic Cycle due or taking place in other markets, including our own stock market.

ZeroHedge comments, “BofA Chief Investment Strategist Michael Hartnett has a favorite markets phrase that may be the only one a trader in this day and age needs: “Markets stop panicking when central banks start panicking.”

Well, in what may be the best news to shellshocked bulls after the worst September and worst Q3 in generations, in a harrowing year for markets, central banks are starting to panic. First it was the BOJ, then the BOE and now, it’s Switzerland’s turn.

Two weeks ago after the (first) panicked pivot by the BOE, when global markets were in freefall, we said that markets desperately needed some words of encouragement from the Fed, or failing that – and with the dollar soaring to new all time highs every day – the Fed had to make some pre-emptive announcement on USD Fx swap lines, if only to reassure global markets that amid this historic, US dollar short squeeze, at least someone can and will print as many as are needed to avoid systemic collapse.”


8:10 am

Good Morning!

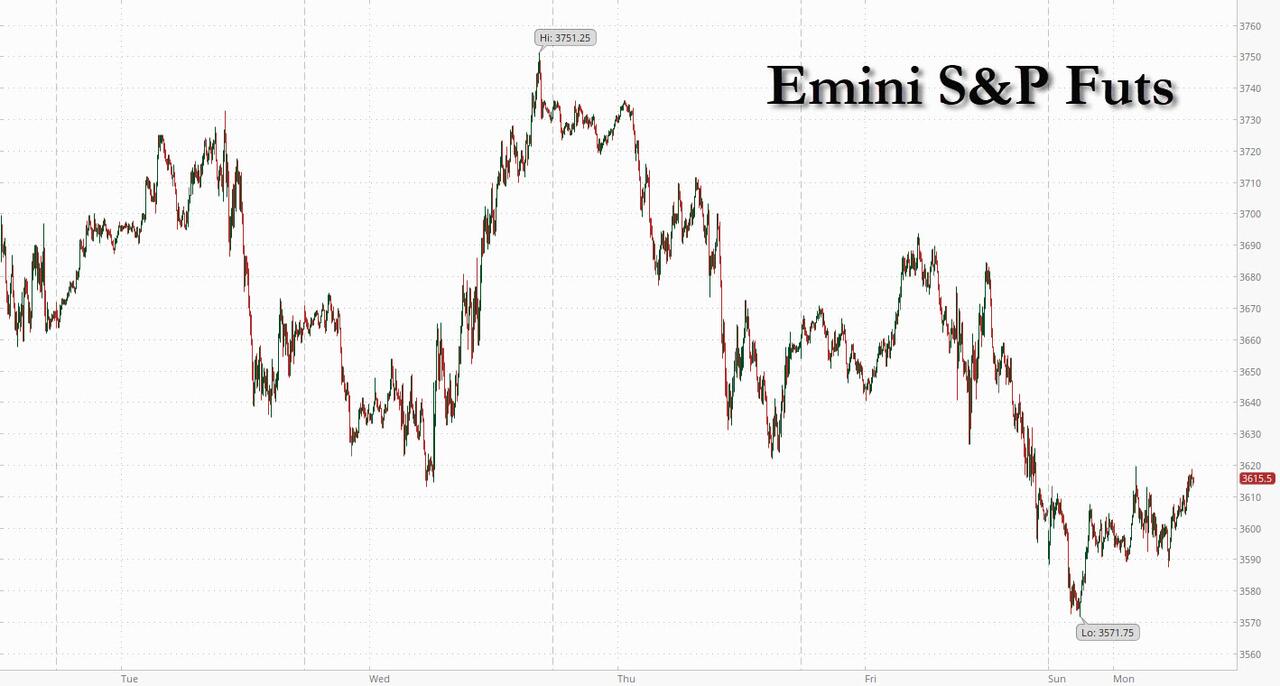
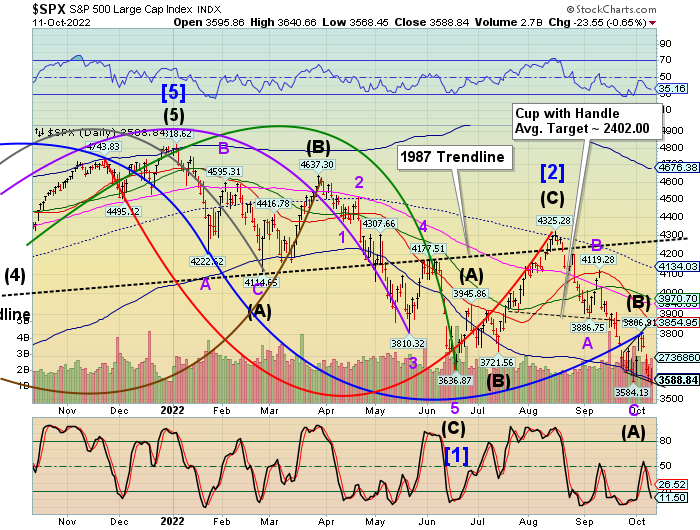
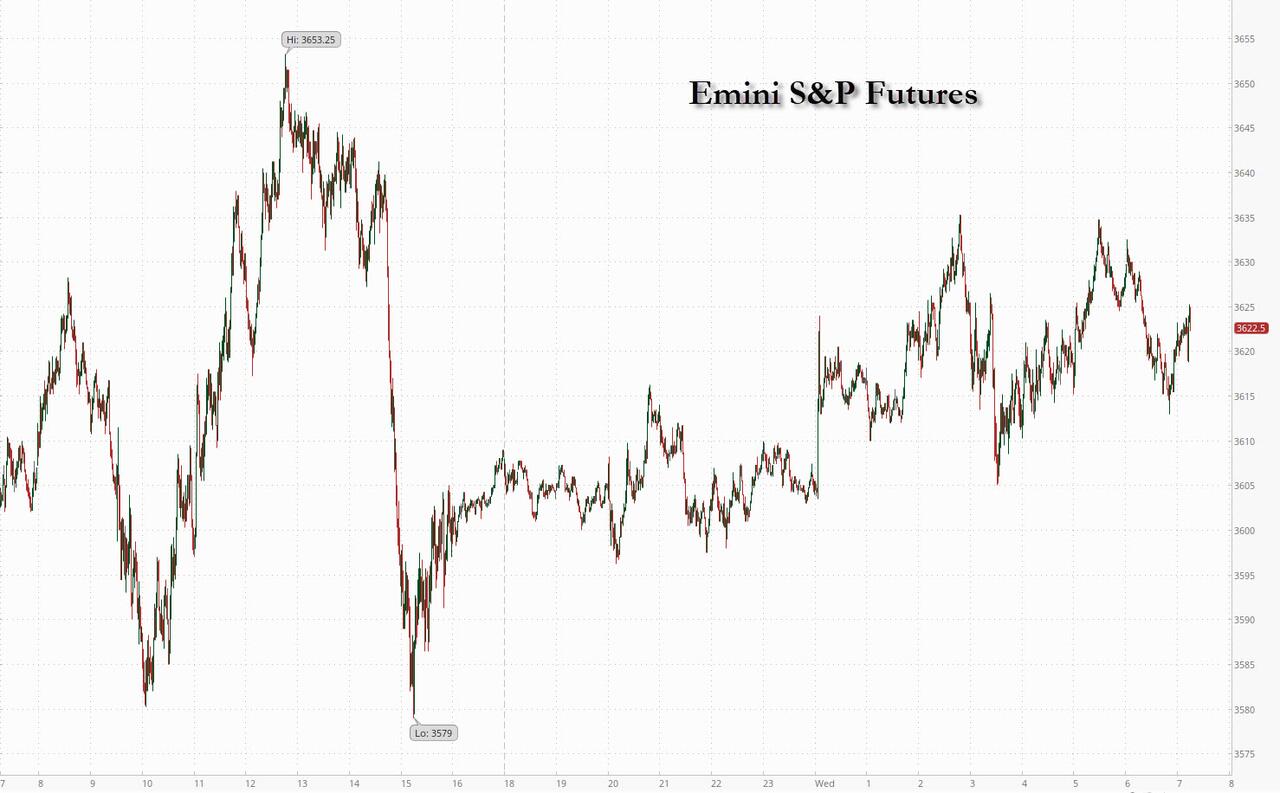
SPX futures rose to an overnight high of 3623.30, well beneath the 38.2% retracement of Friday’s decline.  The reason this is important is this:  Should the decline be the beginning (Wave 1) of Intermediate Wave (C) as illustrated, the retracements may fall within one of the lesser Fibonacci retracements, or possibly lower.  The 38.2% retracement is at 3658.96.  The 50% Fibonacci retracement is 3687.58.  Any rally to or beneath these levels tells us that this is a retracement of Minor Wave 1 of Intermediate Wave (C).  The implication is that the Panic Cycle may have already begun.  Thus, my reluctance to take short profits.  Many other analysts are calling this decline a “Wave 5” and taking profits.  Unfortunately they may be caught wrong-footed, since a Primary Wave [3] may be 1000 to 1500 points in length and may already be underway.  Should they be correct, there is stiff resistance at 3807.00 for the retracement.

In today’s op-ex, Maximum Pain for options holders is at 3605.00.  Long gamma begins at 3650.00.  Short gamma may begin as high at 3600.00, but certainly kicks in at 3575.00.  As you can see, the options market holds sway over the cash market.

ZeroHedge reports, “US stocks were set to bounce, ending a brutal five-day losing streak, amid confusion over what the BOE will do in two days, amid hope that tomorrow’s CPI print will come in lower than expected, and as Treasury yields eased off multi-year highs – at least initially – and investors put aside concerns that overheating inflation could offer more fodder to hawkish Federal Reserve policy makers amid speculation that things are breaking in far too many markets after it emerged that the Fed had sent a substantial amount of dollars to Switzerland this week in the first material use of the dollar swap facility in 2022. Nasdaq futures gained 0.9% by 7:30 a.m. in New York while S&P 500 futures rose 0.7% a day after the benchmark index nearly erased its October gains, while UK bonds tumbled and the pound rose amid UK policy confusion. While global risk sentiment earlier received a boost from a report suggesting the Bank of England could extend its emergency bond repurchases, a bank spokesperson quashed that speculation and said the program would still end on Friday, leaving traders in the dark as to what will happen.”


One telling indicator is that the VIX futures remained well within yesterday’s trading range and has become positive this morning as it may be prepared for a breakout.

In today’s op-ex, Maximum Pain moved up from 29.00 to 32.5o in the last 24 hours, showing a heightened concern for risk.  Puts and calls are both equally high at 30.00.  Short gamma begins there, while long gamma may begin at 35.00.  Long gamma may extend to 60.00 with 6197 calls at that strike.

ZeroHedge observes,”VIX panic is here

VIX 2/8 months futures spread continues moving sharply higher. This “under the hood” VIX measure is basically in panic mode.”


TNX rose to 39.74 this morning with a jolt from the hotter-than-expected PPI print.  This trend may continue to mid-November.  Today’s 10-year auction may provide some fireworks.  Banks must purchase Treasuries unsold to the open market…

ZeroHedge reports, “PPI is the under-card ahead of tomorrow’s main event CPI print, but nevertheless will offer some insights into how the inflation picture is evolving in the US and is expected to slow at the headline level but flat at the core level.

The headline PPI printed +8.5% YoY (which was hotter than the expected +8.4% YoY) but down from August’s 8.7% (jumping 0.4% MoM after 2 straight months lower)…
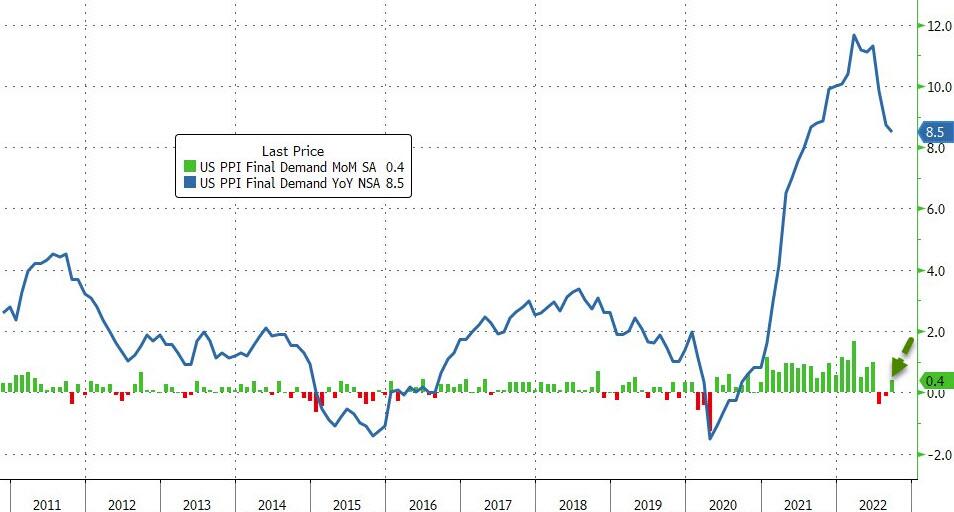
Source: Bloomberg

Ex-Food, Energy, & Trade, PPI rose 0.4% MoM (double the expected +0.2%).”

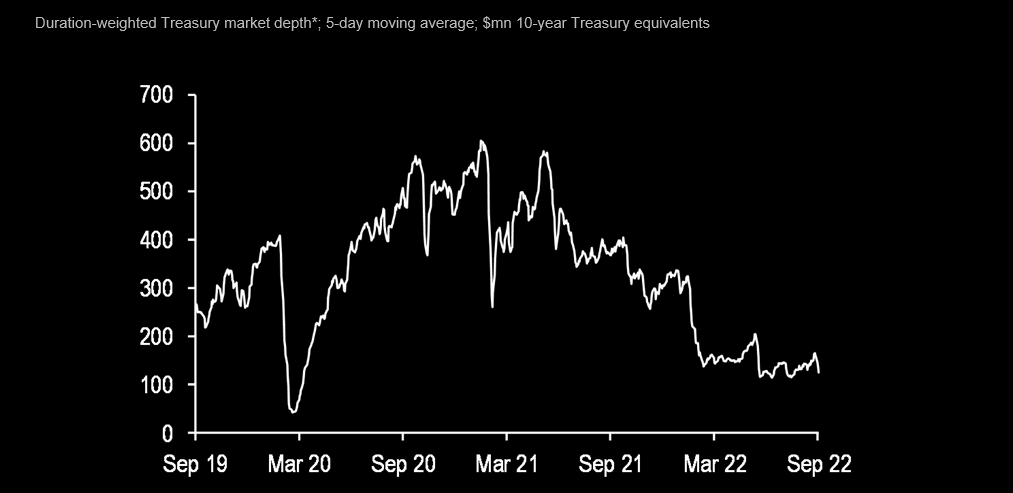
Yesterday ZeroHedge reported, “With Treasury prices and yields gyrating like high-beta penny stocks now that liquidity in the world’s “deepest” bond market is practically gone, bond traders were casting nervous eyes at the results of today’s 3Y auction results, the first coupon offering of the week and one month after the ugliest 3Y auction of 2022. Luckily, there were no fireworks this time even if the auction was decidedly of the subpar variety: pricing at a high yield of 4.318%, the highest yield going back to pre-Lehman levels, today’s sale of $40BN in 3Y paper tailed the When Issued 4.310% by 0.8bps, which while hardly good, was better than last month’s 1.4bps tail.”


USD futures were marginally higher this morning, at 113.49.  It remains above Cycle Top support at 113.36.  The Cycles Model suggests a triple dose of trending strength next week as the current Master Cycle comes to a close.


Posted in Published | Comments Off on October 12, 2022

October 11, 2022

3:25 pm

GKX has attempted to make a new high yesterday, but failed by just a few ticks.  I have marked the low on day 247 of the Master Cycle.  Today is day 252, so there is still a chance of a new low for Wave (C).  Given that the turn window is so short, accumulation of shares (DBA) may be wise.  As usual, five months after a peak in prices, the media announces the turn in food prices may be in.  Just in time for prices to start rising again.

ZeroHedge reports, “A massive logjam of more than 2,000 barges at various parts of the Mississippi River is being cleared Monday morning.

Southbound vessel traffic resumed early morning on the Mississippi River near Stack Island, an island located in Issaquena County, Mississippi after northbound traffic was cleared Sunday, Archer-Daniels-Midland Co. wrote in a note.

“We were able to completely clear the Northbound queue,” ADM said. 

ADM added that once all the southbound congestion is resolved, the Coast Guard will allow one-way traffic moving forward.”


1:50 pm

This is not a satisfactory outcome, but we are back to the original structure until another Wave lower is made.  Today is day 260 and is a more likely Master Cycle pivot than last Wednesday’s pivot at day 254 until proven otherwise.  The Lip of the Cup with Handle formation is still near 3600.00, as is the Cycle Bottom support, which may be why Wave 5 is so short.  This has become a tricky pivot and the Broadening formation may still be bearish.  Should the SPX close above 3600.00, a cautious trader may take off half the short position, but keep the remainder until the SPX rises over 3650.00-3700.00, where long gamma may take effect.  A close beneath 3600.00 leaves traders vulnerable in either direction but short gamma appears to rule trading at this time.


10:10 am

BKX, our liquidity proxy, has declined beneath it’s Head & Shoulders neckline and made a new 2022 low.  The Cycles Model suggests a continued decline to the end of October.  Credit Suisse’s capital shortfall is in the news.  Market stresses are eroding the capital structure of many banks and CS may be the first to go down.


8:15 am

Good Morning!

Today I am bringing out my alternate Elliott Wave Structure as a better fit with the Cycles and certain formations in the chart.  I am tentatively counting last Wednesday’s high as an Intermediate Wave (B) instead of a minor Wave 4.  Wave 4s can be triangles and zigzags but not Broadening Wedges.  Broadening formations seem to be the property of Wave Bs.  If the old Master Cycle were to continue, today would be day 260.  We would need a limit down day to complete the old Master Cycle, should it still be appropriate.  Should the old Master Cycle be intact, 3400.00 is still the target.  Under the new structure, the next target would be below 3000.00 by mid-November.

SPX futures declined to 3575.75 before easing back to flat with yesterday’s close.

In today’s op-ex, Maximum Pain for investors is 3625.00.  Long gamma begins at 3675.00 while short gamma starts at 3600.00.

ZeroHedge reports, “Another day, another rout, only this time there was an even more ominous twist. It’s shaping up as another risk off day on Wall Street, and around the world, as stocks fell… again… as usual… pressured by the relentless rout in the chip sector (following Friday’s decision by the Biden administration to put fresh curbs on China’s access to US semiconductor technology) which sent chip giant Taiwan Semi conductor plunging 8.3%, its biggest drop on record, and wiped out $240 billion in market cap from the global semiconductor sector, while US futures extended their Monday slump amid general amid fears of persistently high inflation two days ahead of the CPI report, and signs that company earnings were set to disappoint. A gauge of the dollar climbed to the highest this month before reversing.

But the ominous twist today is that for the second time in two weeks, the BOE stepped in the market, this time boosting its “temporary” QE to add linker bonds to its usual array of gilt purchases to tackle what it called “fire-sale dynamics.”  While this helped lift gilts and cable (if only briefly), its effect on futures was truly transitory, with the Emini dumping as much as 1% to a low of 3584, falling below the key level of 3,600, before stabilizing uneasily just above 3,600. It was down 0.6% at last check, while Nasdaq future were 0.5% lower as of 7:45am ET.”


VIX futures rose to 33.95, remaining beneath the Cycle Top resistance at 34.40.  I have tentatively marked last Wednesday as a Master Cycle Bottom.  There are just a few more days that may change this outlook, as this would be day 260 of the old Master Cycle.

In tomorrow’s op-ex, Max Pain is at 29.00.  Short gamma begins at 28.00, while long gamma starts at 30.00.  VIX may be due for a powerful move higher.


TNX futures climbed to 40.06 over the holiday weekend.  Today, however, it opened at 39.00 and resumes its upward march with a high thus far of 39.37.


USD futures rose to 113.46 before easing back to the flat line.  In doing so, it challenged the Cycle Top resistance at 113.23.  The Cycles Model shows growing strength into the next Master Cycle (high)  over the next week or so.


Posted in Published | Comments Off on October 11, 2022

October 10, 2022

2:04 pm

BKX is challenging the neckline of the Head & Shoulders neckline.  A close beneath 97.00 triggers the formation.  The next Master Cycle pivot occurs at the end of October.  A probable target for October may be 89.00.  A retest (from the low) may ensue prior to the plunge described by the Head & Shoulders formation.


8:40 am

Good Morning!

SPX futures bounced off the Lip of the Cup with Handle formation at 3607.50 last night and is desperately attempting a comeback this morning.  However, it is very deep in short gamma territory beneath 3700.00.  It may attempt a rally to 3700.00 where there is short term resistance before moving lower.  The downside target appears to be near 3400.00.

Today’s op-ex shows calls gaining the upper hand above 3700.00, but long gamma may not start until 3750.00.

ZeroHedge reports, “US equity futures extended last week’s post-payrolls slump, and as of 730am ET traded -0.2% at 3,646, having bounced off the session’s worst levels down as much as -1%, while European stocks fell for the fourth straight day as concerns mounted that central bank policy-tightening would send the global economy into a hard landing (as Michael Hartnett warned) taking a heavy toll on the global economy and company earnings. The dollar extended its gains while bonds were closed for trading on the Columbus Day bond market holiday; cryptos were flat.”


VIX futures advanced to 33.39 over the weekend, but have eased back.  They remain above Friday’s close, suggesting strength.  Today is day 259 in the current Master Cycle.  While it is possible that last Wednesday’s low (day 254) may have been the end of that Cycle, it is just as likely that the Master Cycle may have been delayed until Tuesday/Wednesday.

In Wednesday’s op-ex, Maximum Pain is at 29.00.  Short gamma starts at 28.00.  Long gamma begins at 32.50 and extends to 70.00.

ZeroHedge observes, “How are interest rate hikes and quantitative tightening affecting markets?

The Federal Reserve’s fast-paced rate hikes and initial reductions of its balance sheet have resulted in liquidity drying up across markets, amplifying volatility and uncertainty.”


TNX climbed above its Cycle Top support/resistance at 38.79 on Friday and remains there this morning.  Today is a day of trending strength, according to the Cycles Model.  However, should it slip beneath the Cycle Top, it may decline to test the 50-day Moving Average at 32.40.

ZeroHedge comments, “With the 30 Year mortgage now (un)comfortably into 7% territory, the US housing market is already suffering the “sharpest turn since the 2008 crash“, according to Redfin…

… pushing the average mortgage payment almost 50% to $2,500 from around $1,700 at the start of the year.”


USD futures have advanced beyond the Cycle Top resistance at 113.10, reaching a weekend high at 113.22.  Should it manage to stay above the Cycle Top, it may continue advancing higher.  There are two weeks left in the current Master Cycle where a pivot may be anticipated.


Posted in Published | Comments Off on October 10, 2022

October 7, 2022

9:20 am

The Ag Index has about a week left in the current Master Cycle.  It is currently held aloft by the 50-day Moving Average but may decline further due to a decline in liquidity.  This is a good time to begin accumulating shares (DBA) due to the limited downside and a strong uptrend.   Logistical problems may pose even more difficulty in transporting a smaller than usual harvest to the markets.

ZeroHedge observes, “As of Thursday afternoon, Bloomberg reported more than 117 vessels and 2,048 barges near Stack Island in Louisiana are in a logjam as a stretch of the lower Mississippi River is closed due to low water levels and vessel groundings.

“The US Army Corps of Engineers is dredging near Stack Island, and the Coast Guard intends to reopen the waterway with restrictions at some point Friday,” Bloomberg said.


7:50 am

Good Morning!

NDX futures have declined to 11387.00, but not bearish enough for a sell signal.  Equities bulls are looking for a 100K print, but may be disappointed, per ADP.  As usual, the markets have been driven by options.  Investors are waiting for the 8:30 am Monthly Jobs Report.

In today’s op-ex, Maximum Pain for all options investors is at 11450.00.  Long gamma starts at 11500, while short gamma comes into play at 11400.00.

ZeroHedge observes, “Prior to Friday’s NFP (and CPI next Wednesday), the market has been oscillating between the “hawkish Fed” and “Fed pivot” narrative. While the JOLTS Job Openings and the ISM Manufacturing employment index showed more evidence of a slowing labor market…

… yesterday’s stronger than expected ADP/ISM Services once again proved the economy still remains strong and therefore weakens the hope of a near-term pivot from the Fed. In a nutshell, according to JPM’s trading deks, with consensus expected tomorrow’s NFP to print +255k, Equity bulls would need a print ~100k to see the market alter its Fed expectations.”


SPX futures declined to 3720.50 in the overnight session. Should the jobs report be overly positive, SPX may decline beneath the Lip of the Cup with Handle formation to a possible target beneath 3400.00.  That would put equities into day 2 of a 4-day decline.

Today’s op-ex shows Max Pain at 3755.00 with Short gamma possibly beginning at 3750.00.  Long gamma starts at 380000.

8:30 am

SPX futures fell to 3702.50 only minutes after a positive jobs report, sending the index into short gamma.

ZeroHedge reports, “Great news America – the unemployment rate has tumbled (with hispanic unemployment at record lows).

Terrible news America – improving labor market statistics are the opposite of what The Fed is trying to do and this data today is not going to encourage any pause or pivot anytime soon.

That sparked an immediate mini-flash-crash in stocks…


VIX futures are consolidating, hovering near yesterday’s high before the jobs report.

8:38 am

VIX futures were jammed lower, in an effort to rescue the failing equities.  However, this maneuver may backfire as sentiment may be bearish.  Manipulations can work in a neutral environment.  This, however, is already emotionally charged, as evidenced by the Broadening formation in the SPX.  The monthly jobs report may be too much of a disappointment.

Investing.com reports, “Investors piled into cash at the fastest weekly rate since April 2020 in the week to Wednesday, as soaring government borrowing costs, high energy prices and slowing growth fanned risk aversion, BofA Global Research said in a note on Friday.

Investors ploughed $88.8 billion into cash, BofA said, citing EPFR data, and sold $18.3 billion in bonds – the fastest weekly rate in four months – with the majority of the sell-off comprising investment-grade bonds.

BofA’s “Bull & Bear” indicator, which seeks to track market trends, remained unchanged at the “extreme bearish” level, with this week’s heavy bond outflows cited as the reason.

Investors also shed stocks, with equity funds recording weekly outflows of $3.3 billion. U.S. equity outflows resumed, while European equities concluded their 34th week of outflows – the longest streak since 2016.”


TNX jumped at the jobs report, challenging the Cycle Top resistance at 38.65, making a new high at 39.00.  TNX is in the midst of a double dose of trending strength, opening the possibilities of a new high in the nest few days.  The Cycles Model suggests the rally in yields may continue to mid-November.


USD futures surged ahead to test Cycle Top resistance at 112.98.  The next Master Cycle high is due in about 2 weeks, so it is likely that we may see new highs in that time.  The third week of October appears to have a lot of strength up to the Master Cycle pivot.


Crude oil advanced this morning to 89.42, crossing above the 50-day Moving Average at 88.38.  Crude may be seeing the last of its retracement strength today as it may be due for a lower low by the end of October.

OilPrice.com opines, “A couple of weeks ago, when the rumors started about the production cuts that OPEC+ confirmed yesterday, I wrote that, from a long-term perspective, the cuts didn’t alter my bearish view on oil. That view, I said, was based on economic data that suggested the US, maybe even the world, was entering into a period of stagflation. Well, OPEC+ not only confirmed the rumors of cuts, but set them at the upper end of expectations. After trading lower for a couple of days after I wrote that, oil bounced back strongly as those rumors gained legitimacy, and is higher now than it was then as a result. However, the economic data is, if anything, worse now than it was then, and with the Fed indicating more rate hikes to come and earnings that are generally anticipated to be disappointing getting underway next week, the rally doesn’t look sustainable.”


Posted in Published | Comments Off on October 7, 2022

October 6, 2022

7:50 am

Good Morning!

NDX futures are lower, having reached a low of 11465.10 this morning.  Yesterday’s bump higher may have delayed this Cycle low to a Tuesday-Wednesday time frame.  The unusually long Wave 4 was options driven and may have given a false signal to most investors.  There are two possible outcomes.  The favored path is a 4.3-day decline down to 8000.00 or lower to a Master Cycle low.  However, his decline may be a zigzag A-B-C which allows another 2 days of rally, to 12000.00 instead, with a Master Cycle high on Friday.

In today’s op-ex, Max Pain is at 11540.00.  Long gamma starts at 11575.00, while short gamma begins at 11530.00.  NDX nay  begin its day in short gamma, making it more volatile.

ZeroHedge comments, “There has been a surge in the number of advancing NYSE stocks which is typically a very reliable sign of further positive equity returns in the coming weeks.

The bounce off the recent lows in stocks has been impressive. Negative sentiment and short positioning found the spark they needed in the sharp fall in the JOLTS job openings survey on Tuesday. As one wag on Twitter put it, firms finally figured out that all they needed to do to force the Fed to pivot was offer fewer jobs.”


SPX futures are down again this morning, reaching a low of 3750.80.  Yesterday’s late day surge may have clarified the location of the favored Master Cycle low which is due next week.  It also confirmed how strong a hold the options market has on Equities.  Today may begin a 4.3-day decline to the anticipated Master Cycle low.  The alternate is an extended rally, possibly ending on Friday along with the current Master Cycle at a high, instead of a low.

In today’s op-ex, Max Pain is at 3770.00.  Long gamma may begin as low at 3780.00 while short gamma starts at 3750.00.  Short gamma intensifies at 3700.00.

ZeroHedge reports, “Two days ago, when stocks were melting up even as oil was storming higher and threatened to rerate inflation expectations sharply higher, we mused that algos were clearly ignoring this potentially ominously convergence.

And while yesterday we saw the first cracks developing in the meltup narrative as oil extended gains following OPEC’s stark slap on the face of the dementia patient in the White House, it was only today that the “oil is about to push inflation sharply higher” discussion entered the broader financial sphere, with JPM writing this morning that “OPEC+ presents inflation risk”, Bloomberg echoing JPM that “OPEC+ alliance’s plan to cut oil supply stoked inflation fears and as traders awaited labor-market data to gauge the risk of recession” and Saxo Bank also jumping on the bandwagon, warning that OPEC+ supply cut will worsen global inflation which “raises the risk of inflation staying higher for longer” and “sends the wrong signal to the US Federal Reserve… It could send a signal that they have to keep on their foot on the brake for longer.”

And sure enough, with oil rising above its 50DMA for the first time since Aug 30, futures have slumped overnight as oil kept its gains, with S&P and Nasdaq 100 futures both sliding 0.5% as of 730am, while Europe’s Stoxx 600 erased an advance and traded near session lows. US crude futures held on to weekly gains of about 11% after the oil cartel said it would cut daily output by 2 million barrels. Treasuries were steady, the 10Y trading around 3.77%, with the 2Y rate hovering about the 4.15% level.”


VIX futures consolidated overnight, staying at the lower end of the trading range.  Should SPX continue to rally, we may see VIX decline to the mid-Cycle support at 26.10.  In either event, the VIX is near its inflexion point to move higher.


TNX is consolidating in a very tight range.  However, despite yesterday’s strong move, TNX may be setting up for an even stronger move higher, starting today.


USD futures remained at the upper end of its trading range, not making new highs, but showing strength, nonetheless.

Investing.com observes, “The bout of profit-taking on long dollar positions begun last week has carried into the start of this week. Despite the escalating rhetoric, the yen is not participating today and is trading within the pre-weekend ranges. The greenback’s lows have been set in the European morning and have stretched the intraday momentum indicators, suggesting that North American dealers may not follow suit. ”


Posted in Published | Comments Off on October 6, 2022

October 5, 2022

1:50 pm

ZeroHedge observes, “What goes up must come down. With financial conditions going from super tight to rather easy…

… in literally 48 hours as markets soared after pricing in a Fed pivot (again), in the process making a Fed pivot unlikely, even as “Buy-to-Cover” flows have been “absolutely staggering” (in the parlance of Nomura’s Charlie McElligott), it appears that ‘ammunition’ for a squeeze has run dry.

As SpotGamma points out, despite the heavily-sold narrative of Fed pivot proximity, we are searching for a reason to think this rally has more legs, but are struggling to find it.

As we noted yesterday, despite equity gains, the market’s expectations for Fed hikes actually shifted hawkishly in the last two days (i.e. narrative fail, confirming this was all options tail wagging the market dog)…”

..as I suspected.

10:30 am

SPX has declined into short gamma territory beneath 3750.00.  This may accelerate the decline as today’s op-ex is heavier than usual.  The entire rally may be wiped out today.  That is one of the reasons for not recommending cash or longs on Monday morning.  The market can turn very quickly, giving only seasoned professionals the ability to anticipate the turns.


8:00 am

Good Morning!

SPX futures have begun their descent, reaching a morning low thus far at 3750.00, testing short gamma.  This may be the beginning af a probable 4.3-day descent to new lows.  Under “normal” circumstances, we may expect a decline to 3430.00, as mentioned last week.  However, The Broadening Wedge formation may come into play with a target below 3000.00.

In today’s op-ex, Maximum Pain for all options investors is at 3760.00.  Long gamma begins at 3775.00 while short gamma starts at 3750.00.

ZeroHedge reports, “After the best 2-day rally since April 2020, the best start to a new quarter since 2009 and the best start of a Q4 since 2002, the powerful rally fizzled and US equity-index futures fell as investors pushed back on bets for less hawkish central banks amid the latest surge in oil, and sought more evidence that inflation is moderating. In other words, unlike yesterday, stock algos finally noticed what oil was doing.

Futures tracking S&P 500 and Nasdaq 100 dropped 0.9% each after the underlying indexes scaled two-week highs on Tuesday. And as the dollar rebounded for the first time in three days, Treasuries slid across the curve as oil swung ahead of the OPEC+ meeting today where the cartel is expected to cut output by as much as 2mmb/d.”


The NYSE Hi-Lo Index nearly went positive yesterday as stocks soared.  However breadth remained negative, especially at the end of the day.  Negative breadth may become more so through the weekend as the Cycles Model suggests a possible new low for 2022 in the coming week.  It remains on a sell signal for the remainder of the week.


VIX futures rose to 29.59 in the overnight session.  The short squeeze in stocks has not affected the VIX as one would suppose.   VIX may now be inversely synchronized with the SPX.  A decline to 3400.00 in the SPX is likely to move the VIX to test the Head & Shoulders neckline, at a minimum.  However, a decline in the SPX beneath 3400.00 is likely to propel VIX to a much higher level.

In today’s op-ex, Maximum Pain is at 29.00.  Short gamma also begins at that level.  Long gamma starts at 30.00 and may extend to 70.00.  Next week’s op-ex is similar and may influence the rise in the VIX up to 70.00, should SPX decline beneath 3400.00.

ZeroHedge remarks, “Remember VVIX?

They took it higher, but the VVIX has given back the entire squeeze move basically. VIX not so…

Source: Refinitiv

VIX term structure – lower for longer

The VIX front end backwardation is soon all gone. People piled into short term VIX hedges just in time for the squeeze. This is now in puke protection mode…The chart showing the curve shifting sharply lower yesterday compared to Monday (which was a huge shift lower itself).”


TNX has bounced to 37.19 in the futures.  It may prolong the zigzag formation, but that appears unlikely, as significant trending strength may have begun and appears to continue through the weekend.

RealInvestmentAdvice  observes, “Market instability” remains the most significant risk to central banks globally. Despite their desire to combat surging inflation, market instability is a greater risk to global economies due to the massive amounts of leverage. We previously discussed the importance of controlling instability. To wit:

Interestingly, the Fed is dependent on both market participants and consumers, believing in this idea. With the entirety of the financial ecosystem now more heavily levered than ever due to the Fed’s profligate measures of suppressing interest rates and flooding the system with excessive levels of liquidity, the “instability of stability” is now the most significant risk.

The ‘stability/instability paradox’ assumes that all players are rational, and such rationality implies avoidance of complete destruction. In other words, all players will act rationally, and no one will push ‘the big red button.’”


USD futures bounced off the intersection of Intermediate-term support and the upper trading channel trendline at 109.98 to an overnight high of 111.06.  Yesterday’s low appears to be the end of the Master Cycle on day 264.  If so, this may be the beginning of a robust three week rally, as trending strength may intensify.


Crude Oil futures rose to a retracement high of 87.67 in the overnight session.  Overhead resistance is at the 50-day Moving Average at 88.67.  From there it may resume its decline toward the lower trendline of the Broadening Wedge formation at 67.00.  The anticipated Master Cycle low may be due at the end of October.

ZeroHedge comments, “OPEC+ could be on the verge of one of the largest production cuts in two years, a move White House officials would undoubtedly have a ‘panic attack’ as they attempt to dissuade the 23 crude-producing countries and its allies, such as Russia, from making the cuts.

OPEC+ is considering cutting 2 million barrels a day, and on the smaller side, a reduction of 1-1.5 million barrels a day, delegates said. Such a move would be a blow to Washington as the Biden administration has scrambled to unleash record amounts of crude from the strategic petroleum reserve to tame soaring crude prices this summer.

“Higher oil prices, if driven by sizeable production cuts, would likely irritate the Biden administration ahead of US midterm elections,” Citi strategists wrote in a note. “

ZeroHedge further remarks, “As was well-telegraphed – and despite The White House’s sabre-rattling – OPEC+ JMMC has recommended the cartel to go ahead with a historic 2 million b/d production cut.

One delegate has confirmed this cut is from baseline levels. This means the production cut is less than 2 million b/d directly since current actual production levels are already below quota. However, it is still a sizable cut.”


Gold futures reversed sharply down to 1711.75 after testing the 50-day Moving Average at 1735.90 yesterday.  The retracement off the Master Cycle low lasted 4.3 days and the reversal may be the start of a 7-week decline.  The Cup with Handle formation becomes activated at the re-crossing of the Lip at 16.75.  In other words, sell the rally.


Posted in Published | Comments Off on October 5, 2022

October 4, 2022

10:10 am

The rally in equities may be an offshoot of the effort to keep banks liquified.  Most investors think that the banking crisis is a European problem.  It is not.  We just haven’t seen any domestic banks tell of their troubles…yet.  Earnings season is coming very soon.  A decline beneath the Lip of the Cup with Handle at 100.00 may be considered a sell signal.

EpochTimes reports, “My columns have turned rather apocalyptic of late, but for a valid reason. Just this week, we got confirmation that our financial system is, again, on the brink of collapse, when the Bank of England (BOE) was forced to enact, de facto, a bailout of the pension funds of the United Kingdom.

On Sept. 28, around noon, the Bank of England stepped (back) into the gilt markets and started buying government bonds with longer maturities to stop the collapse in their value, which could have caused the financial system to become unhinged. Pension funds were faced with major margin calls, which threatened to cause a rapidly cascading run on their liabilities, as trust in their liquidity and solvency would have become questioned by a widening circle of investors and customers.

Effectively, the BOE stepped in to limit the vicious circle of margin calls faced by pension funds because of the crashing values of the gilts.”

ZeroHedge observes, “here was a moment of levity this morning for those who opened Goldman’s research portal, Marquee, when the bank’s clients were greeted with an “encore” research report posting of the bank’s August 2 downgrade of Credit Suisse to Sell…

… a recommendation that has yield a return of over 25% in the past two months.

But lest Goldman be seen as actively seeking to push one of its biggest iBanking competitors into oblivion, the bank also sent out the following comment from its sales and trading desk on recent market color/conversations discussing Topic #1 in capital markets today: Credit Suisse. Here is an excerpt from the note sent out by Goldman’s Sarah Cha discussing the comments from Goldman London-based trade Jonathan Weetman, who weakness in the stock unwarranted  and explains why.”


10:00 am

SPX is fast approaching the intersection of the Broadening Top trendline and Short=term resistance at 3788.54.  This may lead to a 4-day decline targeting 3430.00.  This has been quite a short squeeze and has probably forced many shorts out of their positions.  It is also a perfect setup for a panic decline.  The market is inflicting pain on both sides as it purges the weak hands.

ZeroHedge remarks, “US equity markets are ripping-faces and taking names in the last 36 hours (post-OpEx), soaring 5-6% off Sunday night lows after pounging into the close on Friday (month- and quarter-end)…

However, make no mistake, put-fueled rallies (like this one) are violent, but unstable.

As SpotGamma explains this morning, if traders now come in and initiate call positions, that should lower volatility and create a base for a more sustainable rally.

However, there is nothing to stop this market from reverting and giving up all of these gains in 1 session.”


8:05 am

Good Morning!

NDX futures rose to 11460.50 in a possible attempt to overcome last week’s (Wednesday) high at 11546.90.  This short squeeze may be options driven, in order to inflict the most pain on options holders of both varieties.  Nonetheless, there is yet another probe down over the next week that may tag 9600.00.

In today’s op-ex, Max Pain is at 1190.00.  Long gamma lies at 11290.00, while short gamma lies at 11100.00.

ZeroHedge remarks, “Say hello to put puke

Nothing really new, but the crowd continues to load up on protection at local market lows, just in time when vols are very rich. Now comes the painful part where people realize “protection only costs money bro…”


Source: Tradingview

They call it range trading for a reason 

SPX is back inside the big range post the latest squeeze. Range trading is a special beast to trade, and most suck at buying when it “feels” the world is ending, and selling when it “feels” the only was is higher.”


SPX futures rose to 3749.10, exceeding last Wednesday’s high and completing a “point 5” in this reversal formation instead of “point 7” as I had mentioned earlier.  The implication is that SPX may target 3430.00, the same target as the Cup with Handle formation featured at the bottom of Wave A of Wave (1).   This should take place over the next week.  In the meantime, weak hands are being shaken out.

In today’s op-ex, Maximum Pain is at 3655.00.  Options are light, but tightly clustered so that long gamma begins at 3660.00 while short gamma begins at 3650.00.

ZeroHedge reports, ” Yesterday’s furious rally, which following a miserable September and Q3, was the best start to a quarter since 2009 and the best start of a Q4 since 2002 according to Bespoke …

… extended on Tuesday with S&P futures rising as much as 1.9% amid growing bets that we have seen the peak of the Fed’s hawkishness, sentiment which was boosted after the RBA unexpectedly hiked its Cash Rate Target by only 25bps to 2.60%, below the market’s 50bps expectation (having been the first central bank to warn that a pivot is coming a month ago), and sending the AUD and local bond yields tumbling while Australian stocks soared the most in two years! The sudden dovishness reverberated around the world, hammering the dollar for a second day, propelling European higher for the best day since June, sending the two-year Treasury yield plunging below the 4% mark and sending 10Y yields as low at 3.56%, almost half a percent below the 4% reached last Friday.  Oil advanced on expectations the OPEC+ alliance will deliver a substantial supply cut.”


VIX futures hit a low of 29.01 this morning as it may be completing its correction and preparing for the next probe higher.  It is likely that VIX may tag the Head & Shoulders neckline at 40.00 in the next week.  A breakout may be possible.

In tomorrow’s op-ex, Max Pain lies at 29.00.  Short gamma begins at 28.00 while long gamma starts at 30.00.  Should long gamma engage over the next week in a breakout, the following Wednesday’s options chain shows long gamma stretching to 70.00.


TNX continued its slide to a low of 35.62 this morning.  The Cycles Model suggests this to be a minor correction, with a possible target near the 50-day Moving Average at 31.58.  However, the Model suggests trending strength (returns?) on Thursday.


USD futures have pulled back to 110.71 as the correction continues toward the trendline or the 50-day Moving Average at 108.52.  The Cycles Model indicates a possible two more weeks of weakness before the rally resumes.


Posted in Published | Comments Off on October 4, 2022

October 3, 2022

3:30 pm

ZeroHedge observes, “Picking up on something we pointed out earlier, namely that after pricing in as much as 20bps of rate hikes in Q1, the market is now once again expecting a rate cut in the first quarter of 2023

… Bloomberg’s Tatiana Darie writes that “stocks are soaring and bond yields are plummeting… as traders dial back expectations for Fed tightening, again betting on a rate cut arriving as soon as May 2023. They risk being disappointed.”


11:50 am

On Thursday I noticed what appeared to be an Expanding Triangle which is evidence of intervention (higher high, lower low, higher high).   Point 5 is the high at 3736.74.  Point 6 is at 3584.13.  Point 7 is in process now.  It may go to 3700.00 or higher before the bearish pivot.  However, this may reinforce the target for the Cup with Handle formation.


6:30 am

Good Morning!

I have an engagement at 7:00 am that may last to 9:00 am, so here is an abbreviated pre-market comment.

SPX futures rose to 3608.20, testing the Lip of the Cup with Handle before resuming its decline.  It may be trapped under the trendline, so it is important to keep that in mind.  The decline may intensify over the week ahead.  The current illustration implies a decline to 3400.00.  However, an alternate view is even more bearish, especially because the bearish formations point to a much lower target.

ZeroHedge comments, “Since Fed Chair Powell unleashed his short-and-sweet uber-hawkish comments in late August at Jackson Hole, market expectations for The Fed’s terminal rate (cycle high before pause or cuts resume) has surged hawkishly (adding 100bps of hikes).

However, as the chart below shows, the last week – as UK chaos erupted and spread to US equity and bond markets – there has been s dovish shift in market expectations for just how hawkish The Fed will be able to get before everything goes pear-shaped…

Powell’s speech also triggered a total puke in equity markets as all that ‘hope’ for a ‘Fed Pivot’ was dashed (prompting the greatest quarterly loss after a 10% rise since 1938)…

All of which brings us to the latest Bear Traps note by Larry McDonald, who has argued for months that Powell cannot get Fed Funds to 350bps and that belief that The Fed can achieve $1T of QT balance sheet reduction in 12 months is a childish fantasy.”

9:00 am

In today’s op-ex Mas Pain appears at 3665.00, while long gamma begins at 3700.00 and short gamma starts at 3650.00.  There appears to be an effort in the morning futures to reach Max Pain.

ZeroHedge reports, “After a disastrous September, stocks have started off the new month of October – which at least historically tends to do much better than its predecessor – in extremely jittery fashion, with global stocks falling to a two-year low and US equity futures first sliding as much as 0.6%, before rising as much as 0.7% in what can only be described as an extremely illiquid market where Emini top of book liquidity is now at or below 1 million. Nasdaq futures were flat, as was the dollar while 10Y yields slumped perhaps in response to Mark Cabana’s latest note predicting a Fed “Twist” operation is on the horizon as the TSY market faces “breakdown.”


VIX futures declined to 31.25 over the weekend as it gathers strength for the next probe to the neckline at 40.00.  VIX is still underperforming relative to the decline in the SPX.  This may be a setup for a panic scenario, since investors are still talking about the “Fed pivot,” better known as the “Fed put.” There may be an attempt to push down the VIX as far as the 50-day Moving Average at 24.47, but it may not last.

In Wednesday’s op-ex, Max Pain is at 29.00, while short gamma lies just beneath it.  Long gamma begins at 32.50.


TNX continues its correction from its recent brush with 4.00%.  The Cycles Model suggests a strong uptick in Treasuries, but it may not last.  Rates may resume their climb by the end of the week.

ZeroHedge comments, “Well, it finally happened: what we’ve been warning for the past year, namely that the Fed’s aggressive rate hikes will break something…

did in fact break something, actually quite a few somethingsfirst the BOJthen the BOE (just maybe Credit Suisse), and as Bloomberg’s Garfield Reynold writes, Treasury 10-year yields are surging relentlessly higher in a way rarely seen, as they have “finally” realized the Fed’s resolve to tame inflation.”


Posted in Published | Comments Off on October 3, 2022

September 30, 2022

3:40 pm

SPX has made a new low and is challenging the Lip of the Cup with Handle formation.  We may see the SPX reach 3400.00 in the next week or so whether it closes above or beneath the trendline at 3610.00.

ZeroHedge relates, “After a Midsummer Night’s Dream in July, US stocks are convulsing all over again.

With speaker after Fed speaker hammering home the message of higher rates, the reality of higher discount rates is weighing on sentiment. The Fed’s dot plot shows us that a pause from rate hikes may not come before the benchmark reaches 4.6%, but of course that’s not a guarantee. But is it all really down to just the Fed pushing rates higher?

All that rate volatility stemming from the UK can have a bigger domino effect on assets as pension fund managers — stung by the fiasco of policymakers unveiling fiscal stimulus at a time when inflation is already running rife and wrecking their P&L — turning uber cautious with the other assets in their portfolio. Front and intermediate bond yields in the UK — which don’t enjoy the Bank of England’s backstop in its current emergency operations — are still climbing higher.

Meanwhile, Prime Minister Liz Truss and Chancellor Kwasi Kwarteng will reportedly hold emergency talks with the head of the Office of Budget Responsibility before being presented with a first draft of full forecasts from the fiscal watchdog next week. Still, it may make serve well to calibrate the sense of optimism that we have seen overnight in the pound.

Amid all this, the Fed must be hoping that all this tumult doesn’t impinge on US financial markets. However, it’s perhaps not entirely a coincidence that US investors are parking record amounts of cash with the Fed. Panic seems to be in the air.”


7:45 am

Good Morning!

The following article prompted me to bring up my monthly NDX chart which explains the hesitancy of the NDX to probe new lows until yesterday, when it matched the June 16 low.  Most analysts use moving averages divisible by 10, thus the 20, 50, 100-day moving averages.  The Cycles are similar, but divisible by 4.3.  This morning we see the NDX now beneath the 43 month moving average at 11512.00.  This support is now broken and the next support is the 86-day Moving Average at 8605.10.  Since the Cup with Handle formation target is 6821.00, this support may also be broken.

In the overnight markets, NDX futures rose to 11292.10, but then fell back.  It is currently near 11200.00.

In today’s op-ex, Max Pain is at 11310.00.  There appear to be no significant call contracts (long gamma), while short gamma begins at 11200.00. with clusters of puts every 50 points beneath that.

ZeroHedge comments, “The Nasdaq’s near-16% plunge since the middle of August has brought two critical thresholds back in focus. One of them is the June low that remains unbroken for now and the other is support from the 200-week moving average that successfully held a test by the last leg down.

The bellwether technology gauge has had a roller coaster third quarter — underlined by extreme volatility under the surface. The trough in June saw the index rally over 22% on investor expectations that the growing risk of a recession would force the Fed to pivot down from its aggressive tightening stance. Those gains were merely fleeting though, as a surging dollar along with rapidly rising rates globally saw investors quickly reassess those earlier bets, resulting in the gauge reversing its largest intra-quarter gains in history.

The index is now resting at the 200-week moving average which has provided support on several occasions historically, including the pandemic crash of 2020. Breadth wise, the percentage of members trading above the 200-day average was at 8% at Tuesday’s close, matching readings witnessed during the 2018, 2020 and the June 2022 lows.”


The SPX also closed beneath its 43-month moving Average at 3649.00.  SPX futures rose to 3680.50 in the overnight session, but has eased back down to the 43-month support.  A breakdown here suggests that the Lip of the Cup with Handle formation at 3610.00 may not deter the decline.  The weekly Cycle Bottom may come into play as the next support.

In today’s op-ex, Max Pain is at 3755.00 while long gamma may start at 3775.00.  Short gamma may begin at 3750.00.  While the expiring options are not heavily populated, they may cause difficulty for the dealers and hedge funds.

ZeroHedge reports, “If yesterday markets made little sense, when the dollar and yields slumped yet stocks and other risk assets tumbled alongside them in a puzzling reversal of traditional risk relationships (a move which was likely precipitated by the plunge in AAPL and KMX), today things are a bit more logical with the dollar initially extending its slide helping futures rise to session highs just below 3,700, before the dollar surged just after 5am as sterling tumbled after Bloomberg reported that Prime Minister Liz Truss’s government signaled it was sticking with its plan for tax cuts after a meeting with the UK’s fiscal watchdog, dashing market expectations that a policy U-turn might be imminent which has pushed cable briefly above 1.12 overnight, wiping out a week’s worth of losses. As a result, after rising as much as 0.8%, S&P futures were flat, up just 0.1%, the same as Nasdaq futures. Government bonds rallied across Europe and the US, as the dollar strengthened after reversing its earlier loss.”


VIX futures declined to 30.86 in the overnight session.  They have recovered somewhat, but not yet positive.  The next test for the VIX appears to be the Head & Shoulders neckline at 40.00.

Next Wednesday’s Max Pain is at 30.00, with long gamma above it, possibly as far as 80.00.


TNX resumed its decline in a short-term correction, but t may not last.  Today begins another period of strength for TNX that may last through the first week of October.  The Cycles Model implies a continued rally in TNX until mid-November.


USD futues bounced from the Cycle Top to an overnight high of 112.66 in a consolidation.  The Cycles Model indicates that the correction to the 50-day Moving Average may still be underway, with the next Master Cycle (low) coming in mid-October.  This may track investor money coming out of stocks and going into money markets.


BKX closed beneath its massive Head & Shoulders neckline at 97.00 yesterday.  This is very important.  Should it decline beneath its Master Cycle low at 95.18, we may see a phase-shift (waterfall decline) in the banking index, prolonging the decline through the end of October or mid-November.  Normally we might see a three-week rally, which is the alternate view.

ZeroHedge observes, “Yesterday, around the time all hell broke loose after the BOE bailed out the UK gilt market and prevented a Lehman moment that would have wiped out billions in UK pensions, we reported that the all important FRA-OIS indicator of interbank funding stress (and money-market risk), and general market liquidity – or lack thereof – was soaring and at last check was above 37bps, having exploded off ‘no stress’ levels just two weeks ago.

And while FRA-OIS barely moved today – stuck at ominously wide levels – another market stress/illiquidity indicator has started flashing red. As Bloomberg’s Edward Bolingbroke, who first spotted it, writes today “anyone doubting that liquidity is draining from the world financial system just has to look at the daily swings in interest-rate swaps.”


The Cycles Model calls for another two weeks of decline in the Ag Index, but I would suggest investors start accumulating (DBA) shares here.  The reason for the decline is decreasing liquidity, as reported above.  However, the reports on the 2022 harvest may start coming in, propelling the Ag Index to new all-time highs.  In the meantime, do your Thanksgiving food shopping early, as the following article informs us.

ZeroHedge reports, “If you love to cook, this upcoming Thanksgiving may be a real challenge for you.  Thanks to a resurgence of the bird flu, supplies of turkey are getting tighter and tighter.  Sadly, the same thing is true for eggs.  And as you will see below, reduced milk production is sending the price of butter into the stratosphere.  Thanks to soaring prices, a traditional Thanksgiving dinner will be out of reach for millions of American families this year, and that is extremely unfortunate.  Of course all of this is happening in the context of a horrific global food crisis that is getting worse with each passing day.  Yes, things are bad now, but they will be significantly worse this time next year.”

Note: I will be out most of the day, so good investing and rest up this weekend.


Posted in Published | Comments Off on September 30, 2022

September 29, 2022

3:15 pm

SPX may be bouncing off the trendline at 3610.00 at this time.  All indications are that the decline may continue, whether crossing the trendline before the close or overnight.

ZeroHedge comments, “To quote Jim Cramer, “they have no idea how bad it is out there” so here is some perspective of just how bad it is.

After yesterday’s BOE rally fizzled with a bang, only two S&P 500 stocks were up this morning, which means a whopping 99.6% were down at a time when the S&P was plumbing new 2022 lows, down nearly 25% from the January all time highs. And as Bloomberg goes on to note, we are at the fifth day this month where more than 90% of the S&P 500 is declining. In March 2020, there were six such days.

Not enough? To get a fuller sense of the absolute bloodbath out there, catalyzed today by the second consecutive mauling of AAPL, this time courtesy of a BofA downgrade…”


8:15 am

Good Morning!

SPX futures reversed down in the overnight session to 3663.70.  There are 7-9 days left to the bottom.  Under the scenario illustrated above, SPX may decline to a probable target of 3430.00, or lower.  The rationale behind this format is that Wave (1) of [1] is 704 points in length while Wave (1) of [3] is only 702 points!  A hard and fast rule is that Wave Threes can never be the shortest.  Under the scenario above, Wave (1) of [3] may be 895 points in length, approximately 27% larger than the first Wave (1).  By another measure, Wave A  was 12.9 days in length, while Wave C is only 11.4 days in length to the bottom thus far.  Again, in impulsive declines, Wave C cannot be smaller than Wave A.  In the illustrated scenario, Wave C may be up to 21.5 days in length.

ZeroHedge reports, “The brief post-BOE euphoria has worn off, and risk-off sentiment returned to markets as concern about inflation and the global economy overshadowed the Bank of England’s desperate attempt to restore calm by restarting QE, exacerbated by more hawkish central bank talk and defiance by British PM Liz Truss’s tax plan (which has been slammed from the IMF all the way to the White House). Treasuries resumed their slide with UK gilts, while US equity futures fell as European stocks extended a selloff that’s caused valuations to drop to their lowest since 2012. As of 730am, emini S&P futures slid 0.7% to 3704, recovering from losses as big as 1.5% earlier.”


VIX futures resumed its rally in the futures, reaching an overnight high of 32.30.  VIX is on the same Master Cycle as the SPX, only inverted.

ZeroHedge(TME) comments, “Mean reversion is king

Earlier this week () we reminded our readers that equities are stuck in a range and today, before the squeeze kicked in, we pointed out just how much fear was being priced by vol markets (). On Monday we wrote: “This is how it is supposed to feel; the world about to implode. SPX is down at June lows…” Ranges require the mean reversion mind and it hurts doing the contrarian, but this played out big time today. Max pain market continues…

Source: Refinitiv

Did they do it again?

The crowd loaded up on puts as fear took over…SPX has done nothing since Friday basically, so those puts bough in panic have managed losing a lot of value already…”


TNX futures rallied to an overnight high at 38.68, but eased back down as the morning progressed.  It may not hold above the Cycle Top at 37.90 as it corrects lower.  However, the Cycles Model shows that something is “cooking” over the weekend that may cause TNX to break higher into the week of October 10.

ZeroHedge reports, “Well this is not going to help fight inflation…

The number of Americans filing for jobless benefits for the first time dropped back below 200k last week (193k) – the lowest number since April…

Continuing Claims also fell to its lowest in 3 months.

Fed Chair Powell will not be happy that his cunning plan to fight inflation by easing the tightness in the labor market – by raising rates and crushing the economy – does not seem to be working.”

ZeroHedge (TME) explains, “There is no treasury liquidity

Market depth had improved modestly coming out of the Labor Day holiday, but has retraced lower over the last week, underscoring relatively depressed liquidity conditions…

Source: JPM

Footprints of treasury trades double vs 1 year ago

Price impact in the treasury market has moved higher, indicating the footprint of each trade in the Treasury market has risen.”


USD futures bounced of the Cycle Top support at 112.27, rising to 113.71 this morning.  It appears to have completed its Master Cycle yesterday, on day 258.  If correct, there may be a correction lasting up to three weeks and a decline to the 50-day Moving Average at 108.23.


Posted in Published | Comments Off on September 29, 2022