
3:15 pm

SPX may be bouncing off the trendline at 3610.00 at this time. All indications are that the decline may continue, whether crossing the trendline before the close or overnight.
ZeroHedge comments, “To quote Jim Cramer, “they have no idea how bad it is out there” so here is some perspective of just how bad it is.
After yesterday’s BOE rally fizzled with a bang, only two S&P 500 stocks were up this morning, which means a whopping 99.6% were down at a time when the S&P was plumbing new 2022 lows, down nearly 25% from the January all time highs. And as Bloomberg goes on to note, we are at the fifth day this month where more than 90% of the S&P 500 is declining. In March 2020, there were six such days.
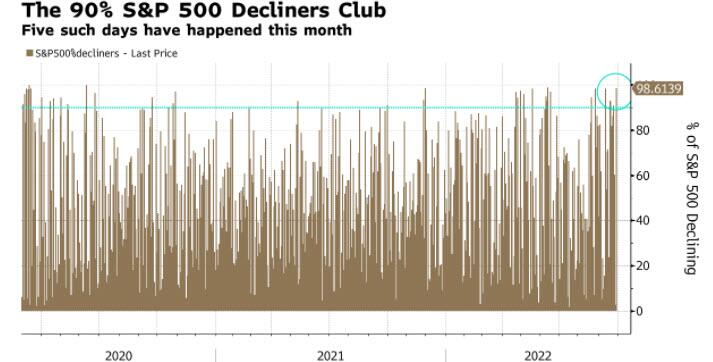
Not enough? To get a fuller sense of the absolute bloodbath out there, catalyzed today by the second consecutive mauling of AAPL, this time courtesy of a BofA downgrade…”
8:15 am

Good Morning!
SPX futures reversed down in the overnight session to 3663.70. There are 7-9 days left to the bottom. Under the scenario illustrated above, SPX may decline to a probable target of 3430.00, or lower. The rationale behind this format is that Wave (1) of [1] is 704 points in length while Wave (1) of [3] is only 702 points! A hard and fast rule is that Wave Threes can never be the shortest. Under the scenario above, Wave (1) of [3] may be 895 points in length, approximately 27% larger than the first Wave (1). By another measure, Wave A was 12.9 days in length, while Wave C is only 11.4 days in length to the bottom thus far. Again, in impulsive declines, Wave C cannot be smaller than Wave A. In the illustrated scenario, Wave C may be up to 21.5 days in length.
ZeroHedge reports, “The brief post-BOE euphoria has worn off, and risk-off sentiment returned to markets as concern about inflation and the global economy overshadowed the Bank of England’s desperate attempt to restore calm by restarting QE, exacerbated by more hawkish central bank talk and defiance by British PM Liz Truss’s tax plan (which has been slammed from the IMF all the way to the White House). Treasuries resumed their slide with UK gilts, while US equity futures fell as European stocks extended a selloff that’s caused valuations to drop to their lowest since 2012. As of 730am, emini S&P futures slid 0.7% to 3704, recovering from losses as big as 1.5% earlier.”


VIX futures resumed its rally in the futures, reaching an overnight high of 32.30. VIX is on the same Master Cycle as the SPX, only inverted.
ZeroHedge(TME) comments, “Mean reversion is king
Earlier this week () we reminded our readers that equities are stuck in a range and today, before the squeeze kicked in, we pointed out just how much fear was being priced by vol markets (). On Monday we wrote: “This is how it is supposed to feel; the world about to implode. SPX is down at June lows…” Ranges require the mean reversion mind and it hurts doing the contrarian, but this played out big time today. Max pain market continues…

Source: Refinitiv
Did they do it again?
The crowd loaded up on puts as fear took over…SPX has done nothing since Friday basically, so those puts bough in panic have managed losing a lot of value already…”

TNX futures rallied to an overnight high at 38.68, but eased back down as the morning progressed. It may not hold above the Cycle Top at 37.90 as it corrects lower. However, the Cycles Model shows that something is “cooking” over the weekend that may cause TNX to break higher into the week of October 10.
ZeroHedge reports, “Well this is not going to help fight inflation…
The number of Americans filing for jobless benefits for the first time dropped back below 200k last week (193k) – the lowest number since April…

Continuing Claims also fell to its lowest in 3 months.
Fed Chair Powell will not be happy that his cunning plan to fight inflation by easing the tightness in the labor market – by raising rates and crushing the economy – does not seem to be working.”
ZeroHedge (TME) explains, “There is no treasury liquidity
Market depth had improved modestly coming out of the Labor Day holiday, but has retraced lower over the last week, underscoring relatively depressed liquidity conditions…
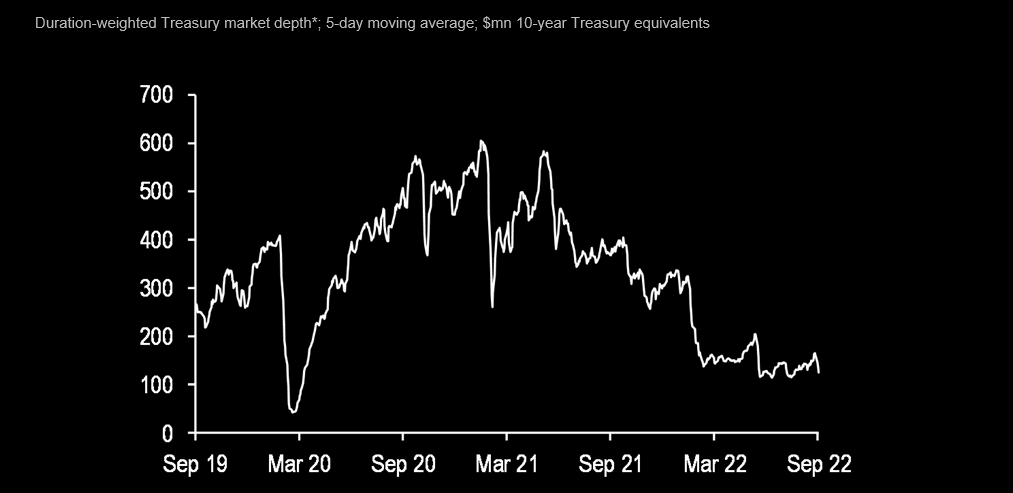
Source: JPM
Footprints of treasury trades double vs 1 year ago
Price impact in the treasury market has moved higher, indicating the footprint of each trade in the Treasury market has risen.”

USD futures bounced of the Cycle Top support at 112.27, rising to 113.71 this morning. It appears to have completed its Master Cycle yesterday, on day 258. If correct, there may be a correction lasting up to three weeks and a decline to the 50-day Moving Average at 108.23.