November 22, 2023

8:10 am

Good Morning!

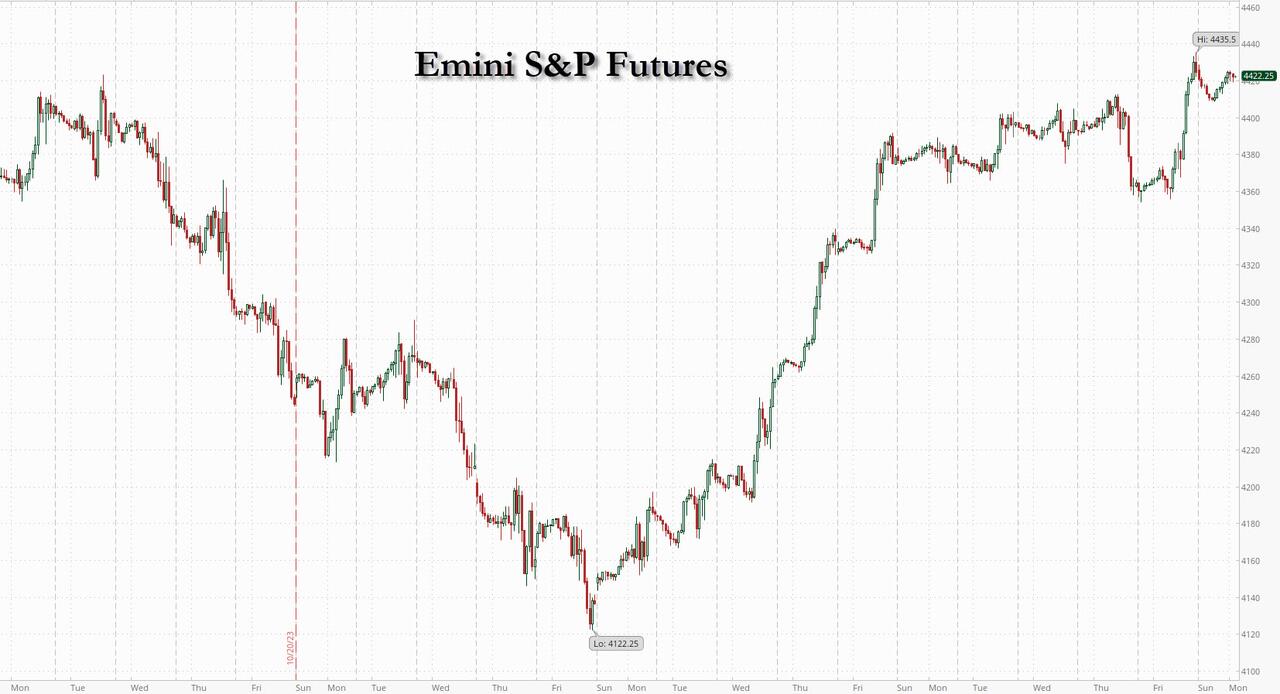
NDX futures rose to 16011.00 this morning as the index continues to consolidate beneath Monday’s high at 16056.76.  Yesterday’s action may have caused an island reversal, leaving a gap between Tuesday’s open at 15951.00 and Monday’s close at 16027.06.  Should the gap be filled, the NDX may go higher.  However, today is day 254 in the Master Cycle, so time is running out.  In addition we have Thanksgiving holiday on Thursday and a half-day market on Friday.  Today may tell us whether the rally is over or not.

Today’s options chain shows fierce competition between longs and shorts between 15925.00 and 15950.00.  Long gamma starts at 16000.00 while short gamma begins at 15900.00.

ZeroHedge observes, “They are long up here

Non dealers US equity futures positioning is rather long again. We have seen slightly longer positioning, but the brutal move since the crowd was short has been extreme.”


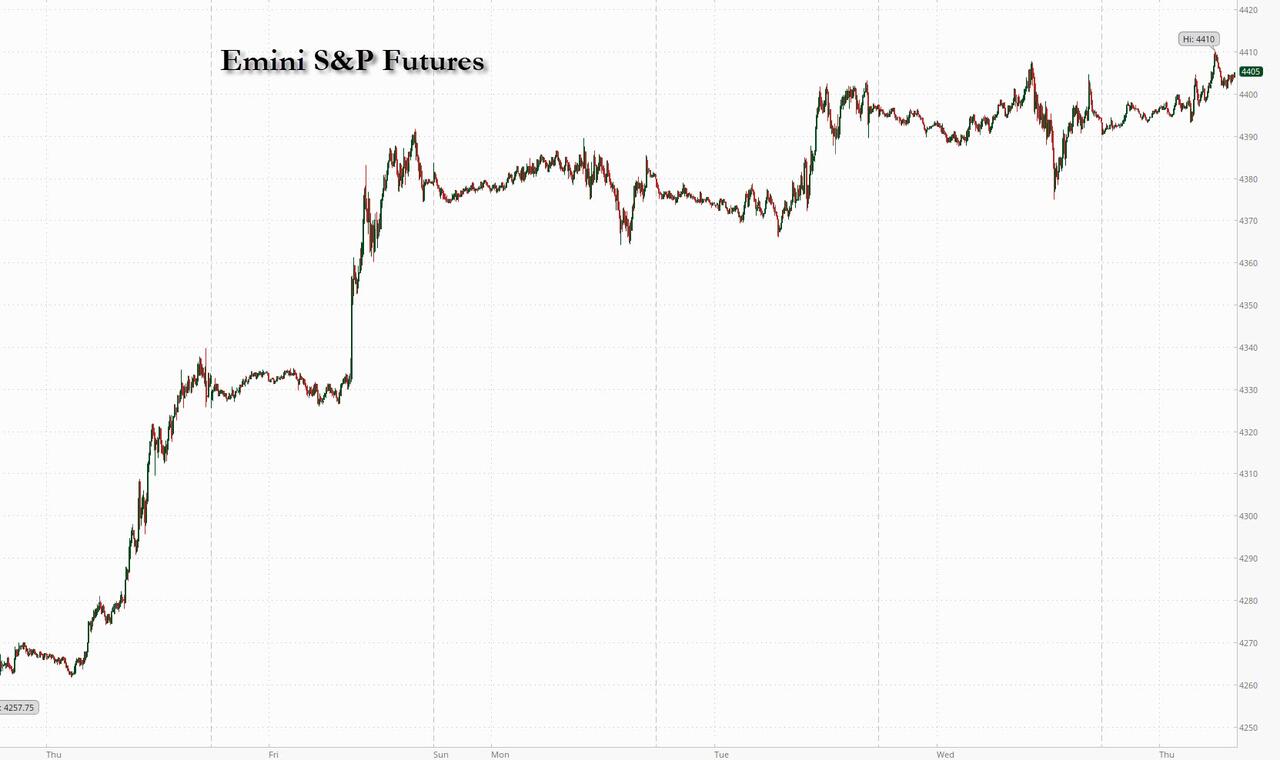
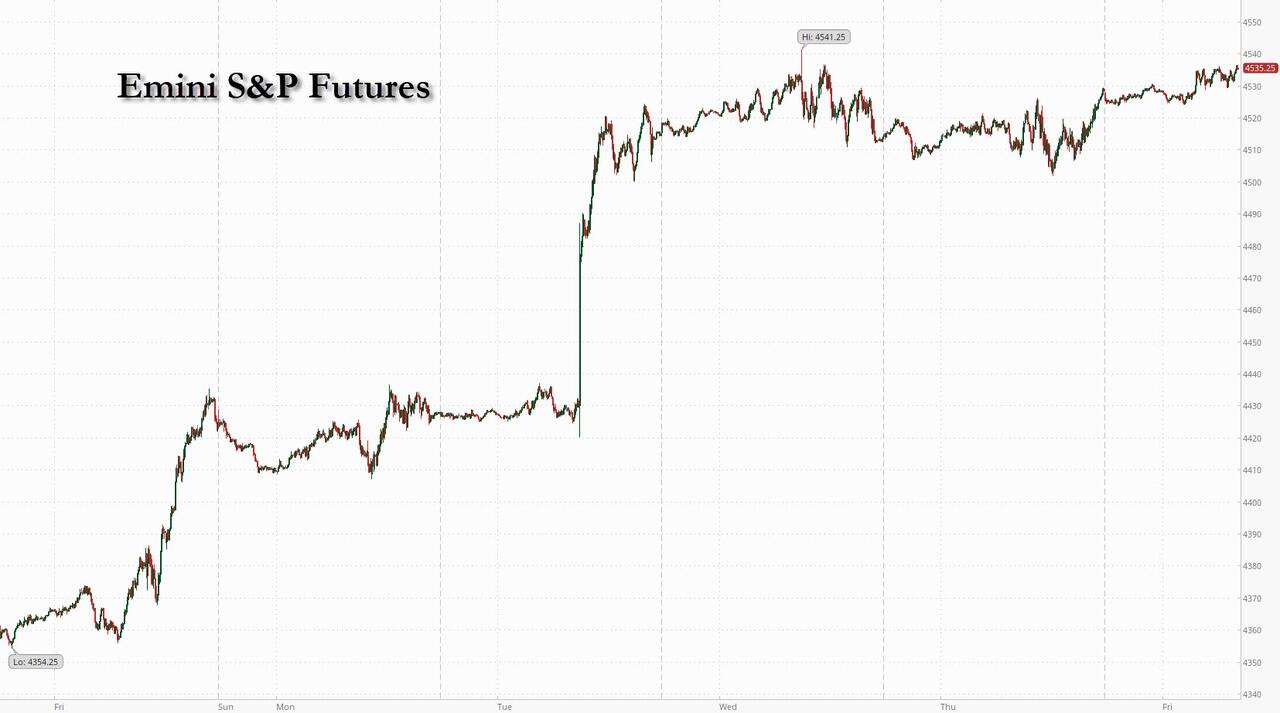
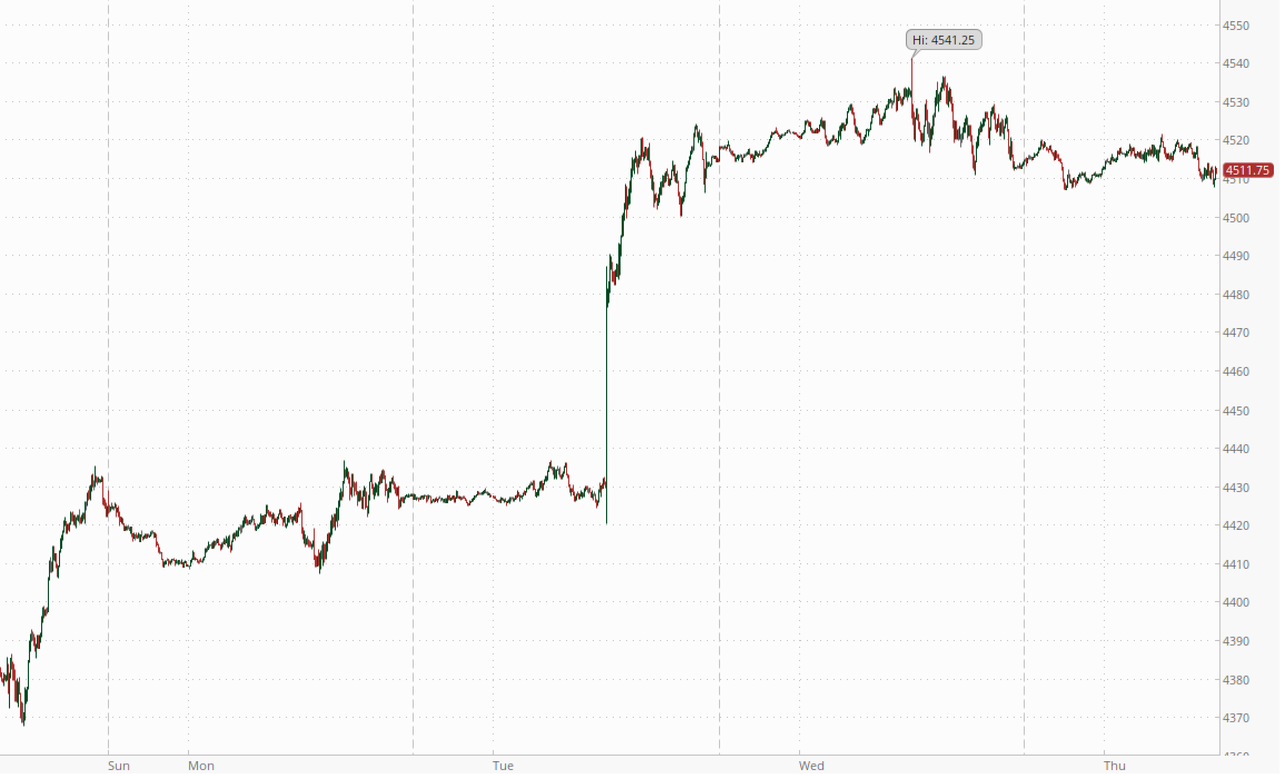
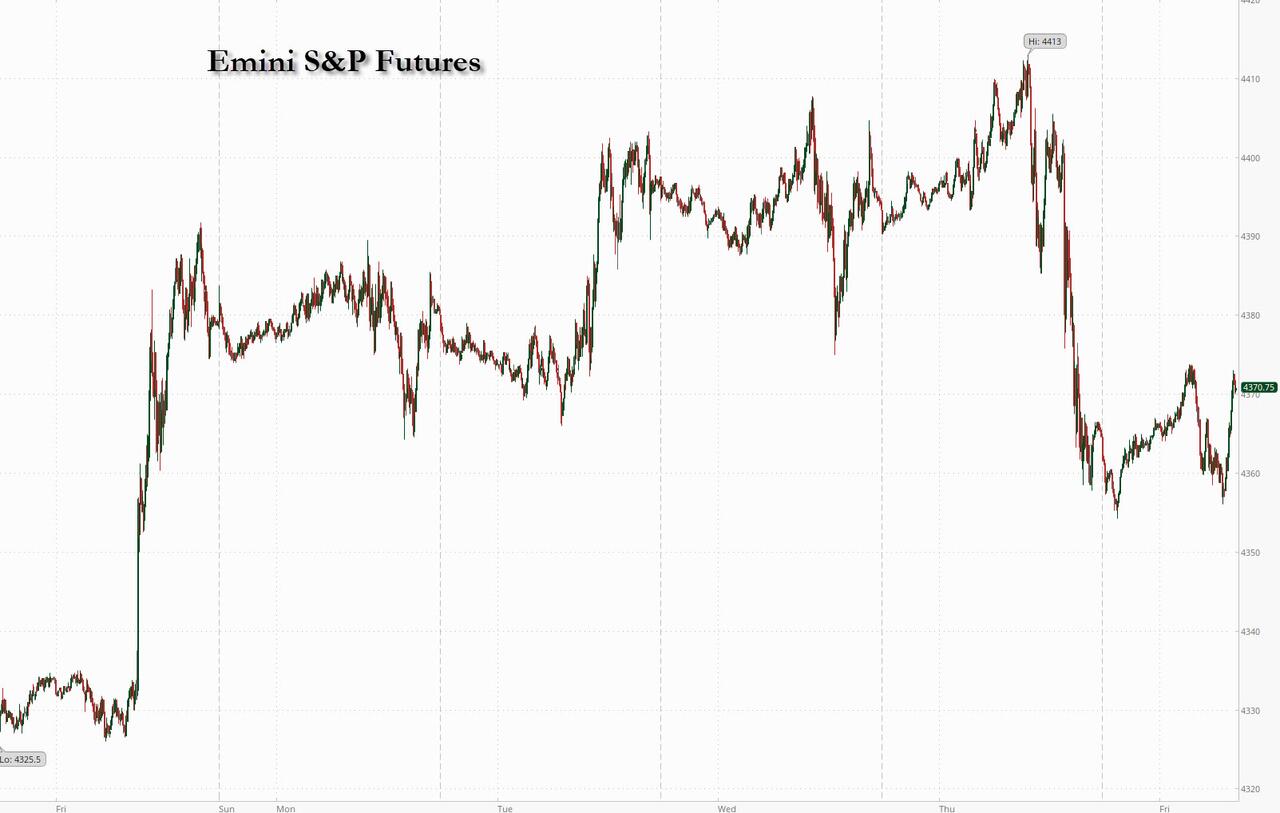
SPX futures have climbed to 4553.10 thus far this morning.  Dealers and institutions are attempting to re-ignite the rally going into Thanksgiving.  Remember, institutions start the market day, then sit back and observe what retail investors do with their “signals.”  The final outcome is the close, where all the activity is netted out.  Today is day 254 in the Master Cycle.  Time is starting to run out for the bulls.  One may consider an aggressive short position beneath 4500.00.

Today’s options chain shows Max Pain at 4525.00.  Long gamma starts at 4550.00 while short gamma rears its head at 4520.00 and becomes very persistent beneath 4500.00.

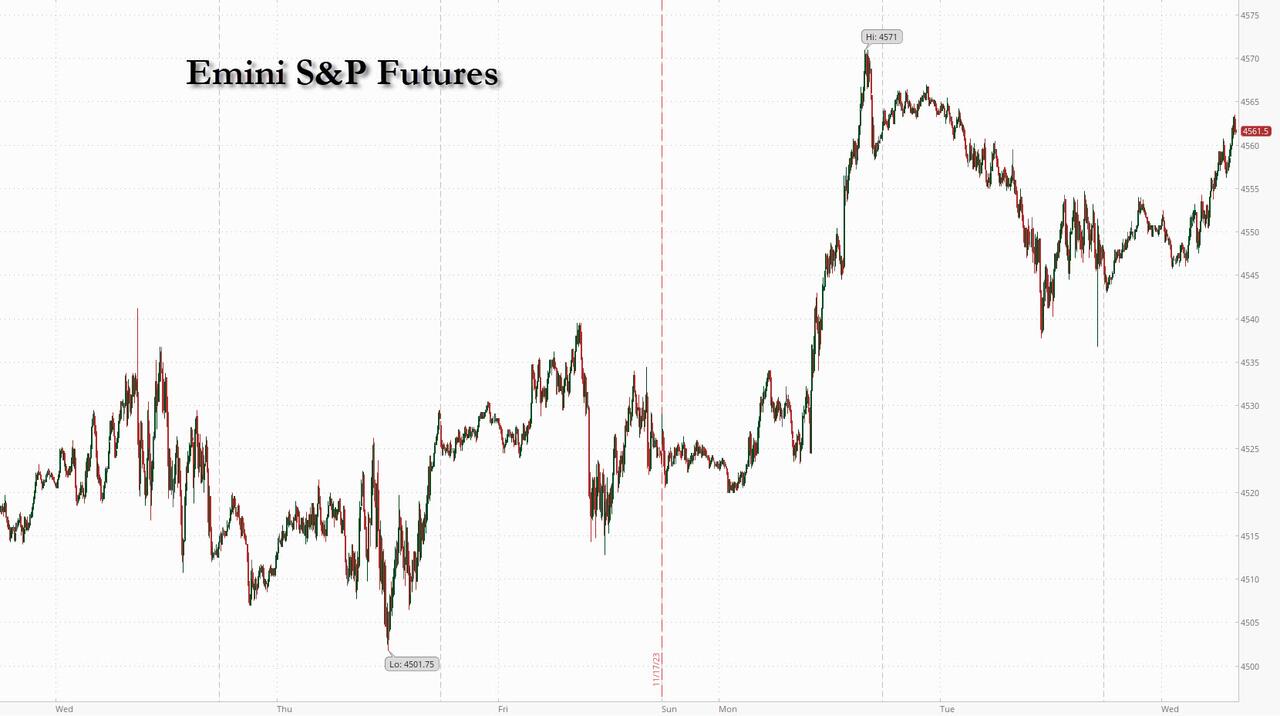
ZeroHedge reports, “Futures reversed earlier losses and traded at session highs as bond yields slid to two-month lows and oil tumbled after Bloomberg reported that the OPEC+  meeting scheduled for this weekend could be delayed amid Saudi dissatisfaction with member production levels. As of 7:40am ET, S&P futures rose 0.24%, trading at 4,562 and Nasdaq futures gained 0.4% as Wall Street headed for one of the best November rallies on record. Nvidia pared a decline in pre-market trading after investors initially reacted coolly to its latest quarterly report; the stock traded in a 6% range last night when its Q4 guidance was in the middle of the whisper range. Microsoft gained about 0.7% as Sam Altman returned to OpenAI after days of drama. The decision to restore him to the world’s best-known artificial intelligence startup marks a victory for biggest backer Microsoft, which worked with fellow investors to reverse Altman’s firing. Treasury yields dipped to two-month lows at 4.37%, while the USD rebounded from its weakest level in almost three months; commodities are under pressure ex-metals; gold remained just over $2000 as bitcoin recovered some of its overnight losses that dragged it below 35,000 following news of the Binance/CZ fine and settlement. News of a temporary halt in fighting between Israel and Hamas failed to ignite broader risk-on sentiment, with investors instead looking to data including mortgage apps, jobless claims, durable- and capital-goods orders and consumer sentiment, for clues on the direction of monetary policy.  ”


VIX futures sank to a new low at 12.96 this morning.  Today is also day 254 in the Master Cycle.  Since VIX trades in smaller volumes, it can be easily manipulated.  However, that does not extend beyond the end of the Cycle, which is upon us.

Today’s options chain shows Max Pain at 13.00-13.50.  The shorts have an advantage at 13.50, but there is no follow-through.  Long gamma starts at 16.00 and extends to 30.00.

ZeroHedge comments, “Record gamma. Record boring

1. GS has dealers long $7.1bn of SPX gamma at spot, the second highest reading since 2022.

2. The cash equity desk at GS says they were 2 on 1 –10 scale in terms of overall activity levels

3. Another slow day on the derivatives side as 28.96mm total options traded, the 3rd lowest volume YTD (42.63mm avg)”


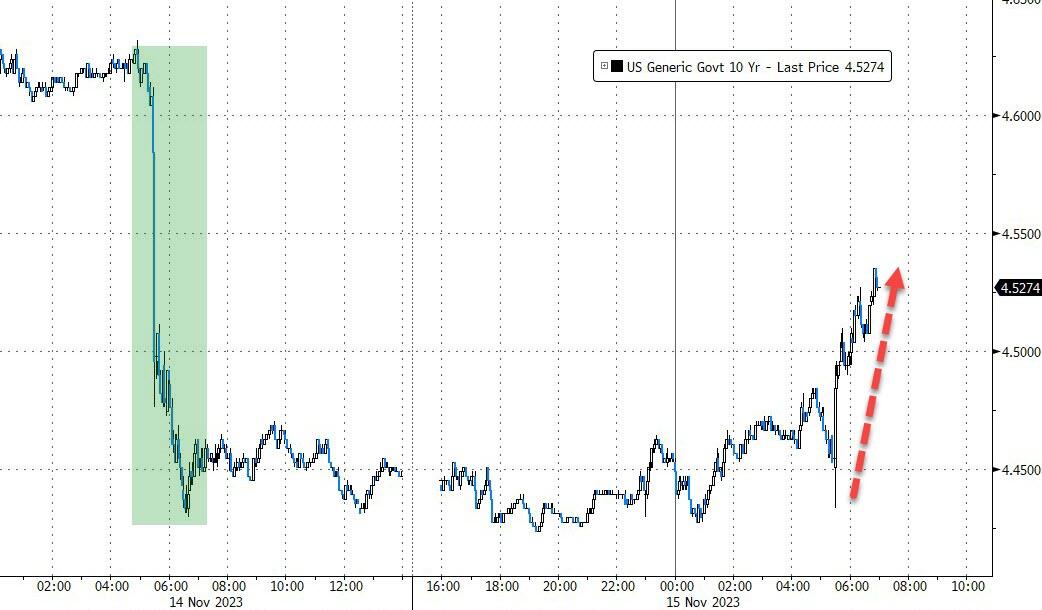
TNX sank to a new low at 43.65 this morning.  However, it bounced immediately back to the trendline.  Today is day 251 in the current Master Cycle.  The Cycle normally may have a week to resolve.  However, TNX is putting on the finishing touches to an ending diagonal, signaling the end to this decline.  Those expecting rate cuts may be mightily surprised.

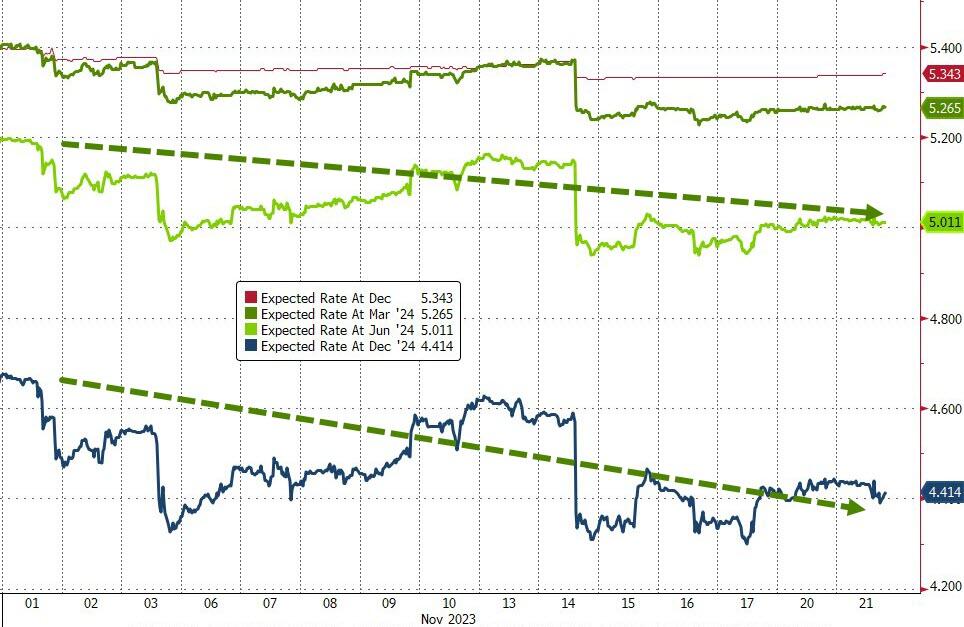
ZeroHedge remarks, “Since the last FOMC meeting, on November 1st, the dollar has tumbled over 3% sending stocks, bonds, and bitcoin all higher (and gold, though only marginally)…

Source: Bloomberg

Rate-change expectations have shifted significantly more dovish with more rate-cuts priced-in sooner in 2024 (with nearly 100bps of cuts priced-in for next year)…”


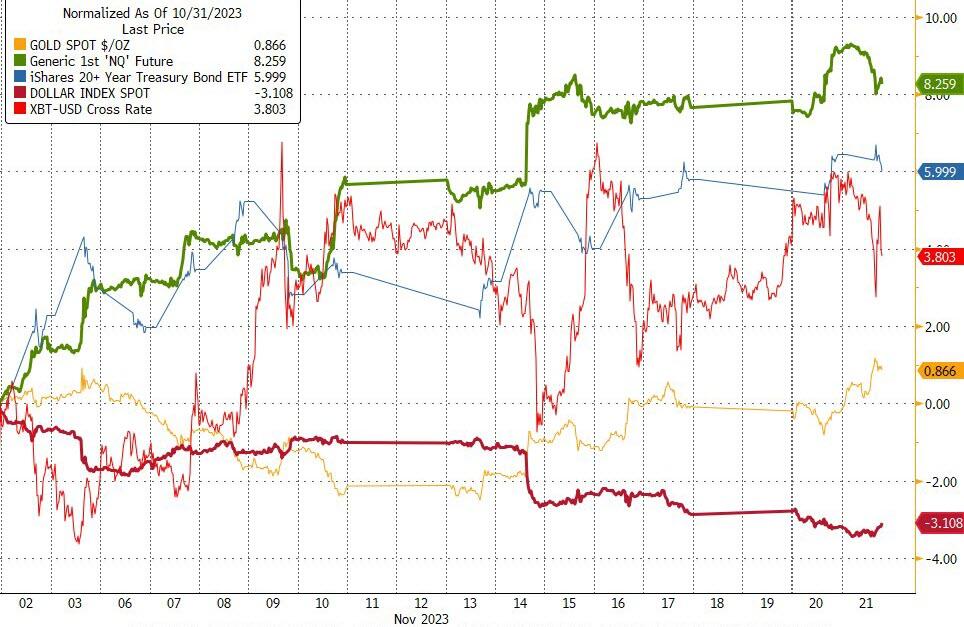
USD futures consolidated this morning, after rising above the 200.day Moving Average at 103.43.  This puts the USD back on a buy signal.  This may be a signal to bonds and equities that all is not well.  Money flows are paramount in determining the market direction.  Although some of these flows may be coming from foreign locations, the rising USD may indicate weakness in the markets.


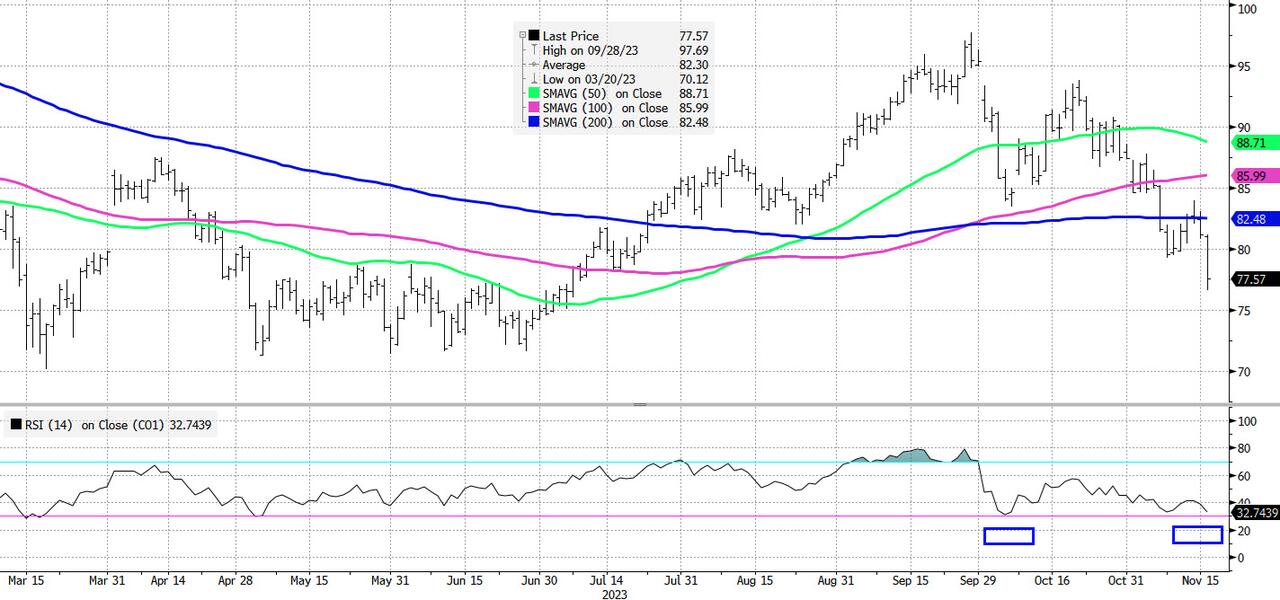
Crude oil declined to 74.08 after being repelled by the mid-Cycle resistance at 78.21.  The decline may continue to early December.  The target for this decline may be the Cycle bottom at 66.21.  More serious trouble may develop should it cross beneath the March low at 63.57.

ZeroHedge remarks, “Oil prices are lower this morning as the usual malarkey of leaks, rumors, and denials dominates price action ahead of the planned OPEC+ meeting this weekend.

The selling started with a report by Bloomberg claiming that the Saudis expressed dissatisfaction with other members about their oil production levels.

The worry, Bloomberg claims, is that Riyadh might reverse its unilateral 1 million barrel-a-day curb if its counterparts don’t contribute further to the supply reductions.

That sent prices lower.”


Posted in Published | 3 Comments

November 21, 2023

8:30 am

Good Morning!

NDX futures slid beneath 16000.00, declining to 15975.00.  Today is day 253 in the Master Cycle, leaving an approximate week of possible gains in the rally.  The Cycles Model suggests that, should the rally use this time, it may rise to 17000.00.  However, the Cyclical turn may happen at any time.

There are several reasons for this possibility:

First, it has bounced above the 1987 trendline in 2020 and in 2022.  The trendline gives support until it is broken.  The SPX only briefly broke above the trendline in 2021 and then fell back beneath it in April 2022.  The trendline acted as resistance in July 2023 for the SPX.  It hasn’t risen above it since.  That explains the relative strength of the NDX and its outperformance VS. the NDX.

Second, the relative strength has been concentrated only among the seven largest Tech companies.  This gives even more outstanding performance among those seven.

Third, the size of these formations are at a Cycle and Super Cycle Degree, measured in years.  For example, Super Cycle Wave (b)  is approaching 21.5 years old and is due for a change.  Cycle Wave c now measures 13.5 years.  It is now due for a 4-year decline  These are known as secular Waves, not Cyclical Waves, because they are so large and last so long.  Compare that to the commonly used Trading Cycle, which only lasts 60 days.

Today’s options chain shows long gamma is fading.  Short gamma begins at 16050.00.

ZeroHedge comments, “Tech needs to take out this high

We are kicking the tyres on tech post the 2-year anniversay of the ATH. To really celebrate we would want to take out this ulitmate level below. February 2000…..we are coming for you.

Source: Bilello

We are going to need a bigger word

Magnificent is not doing this group justice.

• Mag 7: +105%

• S&P 500: +19%”


SPX futures have declined to a morning low at 4534.60.  Michael Hartnett called the bottom accurately and now he suggests “fading 4550.00”.    SPX may linger near the top for the rest of the week, but there are no guarantees that it will stay there.

Today’s options chain shows Max Pain at 4540.00.  Long gamma may begin at 4560.00, while short gamma starts strongly at 4530.00.  Based on the options market, the SPX may not be capable of further rally should it decline beneath 4500.00.


VIX futures are testing yesterday’s trading high at 13.69.  The decline may be complete, or nearly so.  There is a tendency for the VIX to reverse in advance of the SPX, so should tat event happen, you will be informed.  The Cycles Model suggests that, once the rally is underway, it may last until mid-January.

Tomorrow’s options chain shows virtually no short gamma.  Long gamma explodes on the scene at 14.00 and extends to 30.00.


TNX is riding the trendline near 44.00 this morning.  The decline appears complete at day 250 in the Master Cycle.  We may see TNX linger at the trendline for a few more  days.  This weekend may be the the turning point for all indices.

ZeroHedge reports. “We knew that going into this week’s holiday-shortened week liquidity would be challenging; but nobody expected it to be this bad: moments ago the Treasury sold 20Y bonds in a solid auction with decent bidside demand, and while this was a far cry from the recent “catastrophic” 30Y auction, the market reaction was as if the Fed has resumed QE, with yields tumbling across the board and stocks suddenly surging to session highs amid a burst of program buying. More on that in a second.

First, the details of the auction: pricing at a high yield of 4.78%, this was not only the first time since March that the yield in the 20Y auction has fallen sequentially, but it was also well below last month’s 5.245%. It also stopped through the When Issued 4.79% by 0.1 basis point, making this the third consecutive stop through in a row.

The Bid to Cover was solid if hardly remarkable: printing at 2.58 it was in line with last month’s 2.59 if below the recent average of 2.67%.”


Posted in Published | 3 Comments

November 20, 2023

8:20 am

Good Morning!

SPX futures are consolidating beneath Wednesday’s high on day 247.  Today is day 252, leaving this week as a possible turn window, if not already.  Seasonality may keep SPX elevated this week.  However, the index is vulnerable to an abrupt change, as the rally has run out of shorts to take behind the wood shed.  Stay alert, as a probe higher may result in a key reversal.  Overhead resistance may lie at the August high at 4541.25.

Today’s options chain shows 4510.00 to offer Maximum investor Pain.  Long gamma starts at 4530.00, while short gamma begins at 4500.00.

ZeroHedge reports, “US stock futures erased earlier losses to trade flat as Microsoft gained 2% in premarket trading, sending it to a new all time high, after it said Sam Altman will lead the software developer’s new in-house artificial intelligence team. The OpenAI co-founder was ousted from his startup last week.”


VIX futures broke above Friday’s trading range, hitting 14.31 this morning.  Friday’s low occurred on day 249.  An early Master Cycle low is anticipated, but the evidence is not yet clear.  A breakout at 15.57 may offer an aggressive buy signal.

Wednesday’s options chain shows no short gamma, while long gamma may begin at 14.00, which may give reassurance to early aggressive longs.

ZeroHedge observes, “.Natural floor

Volatility is a mean reverting asset. The most recent spike is gone and we are approaching some sort of “natural floor”. We are not saying volatilities must spike from here, but we are approaching levels of volatilities where there is little further downside. Using relatively cheap optionality here is attractive. Replace longs with cheap upside calls or call spreads. Hedge the long book with downside hedges etc.”


TNX has moved higher this morning, putting the markets on edge.  Friday’s potential Master Cycle low occurred on day 249.  Today is day 252.  The first breakout level and short-term resistance occurs at 45.59.  The 50-day Moving Average is at 46.17, where a confirmed buy signal may be made.

ZeroHedge notes, “The 10 year

The US 10 year broke below the bigger trend line a few sessions ago. Note we almost touched the 100 day (4.33%) today. The HS flagged recently is big, but things seldomly move in a straight line. We need to see much more “frustration” if this is a top. The 200 day is down around the 4% area…”


USD futures challenged the 200-day Moving Average at 103.42 this morning and has risen above it.  Today is day 257 of the current Master Cycle.  It is due for an imminent reversal.  A reversal may show money flows coming out of bonds and equities into cash as a safe haven.


Posted in Published | 2 Comments

November 17, 2023

10:36 am

BKX, our liquidity proxy, is probing near the 61.8% Fibonacci retracement level at 83.18.  It has exceeded the mid-Cycle resistance at 81.61, which may be used as a sell signal on the way lower.  The Cycles Model proposes three intense declining weeks ahead, through the first week of December.  BKX is poised to do a repeat of the march panic decline, with possibly more serious ramifications.  The trap may be about to be sprung.

ZeroHedge sounds the alarm, “Money-market funds saw inflows for the 4th straight week (since the biggest outflow since Lehman), adding $21.9BN to reach a new record high of $5.73TN…

Source: Bloomberg

In a breakdown for the week to Nov. 15, government funds – which invest primarily in securities like Treasury bills, repurchase agreements and agency debt – saw assets rise to $4.68 trillion, an $18.9 billion increase.

Prime funds, which tend to invest in higher-risk assets such as commercial paper, meanwhile, saw assets climb to $932 billion, a $5.6 billion increase.”


9:45 am

The Ag Index may be testing the 50-day Moving Average at 397.65 prior to launching a larger rally.  The Cycles Model suggests that GKX may rally until mid-December in this Cycle.  By then, GKX may have broken out of its downtrend.  This is a great time to accumulate shares as this may be the beginning of a multi-year rally in this index.

ZeroHedge notes, “Food is the palate’s poetry, the body’s fuel, and a shared language transcending cultures… when people can afford it.

As Visual Capitalist’s Pallavi Rao details below, the World Health Organization found that the COVID-19 pandemic and war in Ukraine pushed 122 million more people into food insecurity between 2019 and 2022. Higher food prices, combined with increasing poverty, have resulted in rising food unaffordability, especially in certain regions of the world.

ℹ️ A person is food insecure when they lack regular access to enough safe and nutritious food for normal growth and development and an active and healthy life.”


7:30 am

Good Morning!

US Tech futures are consolidating beneath the November 15 high, waiting for a directional signal.  A decline beneath 15738.00 may signal a reversal is at hand and offer an aggressive sell signal.  Beneath that is the open gap to 15535.00 where the next support may lie.  Short term support lies at 15300.00, while the 100-day Moving Aerage lies at 15130.00.  A difficult spot to be bearish.

Today’s options chain (AM expiration) shows Maximum Investor Pain at 15430.00.  Long gamma may start at 15450.00 and strengthens at 15460.00, while short gamma begins at 15400.00.

ZeroHedge observes, “CTAs: Boom!

“Over the last 10 days CTAs have bought nearly $70bn of US equities… this is the largest 10d buying we have on record. Data goes back to 2016…”

Source: GS

Big cap love

One thing is sure, you are not early on this trade post the latest melt up. We have just seen the biggest inflow since Feb 2022.”


SPX futures rose to a new retracement high at 4522.60.  The next level of resistance is the August high at 4541.25 for the final probe.  Today is day 249 in the current Master Cycle and monthly options expiration that may bring out the 0DTE traders.

Today’s options chain (AM expiration) shows Max Pain at 4350.00.  Long gamma starts at 4400.00. In other words, there may be enough options delta to raise the SPX.  The pm expiry may be less bullish.

ZeroHedge reports, “US equity futures rose and bond yields fell as the historic squeeze that started more than two weeks ago among the systematic and hedge fund communities is still going on after this week’s soft inflation and jobs data fueled conviction that aggressive tightening are finally at an end. As of 8:00am, S&P futures were 0.3% higher while Nasdaq futures rose 0.1%, both on course for a third weekly gain after Joe Biden signed the stopgap bill to extend government funding into early 2024 late last night, kicking a politically-divisive debate over federal spending into a presidential election year. Europe’s Stoxx 600 index jumped 1%, on track for an almost 3% rally this week. Asian stocks declined as Alibaba Group scrapped plans to spin off and list its $11 billion cloud business, dragging Chinese shares lower. Bonds climbed, putting the US 10-year yield on course to drop more than 25 basis points this week as markets now price a full percentage point of rate cuts next year from the ECB; the dollar slumped as the yen spiked to the highest level since Oct 31. Oil is headed for a fourth weekly loss after sinking into a bear market, in part as supply exceeds expectations. ”


VIX futures are consolidating near the low.  Today is day 249 in the Master Cycle.  Support lies near 13.50.

Wednesday’s options chain reveals no short gamma.  Options turn long at 14.00, while long gamma may begin at 18.00.


TNX probed lower this morning, with futures dipping to 43.81, to 44.04, testing the lower trendline of the trading channel.  Today is day 246 in the Master Cycle, so I cannot rule out lower probes in this Cycle.  However, Monday may show a burst of strength, indicating a possible final low and reversal, if not accomplished today.

Investing.com comments, “U.S. stocks finally stopped falling yesterday following data indicating a slowdown in job growth, which alleviated concerns about the Federal Reserve’s monetary policy direction and put a halt to the recent surge in bond yields.

Still, strategists at Barclays warn that the bond market is likely to continue selling off, which will likely send stocks further lower.

“We do not see a clear catalyst to stem the bleeding,” the strategists wrote in a note.”


Crude oil futures consolidated in place after yesterday’s massive move.  Today is day 255 in the Master Cycle, leaving only a few days of the decline left.  What follows may only be a two week correction before another decline resumes.  Crude is in a dynamic state right now.  It is often a leading indicator of both the economy and the stock market.

ZeroHedge observes, “Tons of questions on the weakness in Crude – Thoughts from our trading desk: believe the move is more of a “catch-up” to weaker physical markets as we moved past WTI options expiration yesterday & as Middle East risk premium has now come out of the market in our view.

Bigger picture:

  • Margins have remained weak for a while
  • OPEC continues to export
  • Spreads & DFLs have been signaling weaker fundamentals for several days now”

Brent breaking through the 200dma…approaching oversold levels (RSI 32.7)…


Posted in Published | 6 Comments

November 16, 2023

8:00 am

Good Morning!

US Tech futures are lower this morning, to 15757.00.  Be aware that there is minor support at 05725.00, beneath which no support can be found to 15535.00.  This may lend itself to a gap down, leaving an island reversal in the next couple of days.  Yesterday’s high at 15904.63 has not overtaken the July 13 high at 15932.06, leaving a potentially bearish outcome.  This structure is known as a leading diagonal.

Today’s options expiration shows Maximum Investor Pain at 15680.00.  Options are a mixed bag with long gamma starting at 15900.00, while short gamma begins at 15650.00.

ZeroHedge remarks, “Tech vs rates – the Jaws gap

Tech started trading the rates “connection” this summer, but note that NASDAQ has recently decoupled from the US 10 year (inverted). Tech’s overshoot here is somewhat “concerning”.

Source: Refinitiv

Are we decoupling from the bond volatility narrative?

Up until now calmer bond volatility has been key for equities. This relationship has broken down lately…especially when it comes to NASDAQ. Chart shows NASDAQ vs MOVE (inverted).”


SPX futures slipped beneath 4500.oo this morning, reaching a low of 4490.00.  Tomorrow is monthly options expiration, so I don’t expect a large move today.   Critical support lies at 4458.00, the top of the November 14 gap (up).  Today is day 248 of the current Master Cycle.  A decline beneath the above-mentioned support indicates a probable reversal into a new Cycle.

Today’s op-ex indicates Maximum Pain at a highly contested 4510.00.  Long gamma starts at 4525.00, while short gamma lies beneath 4500.00.

ZeroHedge reports, “S&P futures dropped and global stocks paused their rally on Wednesday as the euphoria over a potential dovish pivot by central banks faded and earnings from a slew of companies undershot expectations. A boost to sentiment from the US averting a government shutdowns was offset by a last minute debacle in the Biden-Xi talks in which the US president (correctly) called his Chinese counterpart a “dictator”; sentiment was also pressured by disappointing guidance and commentary on the US consumer from retail giant Walmart. As of 8:15am, S&P futures ticked 0.2% lower. 10YTreasuries steadied just below 4.5%, after yields increased by almost nine basis points in the previous session. The dollar was little changed and West Texas Intermediate declined toward $76 a barrel.”


VIX futures have declined to a new low at 13.68, which may be the Master Cycle low.  Should that be the case, the Cycles Model suggests a rally in the VIX lasting to mid-January.

Noecct week’s op-ex shows short gamma all but extinguished.  Long gamma may start as low as 14.00, but becomes serious at 18.00 and currently extends to 30.00.


TNX pulled back to test the trendline at 45.45 this morning.  Once the trendline has been determined to hold, the rally to the upper trendline may begin, with strength.  The Cycles Model suggests TNX may be making new highs at the end of November.

ZeroHhedge remarks, “Short covering on Tuesday drove a powerful rally in Treasuries, but deteriorating liquidity conditions means they face greater downside than upside risk.

The outsized move in bond yields in the US and the rest of the world from a slightly softer-than-expected October inflation print was an unmissable sign of a market that got caught short.

Today’s retail sales number was better than expected (though a decline in headline), potentially wrong-footing the bond market after yesterday’s strong gains.”


USD futures are testing the 200-day Moving Average at 103.42 with a low thus far at 103.99.  Today is day  253 of the Master Cycle.  There is a strong likelihood of the final low being made yet this week. The Cycles Model suggests that the uptrend may strengthen next week.  Remember, the demand for USD (cash) may rise as both stocks and bonds sell off.


Crude Oil futures have slipped beneath the prior low, to 74.64 on day 254 of the current Master Cycle.  Crude is nearing a low, possibly at the Cycle Bottom at 65.22.  There may be dire consequences should crude decline to or beneath the May low at 63.57.


Posted in Published | 2 Comments

November 15, 2023

12:10 pm

BKX is nearing its 61.8% Fibonacci retracement at 83.78.  After some consideration, I have concluded that this bounce is merely a two-week “bump” in the down trend.  Prepare for a decline similar to, if not greater than, the March decline.


8:00 am 

Good Morning!

NDX futures rose to an overnight high of 15918.60, less than 14 points from the all-time high.  One of the Elliott Wave rules is that Wave (2) may retrace up to (but not exceeding) 100% of its decline from July 19, but no further.  At this moment, there is no alternate structure, as today is day 247 if the Master Cycle beginning on March 13, within the “turn  window for this Cycle.  The current retracement is 94%.  This rally has been a mighty short squeeze that has turned into a buy fest for those on the sidelines.  Are we due for an island reversal?  The rally may have been too fast and too far to be sustainable.

Today’s options expiration offers a lumpy menu of short gamma up to 15930.00, suggesting a wholesale turn of sentiment among options buyers.  The major purchasers appear to be institutions and dealers.

ZeroHedge remarks, “Now it begins

Inflation is dead and rates will be cut. Hurrah! The flow picture is very supportive with buybacks, CTAs and fund inflows. Double hurrah!! So now the new bull begins…?

No, now it ends

Now is not the time to go max long. We would argue that this is not the beginning of a new bull market but rather the end of a short-term squeeze. We are in the beginning (let’s say 1st or 2nd inning) of a top formation. We are more than 50% through the buying mechanics that has propelled equities >10% higher over the past few weeks. Too early to short but way too late to increase longs. Lets examine.”


SPX futures rose to an overnight high of 4518.10 before pulling back.  This may constitute an 82.3% retracement, considered to be on the high end of a normal retracement.  Sentiment is as bullish as it gets.  There is a final Fibonacci interval/resistance at 4523.32.  The Cycles Model suggests a probable turn in the next 24 hours.

Today’s op-ex shows Max Pain at 4480.00.  Long gamma may begin at 4500.00, while short gamma may begin at 4450.00.  Friday’s op-ex may be the big option showdown.

ZeroHedge reports, “Wall Street looks set to add to Tuesday’s blistering post-CPI rally as futures gained and world stocks surged. As of 7:50am, S&P 500 contracts are up 0.4% reaching a new 2-month high after the index ended Tuesday with its biggest advance since April; mood was also lifted by progress in Congress on a avert a government shutdown and pass a temporary funding bill while investors welcomed cooler-than-expected inflation readings in the UK as evidence that central banks may be done with their aggressive interest-rate increases. Europe’s Stoxx 600 Index jumped, led higher by consumer product and mining stocks, MSCI’s Asia Pacific Index jumped over 2%, with all markets in the green.

In premarket trading, retailers are broadly higher after Target reported adjusted earnings per share for the third quarter that beat the average analyst estimate and a decline in comparable sales that was less steep than expected. Target climbs as much as 15% premarket. Walmart rises 1.3% premarket, Dollar Tree +2.4%, Dollar General +2.2%, Best Buy +1.2% and Costco Wholesale +0.8%. Here are some other notable premarket movers:”


VIX futures are consolidating within yesterday’s trading range.  This is a departure from the inverse of SPX’s probes higher.  Today’s options expiration may prove to be a hindrance, but the Cycles Model suggests an energetic burst of strength as early as tomorrow.

Today’s op-ex shows Max Pain at 19.00.  Short gamma starts at 17.00, while long gamma begins at 20.00.

ZeroHedge remarks, “Never forget

Seasonality is strong going into year end, but are we front running it?

Source: Equity Clock

Where are the “max longs”?

Question: “What is your current equity positioning or sentiment in historical terms, expressed from most bearish (0th percentile) to most bullish (100th percentile)?”


TNX leaped from the trendline this morning as the uptrend may be reasserting itself.  As warned earlier, the secular trend is higher. The current Master Cycle may resume through the end of the year.  Tending strength may resume early next week, if not sooner.

ZeroHedge observes, “The Treasuries rally that followed a modest miss on inflation data looks too good to be a true reflection of where the economy is heading. As traders focused on the shorter end of the curve, five-year yields dropped the most since March, when a banking crisis raised concerns that the US could rapidly tip into a recession. Considering that core annual inflation came in at 4.0%, rather than holding at 4.1% as expected, Tuesday’s move looks excessive.”


USD futures declined to a low of 103.82 before consolidating.  Both mid-Cycle and 200-day Moving Average stand at 103.40, providing support.  Today is both a Trading Cycle low and a potentially strong reversal day.  Today is also day 252 of the current Master Cycle, suggesting the low may have arrived.


Crude oil futures reversed beneath the mid-Cycle support/resistance at 78.19, reinstating the sell signal.  Should yesterday’s high be the end of the Master Cycle, the new Master cycle may continue its decline to the first week of December.

ZeroHedge observes, “After four months of re-acceleration, US producer prices tumbled in October – down 0.5% MoM, the biggest drop since April 2020. This dragged Final Demand PPI YoY down to 1.3%…

The sharp slowdown was largely reflective of a decline in gasoline prices, as excluding food and energy, the so-called core PPI was unchanged (and the smallest annual increase since the start of 2021).”


Posted in Published | 1 Comment

November 13, 2023

12:42

SPX has made the 61.8% Fibonacci retracement value of the decline since July 27.  This is a common retracement value for a Wave (2) retracement.


7:45 am

Good Morning!

SPX futures declined to 4393.00 over the weekend, but bounced back above the 100-day Moving Average at 4402.54.  A decline beneath that level produces an aggressive sell signal.  The Cycles Model is on the verge of tipping over, so stay alert.  Today is day 245 in the Master Cycle, within the window for a reversal.  The Cycle immediately prior to this was longer than usual, so this Cycle may be curtailed.

Today’s options expiration shows intense interest at 4400.00..  Above that , gamma is long.  However, short gamma kicks in at 4395.00.  It will be a tight tug-of-war between the bulls and the bears today.

ZeroHedge reports, “After last week’s torrid rally, and following gains on 9 out of the past 10 days, US stocks are set for a lower open as traders turn cautious ahead of key U.S. CPI data later this week which will give cues on what the Fed could do next, while investors also assessed the risk of a government shutdown on the 17th. As of 7:45am, S&P 500 futures are down 0.2% while Nasdaq 100 contracts lose 0.3% after the underlying indexes closed sharply higher on Friday. European stocks rose on Monday, with the Stoxx 600 index climbing 0.5%, well off the best levels however, with health firms were among the strongest performers as Novo Nordisk jumped almost 4% after a study backed the use of Wegovy to cut heart attacks and deaths in obesity patients. The news also benefited US-listed rival Eli Lilly & Co., which has its own weight-loss medications. Treasury yields slipped, while oil steadied and bitcoin traded around $37K.”


VIX futures rose to a weekend high of 15.19.  Considering the Master Cycle low may have been made on Thursday, one may consider going long, especially above 15.50.

Wednesday’s op-ex shows Max Pain at 19.00.  Puts are in the majority beneath 18.00 while short gamma reigns beneath 16.00.   Calls take the majority above 20.00 while long gamma may prevail above 21.00 and extend to 75.00.

ZeroHedge remarks, “The weight of real yields

The US equity market looks vulnerable under the weight of rising real interest rates.

Source: Goldman

The weight of drained liquidity

Central bank balance sheets continue to shrink, draining liquidity. A 2024 thesis could be that world equities will “catch-down” to that G4 BS line.”


TNX continues its rise from the testing of the bottom trendline.  The Cycles Model indicates rising trending strength, starting today and proceeding to the end of the month.  TNX may hit the upper trendline at that time, exceeding the prior high.

ZeroHedge comments, “The Federal Reserve’s Federal Open Market Committee (FOMC) last week left the target policy interest rate (the federal funds rate) unchanged at 5.5 percent. This “pause” in the target rate suggests the FOMC believes it has raised the target rate high enough to rein in price inflation which has run well above the Fed’s arbitrary two-percent inflation target since mid-2021.

I say “believe,” but perhaps the more appropriate word here is “hope.” 

That is: the Fed hopes it has raised the target interest rate high enough. Moreover, the Fed hopes this will both reign in price inflation and also avoid raising unemployment too high. (See below for what is meant by “enough” and “too high.”)


USD futures are consolidating above the 50-day Moving Average at 105.62.  This puts USD on a buy signal.  The Cycles Model is unclear about the trend for the next two weeks.  Wednesday appears to be a day of trending strength, so we may get further indications from there.

ZeroHedge observes, “As DB’s Jim Reid writes in his weekly preview, this week will be the opposite of last week with not so much Fed speak but lots of important data and events, and the highlight will certainly be Tuesday’s US CPI but US retail sales (Wednesday) will also be a big driver of Q3 GDP forecasts. Additionally, PPI (Wednesday) and a raft of US housing data (NAHB – Thursday, starts/permits – Friday), will be other notable US releases alongside the NY Fed 1-yr inflation expectations today. Finally, something else that will sneak up on markets will be the potential US government shutdown on Friday.”


Crude oil futures tested the mid-Cycle resistance at 78.17 over the weekend and have pulled back.  The Cycles Model suggests WTIC may resume its decline for another week or so as it makes its way toward the Cycle Bottom at 65.17.

ZeroHedge notes, “After Brent nearly reached $100 in late September amid rising fears about a massive oil deficit, the petroleum complex has sold off sharply, with the selloff accelerating last week in which WTI and Brent were down ~4.5% from last Friday’s close.

According to Goldman’s futures trading desk, the move in spot prices appears to have been partially a capitulation of length that came into the market as concerns over near-term supply grew (OI fell alongside prices this week suggesting long liquidations).”


Posted in Published | Comments Off on November 13, 2023

November 10, 2023

8:30 am

Good Morning!

SPX futures bounced off the 50-day Moving Average at 4346.49 to 4361.50 this morning in a likely test of the descending trendline.  Yesterday’s high was on day 241 in the SPX.  However, it was day 251 in the NDX.  We cannot rule out another new high, but the turn window is open for a reversal for both the SPX and NDX.  The first probable low in the new Master Cycle may not occur until the end of November.

Today’s options expiration shows Max Pain at a highly contested 4350.00.  Long gamma begins at 4375.00, while short gamma starts at 4325.00.

ZeroHedge reports, “Just when it seemed that stocks were about to go on a 9-day winning streak, Fed chair Jerome Powell opened his mouth, said to shut the “fucking door“, and crashed stonks (the catastrophic 30Y auction just minutes earlier didn’t help) ending what would have been the longest streak since 2004.

And on to Friday morning, where after yesterday’s rout, stocks and bonds rebounded modestly even as investors speculated that more central bank speakers today will echo the hawkish message from Powell. As of 8:00am, S&P futures rose 0.25% to 4,373, rising off the worst levels of the day, while Nasdaq futures gained 0.1%; meanwhile in Europe the Stoxx 600 shed 1%, reinforced by poor earnings reports. The dollar is little changed while Treasury yields are marginally higher across the curve; energy outperforms with WTI futures up about 1% on the day


VIX futures appear to be consolidating inside yesterday’s trading range.  Yesterday’s low occurred on day 241.  However this Master Cycle follows on the heels of a 278-day MC, making the average of the two at 259.5.  The mean (average) length of a Master Cycle is 258 days.

Next Wednesday’s (monthly) options expiration shows Max Pain at 19.00.  Short Gamma extends from 13.00 to 17.00.  Long gamma starts at 21.00 and may go as high as 95.00.

ZeroHedge posits, “Just a bear market squeeze?

Many indicators that we look at (especially positioning and flow) are still supportive for the equity markets. However, here are a few charts showing risk sensitive assets that are showing some early “fade” features.”


TNX pulled back to retest the trendline for a third time.  The 50-day Moving Average is at 45.82 and offers a buy signal as it is overcome.  Without throw-overs, Intermediate Wave (5) of Primary Wave [5] may rise to 53.25.

Zerohedge remarks, “The Treasury rally saw an abrupt turnaround on Thursday, with yields climbing over 15 bps. This came on the back of overbought conditions in bonds and stocks, with the S&P dropping 0.8%. The curve ball came in the 30-year auction, having the worst tail in over 10 years. This will exacerbate already-poor liquidity conditions in the Treasury market, and mean rallies are unlikely to be sustained for long.

Treasury auctions normally don’t make much news, but Thursday’s 30-year sale saw the worst tail (median – high yield) since August 2011, when the S&P downgraded the US from its AAA rating. Primary dealers, who backstop auctions, had to take a quarter of the issue, double the proportion they take on average.”


Posted in Published | 2 Comments

November 9, 2023

3:55 pm

SPX has broken out of the gap, creating an aggressive sell signal.  Once beneath the 50-day Moving Average at 4346.50, the sell signal is confirmed.

ZeroHedge reports, “Complete disaster.

That’s the only way one can describe today’s 30Y auction, which many expected could be challenging after a mediocre 3Y and a subpar 10Y auction earlier this year, but nobody expected… this.

The bond priced at a high yield of 4.769%, which was below last month’s 4.837%, and just shy of the April 2010 high. But more importantly, it tailed the When Issued by a whopping 5.3bps, which was… well… terrible, because as shown in the chart below, this was the biggest tail on record (going back to 2016).”


8:15 am

Good Morning!

NDX futures are consolidating just beneath yesterday’s new high at 15343.18.  The new high (above the October 12 high) alters the structure of the Cycles.  Today is day 251 of the existing NDX Master Cycle.  Should the MC high be finalized in the next few days, the new Master Cycle may go immediately into decline lasting to mid-January.  Unfortunately, many investors are influenced by the breakout and being cheered on by dealers who need to sell their book.

Today’s options expiration shows Maximum Investor Pain at 15310.00.  Long gamma starts at 15320.00, but does not have a follow-through.  Short gamma begins at 15310.00 with moderate follow through.

ZeroHedge remarks, “GS repeats: There is no need for a recession

“Despite the good news on growth and inflation in 2023, concerns about a recession among forecasters haven’t declined much. Even in the US, which has outperformed so clearly on growth in the past year, the chart shows that the median forecaster still estimates a probability of around 50% that a recession will start in the next 12 months.This is down only modestly from the 65% probability seen in late 2022 and far above our own probability of 15% (which in turn is down from 35% in late 2022).”

Source: Goldman

2024 will be an “everything up” market

Goldman’s 2024 cross-asset return forecasts. The bull is back.


SPX futures climbed to 4394.10, making a new high and altering the Cycle structure.  The correct structure is called an expanded flat, inferring a lower corrective low, but the final (Wave C) high being in proximity to the Wave A high.  The SPX has rallied sufficiently to be complete, once it registers the new high in the cash (daytime) market.  It may not close the gap at 4401.38-4402.20.   It is also in the reversal window for a Master Cycle.  I expect both the NDX and SPX to make their reversal simultaneously.

Today’s op-ex shows high market tension and possible Max Pain at 4370.00-4380.00.  Long gamma starts at 4400.00.  Short gamma begins at 4370.00.

ZeroHedge reports, “S&P 500 futures edged higher on Thursday after notching an eight-day streak of gains, and setting up the benchmark index for its longest winning streak since 2004, as investors monitored bond yields, corporate earnings and the price of oil. Treasuries fell and the dollar rose ahead of more speeches by central bank officials including more remarks by Fed chair Powell. After a listless overnight session, as of 7:45am S&P futures were up 0.1% and Nasdaq was down by a similar amount. Elsewhere, Europe’s Stoxx 600 index rose 0.6%, Asian stocks closed green, oil hovered near a three-month low after plunging almost 7% over the previous two sessions, yields on 10-year Treasuries held below 4.5%, the dollar gained and bitcoin was set to rise above $37,000, an 18 month high.”


VIX futures have made a new low at 14.13 in an expanded correction.  The new Master Cycle is about to begin.  It may last in an historic new high by mid-January.  Nuff said.

Next Wednesday’s op-ex shows Max Pain at 19.00.  Short gamma extends from 13.00 to 17.00.  Long gamma begins at 20.00 and may extend to 70.00.


TNX futures made a low of 44.1while the cash market bottomed at 45.26.  The trading channel trendline appears to be holding TNX, which is deeply oversold.  It may linger near the lows until next week, when trending strength roars back.  The current Master Cycle may resume the uptrend through the end of November.

ZeroHedge observes, “The impressive rally in stocks and bonds over the last week or two is likely to take a breather, with both assets now overbought in the short term.

Bonds have been deeply oversold since last year, but the latest rally to ~4.5% in the 10-year has taken Treasuries to only one standard deviation below their long-term mean growth level (back towards the range they normally inhabited before the extremes of the pandemic).”


Crude oil futures  consolidated above yesterday’s low, but appear poised to make new lows as trending strength may stage a comeback this weekend.  The Cycles Model suggests up to two more weeks of decline, where the Head & Shoulders target may be met.

ZeroHedge poses the question,”Surprising many, the price for crude oil has collapsed in the last few days, with Brent back below $80 and WTI well below pre-Israel-attack lows back at near 4-month-lows…

The question for many is – why, or why now?”


Posted in Published | Comments Off on November 9, 2023

November 7, 2023

2:45 pm

Please note:  I will be absent from this blog for the entire day tomorrow, November 8.  


12:15 pm

On November 3, I mentioned, “SPX is meeting fierce resistance at the September 21 gap beginning at 4375.70 and open to 4401.30.  It spent two weeks trying to overcome it in October, but failed.  Unfilled gaps are powerful resistance points, due to their history of failure, as you can see.  One of the reasons is that most shorts were bought after the gap down, so short covering no longer provides the fuel for SPX to go higher.  On the other hand, you will know a rally has legs when gaps are filled.  That may not happen for a while.”

Today, SPX lurched into the gap, but could not maintain a hold on it.  A failure at the gap (below 4375.00) may be a powerful sell signal.  Those who seek confirmation may wait until the 50-day Moving Average at 4347.71 is breached.

ZeroHedge remarks, “Here we are again, writes Goldman Sachs trader Bobby Molavi.

The market handing out yet another dose of exactly what investors didn’t want.

A dovish, bad news is good news and fed is done (cuts could be coming) mindset which triggered a beta rip that was felt most acute in most shorted, lower quality, higher leverage and duration space.

Macro still rules the roost…and only a week after we hit 5% for 10 year yields…we found ourselves at 4.5% on the back of easing labour markets and slowing inflationary pressure…..only to see this week yields rising once more.”


9:57 am

The Ag Index has risen above its 50-day Moving Average at 396.83, putting it on a buy signal.  The Cycles Model indicates growing strength after completing its Master Cycle low o October 31.  The new Master Cycle may last through late December, giving ample time for a rally with legs.   Harvest season is underway, with mixed results.  Final reports may indicate that food inflation may be back.


9:45am

BKX is declining toward the 50-day Moving Average at 77.94, where a sell signal awaits.  The rally may have provided some relief to bank  investors while lower rates have temporarily eased pressure on bank portfolios.  However, that may change quickly.  Regional banks went all-out selling mortgages when rates were considerably lower.  The pressure to unload those mortgages have widened credit spreads, preventing banks from easing their pain by unloading their mortgage holdings during the crisis.  Now the Federal Home Loan Banks have weighed in with bad news.  See the articles below.

ZeroHedge observes, “The growing divergence between mortgage and credit spreads is highly unusual and counter-intuitive: it’s not obvious why corporates should be getting less risky and mortgages more when rates have risen for everybody. It turns out the ultimate cause is inflation.

It has been said that anyone who says they understand quantum mechanics doesn’t understand quantum mechanics. That applies equally to markets. Just when you think you have a handle on things, a new head-scratcher pops up.”

2:55 pm

ZeroHedge writes, “Is Bill Gross about to face another big loser? On Nov 2nd, the former ‘bond king’ wrote on X that “regional bank falling knife has hit bottom” adding that he was buying shares of Truist Financial, Citizens Financial Group, KeyCorp, and First Horizon.

The Regional Bank Index soared for two days after that, but the last two days have seen the index give some of those gains back…

And today, we get headlines that – on their face – would seem like very bad news for smaller banks as regulators push to close the cookie jar of cheap rescue cash that access to Federal Home Loan Banks has provided.”


8:10 am

NDX futures consolidated near yesterday’s marginal new retracement high just above the trendline at 15150.00.  The first support under the NDX is the 100-day Moving Average at 15085.00, which may yield an aggressive sell signal.  The 50-day Moving Average is just beneath at 14953.09, yielding a possible confirmed sell signal.    The Cycles Model calls foe a decline that may last to the end of November,

Today’s options expiration shows Maximum Investor Pain at 15180.00.  There is virtually no long gamma.  Short gamma starts at 15170.00.  Sentiment is beginning to lean toward the short side.

ZeroHedge remarks, “This does not look like a top

This does not look like a bear market squeeze top. Chart shows average percentile of 16 equity market sentiment & positioning indicators.

Source: Goldman

This does too not look like a top

This too does not look like a bear market squeeze top. Risky vs. safe assets fund flows.”


SPX futures are consolidating just above the 50-day Moving Average at 4348.54. A break down beneath it may produce a sell signal.  The Cycles Model infers a decline may follow lasting to the end of November.  This decline has the capability to go beneath the October 2023 low at 3491.58.

Today’s options expiration is heavily fought at 4350.00, which may also be Max Pain.  Long gamma starts at 4390.00, while short gamma begins at  4300.00-4320.00.

ZeroHedge reports, “US stocks were set to snap a six-day rally on Tuesday as traders reassessed expectations of Fed interest-rate policy after hawkish comments Monday by Minneapolis Fed President Neel Kashkari dampened hopes of speedy interest rate cuts from the US central bank. Kashkari is back today for round two; Indeed, traders appear to be awaiting more from Fed officials on the rate path outlook following Kashkari’s comments, with Fed Chair Jerome Powell also set to speak later in the week, but first we have to get through today’s calendar:

  • 07:30: Kashkari
  • 08:00: Goolsbee
  • 09:15: Barr
  • 09:50: Schmid
  • 10:00: Waller
  • 12:00: Williams
  • 13:25: Logan

As of 7:50am, S&P 500 futures are down 0.3% to 4372 with Nasdaq futures dropping by the same amount, while Europe’s Stoxx 600 index posted a similar loss.”


VIX futures are also consolidating near their lows.  A return to trending strength ma be imminent, with (positive) momentum increasing by the weekend.

Wednesday’s op-ex shows Max pain at 17.00-18.00.  There is no real short gamma.  Long gamma starts at 20.00 and may extend to 50.00.


TNX may be pulling back to retest the 50-day Moving Average at 45.60 before resuming its climb.  This may be an opportunity to lighten up long bond holdings.  The Cycles Model suggests that we may see a steady climb this week with supercharged performance beginning next week.

ZeroHedge remarks, “Just a furious bounce?

The move in Treasury futures has been extreme, but note we are hitting the negative trend line around these levels. Also worth noting is the 50 day moving average. We closed above it on Friday, but we are very close to it again. The 100 day remains “way” higher.

Source: Refinitiv

Too quick

“As usual, we’ve moved a long way very quickly. I think it may get harder to keep pushing yields a lot lower…” (Dom Wilson, GS).”


USD futures rose to 105.85 this morning, overcoming the 50-day Moving Average at 105.46, putting USD on a buy signal.  The Cycles Model shows increasing strength over the next two weeks, suggesting a possible breakout.


Crude oil futures made a new low this morning, approaching the mid-Cycle support at 78.23.  It is on a sell signal tat may last to early December.  The Head & Shoulders formation has been activated that should take crude to its Cycle Bottom at 65.24.

ZeroHedge reports, “The European oil and gas majors, which are also the world’s top LNG traders, reported a mixed bag of third-quarter results, with some beating or meeting estimates and others missing expectations amid diverging gas trading opportunities in Europe and Asia.

Shell and TotalEnergies, the world’s largest and second-largest LNG traders, respectively, reported strong gas trading earnings thanks to the open arbitrage to Asian markets in the third quarter. But BP, another major with a typically strong gas trading business, saw weak results in the division between July and September, which dragged overall earnings below analyst estimates. ”


Gold futures declined to 1962.90, on their way to test the mid-Cycle support at 1950.36.  The Cycles Model suggests gold may decline through the end of the year.  The Head & Shoulders formation poses an interesting target.  The Cycles May allow enough time for that to happen.

ZeroHedge gives a history lesson, “Public Law 93-373 was supposed to be so boring that Congress didn’t even bother to give it a name.

You know how most laws passed by Congress have some fancy name– like the “Inflation Reduction Act” or the “USA PATRIOT Act” or some such nonsense?

Well, on November 7, 1973, US Senator James Fulbright introduced a very short bill– it was only ONE page– that didn’t even have a name. But Fulbright’s unnamed bill ended up being one of the most important pieces of legislation in US history.”


Posted in Published | 1 Comment