
2:25 pm

SPX is meeting fierce resistance at the September 21 gap beginning at 4375.70 and open to 4401.30. It spent two weeks trying to overcome it in October, but failed. Unfilled gaps are powerful resistance points, due to their history of failure, as you can see. One of the reasons is that most shorts were bought after the gap down, so short covering no longer provides the fuel for SPX to go higher. On the other hand, you will know a rally has legs when gaps are filled. That may not happen for a while.
10:50 am

SPX rallied above the 50-day Moving Average at 4350.00, then reversed. A decline beneath the 50-day (may have already happened) produces an aggressive sell signal. Confirmation may come beneath the mid-Cycle support at 4292.23. The rally may have turned into a bull trap.
7:30 am

Good Morning!
NDX futures rose to 14890.70 this morning, but have recently reversed into the red. There are two possible outcomes. The first is to reach the 50-day Moving Average at 14949.30, prolonging the rally, or decline through Intermediate support at 14778.52, creating a possible sell signal. The Cycles Model infers that the decline may resume imminently and continue to the last week of November.
Today’s op-ex shows Maximum Investor Pain at 14750.00 Long gamma starts at 14800.00 while short gamma begins at 14700.00. The dealers have squeezed out the shorts. Will the longs pick up the baton?
ZeroHedge speculates, “More legs to the squeeze?
As we have been highlighting in our past few emails, there are reasons to be tactically short term bullish:
1. Massive buybacks
2. Retail participation
3. CTAs can have to buy a lot
4. HFs generally low positioning
5. Technical picture better with SPX above its 200-day moving average
6. Earnings now coming in better after a somewhat weaker start”

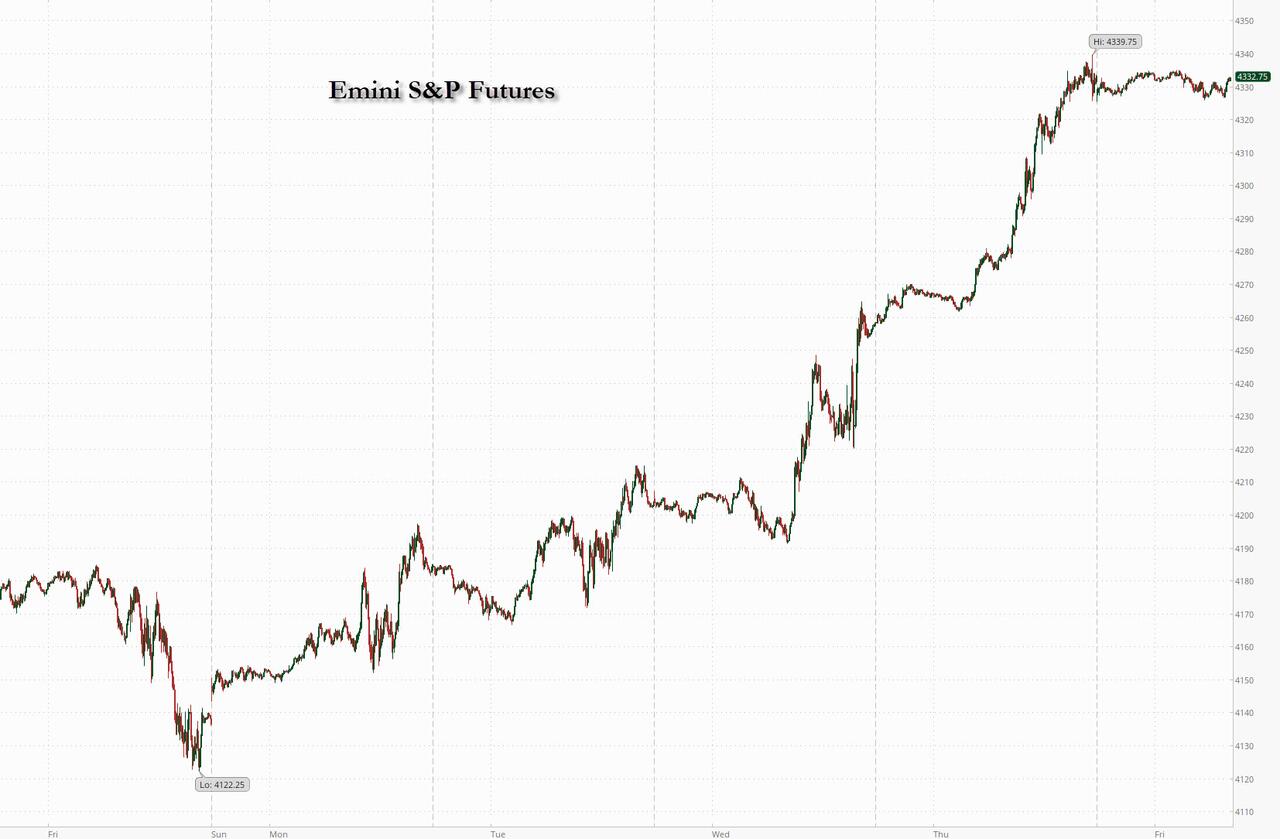
SPX futures have stopped short at 4317.60 and consolidated above 4300.00. A break beneath Intermediate support at 4291.00 may produce a sell signal. The original retracement target at 4259.92 may provide confirmation of the reversal and sell signal. The Cycles Model suggests a clear reversal may occur by mid-day.
Today’s op-ex shows possible Max Pain at 4290.00. Long gamma begins at 4300.00 while short gamma starts at 4285.00. 4300.00 appears to be the line in the sand for this tug-of-war.
ZeroHedge reports, “Equity futures are pointing to a slight pullback in US stocks, which are on track for their best week in a year, as Apple’s disappointing outlook anmd weaker than expected China sales weighed on markets. At 7:40am, S&P 500 futures were down 0.1% but off the worst levels of the session while Nasdaq 100 futures lost 0.3%. The pullback follows US stocks’ best day since April in the wake of the Federal Reserve’s decision to hold rates steady. The subdued session is also due to nerves around the US nonfarm payroll data later today as traders look for further confirmation that the Federal Reserve’s tightening cycle is nearing an end.”

VIX futures are consolidating near the low end of its range. The consolation is that VIX may have stopped its decline, or very nearly so. After being out-of-sync with the SPX for some time, it appears to be ready to re-engage.
Next Wednesday’s op-ex reveals Max Pain at 17.00-18.00. There is no short gamma. Long gamma begins at 20.00 and extends to 50.00.
ZeroHedge comments, “Sell low buy high
GS Prime book was sold for the third straight month in October. Main reason is heavy shorting. GS notes: “…the combined net selling from August to October across global equities was the second largest over any three month period in the past 10 years (only Q1 ’22 was larger) and ranks in the 99th percentile.”
Good luck explaining to your boss you shorted the recent lows in size and intend to keep that into year end…”

9:04 am

TNX is probing its target (the 50-day and trend line) at 45.45 tis morning, in a likely completion of its retracement. Should that be the case, we may see a reversal this morning to higher yields.
ZeroHedge remarks, “TLT – the break out
TLT closed “well” above the negative trend line for the first time since the TLT bear started in July. Note it also managed closing above the 21 day by a margin not seen in a very long time. The 50 day is still higher, not to mention the 200 day.

Source: Refinitiv
Not seen in “modern” times
We have not seen the VXTLT vs VIX ratio at these levels in “modern times”.

Source: Refinitiv
TLT panic in a pic
The crowd is piling into TLT calls. Yesterday was the largest TLT call volume ever.”

USD futures have declined to a new retracement low at 105.08 thus far this morning. I am studying whether today May be the Master Cycle low instead of 10 days ago. The Cycles Model suggests the USD will be higher by year-end.