February 7, 2024

8:15 am

NDX futures have risen to 17636.00 thus far as it attempts to rise above the mid-Cycle high at 17682.29.  Large investors tend to run up the markets at the open to see if retail investors take the bait.  Emotions are still running high, so the outcome is still uncertain.

Today’s option chain shows Maximum Investor Pain at 17575.00.  Long gamma begins at 17600.00 while short gamma starts at 17500.00.


SPX futures have risen to 4970.60 this morning as attempts are being made to prolong the rally.  The premarket activity is institutional , attempting to bring retail investors on board after the open.

Today’s options chain shows Max Pain at 4930.00.  Long gamma starts at 4940.00 while short gamma beginns at 4925.00.

ZeroHedge reports, “US equity futures and global markets were mixed, while bond yields rose as the Treasury prepared to auction a record $42 billion in 10-year bonds that may indicate if a recent selloff was overdone. As of 7:50am ET, S&P futures rose 0.2%, reversing earlier losses and trading near session highs…

… trading in lock step with sentiment surrounding the latest troubled regional bank, NY Community Bancorp, which tumbled by 16% overnight to the lowest since 1997 after it was downgraded to junk before rebounding more than 10% after announcing it hired Flagstar bank’s Alessandro Dinello as executive chairman.”


VIX may be going into a Master Cycle low today as futures are making new lows on day 259 of the current Cycle.  Despite Cyclical pressure to the downside, VIX has succeeded in making higher highs and lows since December.  It may be coiling for a breakout.


The Shanghai Composite has risen above the Cycle Bottom resistance at 2812.72.  However, the gain may not be enough to keep it there.  There is still a possibility of a retest of the low by the end of the week.

ZeroHedge observes, “China has appointed capital markets veteran Wu Qing to head the nation’s securities regulator just one day after the country’s sovereign wealth fund said it would ramp up buying shares in the open market amid a three-year rout that has wiped out a staggering $7 trillion in value off stock markets in Hong Kong and China.

Qing, who served as the head of the Shanghai Stock Exchange from 2016 to 2017, has been named the new chairman and party secretary of the China Securities Regulatory Commission (CSRC), taking over from Yi Huiman, who held the post since 2019, according to South China Morning Post, citing state media Xinhua on Wednesday.

SCMP pointed out Qing was the deputy party chief of the financial center of Shanghai. He once oversaw the 2015 meltdown in China’s capital markets. ”


TNX appears to be consolidating above the trendline at 40.90.  TNX is in a correction which may take it to the 50-day Moving Average at 40.79.  However, there may be a burst of strength in the next day or two.  Today’s Treasury auction offers $60 billion of 17-week bills, which may not be troublesome.  However, it is also offering $42 billion of 10-year Notes today, which may bear scrutiny.  Tomorrow it auctions off $185 billion in T-bills and $25 billion of 30-year bonds.

ZeroHedge reports, “The results from the week’s first refunding auction are out and they were solid, with the Treasury selling $54BN in 3Y paper at a high yield of 4.169%, up about 6bps from last month’s 4.105% but stopping 0.8bps through the 4.177% When Issued.

The rest of the auction was slightly lackluster: the bid to cover of 2.581 was a drop from last month’s 2.672 (but above December’s 2.416) and below the recent average of 2.662.”


Posted in Published | Comments Off on February 7, 2024

February 6, 2024

11:19 am

BKX, our liquidity proxy, is consolidating above the 50-day Moving Average at 92.45 as the decline may not be capable of postponement much further.  A world-wide banking crisis is developing and the gravity of the economic black hole is mounting.  A decline beneath the 50-day brings wider recognition that the rally may be over.

ZeroHedge remarks, ““That’s a nice regional bank lender you got there… be a shame if anything happened to it…”

We have warned for months (herehere, and here most recently) – as regional bank shares soared back from SVB crisis lows – that this small bank balance sheet crisis was far from over… and worse still the ‘big banks’ have money to burn with excess reserves (to use, for example, to help the FDIC clean up some small bank issues)…”


8:00 am

Good Morning!

NDX futures rose to an overnight high of 17677.90 in an attempt to overcome Friday’s all-time high.  Should it not go higher, it will have completed its first step lower in a Wave 1-2 structure.  Wave 2’s of any degree may go up to, but not exceed the prior high.   The first level of support is at 17321.03, beneath which lies an aggressive sell signal.

Today’s options chain shows Maximum Investor Pain at 17710.00-17720.00.   Short gamma dominated the NDX below 17700.00.  The NDX options are dominated by institutional investors while the QQQ options are the playground for retail investors.

ZeroHedge notes the lingering market enthusiasm, ““We are expecting an upward trajectory in the US equity markets,” wrote Scott Bessent, a former Soros Fund Management investing chief as he bets on a “Trump rally”.

“Barring Biden pulling ahead in substantial fashion, all pullbacks should be bought.”

Bessent’s bet appears well based as the polls (averaged by Real Clear Politics), Trump has a solid lead over Biden (although Biden – for some reason – saw a surge in the last few days?)…”


SPX futures probed up to 4950.60 in an attempt to regain the all-time high as divergences abound.  Again, it fell short and may now go lower.  The Cycle Top support is at 4875.43, beneath which lies an aggressive sell signal.  The next lower support is the Ending Diagonal trendline and Intermediate support, both at 4801.15.  Beneath the double support is a confirmed sell signal.

Today’s SPX options show a highly contested Max Pain level at 4950.00.  Long gamma lies above 4960.00 while short gamma awaits at 4935.00.

ZeroHedge reports, “US index futures traded flat on Tuesday, with European markets fading earlier gains while Chinese stocks surged on fresh hopes of government intervention in markets, as continued euphoria about artificial intelligence lifted the shares of Nvidia though broader indexes drifted. As of 7:50am, S&P 500 futures were little changed to 4,960, as 10-year Treasuries continued their drop, if at a more modest pace, with yields rising 2bps to 4.16% after yields soared about 14 basis points in the previous session and following the biggest 2-day selloff in months. Nasdaq futures were fractionally in the red. The small uptick in Treasuries pushes US 10-year yields down 1bps to 4.15% – they rose almost 28bps in the prior two trading sessions. The dollar and gold were also flat, while oil rebounded after several days of losses.”


The Shanghai Composite Index rose to 2802.93 today, beneath the Cycle Bottom resistance at 2817.45, before pulling back.  It may now be ready to retest the low  tomorrow, on day 258 of the Master Cycle.  What follows may only be a technical bounce, but may go as high as the mid-Cycle resistance at 3094.44 as the plunge protection team fires its bazookas.

ZeroHedge notes, “After tumbling the prior day following remarks on heavy tariffs from presidential front-runner Donald Trump, Chinese stocks rallied significantly across the board overnight after reports that regulators planned to brief President Xi Jinping on the financial market as soon as Tuesday.

The Xi-Briefing was the final headline in a day full of jawboning which included sovereign fund Central Huijin (translation: the plunge protectors) vowing to buy more ETFs, and China’s securities watchdog vowing to ‘guide’ (translation: coerce) institutional investors and funds to increase their A-share holdings.”


VIX futures maintained a tight range overnight, not giving any clues as to what may happen next.  Today is day 258 in the current Master Cycle.  The Cycles Model is signaling that trending strength may appear which suggests a possible phase transition from flat to soaring in the next few days.

ZeroHedge remarks, “Trading in option markets is likely making it easier to get bank credit, but it’s too early to say whether this will be enough to arrest the downswing in the credit cycle.

The SLOOS survey for the quarter to the end of January was released on Monday, and it showed a further easing in bank-lending standards.”


TNX may be consolidating at the mid-Cycle support/resistance after breaking above it.  The 200-day Moving Average at 41.09 may act as a support while TNX gathers strength for the (dreaded) next move higher.  Trending strength (and a breakout) may emerge later this week.  Today could be a hot day for treasuries as $80 billion of 42-day bills and $54 billion of 3-year notes are being auctioned today.


Crude oil may have reached the limit of its bounce at 73.55, as a double resistance lies at 73.60.  If so, the decline may resume by the end of the week with trending strength coming back in the decline early next week.


Posted in Published | Comments Off on February 6, 2024

February 5, 2024

9:47 am

BKX remains on a confirmed sell signal as it hovers above the 50-day Moving Average at 92.26.  Beneath that level is a commonly recognized sell signal.  The Cycles Model suggests the decline may continue through the end of February with volatility/;intensity picking up this weekend.

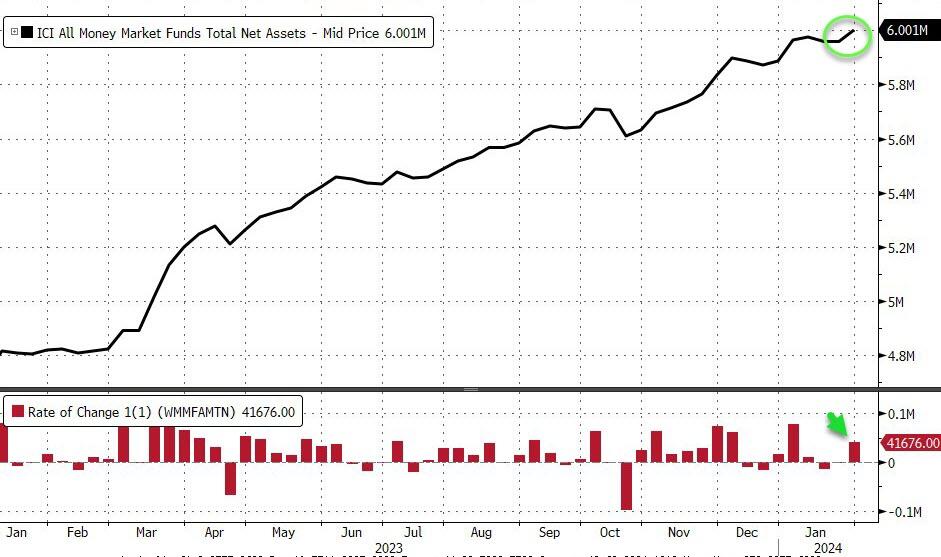
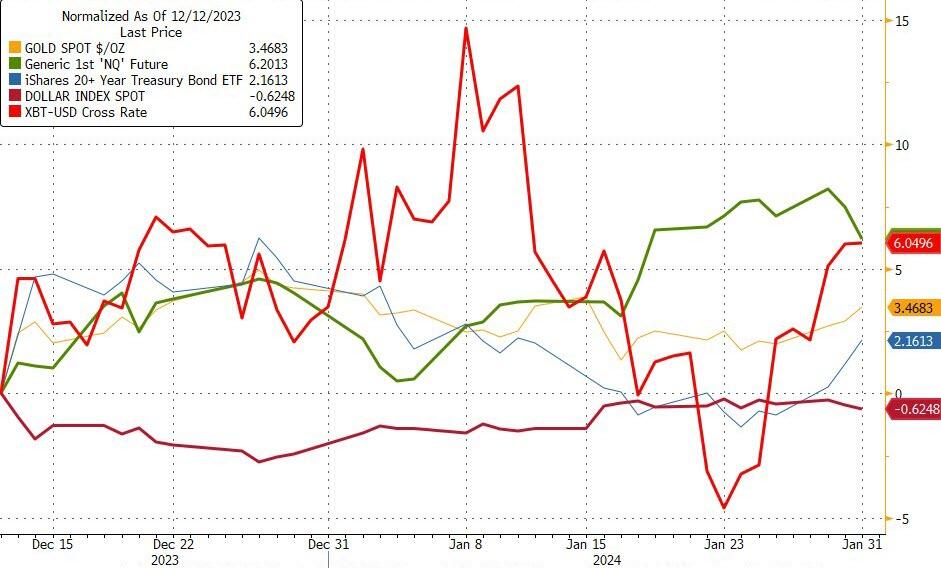
ZeroHedge observes, “After two weeks of outflows, money market funds saw $42BN of inflows last week, sending the total assets above $6TN for the first time ever..
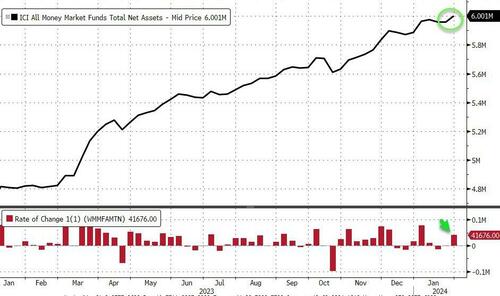
Source: Bloomberg

Not exactly a bullish sign for stocks as investors are choosing super safe money markets, where six-month bills yield about 5.17%, as the Fed sticks to its higher-for-longer policy.”


7:30 am

Please note:  February 20 may be the last day of this blog until the end of March.  I will be on an extended trip during that time, with very limited access to the internet.  I have not yet determined my commitment to the blog after April 1.  Suffice it to say that it will be in God’s hands.

Good Morning!

NDX futures made a weekend low of 17571.60, well above the Cycle Top support at 17294.69, where an aggressive sell signal may be had.  Further confirmation lies at the trendline and Intermediate support at 16935.60, where a confirmed sell signal awaits.  Today may be a half-Trading Cycle high followed by a half-0Trading Cycle (approximately 30 days) decline.  The Strength of the decline may determine whether stocks move on to greater highs.  The 1987 trendline may hold the answer.

Today’s options chain shows no Max Pain, no long gamma.  Short gamma begins at 17700.00.  Remember that the NDX is the domain for institutional investors.

ZeroHedge remarks, “Price

US money market fund assets hit a record high of $6trln this week. Gov’t debt hit record highs too. As did US equities, in general. Gold is near a record, US home prices too. In a highly financialized fiat monetary system, many drivers work to influence valuations. Cash flows, earnings, leverage, interest rates, money supply, its velocity, tax rates, optimism, pessimism, uncertainty, confidence, stability, volatility, and expectations about how all such things will change. Investors search for fair market value, but for a trader there’s no such thing, only price.”


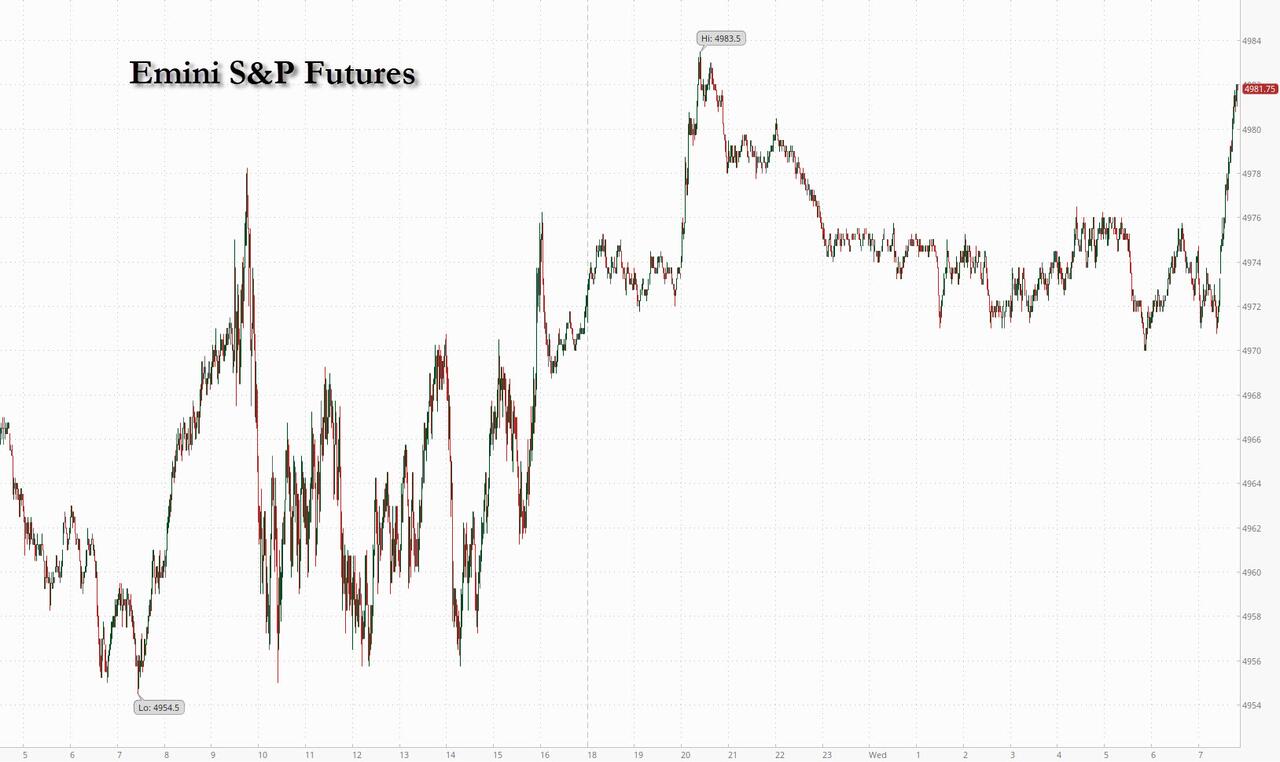
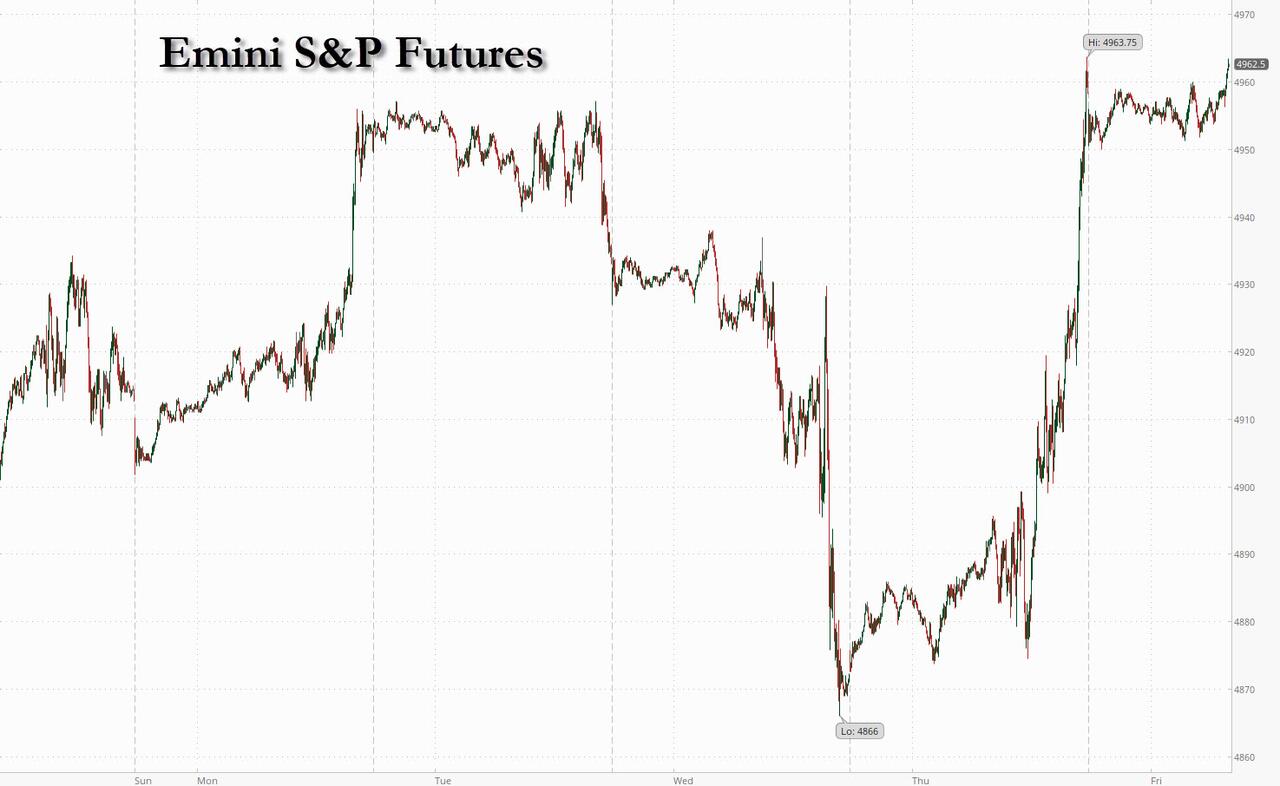
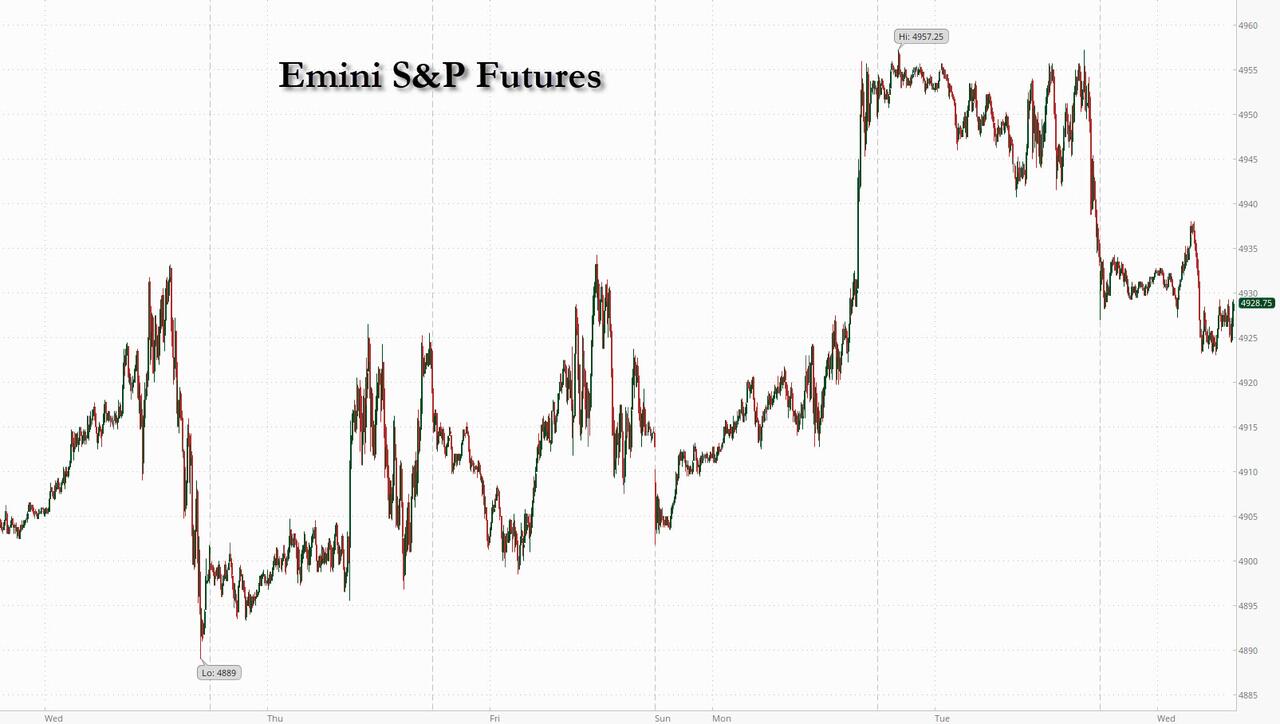
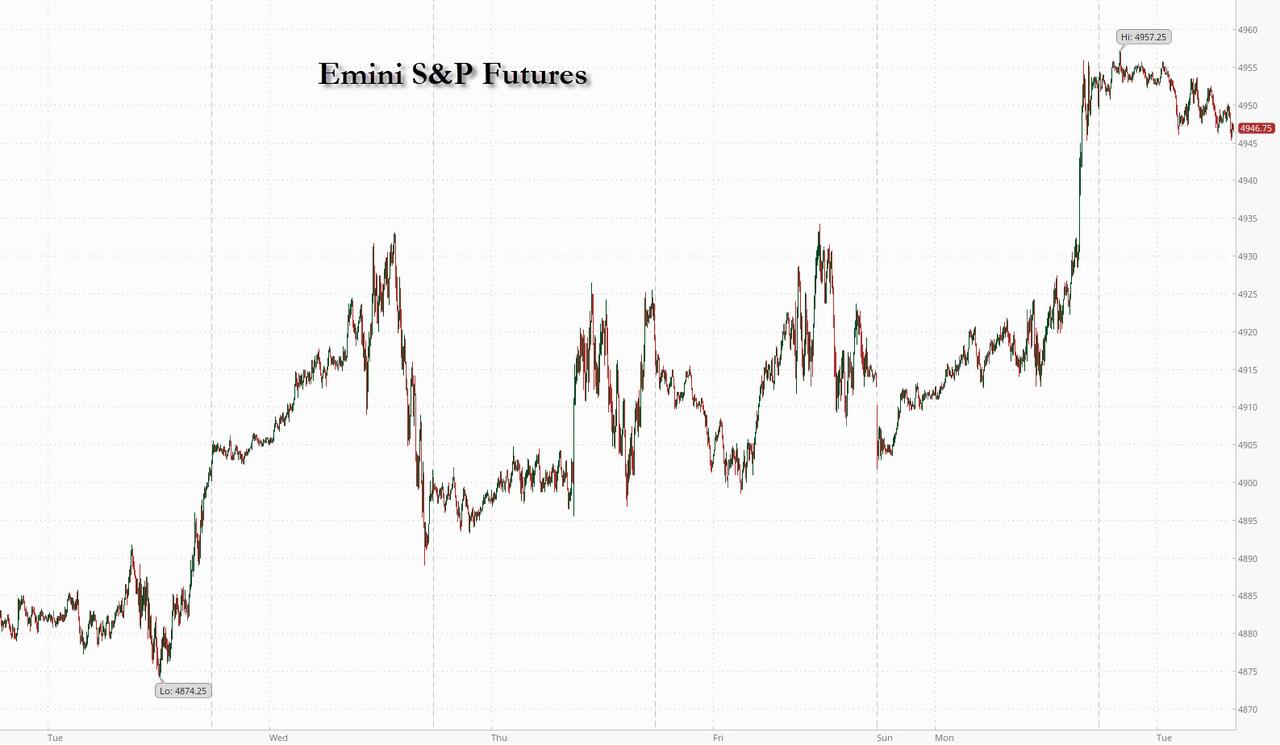
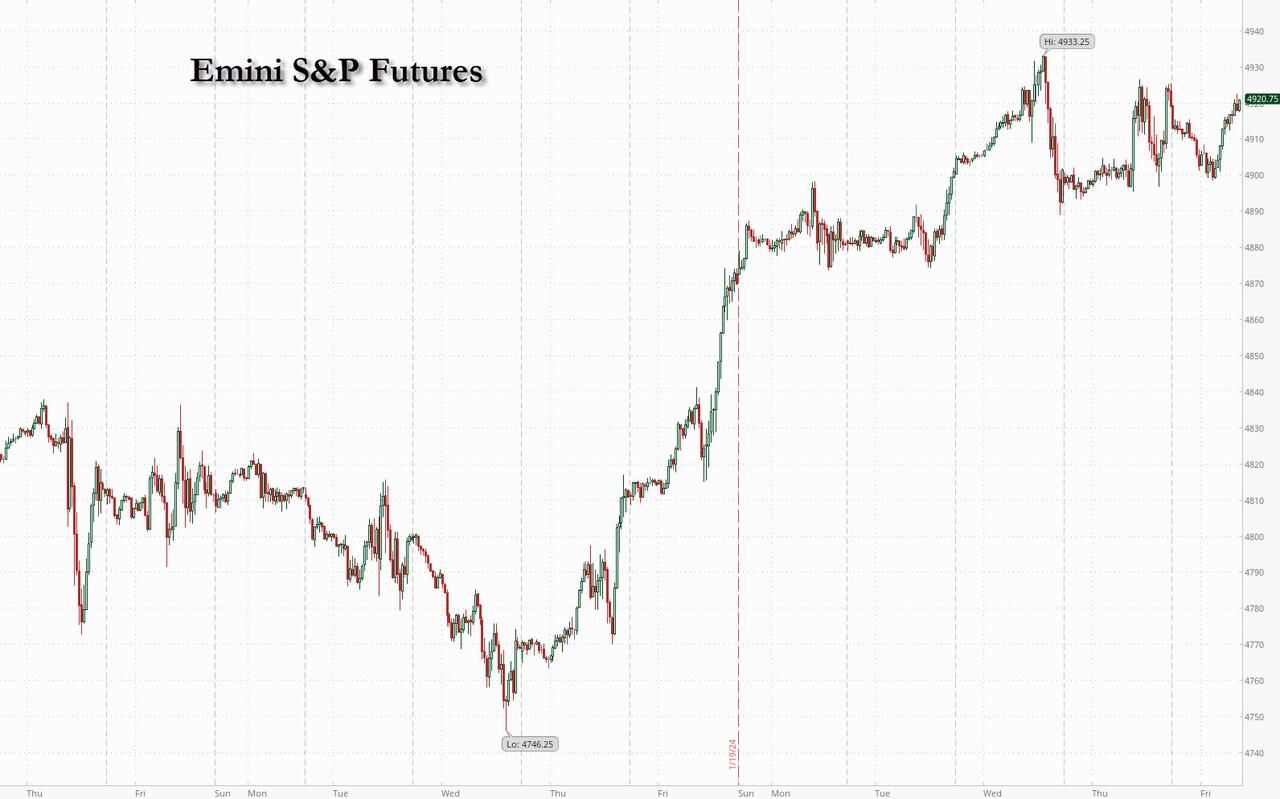
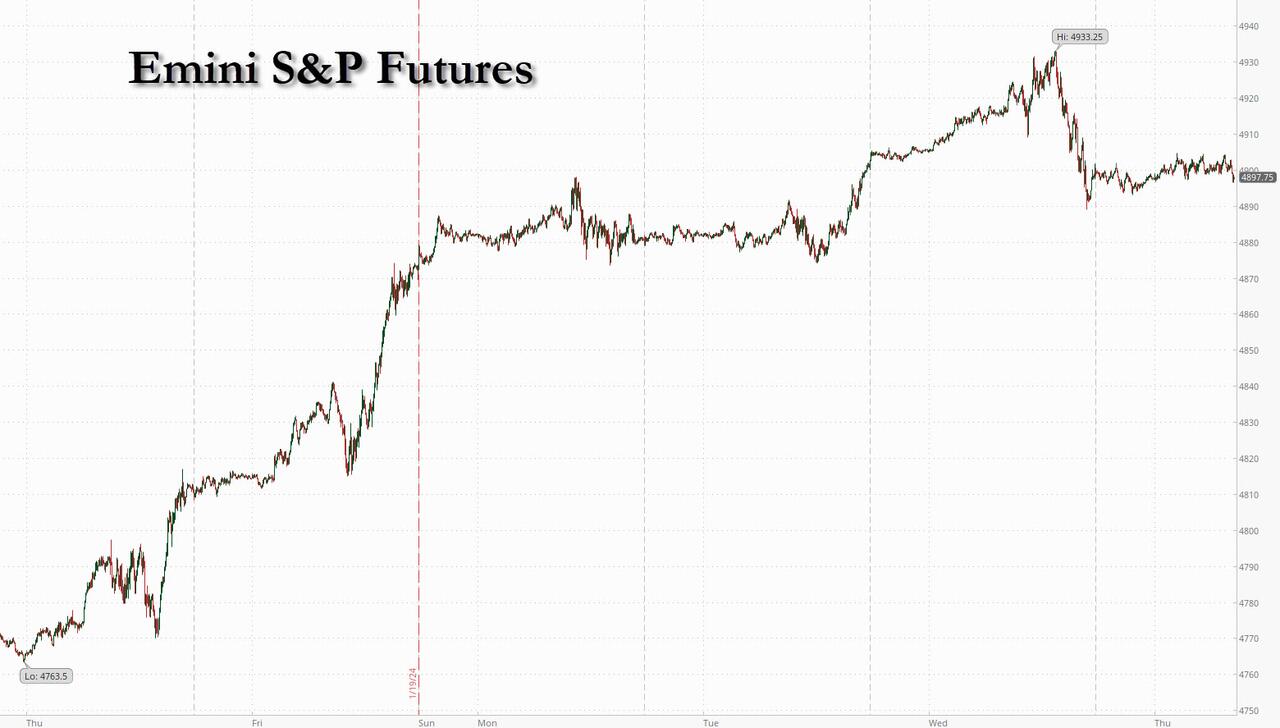
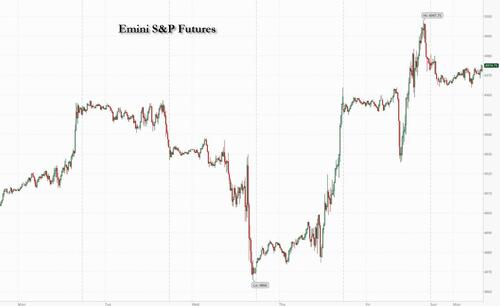
SPX futures declined to 4942.40 over the weekend, but have recovered near the flat line this morning.  Just to reiterate, SPX is also at a half-Trading Cycle high.  It has to the end of February to prove whether or not it has entered the bear market.  The trendline at 4200.00 may offer some insight.  The Cycle Top support lies at 4868.03 where an aggressive sell signal may be obtained.  The Ending Diagonal trendline and Intermediate support lie at 4794.59 where a confirmed sell signal awaits.

Today’s options chain shows Maximum Investor Pain at 4900.00.  Long gamma may begin at 4950.00 while short gamma lies under 4890.00.

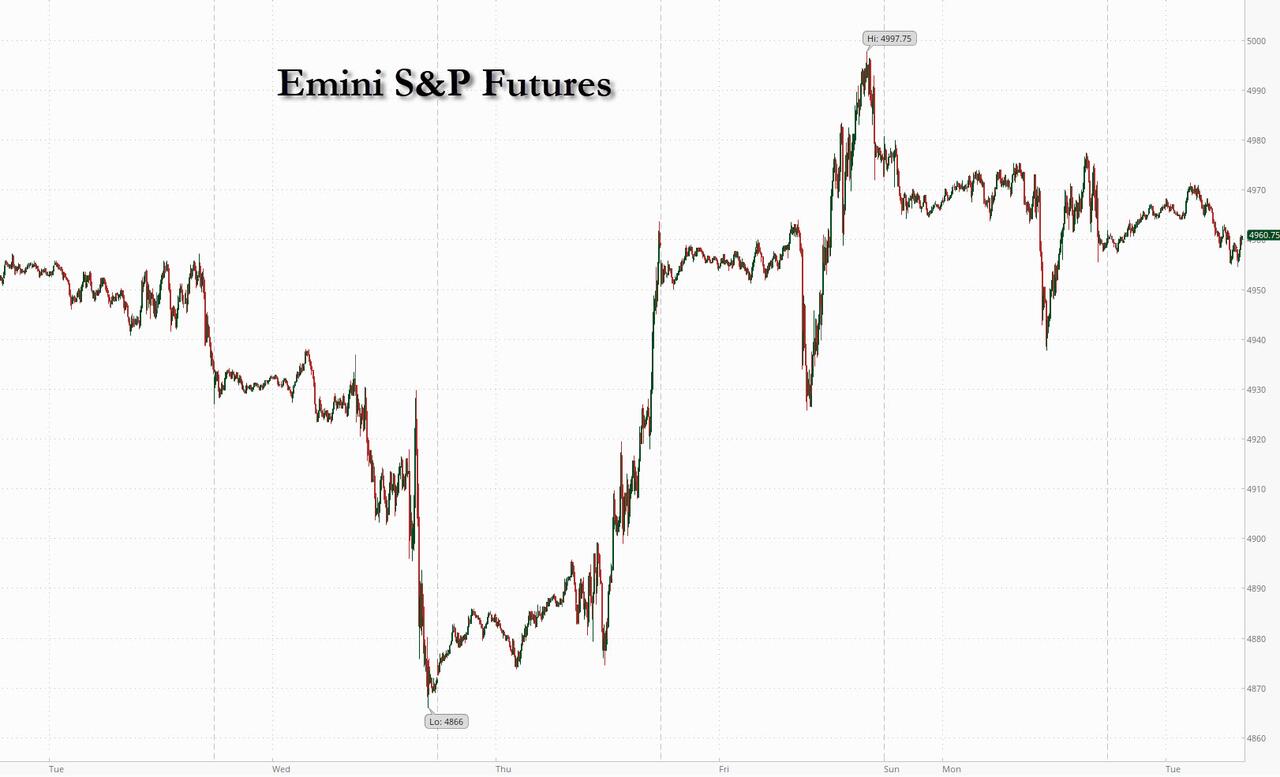
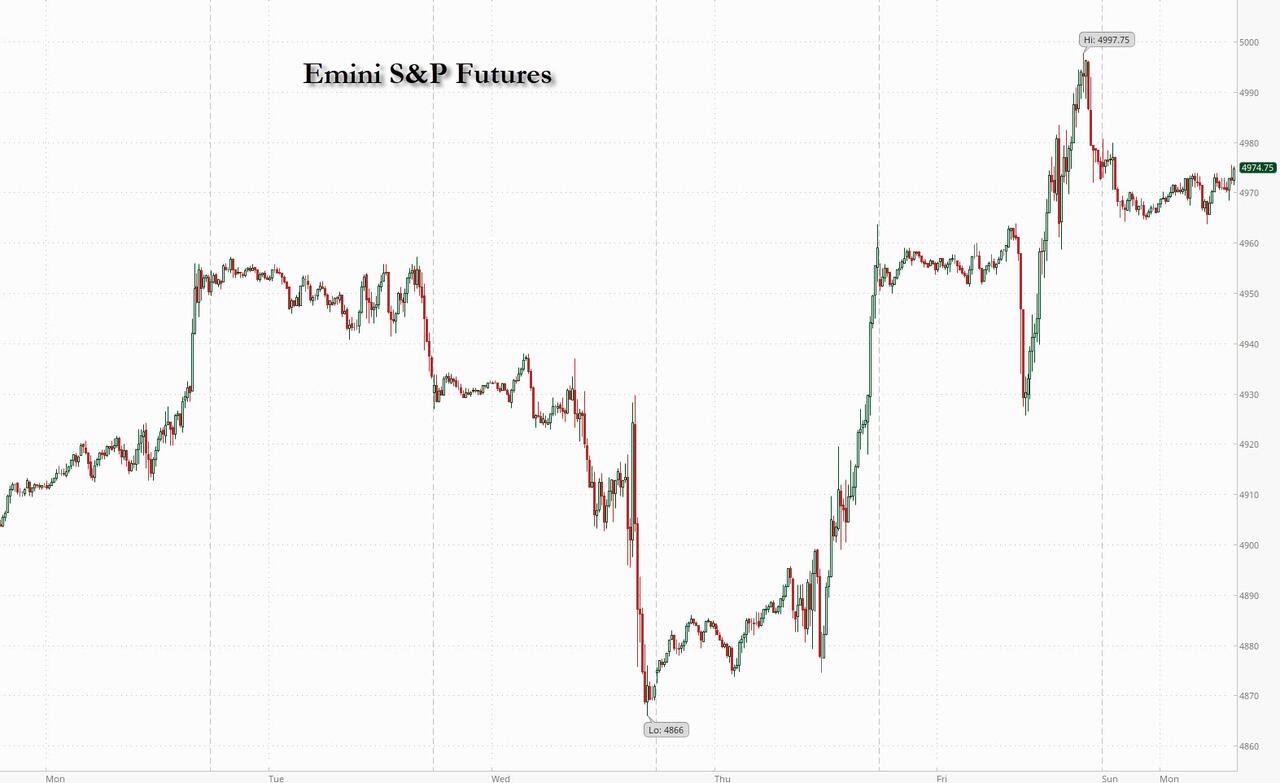
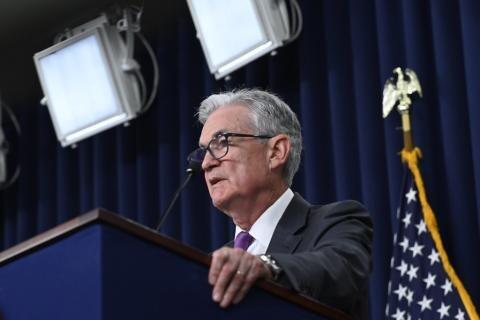
ZeroHedge reports, “S equity futures and bonds fell while the dollar rose after Fed Chair Jerome Powell again pushed back against any hopes of lower interest rates during his 60 Minutes interview, saying it’s “not likely” the Fed would cut in March (which was to be expected after Friday’s blowout jobs number). As of 7:40am ET S&P futures dropped 0.1% after closing at an all time high on Friday when they rose as high as 4998. Meanwhile, European shares edged higher, supported by strong earnings from Italian lender UniCredit SpA while Asia closed red after a rollercoaster session in China which first plunged then saw another stabilization bid from the plunge protection team. 10-year Treasury yields climbed nine basis points to 4.11%, extending a move that started after Friday’s blockbuster jobs report as yields on debt from Australia to Germany rose. Meanwhile, the Bloomberg Dollar Index traded near a two-month high and oil and gold prices retreated, and bitcoin reversed a weekend selloff.”


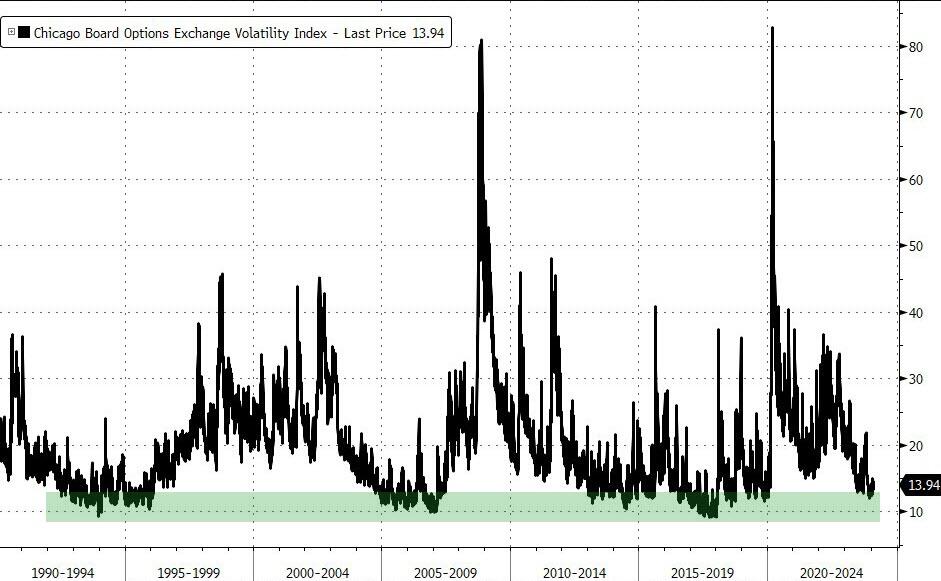
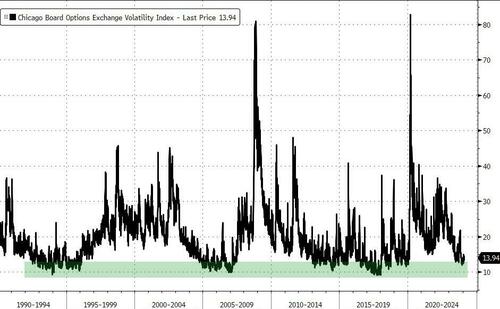
VIX futures surged to 14.44 over the weekend, then pulled back, remaining above 14.00 thus far.  It is nearing the end of the current Master Cycle that may happen in a matter of days, if not hours.  Should VIX rise above the mid-Cycle resistance, it may follow through to the Cycle Top at 19.44.

Wednesday’s options chain shows Max Pain at 14.00  There is a slug of short gamma at 13.00.  Long gamma may begin at 15.00, but only goes to 25.00.  This week’s op-ex may offer a clear change in trend that has been lacking until now.

ZeroHedge observes, “The VIX, often referred to as ‘Wall Street’s fear gauge,‘ is currently portraying a sense of calm among investors, registering well below the 20 level.

For those not acquainted, the VIX draws its value from S&P index options with near-term expiration dates, providing a 30-day projection of volatility.

While the VIX isn’t a precision instrument, it serves as a barometer of market sentiment.”


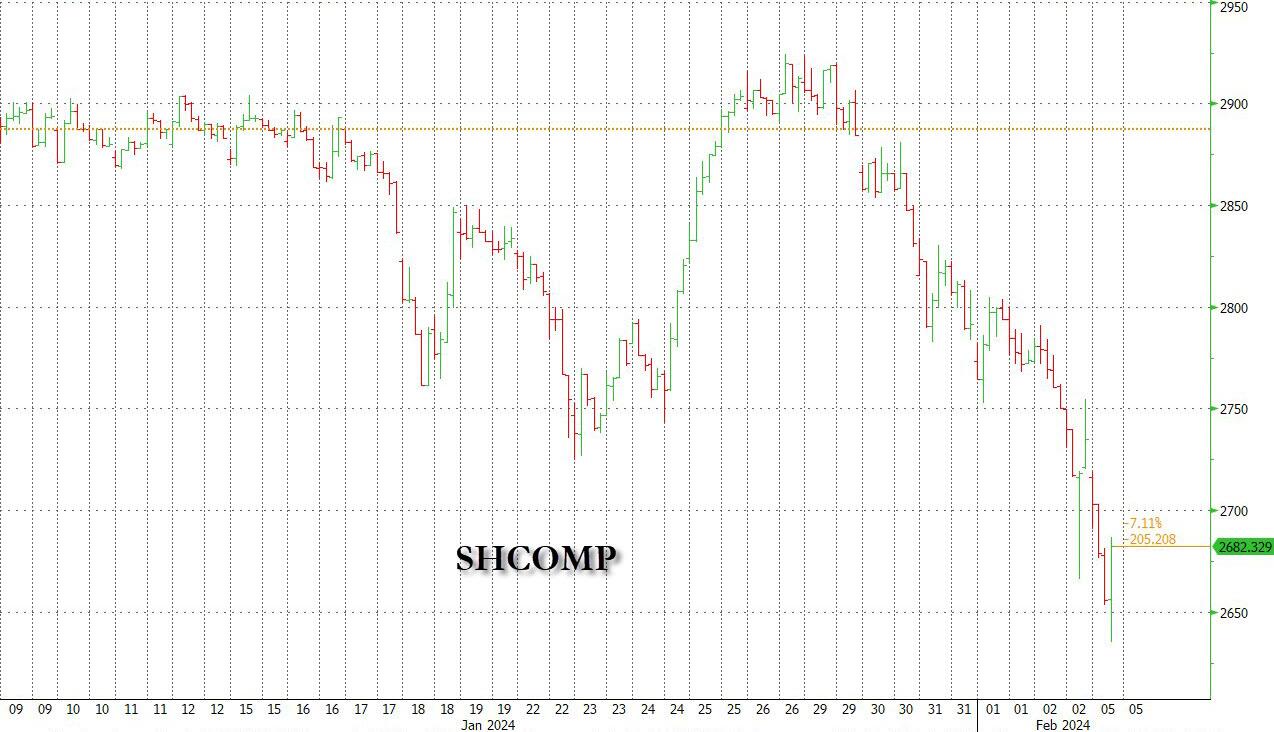
The Shanghai Composite Index undershot its target at 2650.00 to a low of 2635.09 today.  It has bounced to 2700.00 where it lies beneath the bottom trendline at 2730.00.  Today is day 256 of the Master Cycle, suggesting a few more days of bottoming before a rally takes hold.  An aggressive buy signal may be had above the lower trendline at 2730.00.

ZeroHedge observes, “Last week’s dead cat bounce in Chinese stocks – after Beijing did everything but launch a multi-trillion fiscal stimmy bazooka (something it will do, later if not sooner) – is a distant memory, and as Asian markets open for trading in the news week, Chinese markets are cratering with the Shanghai Composite plunging as much as 3.1% to a fresh five-year low..

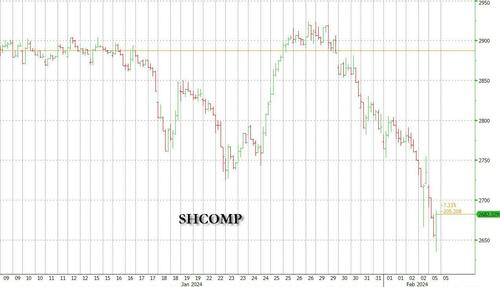
… while the broader CSI 1,000 Index is also in free-fall and also on pace to re-test the 2018 lows with as many as 990 of the 1000 companies of the index in the red.”


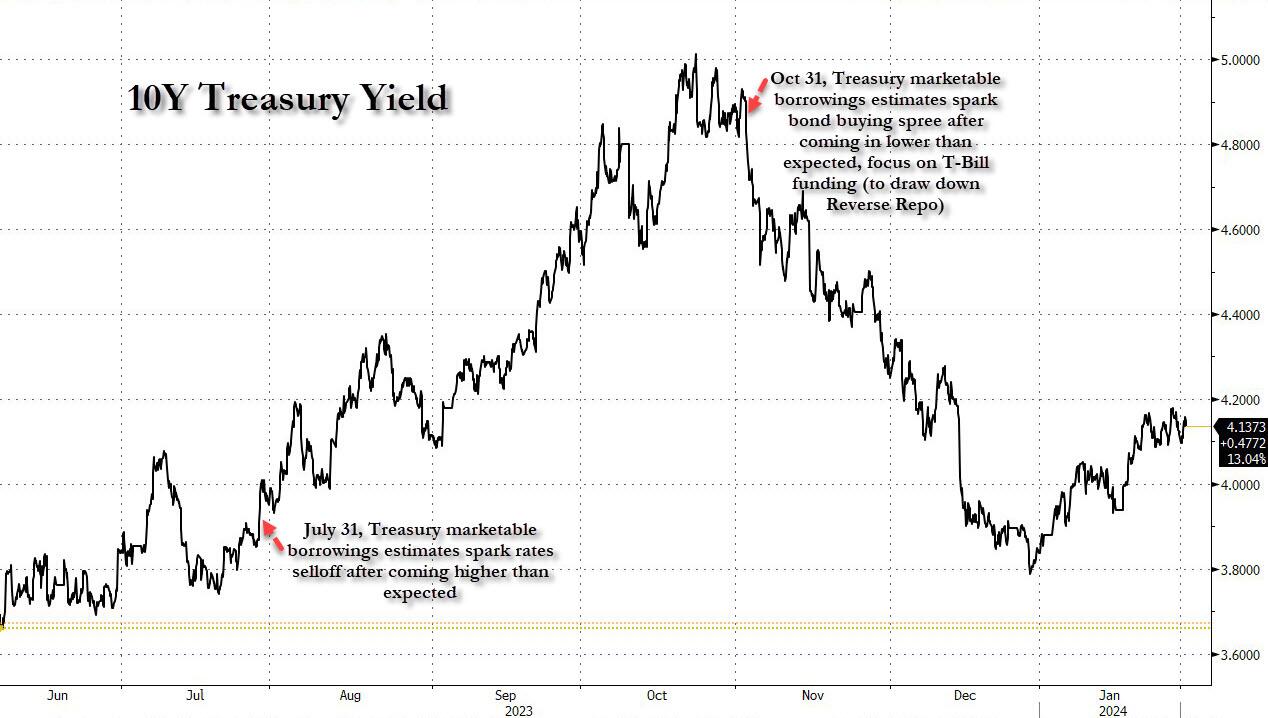
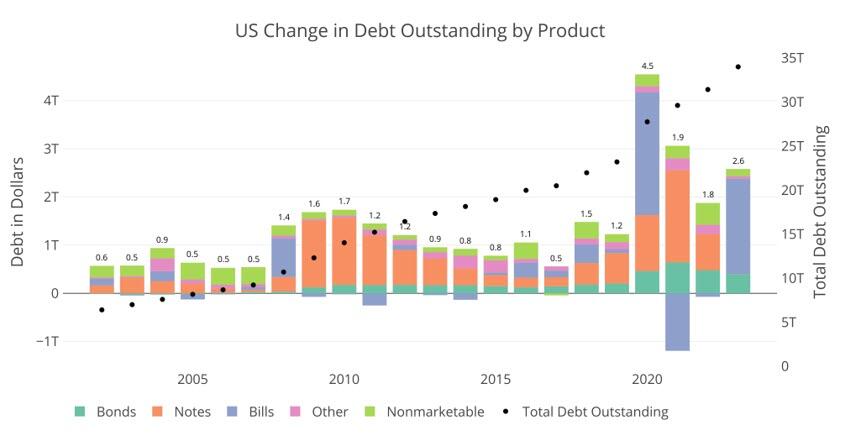
TNX leaped above the trendline at 41.00 to challenge the 200-day Moving Average at 41.04 and the mid-Cycle resistance at 41.55.  This is sending alarms to the investment community.  TNX may be on a confirmed sell signal.  The Cycles Model infers rising rates may dominate until mid-April.  Yellen’s lowball estimate of new treasuries coming to the market were DOA as a record $10 billion may hit the market in 2024.

ZeroHedge remarks, “Interest-rate traders have managed to shake off the extreme conviction they had before the start of the year that the Fed would cut rates as soon as March.

Now, they are starting to ponder whether the central bank will have sufficient incentive to loosen policy in May.

While Jerome Powell reiterated his stance that a rate cut in the winter is unlikely in his much-anticipated CBS interview, anchor Scott Pelley remarked that the Fed Chair suggested the first cut could happen in the middle of the year — even though it wasn’t to be found in the transcript of the interview.”


USD futures rose to a new high at 104.28 this morning as it new trend may extend to the end of March.


Crude oil futures are consolidating beneath its Intermediate resistance at 73.57.  The Cycles Model suggests that, once the consolidation is finished, it may continue its decline to mid-April.  Volatility may pick up this week in oil.

ZeroHedge reports, “One wouldn’t know it from their stock price today, which has been slammed by tech bros shorting anything that does not mention AI at least 100 times in its press release/conference so they can fund their purchase of META 20% higher on the day, but in a time when two-thirds of US companies do not generate any GAAP profits, two of America’s cash flow titans – ExxonMobil and Chevron – reported their second-biggest annual profits in a decade thanks to surging oil production which offset a slide in prices that tempered earnings from the records hit in 2022.

At a time when OPEC+ and Saudi Arabia has been hurting due to a flood of oil by US companies, America’s oil supermajors increased output sharply in their own backyard in 2023, pursuing a strategy of doubling down on oil and gas that has prompted blowback over their commitment to cutting emissions .”

OilPrice.com reports, “Strong buying from China and India at the end of last year pushed Asia’s crude oil imports in January 2024 to the highest level in eight months, data compiled by LSEG Oil Research showed on Thursday.

Crude cargo arrivals in Asia, the prized oil-importing region and the world’s biggest rose to 28.57 million barrels per day (bpd) in January 2024, up from 27.03 million bpd in December 2023, per the data reported by Reuters columnist Clyde Russell. ”


Posted in Published | Comments Off on February 5, 2024

February 2, 2024

9:30 am

Good Morning!

The markets woke up this morning to a stunning payroll reportSPX futures had risen to an overnight high of 4942.10 before the report, but opened near flat.  Confusion reigns.  An aggressive sell signal awaits the SPX beneath 4866.62.  The 1987 trendline, the Ending Diagonal trendline and Intermediate support all group together between 4790.00 and 4793.00, beneath which the sell signal is confirmed.

Today’s options chain shows Maximum Investor Pain at 4915.00.  Long gamma may begin at 4820.00 while short gamma may start at 4905.00.

ZeroHedge remarks, “Well, we did warn readers that anyone hoping for a negative print in an election year would be disappointed, and moments ago the BLS proved us right.

ZeroHedge reports, “US futures and global markets rallied on Friday after tech megacaps Meta and Amazon.com posted blowout earnings (even as Apple dropped on a plunge in China sales and disappointing guidance) and as investors awaited a jobs report expected to support the case for interest-rate cuts. As of 7:30am, S&P 500 futures rose 0.7% while the Nasdaq 100 rose 1% after the indexes advanced by more than 1% Thursday. Rates were flat with 10Y yields unchanged around 3.88% while the dollar dropped and oil extended losses. All eyes will be on today’s jobs report; we also get the latest Factory Orders, Durables Goods and Michigan sentiment (and inflation outlook) prints.”


9:47 am

VIX futures declined to 13.39 before the payrolls report, but jumped to 14.23 near the open.  Again, confusion reigns as to which direction???

VIX options for next Wednesday show no short gamma, no Maximum Pain.  Calls begin at 12.50 and are populated to 50.00.


9:55 am

TNX futures spent the overnight session beneath the trendline until the jobs report.  At that point it soared up to the Intermediate resistance at 38.94 where it currently hovers.  Crossing above the trendline gives TNX a buy signal (a bond sell signal).  Crossing above the Intermediate resistance confirms the signal.

ZeroHedge remarks, “A simply stunning jobs report!

The highest estimate for the Establishment number was 300k and the report beat that high estimate, quite handily, coming in at 353k!

Not only that, but we broke a string of downward revisions, by adding 126k in total to the past 2 reports, with the bulk of that revision for the December report! Back to back months over 300k is impressive and is maybe why confidence numbers have been so high?

Simply a stunning number of jobs created (according to the Establishment survey).”


The USD broke out of its 3-week consolidation as it resumes its rally that may last to early March.


Crude oil futures have fallen beneath all critical support at 73.48-73.66, reinforcing the sell signal.  Additional nearby support is at 67.71, but the main support is the Cycle Bottom and trendline at 64.71.

ZeroHedge reports, “The largest refinery in the US Midwest has been shut down after a power outage hit the facility Thursday afternoon.

BP’s Whiting refinery, located in Whiting, Indiana, is the Midwest’s largest refinery and largest globally for the British multinational oil and gas company. It can process 440,000 barrels of crude oil daily. ”


Posted in Published | Comments Off on February 2, 2024

February 1, 2024

10:23 am (amended)

BKX has crossed beneath the Diagonal trendline and Intermediate support at 95.38, putting BKX on a confirmed sell signal.  The January 30 Master Cycle high indicates a reversal is being made.  Many analysts may recognize the sell signal beneath the 50-day Moving Average at 91.81.  Now that the sell signal is confirmed, BKX may go into serious decline to the end of the month.

ZeroHedge comments, “Several months ago, we predicted that the “Next bank failure will be in Japan.”

It looks like we may be right again.

Following a profit warning from New York Community Bancorp on Wednesday, largely attributed to continued turmoil in the commercial real estate sector (which led the bank to slash its dividend and bolster reserves leading to a 38% plunge in its shares and triggering the largest drop in the KBW Regional Banking Index since the collapse of Silicon Valley Bank last March) Japan’s Aozora Bank slashed the value of some of its US office tower loans by more than 50%, according to Bloomberg. ”


8:10 am

Good Morning!

NDX futures bounced from yesterday’s closing low to an overnight high at 17267.00.  However, the Cycle Top at 17249.00 weighed heavily as the bounce moderated back down beneath resistance.  It is on an aggressive sell, subject to short-term blow-backs, but most profitable after the Master Cycle has turned (January 24th).  Further confirmation of the decline lies at the Ending Diagonal line with Intermediate support at 16875.00.  Most analysts may recognize the trend change beneath the 50-day Moving Average at 16555.99.

Today’s options chain shows Maximum Investor Pain at 17175.00.  Long gamma lies above 17200 while short gamma rules beneath 17150.00.

ZeroHedge weighs in, “A bit too euphoric

BofA writes: “…forward returns when sentiment hits euphoria are not appalling in a bull market. Especially when the market breadth is running at healthy levels, such as today’s.”

Source: BofA

Finally

SPX starting to pay attention to VIX finally. SPX vs VIX inverted.”


SPX futures bounced from the closing low to an overnight high at 4873.30.  It, too, has come down from the high, but remains above the Cycle Top at 4865.00 as I write.  It is on an aggressive sell signal beneath the Cycle Top.  The Ending Diagonal trendline and Intermediate support are at 4779.47, beneath which confirms the sell signal.  Once it has been made, the sell signal may remain in effect until the end of February.

Today’s op-ex shows Max Pain at 4855.00.  Options are tightly grouped with long gamma beginning at 4860.00 while short gamma may begin at 4850.00.

ZeroHedge reports, “US equity futures rebounded after the worst day for stocks since September, as investors prepared for the next wave of megacap tech earnings while resetting expectations for the timing of Fed rate cuts, which have been pushed back from March to May at the earliest (unless of course there is a new banking crisis). As of 7:50am, S&P 500 futures gained 0.5% following a 1.6% plunge on Wednesday after Powell unleashed Hawkamania on the market during his press conference. Nasdaq 100 climbed 0.6% and awaiting earnings from Apple, Amazon and Meta.It’s the latest update from members of the “Magnificent Seven” stocks that have soared amid aggressive expectations from investors for earnings growth fueled by artificial intelligence applications and easier policy from the Fed. Meanwhile, the epicenter of the new banking crisis, New York Community Bancorp rallied following its record plunge. Interest rates reversed some of Wednesday’s losses with 10Y yields rising 2bps to 3.93% while the dollar was flat, reversing earlier gains.”


VIX futures pulled back to 13.87 in the overnight market, then rebounded above 14.00.   It is on a buy signal.  There are possibly four days left in the current Master Cycle.  Its target may surprise you.

The February 7 options chain shows Maximum Pain at 14.  There is no short gamma.  Long gamma may begin at 15.00.


The Shanghai Composite Index declined to a low of 2752.78 today, with a slight bounce into the close.  Odds are best that the decline may continue for another week before a more significant bounce develops.  The bottom may lie near 2650.00.

ZeroHedge remarks, “Evergrande – once China’s largest real estate developer – was forced to liquidate on January 28th. It was yet another strike against the country’s now flailing real estate market, adding to a growing list of China’s economic worries.”


TNX is testing the rising trendline at its low this morning at 38.95.  This decline is considered to be a 1/2 Trading Cycle low and may not decline much further.  As a general rule, they are considered to be short-term corrections of a larger trend.  The US Treasury is auctioning $185 billion of 4-week and 8-week bills today.  The world will be watching, as $121 billion of Notes and Bonds will be on the block next week.

ZeroHedge explains, “The rot caused by easy money will only become fully visible when the hollowed out institutions start collapsing under the weight of incompetence, debt and hubris.

We have yet to reach a full reckoning of the consequences of the era of easy money, but it’s abundantly clear that it ruined us. The damage was incremental at first, but the perverse incentives and distortions of easy money–zero-interest rate policy (ZIRP), credit available without limits to those who are more equal than others–accelerated the institutionalization of these toxic dynamics throughout the economy and society.”

ZeroHedge comments, “Banking sector problems are a prescient reminder that elevated rates are cumulatively inflicting mounting damage across the economy. Ironically, that ultimately means yields are heading higher.

The probability of deeper and perhaps sooner Federal Reserve rate-cuts and an earlier end to quantitative tightening has – even following Wednesday’s FOMC statement – risen at the margin after New York Community Bancorp’s dividend was cut and its equity fell by over a third. This will stoke already-burgeoning inflation pressures, ultimately leaving the US household sector as the buyer of last resort for Treasuries — and it will extract a much higher yield to do so.”


USD futures declined to the 200-day Moving Average at 103.32 this morning as it consolidates its gains thus far.  The rally may continue to early March as it emerges into the upper half of the 258-day trading range.


Posted in Published | Comments Off on February 1, 2024

January 31, 2024

2:30 pm

NDX has declined through its Cycle Top at 17252.00, putting it on an aggressive sell signal.

ZeroHedge remarks, “Since The Fed’s (uber dovish) last meeting on December 13th, the dollar is down, bonds and gold are up, and bitcoin and big-tech are surging… in other words – the QE-trade or ‘buy all the things’…”


10:12 am

BKX may have made its Master Cycle high yesterday on day 271.  This morning it declined beneath its Cycle Top support at 97.24, creating an aggressive sell signal.  Further confirmation may happen with a decline beneath its Intermediate support at 95.27.  The most recognized support is the 50-day Moving Average at 91.62.  The Cycles Model infers a possible 30-day decline to follow.  The decline may be of a greater magnitude than the decline of last March.  It would be beneficial to take heed of this warning.

ZeroHedge reports, “The price of shares in New York Community Bancorp – the regional bank that purchased deposits from Signature Bank last year – are crashing this morning, below SVB crisis lows, after reporting a surprise loss for the fourth quarter and a cut to its dividend.”


8:15 am

Good Morning!

NDX futures declined to 17227.00 this morning before a bounce, challenging the Cycle Top support at 17234.88.  An aggressive sell signal may be made, should NDX decline beneath that level.  A confirmed sell signal may be made beneath the Ending Diagonal trendline and Intermediate support at 16847.76.  Most analysts may assume that the uptrend is intact, which, in fact, it is.  The 50-day Moving Average at 16530.52 is the most commonly used level that supports the uptrend.  However, the Master Cycle high at 17665.26 indicate that the NDX is finished with its uptrend, giving us additional guidance that one may be more aggressive than the majority of players.

Today’s options chain shows Maximum Investor Pain at 17400.00.  Long gamma may begin at 17425.00.  Short gamma starts at 17350.00-17375.00.

ZeroHedge remarks, “Many different shades of overshoot

That stocks lead and actually overshoot various fundamental macro indicators in a bull market is nothing new. To observe this provides neither great market insight nor any tool for money making opportunities. Nevertheless, we wanted to present you with a number of different current overshoots just because it is important to know where we are in general in the overall tactical macro analysis AND we have to say that these overshoots are starting to look a little extreme.”


SPX futures have declined to 4898.40, remaining above the Cycle Top support at 4848.30 with no given signal.  The Cycle Top allows an aggressive sell signal while a decline beneath the Ending Diagonal trendline and Intermediate support at 4772.91 confirms a sell signal.  Most analysts agree that a sell signal may be given beneath the 50-day Moving Average at 4696.07, nearly 5% beneath the all-time high.

Today’s options chain shows a large contingent of calls at 4875.00 and a large wall of puts at 4850.00, with Max Pain lying between the two.  While the SPX remains in long gamma, it may not take long to turn the table.

ZeroHedge reports, “US equity futures slumped after earnings from tech giants GOOGL, MSFT and AMD fell short of Wall Street’s lofty expectations and as investors prepared for the first interest-rate decision of the year from the Fed (full preview here).
As of 7:45am ET, contracts on the Nasdaq 100 slid 1.1%, while those on the S&P 500 retreated 0.5% with Microsoft, Alphabet and Advanced Micro Devices all sliding in premarket after their updates failed to match the market hype around tech megacaps and artificial intelligence that has helped drive the recent record-setting rally in US stocks. The balance of MegaCaps are also lower as we await the Fed. Bond yields are modestly lower as part of a bull steepening; the US dollar is stronger despite consensus expecting more dovish signaling from Powell, and commodities are mixed. JPM asks if with Russell futs positive, will we see the pain trade (+Value/-Growth with MegaCap underperformance) come to fruition near-term? The macro data focus is on ADP, ECI (Fed’s preferred measure of wage inflation), Chicago PMIs, Trsy Refunding Announcement, and then Fed meeting later today.”


VIX futures have fallen to 13.18, just above the 50-day Moving Average at 13.06.  While the VIX is near a significant low, it is still on a buy signal.  It appears that there may be political reasons for keeping the VIX suppressed at least until the end of the month.  Today is day 252 of the Master Cycle, suggesting a possible new low in the making.

Today’s op-ex shows a possible Max Pain at 145.00, but with no short gamma beneath it.  Long gamma may begin at 17.00.

ZeroHedge wishfully projects, “Let the last phase of the melt-up begin

BlackRock has upgraded U.S. stocks to overweight and believes the AI-Driven rally could expand within the next 6 to 12 months.

“The stock market’s tech-driven rally, fueled by investor excitement over artificial intelligence, should “broaden out as inflation falls further, the Fed starts to cut rates, and the market sticks to its rosy macro outlook,” said a team of strategists led by Jean Boivin, head of the BlackRock Investment Institute, in their weekly commentary research note on Monday.”


The Shanghai Composite Index has fallen to 2782.59 this morning.  The analysts have gone quiet as motivated sellers have taken over.  The Cycles Model calls for an end to the decline in the next week, but the additional damage may be staggering.  The Model suggests a possible target near 2650.00 but. as usual, when emotions are involved the market tends to overshoot.


TNX opened lower this morning, having declined to 39.63, beneath its target at Intermediate support at 40.06.  However, the corrective decline may be nearing completion, as TNX may be making a (lesser) one-half Trading Cycle low.  We have just learned this morning that the current Treasury offering  has been expanded already, voiding the earlier announcement of a reduced Treasury offering.  While today’s offering of  $60 billion 17-week notes may not roil the market, next week’s offerings may shatter expectations of a calm Treasury market.

ZeroHedge reports, “As highlighted in our preview, and as the Treasury itself noted in its last refunding announcement, moments ago the latest Treasury Quarterly Refunding announcement confirmed that it is indeed boosting the size of its quarterly issuance of long-term debt for a third straight time –  rising to $121 billion, just as consensus expected – and said that it “does not anticipate needing to make any further increases in nominal coupon or FRN auction sizes, beyond those being announced today, for at least the next several quarters.”


USD futures have declined to 102.86 thus far as it makes a (lesser) Trading Cycle low.  Potential targets are the 50-day Moving Average at 102.75 and Intermediate suport at 102.33.


Crude Oil futures have slipped beneath the mid-Cycle support at 77.83 this morning to a morning low at 76.61, putting crude on a sell signal.  Should it decline beneath the trendline at 64.65, there may be a waterfall event of epic proportions.  I may not divulge the outlook for a while, but suffice it to say that it may not be advisable to be long oil.


Posted in Published | 3 Comments

January 30, 2024

1:42 pm

BKX is making its final probe toward the 61.8% Fibonacci retracement value nine months after its last waterfall event.  Today is day 271 from the day of its panic low on May 4, 2023.  A new panic event may be about to start imminently.  The chart foretells that the banking system as we know it may disappear by the end of the year.

ZeroHedge warns, “Last Thursday, Bloomberg reported that federal regulators are preparing a proposal to force US banks to utilize the Federal Reserve’s discount window in preparation for future bank crises. The aim, notes Katanga Johnson, is to remove the stigma around tapping into this financial lifeline, part of the continuing fallout from the failures of several significant regional banks last year.

This new policy is reminiscent of the Fed’s actions during the 2007 financial crisis, where financial authorities encouraged large banks to tap into the discount window, taking loans directly from the Federal Reserve, to make it easier for distressed banks to do the same. The hesitancy from financial institutions to tap into this source of liquidity is justified. If the public believes a bank needs support from the Fed, it is rational for depositors to flee the bank. The Fed’s explicit aim is to provide cover from at-risk banks, trying to hold off bank runs that are an inherent risk in our modern fractional reserve banking system.”


7:45 am

Good Morning!

NDX futures rose to an overnight high at 17622.70, then pulled back.  It has not been able to overtake the January 24 high at 17665.26.  I mentioned earlier that the NDX would be the most likely to lead the stock indices down from the high.  This may be a good indicator of that possibility.  NDX is in throw-over above its Cycle Top at 17215.32 where an aggressive sell signal may await.  The Ending Diagonal trendline and Intermediate support lie at 16806.82, beneath which lies a confirmed sell signal.  This is a possibly explosive week for the stock indices.

Today’s options chain is upside-down with 120 call contracts at 17525.00 while there are 159 put contracts at 17620.00.  Dealers own many of these puts as they take the opposite side of retail investors.

ZeroHedge comments, “Last summer, I was having lunch with a friend at a plain vanilla shop, who kept checking his phone and muttering, “this NVIDIA is killing me.”

After the third time in five minutes, I had to ask:

Me: You run a long-only fund. You don’t short. How is NVIDIA killing you?

Him: Kuppy, you don’t get it. You do your own thing. I’m benchmarked. I’m underweight NVIDIA and trailing massively. There are guys at my firm who are 500bps overweight. One guy is even 700bps overweight. They’re killing it.

Me: Who cares?? Just buy something else.

Him: NVIDIA goes up every day. Clients keep asking about it. I feel like an idiot to be underweight.

Me: So, then why don’t you buy some if it’s worrying you so much?

Him: I keep waiting for a pullback. Damn thing is up another 3% today. It never pulls back. I’m getting further and further behind. Not sure what I’m going to do. NVIDIA is killing my year…”


SPX futures reached an overnight high at 4930.70, in a nosebleed high, before pulling back.  This rally puts SPX in the 99th percentile for rallies in the first month of the year.  Today is day 279 in the current Master Cycle.  SPX is in throw-over in both time and price.  The Cycle Top support is at 4841.72, beneath which an aggressive sell signal lies.  The Ending Diagonal trendline and Intermediate support lie at 4763.48, beneath which lies a confirmed sell signal.

Today’s op-ex shows a highly contested Max Pain level at 4900.00.  Above are calls and beneath it puts have the majority.

ZeroHedge reports, “After yesterday’s late day meltup, sparked by an overly optimistic forecast of Treasury supply, which sent stocks to a new  all time high, US equity futures drifted lower in a tight range as investors looked ahead to the flood of tech earnings (Alphabet and Microsoft are due after the close) for insights on whether the record-breaking rally in equities can continue, while bracing for key announcements from the Fed and Labor department. Monday’s latest record close pushed the S&P 500’s gains this month to 3.3%, while the Nasdaq 100 has surged 4.6%. Europe’s Stoxx 600 index crept to a new two-year high as autos and banking stocks led gains. Bitcoin is on course to advance for a fifth straight month, after rising 2% in January; The last time the largest digital asset managed a winning streak like this was the October 2020 to March 2021 stretch oiled by pandemic-era easy money. As stocks dropped, both 10Y TSY yields and the US dollar traded largely unchanged. Oil dipped as Biden refuses to retaliate against Iranian proxies, terrified any escalation will send gas prices soaring and crush his reelection chances.”


VIX futures rose to 13.71 after pulling back from a near-breakout at 15.35 yesterday.  VIX is on a buy signal as it closed above the 50-day Moving Average at 13.07.  There is approximately a week left in the current Master Cycle.  There is a strong likelihood that the VIX may power its way up to the Cycle Top at 19.51 by then.   It is recognized that the VIX is being suppressed.

Tomorrow’s options chain shows friction among the puts and calls between 13.00 and 14.00.  Long gamma begins at 15.00 and becomes earnest from 17.00 to 25.00.


The Shanghai Composite Index reversed back beneath its Cycle Bottom support at 2843.58.  Motivated sellers stepped in before the Shanghai Composite could reach the 50-day Moving Average at 2943.33.  There is another possible week of decline to reach the next Master Cycle terminus.  If so, a possible target may be in the vicinity of 2650.00.

ZeroHedge remarks, “Just local problems?

The China bear is seen as a local problem still. We saw a similar type of reasoning during the 1997 Asian crisis, but local issues went global. Don’t forget that China is an important macro asset.

Source: Refinitiv

Previous big China fades

Recall the 2015 China frenzy and the subsequent crash of Chinese equities that spilled over to SPX? Big China fades should not be dismissed.”


TNX has pulled back to 40.35 in the overnight session.  You may recall that I had featured the 50-day Moving Average at 40.19 as a pullback target.  There may be another day or so of decline or consolidation before resuming the uptrend.

ZeroHedge remarks, “After two very “eventful” quarterly refunding announcements by the Treasury, the first of which sent yields soaring to decade highs, when the Treasury forecast higher than expected coupon issuance in July, followed by a mirror image in October, when the Treasury surprised with slightly lower coupon issuance (offset by a surge in Bill issuance)…

… moments ago the Treasury published the first part of this week’s closely watched Quarterly Refunding Announcement, when at 3pm ET it released the estimates borrowing estimates (and overall sources and uses of Treasury debt and cash) for calendar Q1 and Q2, both of which came in well below estimates.”

ZeroHedge comments, “Born in the 90s and tested to destruction during the Great Financial Crisis, modern-day central bank independence is effectively over in all but name. Persistently large government deficits, central banks with trillions of dollars of sovereign debt and the political toxicity of elevated inflation make it impossible any longer for the Federal Reserve, ECB et al to set monetary policy fully independently from their government overseers.”


USD futures have declined beneath the 200-day Moving Average at 103.31.  The Cycles Model may treat this as a possible Trading Cycle low that may test the 50-day Moving Average at 102.77.  USD may show trending strength appearing next week.


Posted in Published | 1 Comment

January 29, 2024

8:00 am

Good Morning!

NDX futures remain flat near 17400 over the weekend.  A top has been made at 17665.26 on Wednesday, day 273.  Since then, NDX has eased back into “neutral” near 17400.00, neither making new highs nor breaking below critical support.  The Wave structure appears to be complete.    The Cycle Top support is at 17189.84, beneath which lies an aggressive sell signal.  Confirmation of the sell signal lies at the ending Diagonal trendline and Intermediate support at 16760.53.

Today’s options chain shows maximum Investor Pain at 17500.00.  Long gamma begins at 17550.00.  Short gamma starts at 17475.00.  The NDX options market is the realm of very large investors.  Do they know something we don’t?

ZeroHedge observes, “Narrowness

The top 13 stocks have driven the whole of the S&P’s YTD upside with the top five contributing ~70%.

Source: Bloomberg

The January indicator

Since 1953, when the S&P 500 ended January up at least 2%, it finished the rest of the year with a median gain of 13.5% and finished green 84% of the time.”

Source: Bespoke


SPX futures remained near the flat line over the weekend after Friday’s new high at 4906.69 on day 275 of the Master Cycle.  It is in throw-over, both in time and price.   The first critical support is the Cycle Top at 4834.366, beneath which lies an aggressive sell signal.  The 1987 trendline lies near 4787.00 along with Short-term support, giving us another aggressive sell.  The Ending Diagonal trendline and Intermediate support lie near 4750.00, giving us a confirmed signal beneath that level.

In today’s op-ex, 4900.00 is a highly contested Max Pain level.  Long gamma starts at 4910.00 while short gamma begins at 4890.00.  The options appear to be a tightly coiled spring, ready to be set off.

ZeroHedge reports, “Markets opened the “crazy busy” week unchanged as investors readied for central bank updates from both the Fed the the BOE, braced for the January jobs report and the Treasury refunding announcement, and prepared for a flood of earnings as a third of the S&P by market cap is set to report. As of 8:00am ET, S&P futures were flat after the S&P 500 closed out a third week of gains and finished Friday near its record high; Nasdaq futures rose 0.2% because well, they always rise. Oil touched the highest levels since November in intraday trading, before pulling back as the Biden admin promptly slammed down the move higher that directly jeopardizes Biden’s re-election changes. The US said Iranian-backed militants killed three service members and wounded others in a drone attack in Jordan, with President Joe Biden pledging to retaliate.”


VIX futures are trading at the higher end of Friday’s trading range, although not breaking above it.  The current Cycle must show a break above the mid-Cycles resistance at 15.15 to claim a positive trend.

Wednesday’s op-ex shows Max Pain in a range from 13.00 to 14.00.  There is no short gamma.  Long gamma begins at 15.00.


TNX is hovering near 41.00 as bond volatility moves lower.  However, it may not last.  This week the Treasury is auctioning off $80 billion of 42-day bills and $149 billion of 13-week and 26-week bills with no notes or bonds offered as Yellen attempts to keep rates down. $229 billion in one week!.  What could possibly go wrong?

ZeroHedge remarks, “In 2023, the Treasury added $2.6T to the national debt. While that number alone should be enough to scare anyone, the details reveal something even more concerning. $2T of it, or 77%, was financed entirely with short-term Treasury Bills maturing in less than a year. The chart below shows the debt issuance trend over the last 20 years. As shown, the Treasury typically relies on medium-term debt (2-10 Year Notes) to fund the budget deficit. 2023 was a massive change in standard procedure as shown by the giant light blue bar on the right of the chart.”


USD futures are consolidating above the 200-day Moving Average at 103.20 this morning.  The current Master Cycle may continue through the first week of March, giving it time to rally toward the Cycle Top resistance at 106.79.  Should this rally be a Wave (3), it is likely to emerge above the Cycle Top for a period of time.


The Shanghai Composite Index fell back beneath Intermediate support/resistance at 2908.00 on Monday morning.  With a little more than a week to go in the current Master Cycle, the Shanghai Composite must rally above the 50-day Moving Average an descending trendline at 2947.11 to have ny hope of changing to a positive trend.  We have seen that, since last August, any probe at the 50-day was met with motivated selling.  In addition, the Beijing authorities have outlawed short selling, removing the only possible motivated buyers (short covering) at the lows.

ZeroHedge observes, “China flows

Starting to turn positive.

Source: JPM PI

National team support

Flows into mainland China were very elevated by historical standards, reaching about $12bn total. Notably, the inflows were almost entirely driven by domestic investors, suggesting “National Team” support.”


Posted in Published | 7 Comments

January 26, 2024

8:00 am

Good Morning!

NDX futures rose to 17474.80 this  morning after making its All-tim closing high yesterday.  The All-time intraday high was made on Wednesday.  Levels to watch for are the Cycle Top, at 17166.88, where an aggressive sell signal lies.  The second level is at 16712.51, where we see the Ending Diagonal trendline and Intermediate support.  The two lower levels confirm the sell signal.

today’s options chain shows Maximum Investor Pain at 17600.00.  Long gamma may start at 17650.00.  Short gamma may begin at 17550.00.

ZeroHedge remarks, “The merger wave starts now

Our banker friends are more busy than any other time in the past 3 years. We are hearing more and more chatter about willingness to actually commit to M&A. This is natural in this stage of the economic cycle and equity bull market. We have very high conviction that the M&A wave starts now and it will obviously matter for stock selection. We see a decent chance that this wave morphs into a merger mania tsunami, and then it will matter for the overall market. Stay tuned. And do not short take-out candidates.

The strong case for M&A

Rising interest costs have brought M&A activity to a standstill over the past two years…”


SPX futures rose to an 9vernight high at 4894.80 where it may be consolidating.  Today is day 275 in the (former) Master Cycle.  SPX is in throw-over and may reversa as quickly as it rose to this level.  Once the decline starts, it may proceed to the end of February.

Today’s options chain shows Max Pain at 4885.00.  Long gamma may start at 4890.00, while short gamma may begin at 4880.00.  A very tightly coiled spring that may go in either direction.

ZeroHedge reports, “After hitting a record high for 5 consecutive days, the daily tech-led meltup is in peril after Intel reported solid earnings but disappointed consensus with weak guidance, sending the stock tumbling 11%, and putting pressure on the Nasdaq which is down 0.2% as disappointing guidance from KLA also hit semiconductor stocks; AMD and Nvidia also retreated. S&P futures are also lower on the day, if well above session lows, while Europe is higher 1% to a 2 year-high led by luxury stocks after LVMH gave reassuring results. Asian stocks closed lower, snapping a six-day win streak, as tech shares stumbled and the China rally halted amid some skepticism over the impact of market rescue measures. 10Y yields inched modestly higher, rising 2bps to 4.12% after earlier falling below 4.10%. The US dollar dropped, also reversing an earlier move in the opposite direction. Oil dipped after surging on Thursday and bitcoin recovered recent losses, trading above $41000.”


VIX futures rose to a morning high at 14.10.  It is in a period of strength that may last up to two weeks.  It is above the 50-day Moving Average at 13.11, giving it a buy signal that may be unrecognized by most analysts.  VIX may get more recognition once it rises above the mid-Cycle resistance at 15.17.

The January 31 op-ex has virtually no short gamma.  Long gamma kicks in at 15.00 and runs to 39.00.


TNX appears to be consolidating between the trendline at 41.00 and the 50-day Moving Average at 41.47.  It is at a half Trading Cycle which may allow a short-term decline to the 200-day Moving Average at 40.89, or possibly Intermediate support at 40.19.  All of next week’s Treasury auctions will be in bills (no notes or bonds) to keep longer-term Treasury yields down.

Yesterday ZeroHedge noted, “After yesterday’s catastrophic 5Y auction, there were concerns that today’s traditionally weaker 7Y “belly” auction would send yields into the stratosphere. And despite a modest tail, that did not happen because today’s sale of $41BN in 7Y notes went off without a hitch.”

ZeroHedge follows up with this comment, “A continued bear steepening in the yield curve may deter the Treasury from significantly increasing auction sizes in longer-term debt at its quarterly refunding announcement next Wednesday.

If proof were needed that the lines between fiscal and monetary policy are becoming ever more blurred, and that total central-bank independence is – de facto – a thing of the past, then the market’s heightened attention to Treasury refunding announcements is it.

Both of the last two were market-moving events. The next one may be too, but that will depend on by how much auction sizes of different maturities are expected to rise, and the behavior of yields and the curve in the run-up to the announcement.”


The Shanghai Composite Index rose through Intermediate resistance at 2909.64 only to lose momentum beneath the 50-day Moving Average at 2950.03, stopping its ascent at 2924.31.  There is a descending trendline just above it that also indicates the decline has not been overcome.  It seems that foreign buyers have taken an interest, but Chinese investors may be more willing to sell rather than buy this market.  The “quasi-bazooka” of stabilizing measures by the Chinese authorities may be set up for another failure..


Posted in Published | 8 Comments

January 25, 2024

2:18 pm

BKX, our liquidity proxy may have topped out its retracement at 96.66.  Should it remain beneath its Cycle Top resistance at 96.35, it may create an aggressive sell signal.  Confirmation of the sell signal lies beneath Intermediate support at 94.16.  Should that occur, the Cycles Model implies a decline through the end of February.  It looks like the “free money” arbitrage has just been cut off, as well.

ZeroHedge observes, “The Fed just tweaked its BTFP programme. It’s still being phased out on 11 March, but effective immediately the adjusted rate for borrowing will ”be no lower” than that of reserve balances. This prevents markets arbitraging the BTFP’s typical 4.88% rate vs. the 5.40% rate on reserve balances, with this gap widening due to the market expectation –read ‘salivation’– of rate cuts. In short, Wall Street was making money thrice: first, via lower bond yields (“because rate cuts”), second on higher everything else (“because rate cuts”), and third because of arbitrage: markets always exploit those variations rather than lending consumer savings to businesses for productive investment, as economics textbook wrongly teach. So, that’s one blow vs. easy money. Another is this morning’s chatter that the BoJ might raise rates before the Fed cuts following the strong US PMI data seen yesterday. If the looming Fed meeting doesn’t clearly open the door for that magical March rate cut, then it looks likely yields can travel significantly higher again, short term.”


8:00 am

NDX bounced to 17546.00 but did not make a new high.  Both the Wave structure and Cycle are complete.  It has overshot the Cycle Top at 17137.69 and must decline beneath it to trigger an aggressive sell signal.   The Ending Diagonal trendline and Intermediate support lie at 16664.29 and may offer a confirmed sell signal.

Today’s options chain shows Maximum Investor Pain at 17490.00.  Long gamma may start at 17500.00 while short gamma begins at 174890.00.

ZeroHedge gives some common wisdom, “NASDAQ is overbought…

…but we can stay in overbought land for longer than most can “endure” (see May – August last year). Use that 21 day moving average as the medium term “compass”.


SPX futures rose to a morning high of 4877.00, but now maintains a lesser gain.  Both the Cycles Model and Wave structure strongly suggest the rally may be over on day 273.  The Cycle Top support is at 4819.90, where an aggressive sell may be made.  The 1987 trendline is at 4780.00 while the Diagonal trendline is at 4740.00 and Intermediate support is at 4733.74.  Both of these levels may confirm a sell signal.  SPX is in throw-over, which makes it more difficult than usual to get good signals.

Today’s op-ex shows Max Pain at 4870.00.  Long gamma may begin at 4880.00 while short gamma rules beneath 4850.00.

ZeroHedge reports, “After the S&P eeked out modst gains yesterday despite an intraday swoon, which helped it close for a 4th consecutive, the question is whether we can get a five-peat: for now, it’s on the fence, with S&P 500 futures flate ahead of a slew of US economic data and a meeting of the European Central Bank.while Nasdaq 100 futures inched up 0.1% as the market tried to shake off the gloom from Tesla’s disappointing earnings late on Wednesday. While shares in the electric carmaker dropped 8% in US premarket trading, those in IBM gained 7% after it delivered a positive revenue outlook. American Airlines Group Inc. and Blackstone Inc. also rose after reporting profits.”


VIX futures rose to 13.31 this morning, above the 50-day Moving Average at 13.13 and on a buy signal.  The Cycles Model proposes today as a day of trending strength.  There may be another two weeks of rally left in this Cycle..  It’s target may be the Cycle Top resistance at 19.70.

The January 31 op-ex shows a small short gamma layer at 14.00.  however, it may be overridden by a crowd of calls at 13.00.  If long gamma doesn’t’ start there, it certainly takes hold at 15.00 and runs to 30.00.

ZeroHedge remarks, “Perpetual motion machines shouldn’t exist. Yet the stock market seems to have found one. After initially striking turbulence when the Federal Reserve began hiking rates in 2022, equities have stabilized and are in a seemingly unshakable uptrend. Credit, volatility, option speculation and well-behaved inflation expectations are in a virtuous circle, keeping the market grinding higher.

Stocks are navigating the thin aperture of the Panama Canal.

Either a return to a low-and-stable inflation regime, or a re-acceleration in price growth — which unanchors inflation expectations and decimates the real value of stocks — would leave them in a precarious spot.”


The Shanghai Composite has risen above its Cycle Bottom resistance at 2852.60 and closed at 2906.79.  Serious resistance now lies at the 50-day Moving Average at 2952.64.  This may be a level at which motivated sellers step back in as they did in August and November of 2023…and January 2024.  Remember, the Chinese authorities have banned short selling, which eliminates motivate buyers at lows.  Now, despite government intervention, there are only motivated sellers until the market completely exhausts the sellers.  After all, why would anyone buy into a falling market where there is no rationale for selling at a profit.

ZeroHedge remarks, ““Fool me once, shame on you; fool me 11 times… you can’t get fooled again.”

‘W’ would be proud of the efforts that Beijing’s plunge-protectors have made over the past few months – all to no avail – in staunching the blood-letting from Chinese stock markets…

Source: Bloomberg

But, amid the apparent panic of the last few days (broader short-selling restrictions, a multi-trillion-yuan rescue package, and a RRR cut), a number of Wall Street traders are asking “is this China’s inflection point?”


TNX opened above the 50-day Moving Average at 41.57 to a high of 41.86, then pulled back.  It may seek support at the 200-day Moving Average again at 40.86.  The Cycles Model suggests trending strength may return as early as today or tomorrow.  The Cycles Model contends that the uptrend may continue as far as mid-April.  The Treasury Auction calendar shows 7-year notes on the block this afternoon.  This may be creating jitters as the 5-year note auction yesterday was a bust.

ZeroHedge reports, “After yesterday’s solid 2Y auction, many were confident (certainly Bloomberg’s Market Live commentators who are the kiss of death for auctions) that today’s sale of 5Y paper would be smooth sailing. They were once again dead wrong, because the just concluded sale of $61 billion in 5Y paper, the highest amount for sale in this maturity since 2021 and matching the record high…”


Posted in Published | 8 Comments