January 24, 2024

3:28 pm

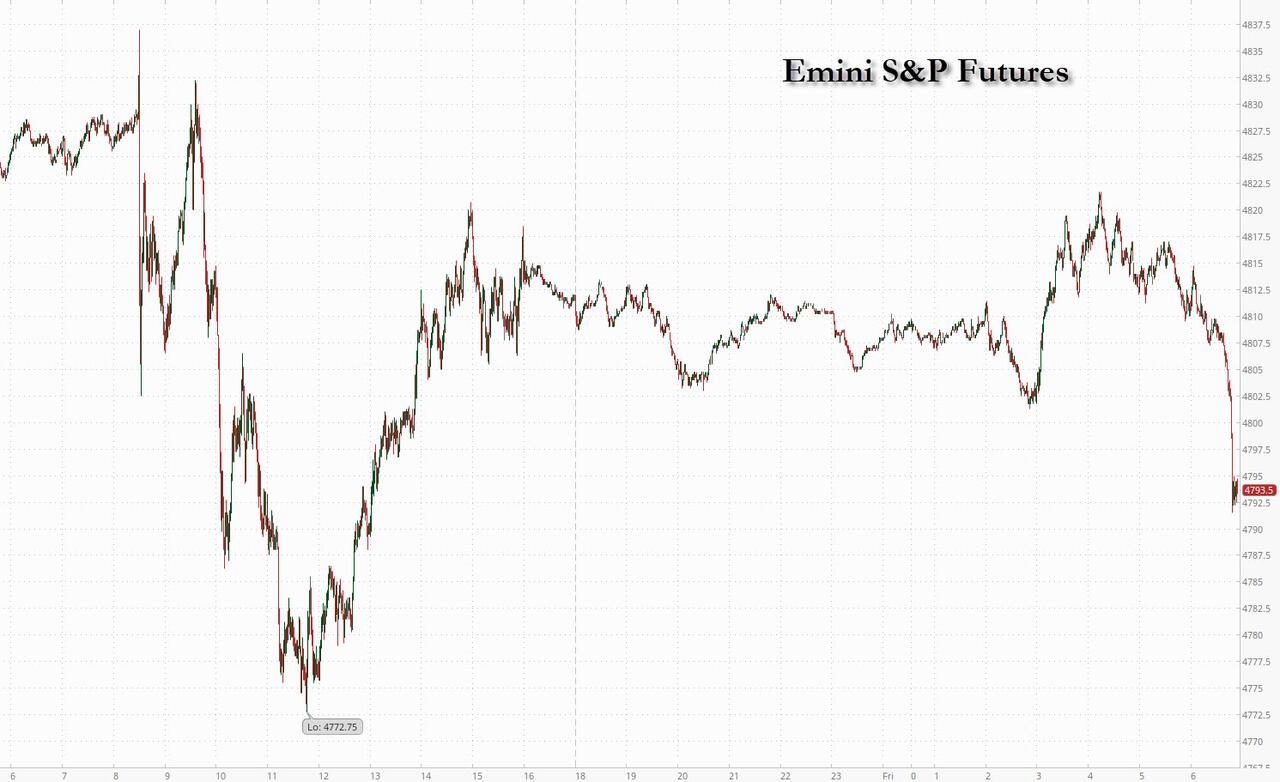
SPX appears to be making a round trip back to the flat line.  Just be aware that the daily Cycle Top is at 4820.00 where an aggressive sell may be made.  We may have just seen the blow-off top that often comes with the end of a trend.  Dealers have now joined hedge funds and CTAs in becoming net short.  Indicators are poised for a reversal.  The “news” lags reality.

ZeroHedge remarks, “The VVIX crash

VVIX at new recent lows.


8:15 am

Good Morning!

NDX futures have risen to 17587.50 thus far this morning, on day 273 of the Master Cycle.  It is in throw-over and may be completing its final probe in this series.  Note the Triangle formation ending in October 2023.  It normally precedes the final burst to the top of a series of Waves.  Should this not be the top, an alternate formation is being considered.

Today’s options chain shows Maximum Investor Pain at 17400.00.  Long gamma is scarce.  Short gamma begins at 17350.00.


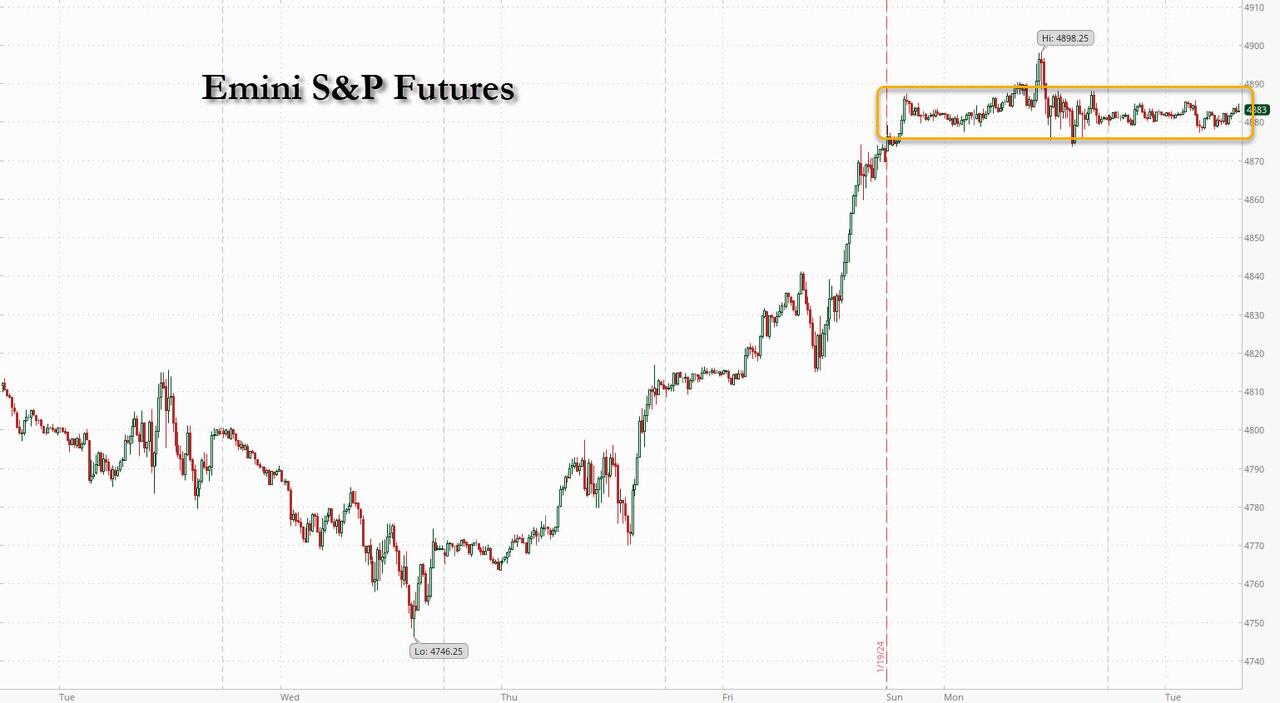
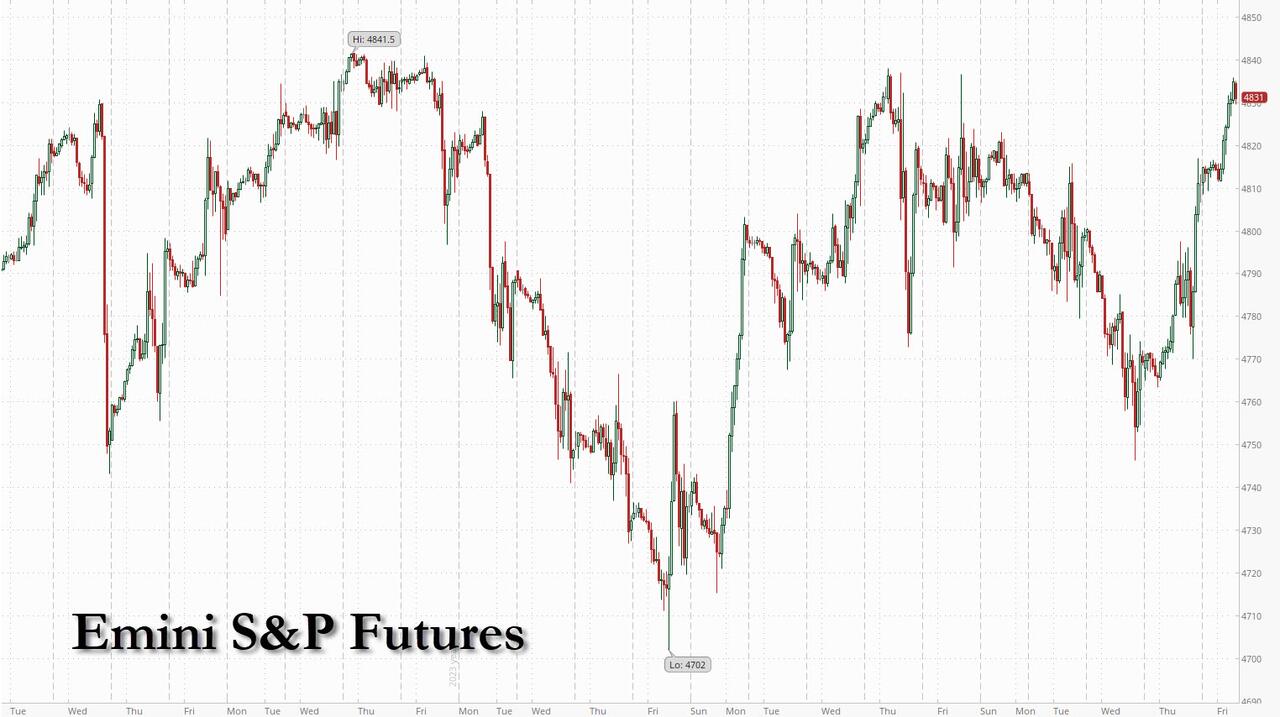
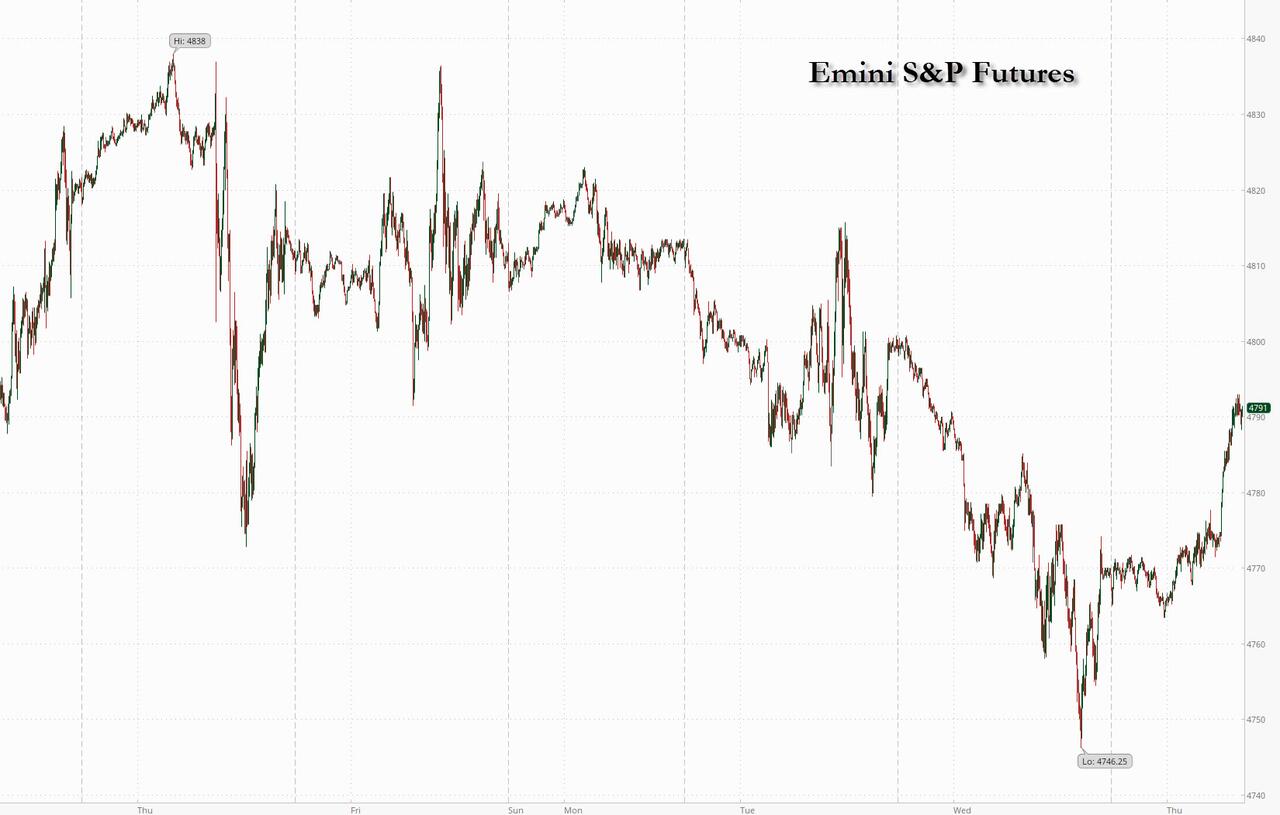
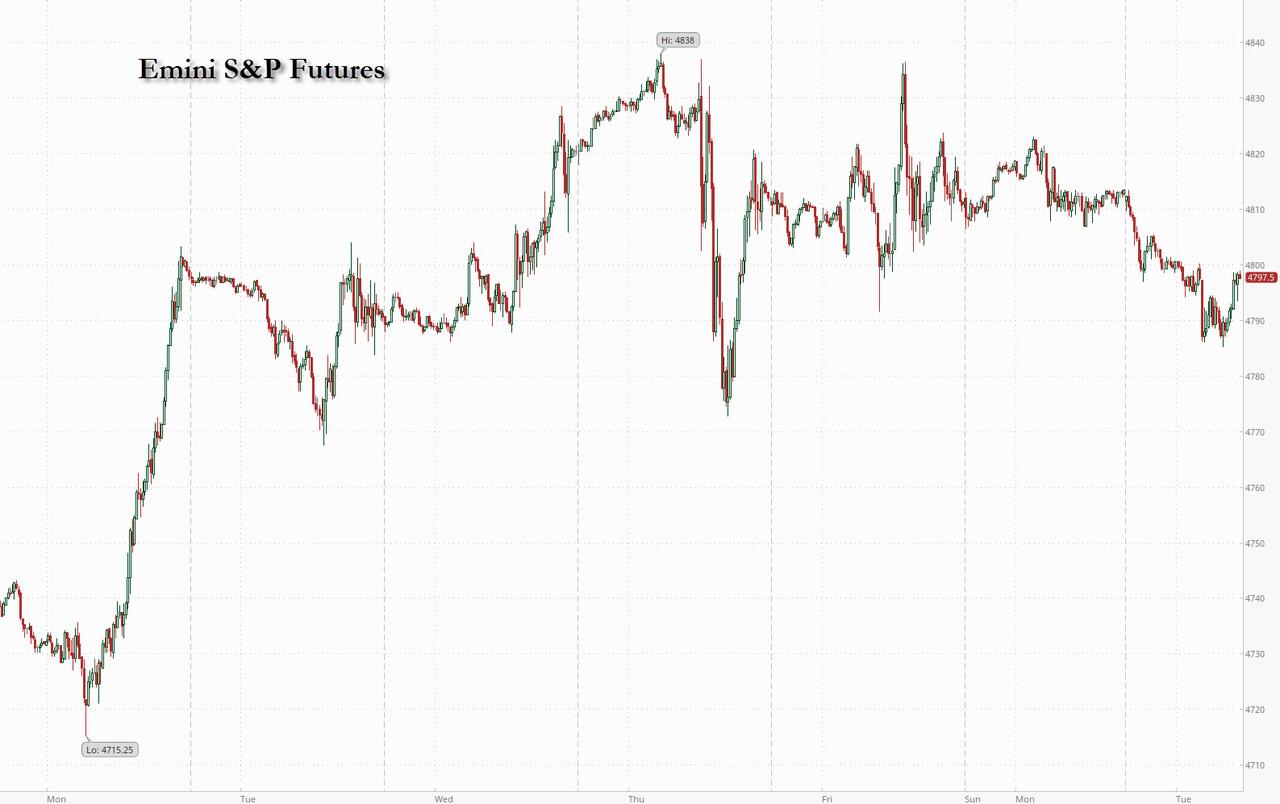
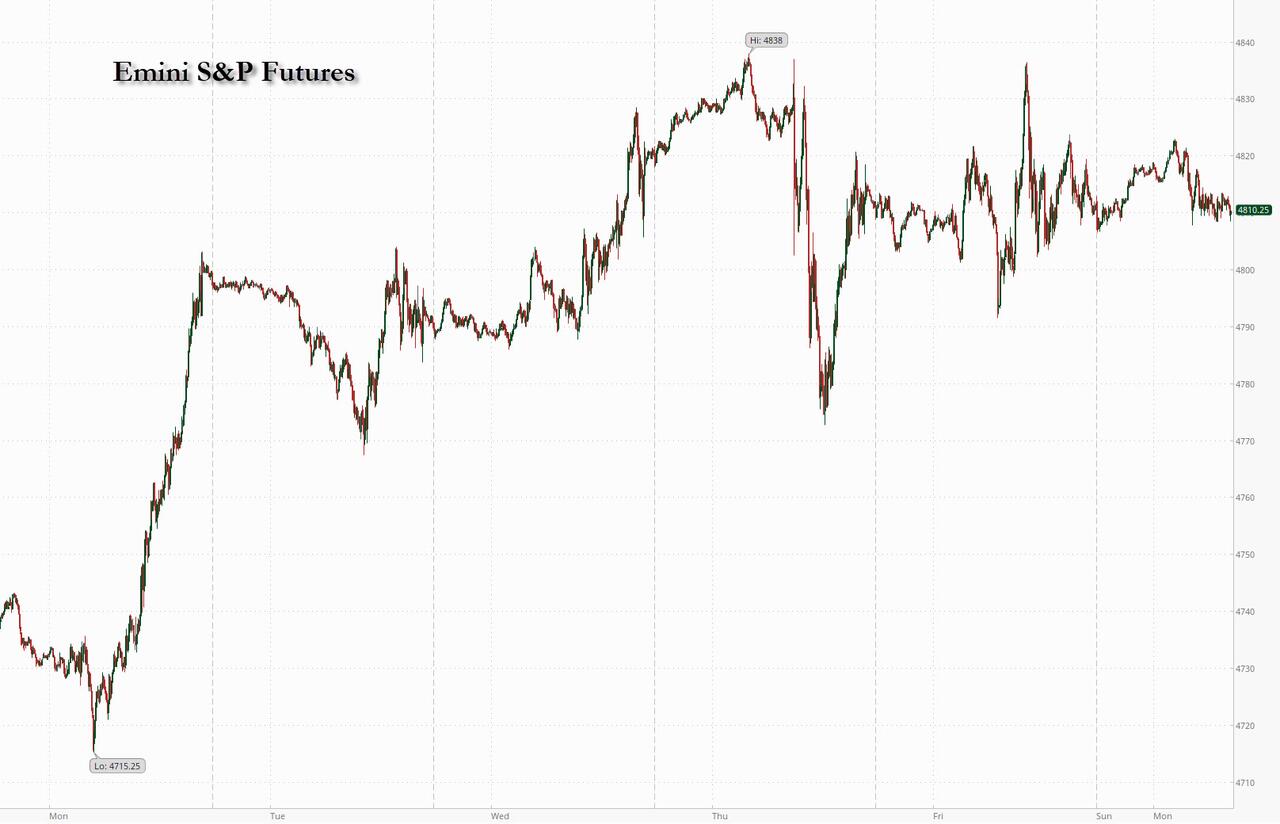
SPX futures are higher, having reached 4894.60 thus far.  4900.00 is expected.  It is day 273 of the current Master Cycle.  It is rare to see a Master Cycle go to 275 days.  There is a proposed limitation on this rally at 4938.00.  If exceeded, the formation jumps to a higher degree.  SPX is in throw-over with the Cycle Top at 4812.82 and the 1987 trendline near 4780.00.  Hedge funds and CTAs are net sellers into this rally.

Today’s op-ex shows Max Pain at 4850.00.  Long gamma may begin at 4860.00 while short gamma starts at 4830.00.

ZeroHedge reports, “After a three-peat of S&P records, stocks were set for 4th all time high as they extended overnight gains after an onslaught of positive earnings from technology companies reinforced the picture of a broadly robust corporate sector, while a “sudden” RRR cut by Beijing sparked hope that the Chinese rout may soon be over. S&P futures rose 0.5%, at 7:50am while Nasdaq 100 futures rose about 0.7%, lifted by a 10% surge in Netflix following blockbuster earnings as well as a rally across chipmakers and other tech firms. Tesla and IBM are due to report later. 10Y yields dropped 2bps to 4.11% while the dollar slid amid a strong rally in the yen which strengthened 0.6% as investors decided Japanese policymakers are gearing up to scrap negative interest rates soon after all. Swaps markets have ramped up bets on a 25 basis-point rate hike in April, following the Bank of Japan meeting on Tuesday.”


VIX futures are scraping the bottom at 12.47 this morning.  While the SPX Master Cycle is running late, the VIX Master Cycle is running early.  Both Master Cycles have the potential of matching up their top/bottom this week.

Today’s options chain shows Max Pain at 14.00.  Short gamma lies at 13.50 while long gamma begins at 15.00 and runs to 30.00.


TNX is in a  correction that may decline to the Intermediate support at 40.17 today.  That action may encourage the longs in the SPX/NDX to a peak frenzy.  However, by the end of the week we may see TNX back above the trendline at 41.00.


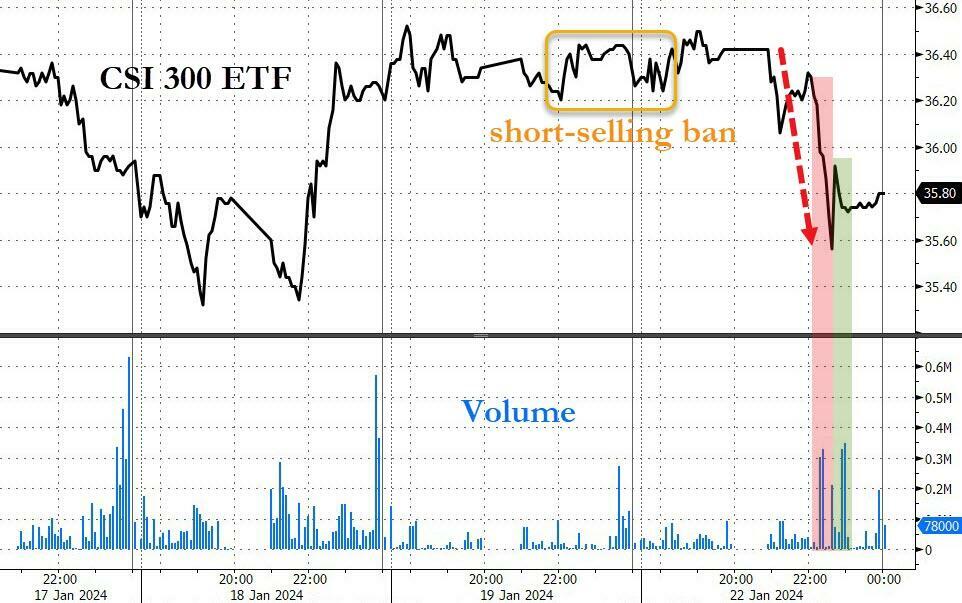
The Shanghai Composite made a higher low today, finding a potential floor for the time being.  However, having banned short sales (Coming to the US soon), there is little incentive to buy.  The Cycles Model suggests a bounce lasting to early February as high as the 50-day Moving Average at 2957.20 before motivated sellers step back in to the fray.

ZeroHedge observes, “In a move many said was very long overdue, this morning China which has paradoxically waited too long until deflation reigns across the country, said it will cut the required reserve ratio (RRR) by 50bps within two weeks and hinted at more support measures to come, which while coming largely in time with the easing ahead of the lunar new year was an unusually early disclosure that shows mounting urgency across President Xi Jinping’s government to shore up the economy and halt a $6 trillion stock-market rout. The cut was announced unexpectedly by People’s Bank of China Governor Pan Gongsheng during a press conference on Wednesday in Beijing and sends a new signal that officials are eager to curb the stock-market selloff, while also stepping up support for the broader economy.”


Posted in Published | 4 Comments

January 23, 2024

9:37 am

BKX, our liquidity proxy, may make another attempt at the Cycle Top at 95.93 today.  The Master Cycle low occurred on January 18 which gives the BKS about a week to complete a bounce, barring any catalyst that would break the Cycle.  The Cycles Model suggests the decline may be underway again by the end of the week.

ZeroHedge comments, “With credit card delinquency rates at their highest levels in more than a decade, getting approved for a new line of credit is getting harder, Fed analysts warned.

According to a new report from the Philadelphia Fed, 3.19% of credit card balances were at least 30 days past due by the end of the third quarter of 2023.

That’s up from 2.76% in the second quarter and the highest level since 2012.”


8:15 am

Good Morning!

NDX futures have pulled back from their intraday all-time high at 17450.30, making a morning low of 17297.50.  The Wave structure does not allow NDX to exceed 17523.00, so we may consider the rally complete, or very nearly so. Large hedge funds and certain institutions are leaving the party early.   They must offload their longs slowly, since they cannot sell in bulk without showing their hand.  The Cycle Top is at 17080.95, beneath which lies an aggressive sell signal.  A confirmed sell signal lies at 16574.00 where we find the Ending Diagonal trendline and Intermediate support.

Today’s options chain shows Maximum Investor Pain at 17330.00.  Long gamma may begin at 1735.00 while short gamma starts beneath 17300.00.  Puts are layered at 50-point intervals beneath 17300.00.


The NYSE Hi-Lo Index shows how narrow this market has been over the past month, despite making new all-time highs.  The market highs are being led almost exclusively by the magnificent seven.  I have never seen this before in my 43 years of observing the market.  It may have met its Master Cycle high yesterday, on day 263.


SPX futures have consolidated within yesterday’s trading range.  It has met an equality guideline at 4834.00 but has the ability to move somewhat higher.  It is still in its throw-over stage and may not be complete unless it makes a final probe near 4900.00.  Round numbers attract, so if SPX goes higher, it may land there.    The Cycle Top support is at 4806.00 while the 1987 trendline is near 4780.00 where aggressive short positions may be made,  The short-term Diagonal trendline is at 4730.00 , where a confirmed sell signal may be made.

Today’s options chain shows Max Pain at 4840.00.  Long gamma starts at 4850.00.  Short gamma may begin at 4830.00.

ZeroHedge reports, “S&P futures are flat after back-to-back record closing highs for the S&P 500 index, with Europe mixed and Asia higher after a Bloomberg report indicated that China was “mulling” a 2 trillion yuan market rescue package to contain the relentless rout hammering Chinese stocks. As of 8:05am, S&P futures were up 0.1% despite a barrage of disappointing earnings releases from the likes of DR Horton, General Electric, and 3M. Nasdaq futures, as usual, gained more and were last trading up 0.3%. The Bloomberg dollar index was flat, erasing an earlier loss while the yen reversed an earlier gain following hawkish comments from BOJ head Ueda. WTI crude oil futures are down 0.5%, with Brent trading just under $80/barrel.”


VIX futures are hovering near their lows at 13.17.  Today and Thursday are days of trending strength.  Unfortunately, VIX is beneath its mid-Cycle resistance at 15.22, so the strength may easily lead lower…or a catalyst may energize the VIX higher.

Wednesday’s op-ex shows Max Pain at 14.00.  There is a limited amount of short gamma near 13.00.  Long gamma begins at 15.00-17.00 and extends to 30.00.


The Shanghai Composite Index made a new low at 2724.00 today.  Should Beijing’s latest market rescue not succeed, there may be a waterfall event.  The authorities made the wrong move by banning short sales, thinking they were the cause of the crash.  Crashes are caused by a lack of buyers, not short selling.  Short sales provide the incentive to take profits and, in doing so, give the market a floor.  Instead, sellers may be motivated to sell the bounce, as it may be their last chance to get out before the next rout.  US investors have avoided China stocks, adding to the political tension between our countries.

ZeroHedge reports, “Earlier today, we lamented the latest implosion in Chinese markets, which we discussed in “China Stocks Crash Through ‘Snowball Derivatives’ Trigger Levels Overnight“, in which we pointed out the unprecedented failure of the centrally-planned market to halt its collapse be it through short selling bans, or even the latest impotent intervention by the “National Team”, China’s Plunge Protection Team, which today failed to spark even a modest rebound in the relentless selling which had triggered key liquidation levels.”


TNX has bounced back above the trendline at 41.00 with a possible show of trending strength.  The next hurdle is the 50-day Moving Average at 41.72.  Should it break above it, the trend resumes in strength.  However, the 200-day Moving Average at 40.77 or the Intermediate support at 40.23 may be retested before the breakout.

ZeroHedge observes, “As the Federal Reserve proceeds with quantitative tightening, markets are increasingly sensitive to funding and liquidity conditions. That makes it paramount to identify – ahead of time – when funding stress is about to manifest.

September 2019 is not a month the Fed wants to revisit. Funding conditions rapidly deteriorated, leading to spikes higher in repo and other short-term interest-rates that are at the base of financial markets. Without smoothly functioning funding markets all assets are vulnerable, as the cost of financing positions becomes punitive, or evaporates altogether.”


USD futures continue to consolidate beneath the mid-Cycle resistance at 103.46.  The Cycles Model shows today as a day of trending strength which may lead to a breakout above the mid-Cycle and back to a recognized positive trend.


Posted in Published | 8 Comments

January 22, 2024

1:30 pm

BKX is testing its Cycle Top resistance at 95.73 this morning after having made a Master Cycle low on Thursday, day 259.  A decline beneath Intermediate support at 93.41confirms a sell signal with further confirmation beneath the 50-day Moving Average at 89.24.  A drop beneath the mid-Cycle suport at 89.21 may lead to a waterfall event.


8:00 am

NDX futures have reached a morning high of 17449.89 on day 271 of the Master Cycle.  While a Wave 3 may escape above the upper bound of the Cycle Top, only rarely does Wave 5 do so.  It is called a throw-over where fear of missing out overtakes common sense of the retail crowd.  Hedge funds and money managers are selling into this rally.  Sentiment and flows have reversed sharply as hedge funds have become net sellers.

Today’s options expiration is a convoluted affair.  There is a wall of puts at 17300.00 and a wall of calls at 17250.00.  We may see a battle between these two walls   as the day progresses.

ZeroHedge remarks, “During the dotcom bubble, stock traders had the right idea, but had no clue how to price that view. Now they are grappling with much the same issue – only, this time around, substitute dotcom with artificial intelligence.

The bigger concern is that the gravy train may run as long as it did then.

The Nasdaq 100 has surged to a record, putting it within striking distance of 17,000, enough to induce vertigo in anyone looking at valuation metrics.”


SPX futures have hit a morning high of 4859.60 on day 271 of the Master Cycle.  It is also in throw-over.  The Cycle Top support/;resistance is at 4800.60 while the 1987 trendline is near 4780.00.  A common wave relationship indicates that Wave equality has been achieved at 4835.00, suggesting the probe higher may be finished.  A reversal may be impending.

Today’s op-ex shows Max Pain at 4820.00.  Long gamma begins at 4825.00 with strength to 4860.00.  Short gamma starts at 4815.00 and remains strong to 4700.00.

ZeroHedge reports, “The market meltup is now entering its blow-off top phase, with the tech-led rally pushing US index futures to a fresh all-time high for S&P 500 cash, which reclaimed their Jan 2, 2022 record after 746 days and following gains in 11 of the past 12 weeks!. European stocks are also higher, the Estoxx 50 up 0.5% with info tech sector outperforming.”

ZeroHedge offers this tidbit, ““The game of speculation is the most uniformly fascinating game in the world. But it is not a game for the stupid, the mentally lazy, the person of inferior emotional balance, or the get-rich-quick adventurer – they will die poor,” said Jesse Livermore, the speculator made famous by Edwin Lefevre’s Reminiscences of a Stock Operator, 1923. It was the first and best book I’ve read on speculation.”


VIX futures are positive, having risen to 13.84.  Last week’s trending strength may have been a miss, but this week trending strength redoubles its efforts over the next two weeks.

This Wednesday’s options chain shows Max Pain at 14.00.  Short gamma has a weak showing from 13.50 to 14.00 while long gamma starts at 15.00 and runs to 30.00.


TNX has pulled back from the 50-day Moving Average at 41.82 and may test the 200-day Moving Average at 40.73.  This retracement has the appearance of a short-term move before regaining its momentum later in the week.  Treasuries may be being bought as a reflex to the all-time high in all the major stock indexes.  Should that be the case, TNX may decline to the Intermediate support at 40.28.

Zerohedge observes, “Could it be that we’re all obsessing over whether the Fed cuts three times or four or five in the next year, when the real thing that is driving markets is how much money is being created?” I asked the US Economist. “Over the past year or so, we generally saw outflows from stocks across our private wealth clients,” answered the US Economist. “But then stocks went back up without them fully participating, so perhaps stocks just got marked higher without any big inflows, and our client’s cash is sitting in money market funds now,” said the US Economist.


USD futures are challenging the 50-day Moving Average at 102.98 in a correction that may prove support for the next move higher.  The next hurdle to overcome is the mid-Cycle resistance at 103.39.  The Cycles Model suggests that, once beyond that resistance, the USD may continue its rally into early March.

ZeroHedge remarks, “Speculators are reducing the number of currencies they are short versus the dollar, as well as increasing the size of their bets against it. The real yield curve shows that the dollar should trend lower over the coming months.

The dollar may have had a good start to the year, with the DXY up almost 2%, but speculators appear to have little faith this strength will continue.”


The Shanghai Composite Index has made a new low this morning at 2735.00 after testing its weekly Cycle Bottom at 2866.00 on Thursday.  The Chinese authorities have banned short selling, which only worsens the decline for lack of buyers (short covering) at the bottom.  Thursday may have been the Master Cycle low with a possible shase shift where a failed bounce may turn into a waterfall event.  The CSI 1000 Index mentioned in the article below has fallen to 5000.83 this morning.

ZeroHedge observes, “Last week we exposed the ugly reality sitting just below the headlines of the Chinese stock market – the massive liquidation threat from so-called ‘snowball derivatives’.

Specifically, we warned that for those looking for the tipping point, pay especially close attention to the CSI 1000 Index dropping below the 5,300 level, where a wave of knock-ins triggers could accelerate exponentially.”


Posted in Published | 6 Comments

January 19, 2024

9:56 am

BKX is on a bounce – 24.4% thus far.  Overhead resistance is at 93.08 which, if attained, would give a 30% retracement.  A normal retracement would seek the Cycle Top at 95.49, but the situation is eroding enough to disabuse that target.  Should TNX continue its rise, there may be some banks ready to “throw in the towel”.

ZeroHedge cautions, “Money-market fund assets notched their first net weekly outflows in a month, led by declines in government funds as investors reallocated portfolios in the early days of the new year.  Total assets dropped $14.1BN to $5.961TN from $5.975TN the week prior, which was a record high…”


7:45 am

Good Morning!

NDX futures reached a morning high of 17124.30, but has pulled back from there.  Today’s action may be the final probe in an Ending Diagonal formation, a series of zigzags.  Should that structure be accurate, the absolute limit on this rally may be 17202.00.  However, the Cycle Top resistance is at 17044.66, suggesting any probe above that level may meet maximum resistance.

Today’s (morning) options chain shows 16980.00-16990.00 to offer Maximum Investor Pain.  Long gamma may start at 17000.00.  Short gamma may begin at 16975.00.

ZeroHedge notes, “Mighty NASDAQ

Futures trading above the range that has been in place since mid December. The latest decoupling from rates is “interesting”.”


SPX futures have risen to 4809.40 thus far this morning.  SPX is the last major index to hit an all-time high.  While the Cycle Top resistance is at 4795.00, the Ending Diagonal structure allows the SPX to challenge the all-time high at 4818.60.  However, This morning’s probe may be the final attempt at the ATH. Today is day 267 in the current Master Cycle.  Meanwhile Goldman is warning of a melt-up to follow op-ex.  To make matters interesting, Nomura fears a “crash down“.

This morning’s options chain shows Max Pain between 4750.00 and 4800.00, where numerous puts and calls are evenly matched.  Long gamma starts at 4800.00 while short gamma may rule beneath 4700.00.

ZeroHedge reports, “After starting off the week with whimper, renewed hopes for a soft Goldilocks landing as well as two consecutive upgrades of Apple have not only reversed the bitter taste from the preceding two downgrades (today the company was added to Evercore ISI’s tactical outperform, following yesterday’s BofA upgrade which fueled the best day for Apple since May), but have also sparked “banging” trader sentiment which pushed US futures higher in premarket trading while lifting the Nasdaq 100 to a recorder high. As of 7:40am, contracts on the Nasdaq 100 climbed about 0.7% after hitting an all time high on Thursday, while S&P 500 futures were up 0.4%. Treasury yields were flat at 4.14% and the dollar dropped after frenetic repricing of the policy outlook earlier in the week. Investors will pay close attention to UMich inflation expectations and Fed speakers today for further cues on the timing and extent of rate cuts. Traders now see the prospect of easing in March at little more than a coin toss, down from almost 80% at the end of last week.”


VIX futures have reached a morning low at 13.60, maintaining above the 50-day Moving Average at 13.27.   Trending strength may reappear as early as today and show more vigor next week.

The January 24 Options Chain shows Max Pain at 14.00.  Short gamma is in short supply while long gamma stretches from 15.00 to 30.00.


It staggers the imagination that the SPX is challenging new all-time highs while the NYSE Hi-Lo Index shows only 16 more companies making new 52-week highs than 52-week lows.  This shows how thin the NYSE is today.


TNX continues its rally above mid-Cycle support and the trendline at 41.09.  The 50-day Moving Average is right above it at 41.91.  Current activity is already raising alarms and the 50-day is one more hurdle that may dramatically change the outlook on Treasuries.


Posted in Published | 11 Comments

January 18, 2024

2:47 pm

The SPX rally was stopped this morning at the Ending Diagonal at 4766. 10.  The afternoon rebound may have hit resistance at the 1987 trendline at 4775.00.  The retracement may have gone sufficiently high enough to allow the decline to resume.  Cycle Top resistance is at 4794.83 as an alternate resistance.  The NDX made a nominal new high (ATH) at 16977.58.  The air is very thin at these heights.

ZeroHedge observes, “Tech leaving rates behind

The short term gap between NASDAQ and the 10 year (inv) is getting rather wide. Is leaving the rates narrative even possible?”

Further commentary from ZeroHedge, “The ‘good news is bad news’ narrative may not be entirely evident in equity index levels (mainly due to rotation), but it is very clear in the shift in rate-cut expectations and concomitant to that, in equity risk hedge demand.

Source: Bloomberg

As Nomura’s Charlie McElligott highlights:

“Incrementally hawkish” data and “less dovish” Fed rhetoric means that the “deep rate-cuts / hard-landing”-tail is losing delta rapidly.”


8:00 am

Good Morning!

NDX futures have risen to 16897.00 thus far this morning.  Whether it is threatening a new high is uncertain, since a Wave 2 may rise up to, but not exceed the December 28 high at 16969.20.  The current structure may not support a new high.

Today’s options chain shows Maximum Investor Pain at 16790.00.  Long gamma may begin at 16800.00 while short gamma starts at 16780.00.  This morning’s bounce has all the earmarks of dealer collusion to raise NDX out of short gamma as it approaches monthly options expiration on Friday.

ZeroHedge remarks, “Over the last three decades, the growth of tech companies has driven a shift in the ranking of the most valuable companies in the United States.

In this graphic, Visual Capitalist’s Marcus Lu and Bruno Venditti utilize data from the American Business History Center to present the history of America’s most valuable public company from 1995 to 2023. Valuations are for March 31 of that year, and are not adjusted for inflation.


SPX futures are on a bounce to 4762.40 thus far.  The 1987 trendline provides resistance at 4775.00 while the Cycle Top resistance is at 4790.00.  This morning’s action may prove to be a close call.

Today’s option chain shows Max Pain at 4730.00.  Long gamma may begin at 4745.00 while short gamma may start at 4725.00.

ZeroHedge reports, “Global stocks and US futures rebounded from three days of losses, and climbed on Thursday as JPM suggests a relief rally may be starting as traders turn their attention to corporate news after conceding that rate cuts may be delayed beyond the first quarter. As of 8:10am, S&P futures rose 0.4% while Nasdaq 100 contracts gained 0.8%. A positive earnings report from Taiwan semiconductor giant TSMC is boosting AMD and NVDA. Europe’s Stoxx Europe 600 index edged higher, having slumped almost 2% in the first three days of the week. China’s benchmark CSI 300 Index advanced 1.4% as a surge in ETF trading pointed toward state funds’ involvement to reverse an earlier rout. The dollar is flat while 10Y yields dipped by 1basis point to 4.09%. Heightened military action in the Middle East is pushing WTI up less than 1% with natgas appearing to react more to the cold snap in the US. Metals are weaker and Ags are rallying. Today’s macro data focus in primarily housing data plus weekly jobless data.”


VIX futures have pulled back from their new high to a morning low at 13.89.  The Cycles Model has suggested that trending strength may continue, so this may be a volatile day for the VIX and possibly the SPX.  VIX remains on a buy signal.

The January 24 op-ex shows Max Pain at a contested 14.00.  Long gamma may begin at 15.00 and currently extends to 30.00.


TNX rose to 41.32 this morning as trending strength continues to influence rates.  Should TNX maintain its elevation above the trendline at 41.00, TNX may experience a multi-month rally, especially above t.


Posted in Published | 12 Comments

January 17, 2024

10:52 am

BKX may be setting up a bounce, since today is day 258 of the current Master Cycle.  It is competing with the January 5 high at 97.87 for the terminus of the current Cycle.  The Cycle Top at 95.22 may provide overhead resistance for a weak bounce, which appears to be due by the end of the week.  This is giving us some confusion as to exactly where this Master Cycle may end.  Nevertheless, BKX is in the “pivot zone” and may provide an answer in just a matter of days.  In the meantime, the Feds are walking back Powell’s claim for lower rates anytime soon.


8:15 am

Good Morning!

SPX futures have declined beneath the 1987  trendline at 4773.00 yesterday and now beneath the Ending Diagonal trendline at 4750.00 overnight to a low of 4733.50 thus far.  This action gives the SPX its sell signal.  A further decline beneath Intermediate support at 4688.00 may confirm that condition.  The 50-day Moving Average lies at 4596.66 for further confirmation.  The Cycles Model suggests that the current Master Cycle may last until the end of February, although the Master Cycle may end at a high.  Should that be the case, the decline may run until the first week of February.

Today’s option chain shows Maximum Investor Pain at 4765.00.  Long gamma may start at 4775.00.  Short gamma may begin at 4750.00.

ZeroHedge reports, “US equity futures and global markets extended their decline on Wednesday after central bankers continued their push-back against market bets for interest rate cuts, deepening a global selloff across stocks and bonds. At 8:00am ET, S&P futures fall 0.4% and Nasdaq contracts ease about 0.5% suggesting another weak day ahead for US equities after ECB President Christine Lagarde and Governing Council member Klaas Knot warned on Wednesday that aggressive bets on interest-rate cuts aren’t helping policymakers in the battle against lingering price pressures, echoing hawkish comments from the Fed’s Waller on Tuesday who urged caution on the pace of easing. The VIX rose to 14.60, the highest leve since mid-November. The Bloomberg Dollar Spot Index extended its rally to a fourth day while the 2Y Treasury yields climbed six basis points to 4.29% and 10-year yields rose 2bps to 4.08%. Oil dropped again with Brent sliding to $77 as gold also eases to near $2,025.”


VIX futures rose to its current high at 14.80, breaking out above its prior high at 14.58 and confirming its buy signal.  VIX may continue its rally to the week of February 5.  This may be accompanied by trending strength throughout the entire period.

Today’s options chain shows Max Pain at 14.50.  Short gamma resides from 12.00 to 14.00.  Long gamma begins at 16.00 and remains well populated to 47.50.

ZeroHedge remarks, “SPX and VIX

Bit of chart crime, but note VIX is trading at levels we haven’t closed at since mid November. You don’t compare mean reverting to trending assets over longer time periods, but the chart shows you SPX and VIX have diverged “slightly “in the short term as well, especially post the latest bounce higher in the SPX.

Source: Refinitiv

Shifting higher

The VIX term structure has shifted higher. Note the shift being most notable in the short end of the curve. This is where people chase the “urgent” hedges first.”


TNX futures rose to 41.19 this morning while the cash market catches up.  It is above critical resistance at 40.43 to 41.00 and on a confirmed buy signal.  Trending strength may intensify starting today and lasting until early February.

ZeroHedge remarks, “The high degree of certainty the Federal Reserve will deliver an early rate cut – which is a fait accompli historically when pricing is as skewed as it is today – is a sign the market perceives financial-instability risks are rising, and that a near-term reduction in rates is required to help prevent liquidity and funding issues from developing.

The curious case of the March rate-cut rumbles on. Several theories have been put forward for why the market is ascribing such a high probability to it, such as more dovish economic data, or large yield-curve steepening positions skewing front-end rate pricing.

None really pass muster when you look more closely at them.

But under the lens of reserves and financial-stability risks, things start to make more sense.”


USD futures may be consolidating after having surpassed all resistance levels.  Today it may pull back to the 200-day Moving Average at 103.25 or possibly test the 50-day Moving Average at 103.10.  The Cycles Model suggests the USD may continue its rally to early March.


Crude oil futures declined to 70.64 this morning.


Posted in Published | 4 Comments

January 16, 2024

9:45 am

BKX has declined beneath Intermediate support at 92.25, reinforcing the sell signal made last Friday at the Cycle Top at 95.06.  Today is day 257 of the Master Cycle.  I have labeled the January 5 high as a potential early top.  A potential bounce in the next few days may retest the high to verify the existing top or make a marginally higher one.  The Cycle Top at 95.06 may give resistance to a bounce.

ZeroHedge notes, “Americans are going into debt as if tomorrow will never come, but of course tomorrow always arrives eventually.  What we are witnessing right now is truly a historic debt binge, and to many of the experts it seems like there is no end in sight to the unrestrained spending that is going on.  But are U.S. consumers going into record levels of debt because they are feeling good about things or because they are trying to survive in an increasingly harsh economic environment?  In America today, the cost of living has become exceedingly oppressive, employers are laying off large numbers of workers, and poverty and homelessness have been absolutely exploding all over the country.  Millions of U.S. households are just barely hanging on by their fingernails, and many desperate consumers have been piling up debt in a frantic attempt to stave off the inevitable.”

Banks are still posting their results after Friday’s market close.  ZeroHedge observes,

“Bank reserves at The Fed rose considerably last week expanding The Fed’s balance sheet by the most since the SVB crisis last March – as usage of The Fed’s BTFP bank-bailout facility pushed to a new record high (amid increasing arbitrage flows).

But, after four straight weeks of inflows, seasonally-adjusted bank deposits saw $23.3BN outflows in the first week of 2024…”


7:45 am

Good Morning!

NDX futures have declined to 16672.00 this morning thus far.  It has crossed short-term support at 16890.00, putting traders on high alert of a potential aggressive sell signal.  A sell signal may be made by declining beneath the Ending Diagonal trendline and Intermediate-term support at 16418.00.  The all-time high was made on December 28.  Since then the Nasdaq Hi-Lo Index has been hovering near -0- with only 54 new highs on Friday (of 3,300 companies).  What’s left appears to be a double top, much like what we saw at the July high.

Today’s options chain shows Maximum Investor Pain at 16890.00.  Long gamma starts at 16900.00 while short gamma begins at 16880.00.  NDX may be starting the week in short gamma.

ZeroHedge remarks, “Recent data has highlighted inflation is sticky, and retail sales this week could confirm the consumer is far from tapped-out. But it will take more than that – perhaps a coordinated response from Federal Reserve speakers – to disabuse the market of the multiple interest rate cuts priced in for this year.

The market continues to gun for the Fed’s cutting cycle to begin in March.”


SPX futures declined to 4752.00, the short-term support and Ending Diagonal trendline at 4750.00.  Having bounced at support, it is now retesting the 1987 trendline at 4773.00.  A clear sell signal may be had beneath 4750.00.  Further confirmation lies beneath Intermediate support at 4681.92 with the 50-day at 4585.08.  The Master Cycle high may have appeared on Friday at 4802.40, missing the all-time high at 4818.62 on January 2, 2022.

Today’s options chain shows Max Pain at 4775.00.  Long gamma may begin at 4795.00-4800.00.  Short gamma starts at 4750.00-4760.00.

ZeroHedge reports, “US equity futures fell for a second day as the dollar rose to a one-month high and as 10Y yield pushed back over 4.00% after various central banks pushed back against bets on aggressive interest rate cuts. As of 7:30am, S&P futures were down 0.4%, well off session lows, while Nasdaq futures lost about 0.5%. Meanwhile, Brent rose to around $79 a barrel as Houthi attacks on ships in the Red Sea keep tensions high. In other news, Iowa voters delivered Donald Trump a victory in Monday’s caucuses, moving him one step closer to a White House return. Among corporate highlights, Morgan Stanley and Goldman Sachs Group report earnings before the markets open.”


VIX futures rose to 14.13 this morning, surpassing the 50-day Moving Average at 13.37 and creating a buy signal for the VIX.  Trending strength may be rising and may continue to do so through the rest of the month.

Tomorrow’s options chain shows Max Pain at 15.00.  Short gamma lingers between 12.00-14.00.  Long gamma starts at 16.00 and runs hot to 47.50.

ZeroHedge notes, “Sticky inflation? Premature easing bets? Shaky earnings? Nowadays, these aren’t obstacles for equity investors, whose buy-the-dip mindset remains strong in the absence of very good reasons to sell.”


TNX rose to 40.26 this morning before easing back below 40.00 as it tests Intermediate resistance at 40.49 and the 200-day Moving Average at 40.58.  Mid-Cycle resistance is at 41.08 above which the uptrend may reassert itself.  There is a new potential Head and Shoulders formation with the neckline at 49.98.  Should the neckline be broken, the new (minimum) target may be 96.00.  Please note the January 15 report on the UST (10-year Treasury Note).

ZeroHedge notes, “On December 13 the financial world was stunned when, just two weeks after Jerome Powell had said he it was “premature” to speculate on rate cuts, the Federal Reserve did a shocking U-turn and pivoted dovishly, ending the Fed’s hiking cycle with inflation still running at double the Fed’s target of 2%, and said that it had in fact discussed the start of rate cuts, contrary to what Powell said just two weeks earlier.


USD futures are consolidating beneath the 200-day Moving Average at 103.23 after challenging it on Friday. It is on a buy signal that may last through the first week of March.  The consolidation may test Intermediate support at 102.44 before moving higher.


Crude Oil futures have challenged  Intermediate support at 72.72, then rising above it.  Last Friday it challenged the 50-day Moving Average currently at 74.63.  Should it break beneath the bearish Triangle formation at 71.00, the decline may resume to the support line at 63.57.  A further decline may change the intermediate term outlook for crude.

ZeroHedge reports, “Portfolio investors purchased petroleum in the first full week of 2024, reversing sales the previous week and continuing the pattern of choppy trading that has continued since early December.

Hedge funds and other money managers bought the equivalent of 54 million barrels in the six most important petroleum futures and options contracts over the seven days ending on January 9.”


Posted in Published | 9 Comments

January 15, 2024

8:00 am

Good Morning!

SPX futures have eased lower but remain above the 1987 trendline at 4772.00 thus far.    The Cycle Top is at 4781.82.  Being beneath that implies a provisional sell signal.  A commonly used focal point may be the diagonal trendline at 4750.00 where the uptrend may be broken.

Wednesday’s options chain shows 4780.00 to be a hotly contested Max Investor Pain zone.  Long gamma kicks in at 4800.00while short gamma begins at 4760.00.

ZeroHedge reports, “US equity futures were steady on Monday as investors were displeased by hawkish comments from ECB’s Holzmann , who said there may not be any rate cuts this year which pushed European stocks to session lows, while also bracing for more earnings later this week. With cash stock markets closed for Martin Luther King Jr. Day and global liquidity especially thin, S&P 500 and Nasdaq 100 futures were down about 0.1% and unchanged, respectively, as 8:00 a.m. ET, after both underlying benchmarks gained last week as the earnings season kicked off.”


VIX futures are on the rise, making a new high at 13.34.  It appears that the Master Cycle low may have been made on Thursday, day 255.  Confirmation of that event may be a probe above the 50-day Moving Average is at 13.37.  The VIX may be testing that resistance today.  Of course, a rise above that may create a buy signal for the VIX.

Wednesday’s options chain shows 13.00 offering the Max Pain to options investors.  Short gamma resides only at 12.50.  Long gamma begins at 14.00 and is well populated to 31.00.


The weekend TNX futures have risen to 40.04, closing in on the 200-day Moving Average at 40.57 and Intermediate resistance at 40.63.  This suggests that the Master Cycle may have made its low last Friday at 39.16 on day 253.  We will wait another day for verification due to the Martin Luther King holiday.    The opinion that March is too early for rate cuts is rising to the top.

ZeroHedge remarks, “One month ago, BofA CIO Michael Hartnett was just as shocked as everyone else, when Powell unexpectedly pivoted, ending the Fed’s tightening campaign (despite saying just two weeks prior that it was “premature” to even speculate on rate cuts), even though inflation remained above the unemployment rate.  As Hartnett said at the time, “on only 5 occasions in the past 90 years has the Fed cut rates when core CPI (now 4.0%) was higher than the unemployment rate (3.7%). Of those five occasions, the cuts were triggered by war once (Oct’42) and a recession four times (Oct’69, Aug’74, May’80, Jul’81).”


The monthly UST chart reveals something that no other analyst is considering…that rates may not be about to decline anytime soon.  The rally is Treasury notes and bonds in October may have been a welcome one.  However, in doing so, the rally may have created an even more bearish outlook on Treasuries.

The massive Head & Shoulders formation warns us that, should UST decline beneath the neckline at 105.86, the bond market may go into a waterfall event.  Whether the rally was contrived or not, the Fed has never been able to dictate interest rates since 1949.  They have always been late to the party, whether to raise or lower rates.  The rally in November provided Powell cover to make his reversal after denying even considering a change in rates only two weeks earlier.  Yet Powell claims his reversal is not political.

All analysis to date has been based on domestic issues.  The first and foremost is the upcoming election.  Historically, when the SPX is at a loss by the end of October, the incumbent party gets trashed, losing its majority in the House and Senate.  The presidency is also at risk of change.  No amount of contrived data is about to change the sow’s ear into a silk purse.

The second issue is that government spending is out of control.  The total deficit for fiscal 2023 was $2 trillion, the largest peacetime deficit in U.S. history.  2024 may be looking far worse.  Janet Yellen claims she can manage rates this year by auctioning off more bills and fewer notes and bonds. Good luck with that!

The third issue may be off everyone’s radar.  That is, the rule of law.  ZeroHedge notes that the Biden administration is “backing legislation that would let it seize some of $300 billion in frozen Russian assets to help pay for reconstruction of Ukraine.”   We are learning that economic sanctions are not working.  Sanctions are bad enough, but seizure of assets is a direct violation of international law.  Lesser countries would be accused of piracy.   It may be considered an act of war.

Consider this.  China is the second largest Treasury bond holder, after Japan.  Seizing Russian assets sends a clear message that China’s holdings in the US may no longer be safe.  Should China decide to sell out, Japan, the largest Treasury bond holder, may follow suit.  That may put $2.1 trillion of debt on the market in a very short period of time.


Posted in Published | 9 Comments

January 12, 2024

3:20 pm

SPX may have completed its final probe higher.  If so, the rising trendline is at 4748.00.  Beneath it is a possible sell signal.


10:34 am

BKX, our liquidity proxy, attempted a rally back above its Cycle Top  this morning, only to fall back beneath it again.  Today is day 253 in the Master Cycle, which allows a possible probe higher (98.51?) early next week.  Regardless, we are seeing an aggressive sell signal with minimal upside.  Earnings season has begun with JPM reporting mediocre earnings but high hopes for rate cuts.

ZeroHedge observes, “Tomorrow Q4 earnings season officially starts with the big banks – JPM, BofA, Citi and Wells – all reporting (as well as BNY, Blackrock, Delta and UNH).

Source: @earningswhispers

And, as discussed earlier, after what has been the best bank stock rally in years, the setup is somewhat challenging even if, as UBS fins analyst Rob O’Dwyer writes, “valuations are not very extended, despite the 20% rally since November.” Still, O’Dwyer concedes that earnings challenges are due to US bank EPS being positively correlated with rising rates over the next 12 months, which suggests pressure on net interest income guidance for 2024. Indeed, given credit metrics remain clean, “there is more downside than upside risk to credit here.” 


7:45 am

Good Morning!

SPX futures have gone lower, testing the 1987 trendline at 4770.00.  Beneath that level is an aggressive sell signal.  The Cycle Top is at 4775.00.  A confirmed sell signal lies beneath Intermediate support at 4675.00.  Earnings season is beginning.  Analysts have already lowered the earnings bar.

Today’s options chain shows Maximum Investor Pain at 4770.00 Long gamma may start at 4775.00 while short gamma may begin at 4765.00.  The options market is heating up, but no clear direction yet.

ZeroHedge reports, “US equity futures are muted on the last day of the week, as investors mull the impact of inflation’s rebound on the outlook for monetary easing and waited for earnings from some of the world’s biggest banks. At 6:54am, S&P 500 futures are down -0.5%, dragged lower by poor earnings reported by BofA with JPM fallilng in sympathy, while Nasdaq 100 futures fell 0.6%. 10Y Yields rose to 3.99% and was set to rise above 4.00% after sliding yesterday for reasons still unknown. The dollar reversed earlier losses and was last trading near session highs.


VIX futures continue to consolidate near the low.  Today is day 256 of the current Master Cycle.  A reversal is imminent.

Nest Wednesday’s options chain shows Max Pain at 15.00.  Short gamma resides between 12.50 and 14.00.  Long gamma begins at 16.00 and now sows active interest up to 47.50.


TNX is hovering beneath the 200-day Moving Average at 40.03.  Today is day 253 of the current Master Cycle.  We may expect TNX to retest the rising trendline near 38.00 in the next week.  Thereafter, rates may begin to rise again.  All seems well after the solid 30-year Treasury Auction yesterday.  However, there is danger lurking beneath the surface.

ZeroHedge explains, “The Fed has already started down the path to resuming quantitative easing.

The question is whether they do so before, or after, upending the highly-leverage hedge fund basis trade that has been supporting the Treasury market.”


USD futures are hovering beneath Intermediate resistance at 102.48.  The Cycles Model suggests a pullback near 101.50 before resuming its rally.  A buy signal awaits USD above 102.48.


Crude oil futures rose to an overnight high of 75.25 before pulling back .  It is currently above Intermediate support/resistance at 72.85 and on a possible buy signal. However, should it decline back beneath Intermediate support, it may reveal another Triangle formation that points to lower prices.


Posted in Published | 10 Comments

January 11, 2024

11:00 am

BKX has declined beneath its Cycle Top support at 94.77.  Further confirmation lies beneath Intermediate support at 91.61.  The Cycles Model calls for an intensification of the decline beginning next week, so a prompt reaction may be necessary for longs.  This is a dangerous juncture for bank stocks.


10:25 am

SPX finally exceeded its December 28 high, as indicated this morning and may have reversed beneath critical support  at 4775.00 (Cycle Top) and 4770.00 (1987 trendline).  It may spend the rest of the morning testing those support/resistance areas, but the final decision of the day may be after 1:30 when the results of the 30-year Treasury Auction are released.  Current structure may allow a possible test of the 4818.62 high.

ZeroHedge gives analysis, “Just as we predicted in our CPI preview, where we said that “a hawkish print is more likely than a dovish print”, moments ago the BLS reported that both headline and core inflation came in slightly hotter than expected in December, driven as usual by shelter inflation (food prices hit an all time high but that was expected) which not only accounted for more than half of the “all items” increase, but was also the largest factor in the monthly increase for core items.

That was not a surprise; what was is that according to the BLS, the used car CPI index rose 0.5% after rising 1.6% in November, even though the much more accurate Manheim index has tumbled to the lowest level in three years.”


7:50 am

Good Morning!

NDX futures reached a morning high of 16903.80 on day 260 of the (current) Master Cycle.  The peak on December 28 is currently being marked as the top.  There are likely only two days left to make the new all-time-high.  The current formation may be a “shadow high” that may fail the new ATH.

Today’s options chain shows Maximum Investor Pain at 16780.00.  Long gamma starts at 16800.00 while short gamma may begin at 16750.00.

ZeroHedge remarks, “Decoupling

NASDAQ’s rates obsession has been strong since the summer. Note the latest gap becoming rather short term wide.

Source: Refinitiv

The power of the doji

On Sunday we pointed out the rare doji in SPX. We wrote: “SPX put in a big rare doji candle on Friday. It could be a possible exhaustion signal post the latest sell off, but we need confirmation candles”. The market has squeezed rather hard since then. 4850 is the big short term resistance to watch.”


SPX futures have hit an overnight high of 4802.70, testing round number resistance on day 260 of the Master Cycle.  The high made on December 28 may have been surpassed.  Critical support of both   the 1987 trendline and the Cycle Top remain at 4770.00.  The next question is, can it exceed its all-time high at 4818.62 in the next couple of days?  Decision making on rates may have been turned over to Yellen.  Today’s 30-year Treasury auction and this morning’s CPI may tell us whether that move was a wise one.

Today’s options chain shows Maximum Investor Pain at 4770.00.  Long gamma has it above 4775.00 while short gamma may begin at 4755.00.

ZeroHedge reports, “US equity futures tracked European and Asian stocks higher, but were off session highs as investors prepared for inflation data that will help clarify the path for Fed rates. As of 7:50am, S&P 500 futures pointed to small gains of about 0.1% after the gauge wiped out all losses from the start of the year and closed just short of an all-time high set two years ago on the back of the latest gamma squeeze in Mag 7 stocks; nasdaq 100 futures however continued their relentless meltup, and were 0.4% higher. After ramping all day, stocks eased off in the last minutes of trading during Wednesday’s session, after the NY Fed’s incompetent president John Williams said monetary policy is now likely sufficiently tight to guide inflation back to the 2% target, but that more evidence will be needed before any rate cuts emerge. JPM Asset Management, however, thinks Fed rate cuts could top current forecasts. Cryptocurrency stocks extended an advance in premarket trading after regulators approved exchange-traded funds that invest directly in Bitcoin, which jumped but it was ether that soared higher as the market attention now turns to frontrunning it ahead of its own ETF approval in a few months. US Treasuries climbed, with the yield on the 10-year benchmark dipping below 4%. Oil prices jumped after an oil tanker was boarded by Iranian military off the coast of Oman. WTI rises 1.6% to trade near $72.50 while Brent is above $78 a barrel.”


VIX futures continue to consolidate at the lows.  Today is day 255 of the current Master Cycle.  Support lies at 12.36 in a probable flat correction.

Next Wednesday’s (January 17) options chain shows Maximum Investor Pain at 15.00.  Short gamma rules from 12.00 to 14.00.  Long gamma begins at 16.00 and runs hot to 47.50.


TNX had been declining to 39.37 when the CPI was released this morning, prompting a sharp reversal back toward the 200-day Moving Average at 40.56.  There is a buy signal above the 200-day which may be confirmed above the neckline at 41.00.

ZeroHedge reports, “Headline Consumer Price Inflation printed hotter than expected in December, +0.3% MoM vs +0.2% exp and +0.1% prior, pushing the YoY headline CPI up to +3.4% (from +3.1% prior and hotter than the +3.2% exp)…”


Posted in Published | 6 Comments