
8:00 am

Good Morning!
NDX futures remain flat near 17400 over the weekend. A top has been made at 17665.26 on Wednesday, day 273. Since then, NDX has eased back into “neutral” near 17400.00, neither making new highs nor breaking below critical support. The Wave structure appears to be complete. The Cycle Top support is at 17189.84, beneath which lies an aggressive sell signal. Confirmation of the sell signal lies at the ending Diagonal trendline and Intermediate support at 16760.53.
Today’s options chain shows maximum Investor Pain at 17500.00. Long gamma begins at 17550.00. Short gamma starts at 17475.00. The NDX options market is the realm of very large investors. Do they know something we don’t?
ZeroHedge observes, “Narrowness
The top 13 stocks have driven the whole of the S&P’s YTD upside with the top five contributing ~70%.

Source: Bloomberg
The January indicator
Since 1953, when the S&P 500 ended January up at least 2%, it finished the rest of the year with a median gain of 13.5% and finished green 84% of the time.”

Source: Bespoke

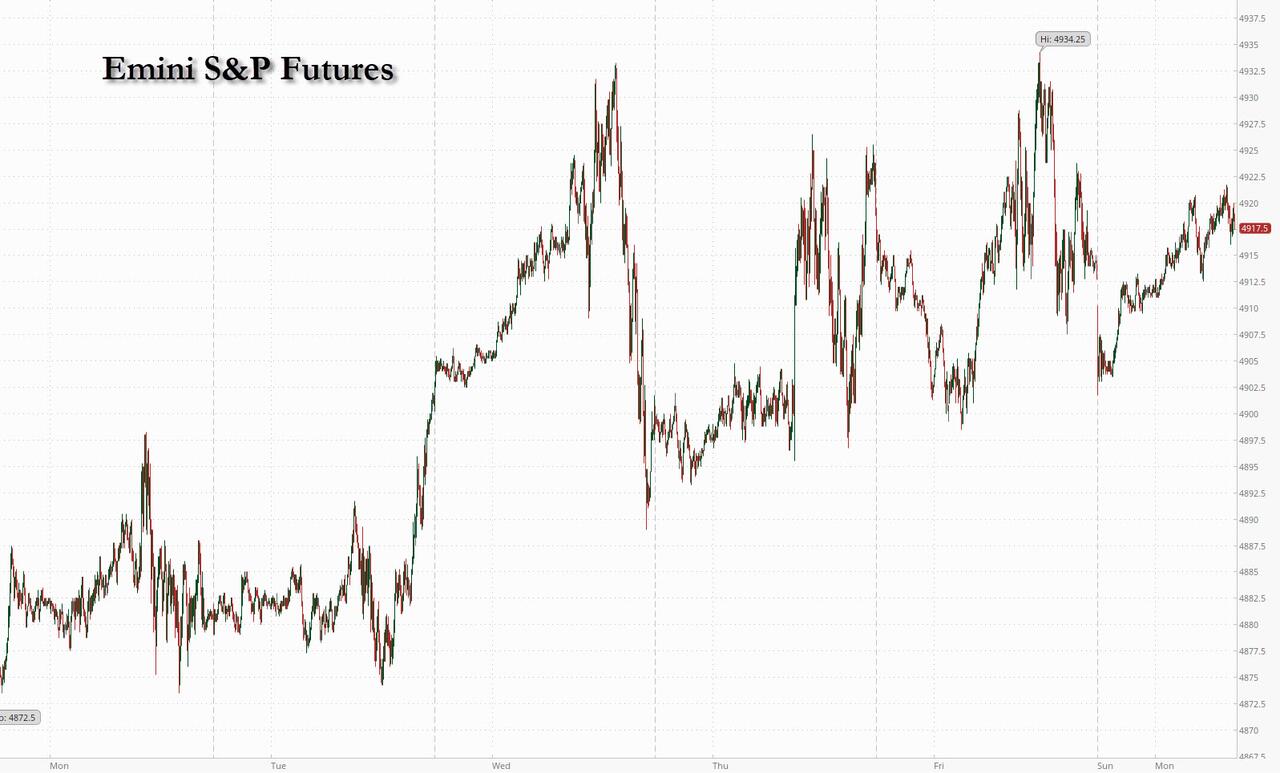
SPX futures remained near the flat line over the weekend after Friday’s new high at 4906.69 on day 275 of the Master Cycle. It is in throw-over, both in time and price. The first critical support is the Cycle Top at 4834.366, beneath which lies an aggressive sell signal. The 1987 trendline lies near 4787.00 along with Short-term support, giving us another aggressive sell. The Ending Diagonal trendline and Intermediate support lie near 4750.00, giving us a confirmed signal beneath that level.
In today’s op-ex, 4900.00 is a highly contested Max Pain level. Long gamma starts at 4910.00 while short gamma begins at 4890.00. The options appear to be a tightly coiled spring, ready to be set off.
ZeroHedge reports, “Markets opened the “crazy busy” week unchanged as investors readied for central bank updates from both the Fed the the BOE, braced for the January jobs report and the Treasury refunding announcement, and prepared for a flood of earnings as a third of the S&P by market cap is set to report. As of 8:00am ET, S&P futures were flat after the S&P 500 closed out a third week of gains and finished Friday near its record high; Nasdaq futures rose 0.2% because well, they always rise. Oil touched the highest levels since November in intraday trading, before pulling back as the Biden admin promptly slammed down the move higher that directly jeopardizes Biden’s re-election changes. The US said Iranian-backed militants killed three service members and wounded others in a drone attack in Jordan, with President Joe Biden pledging to retaliate.”

VIX futures are trading at the higher end of Friday’s trading range, although not breaking above it. The current Cycle must show a break above the mid-Cycles resistance at 15.15 to claim a positive trend.
Wednesday’s op-ex shows Max Pain in a range from 13.00 to 14.00. There is no short gamma. Long gamma begins at 15.00.

TNX is hovering near 41.00 as bond volatility moves lower. However, it may not last. This week the Treasury is auctioning off $80 billion of 42-day bills and $149 billion of 13-week and 26-week bills with no notes or bonds offered as Yellen attempts to keep rates down. $229 billion in one week!. What could possibly go wrong?
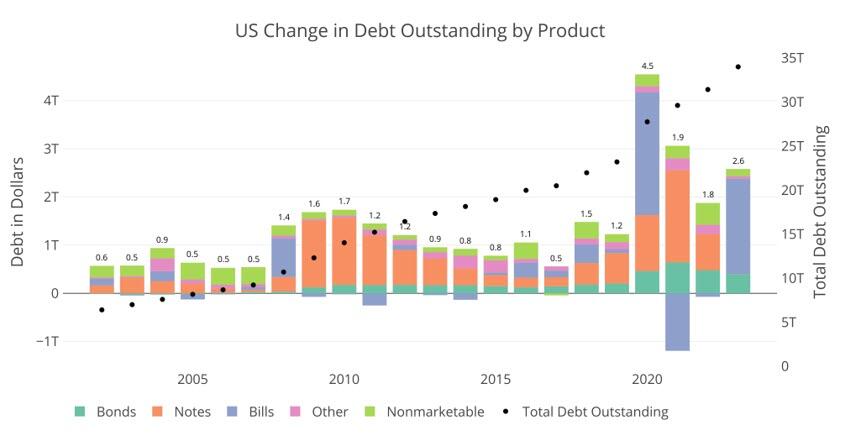
ZeroHedge remarks, “In 2023, the Treasury added $2.6T to the national debt. While that number alone should be enough to scare anyone, the details reveal something even more concerning. $2T of it, or 77%, was financed entirely with short-term Treasury Bills maturing in less than a year. The chart below shows the debt issuance trend over the last 20 years. As shown, the Treasury typically relies on medium-term debt (2-10 Year Notes) to fund the budget deficit. 2023 was a massive change in standard procedure as shown by the giant light blue bar on the right of the chart.”

USD futures are consolidating above the 200-day Moving Average at 103.20 this morning. The current Master Cycle may continue through the first week of March, giving it time to rally toward the Cycle Top resistance at 106.79. Should this rally be a Wave (3), it is likely to emerge above the Cycle Top for a period of time.

The Shanghai Composite Index fell back beneath Intermediate support/resistance at 2908.00 on Monday morning. With a little more than a week to go in the current Master Cycle, the Shanghai Composite must rally above the 50-day Moving Average an descending trendline at 2947.11 to have ny hope of changing to a positive trend. We have seen that, since last August, any probe at the 50-day was met with motivated selling. In addition, the Beijing authorities have outlawed short selling, removing the only possible motivated buyers (short covering) at the lows.
ZeroHedge observes, “China flows
Starting to turn positive.

Source: JPM PI
National team support
Flows into mainland China were very elevated by historical standards, reaching about $12bn total. Notably, the inflows were almost entirely driven by domestic investors, suggesting “National Team” support.”
