December 13, 2021

1:48 pm

NDX is challenging mid-Cycle support at 16132.39, potentially confirming its sell signal a second time this month.  Last Monday’s 5.6% rally deflated the shorts, but this time the decline may be much more convincing.  The NDX Hi-Lo Index is at -171.00.

ZeroHedge observes, “Is the reality of a tightening Fed really starting to sink in?

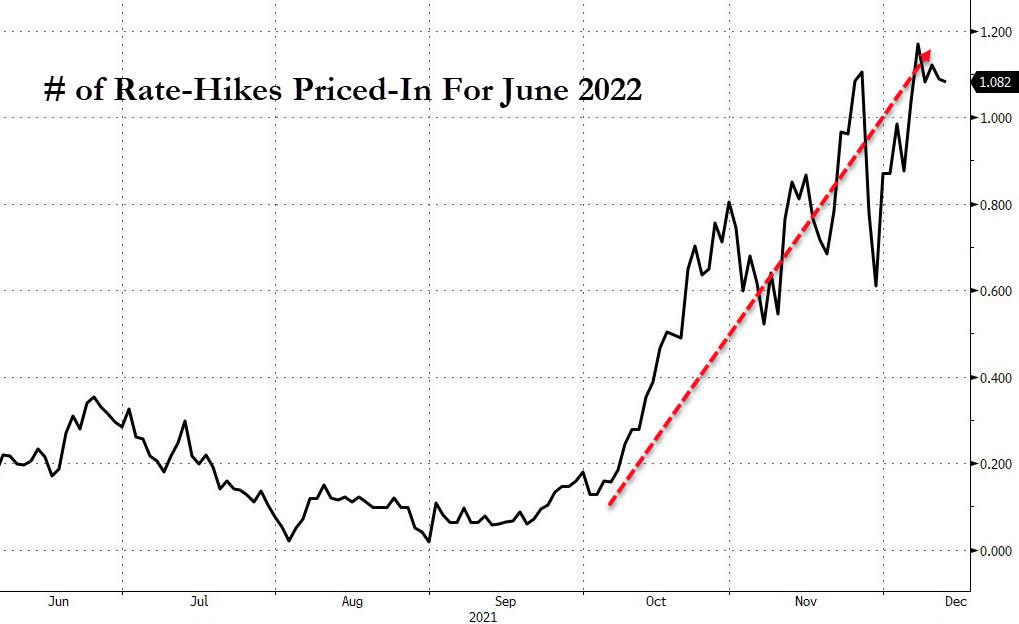
The market has priced a full rate-hike in for June 2022 (which means the taper is expected to accelerate from the current pace)…
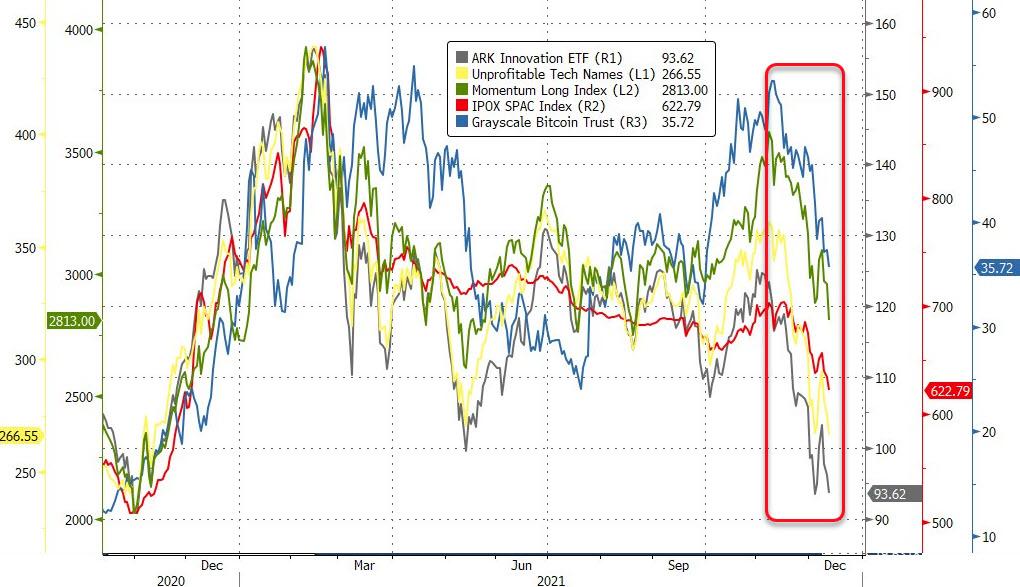
‘Bubble’ markets are tanking…
 

11:09 am

BKX, our liquidity proxy, is testing its mid-Cycle support at 129.24 this morning.  A breakdown here would add fuel to the flames of the sinking equities market.  It reversed from its Cycle Top resistance on November 20 and declined under its 50-day Moving Averae on November 25.  It has gone sideways for nearly three weeks, so there is only a minimal interest in shorts the banking index.  Inflation is no friend of the banks.

ZeroHedge remarks, “According to The New York Fed’s latest survey, the public’s short-term expectations for inflation surged to 6% – a new record high.
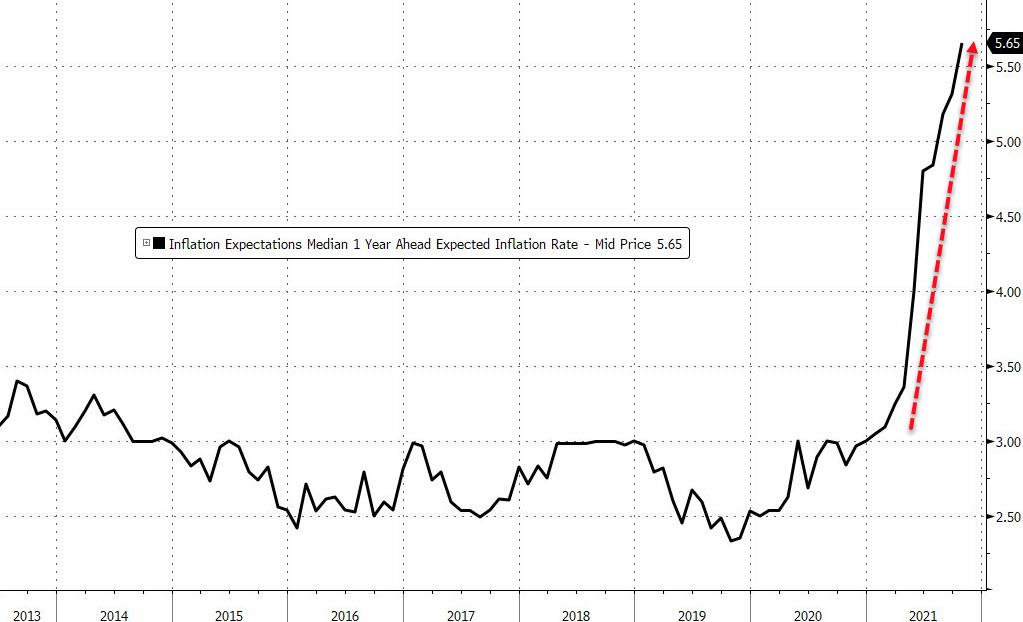
Interestingly, longer-run expectations for inflation eased a bit in November (for the first time since June).”


10:50 am

VIX did not linger near Friday’s low this morning.  In fact, VIX is back on the buy signal with a monstrous Wave 3 of (C) of [3] underway.  That combination of third Waves (C is considered a third Wave, as well), may double the Wave 3 of (C) of [1].  Remember, Wave three is never the smallest Wave and often a multiple of Wave one.  Since its predecessor Wave 3 was over 40 points, this Wave 3 may be as much as 80 points.  It may make a target of 100.00 a possibility by the end of December.

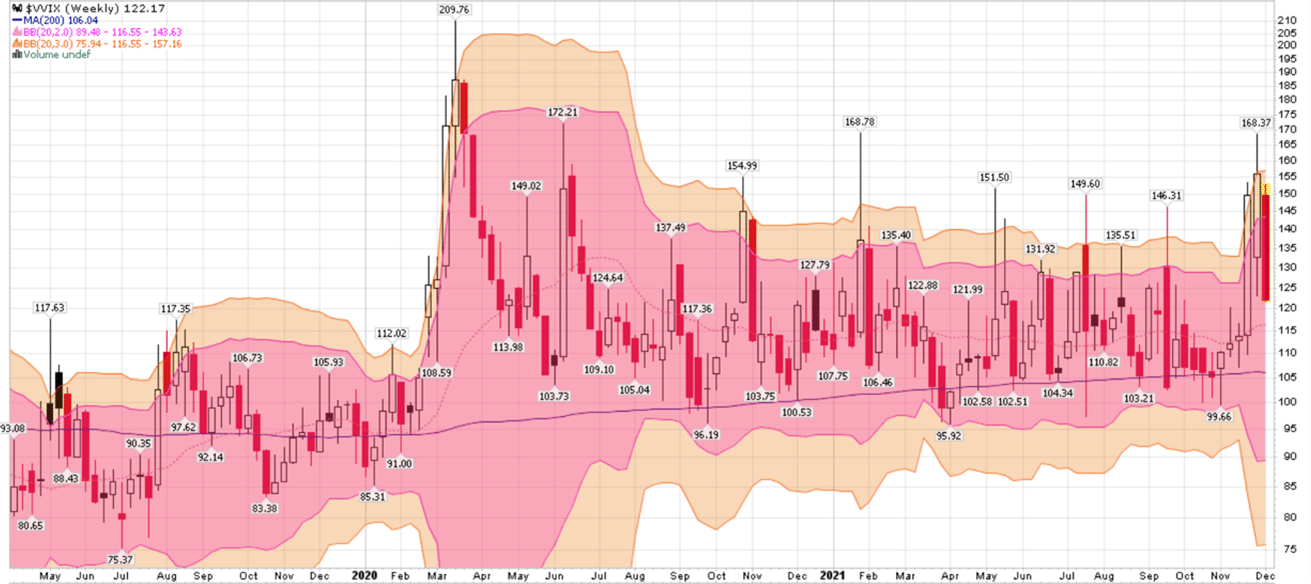
RealInvestmentAdvice observes, “Multiple waves of uncertainty have swept over Wall Street in the past month: concerns about rising wages and inflation, Federal Reserve turning more hawkish, and the Omicron variant becoming widespread.  These increasing waves of uncertainty drive rising implied volatility (VIX).  The following chart shows the 200-week moving average of VVIX (Volatility of VIX) has slowly moved upward since the March 2020 correction.
liquidity crunch, A Liquidity Crunch & Volatility Surge is Coming in 2022

Source: Patrick Hill – 12/7/21

Note how the Bollinger Bands (pink and tan) for 2 and 3 standard deviations have dramatically expanded in the last few weeks.  We expect with all the uncertainty heading into 2022 that high volatility will be the new normal for markets.


10:45 am

SPX broke through the Ending Diagonal trendline at 4685.00.  Last week it was estimated at 4665.00 to 4675.00.  The inference is that SPX may now decline beneath 4500.00, where the correction began.

ZeroHedge remarks, “All of a sudden, things went just a little bit turbo since BoJo warned of a “tidal wave” of Omicron cases…

As US equity cash markets open, stocks were pummelled lower…
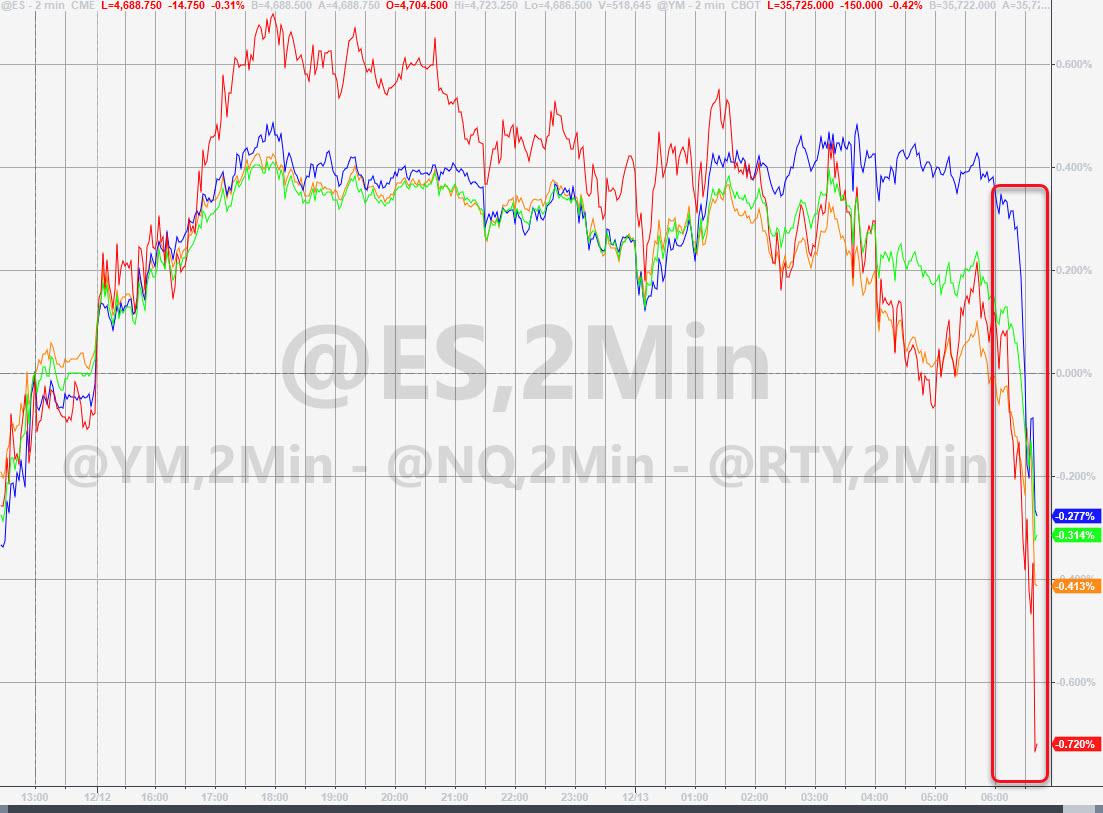
AAPL – the market’s very foundation – was unable to get to $3 trillion in the pre-market, and is falling back to unch…”


8:45 am

Good Morning!

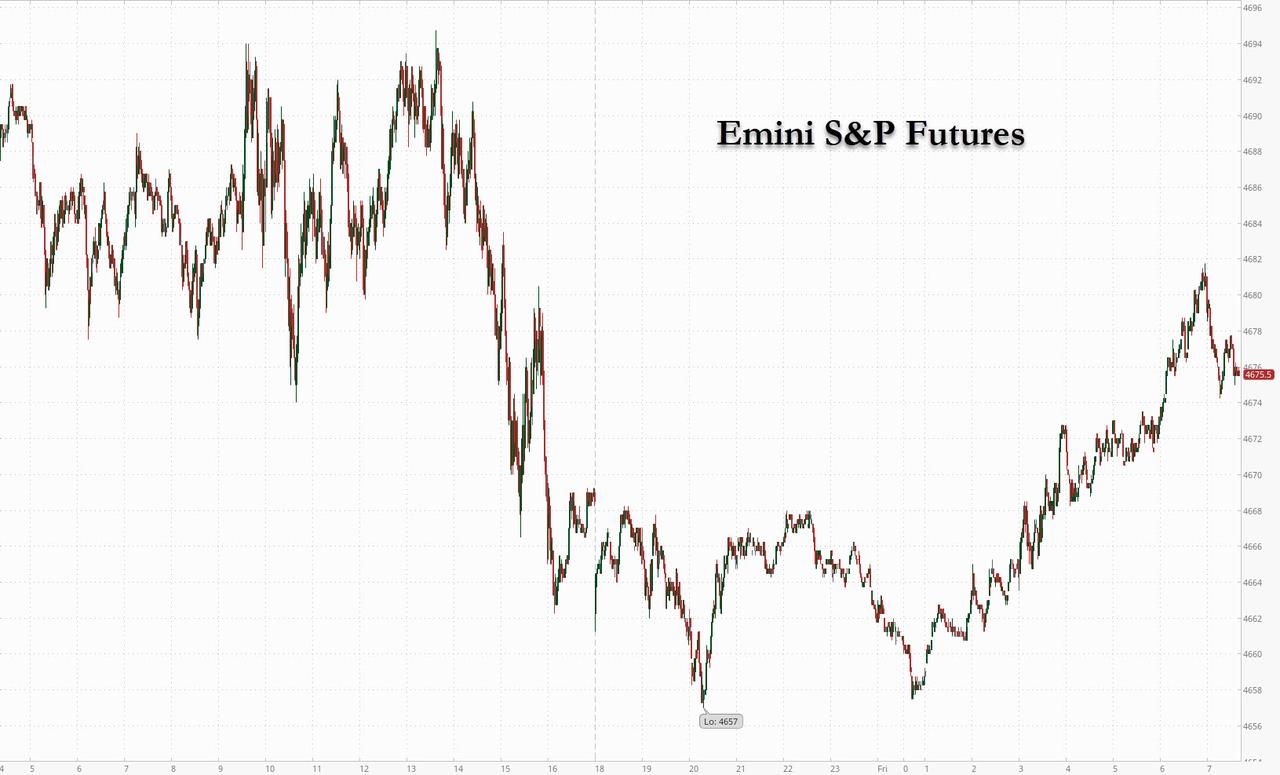
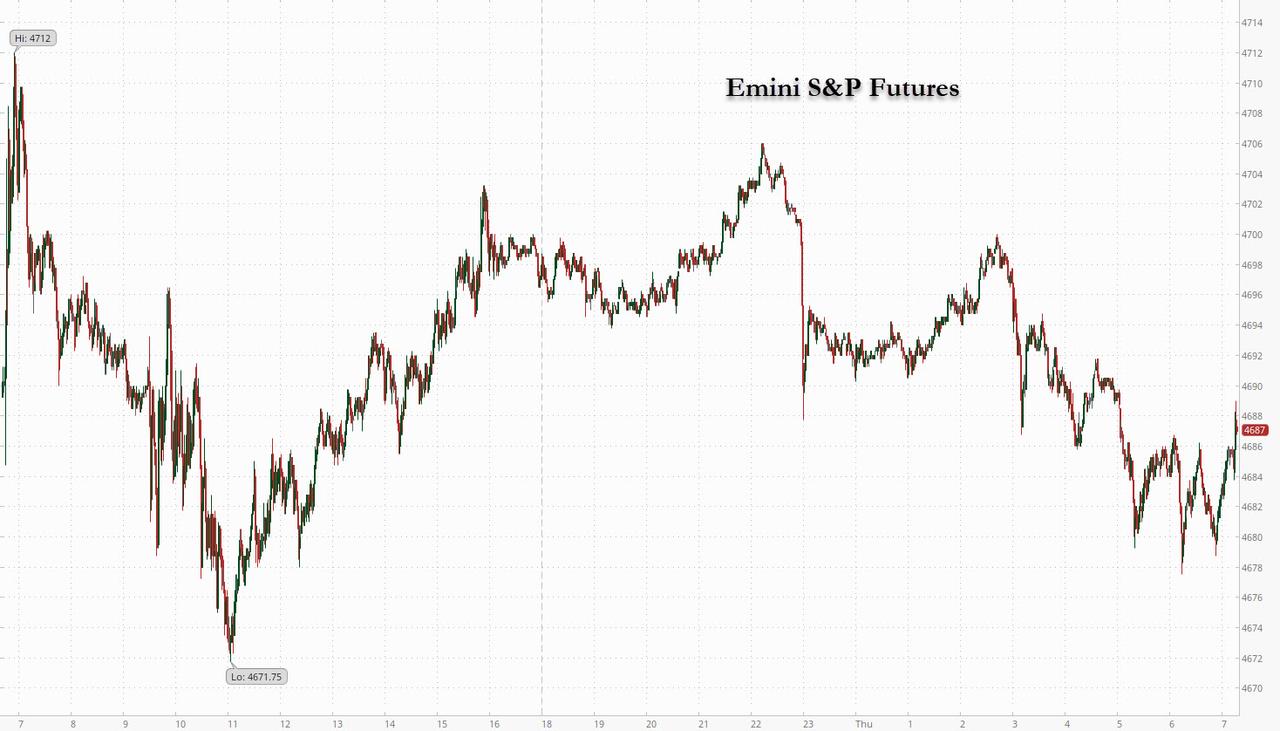
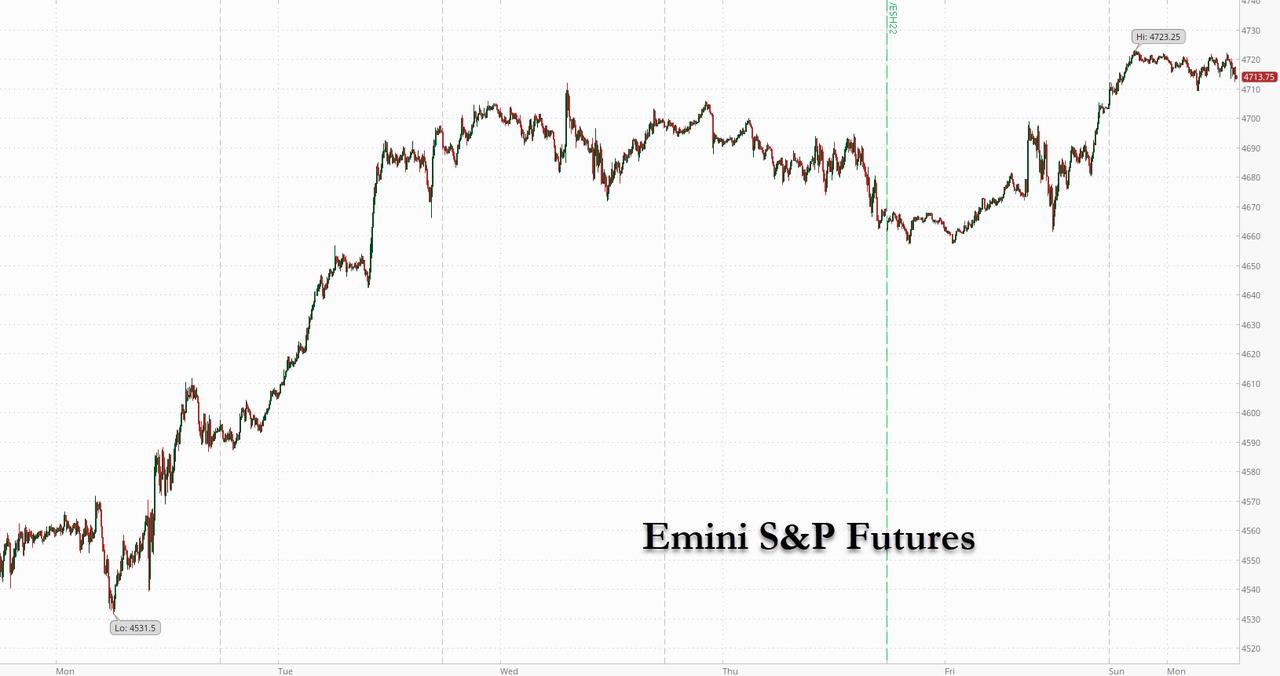
SPX futures are making new highs this morning, having closed above 4700.00 on Friday. SPX still appears to be dominated by the options market, although its hold may be waning.  Today’s options expiration show positive gamma above 4725.00, neutral gamma between 4675.00 and 4725.00 and  negative gamma under 4675.00.  A Fibonacci resistance lies at 4730.00.  Should that resistance be overtaken, the Cyclical resistance lies at 4750.00-4755.00.   The Cycles Model shows today as being a day of strength.  Should it not propel the SPX to a new all-time high, then the trend is down through the last week of January.  Everything appears to be hinged on today’s action.

ZeroHedge reports, “U.S. futures rose again, starting the Santa rally predicted over the weekend by Goldman, after the underlying index surged to a record on Friday with risk appetite returning ahead of this week’s barrage of central bank meetings including the Fed on Wednesday, followed by the Bank of England and ECB. Nasdaq 100 futures climbed 0.4% as major technology and internet stocks rose in premarket trading with Apple inching closer to a $3 trillion market valuation; S&P 500 futures rose 11 points or 0.2%; with Dow Jones futures also rising 0.2%.”
 

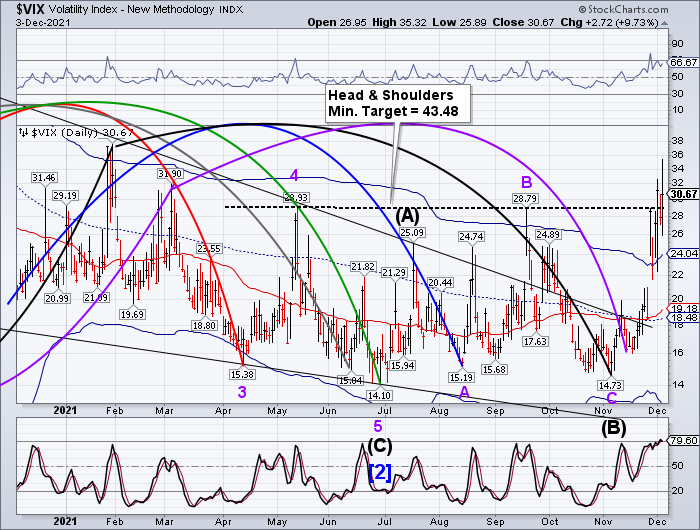
VIX futures bounced above the 50-day Moving Average at 19.26 in what may be up to three weeks of growing strength into the last week of the year.  Should the neckline be overcome at 35.32, we may see the VIX probe to 65.00 by the end of the year.   This formation clearly foretells that equities may be in the downtrend discussed above.


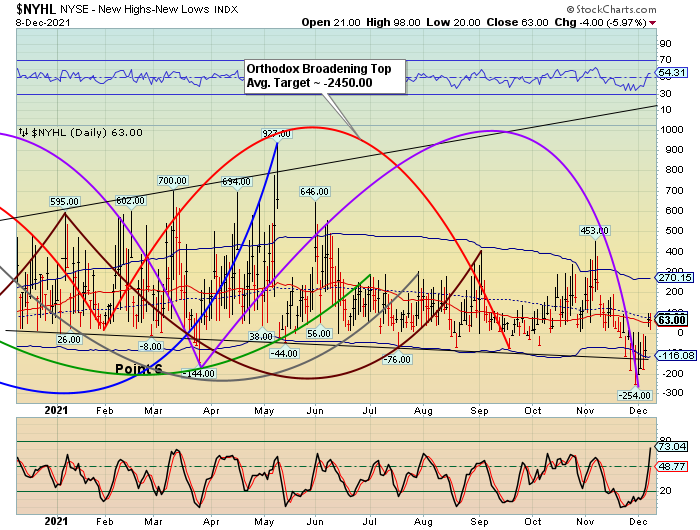
The NYSE Hi-Lo Index struggled for traction the entire day on Friday, closing below zero and on a sell signal.  This indicator tells us there is only a thin layer of mega-caps keeping the market from breaking through the ice into the abyss.  It appears that, although today’s equities may go higher, the house is being built on shifting sands.

ZeroHedge remarks, “The S&P 500 Index is the ‘most concentrated’ since 1969.
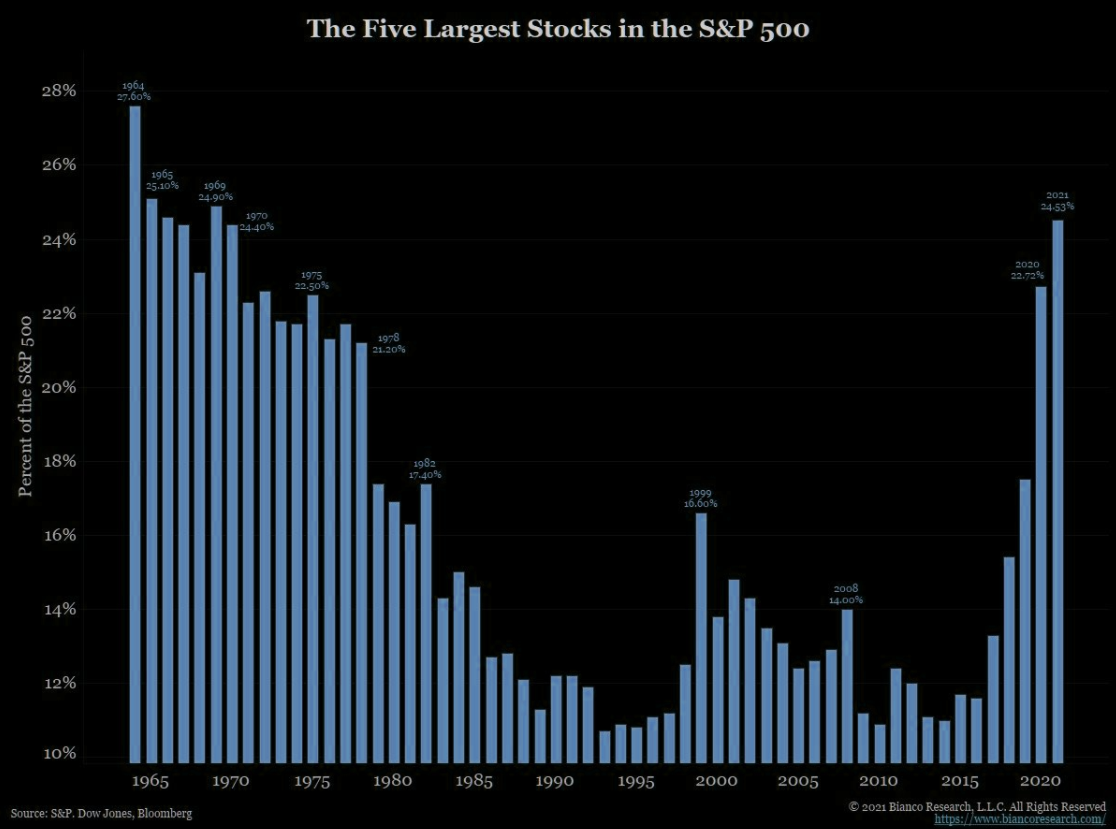
Source: Bianco

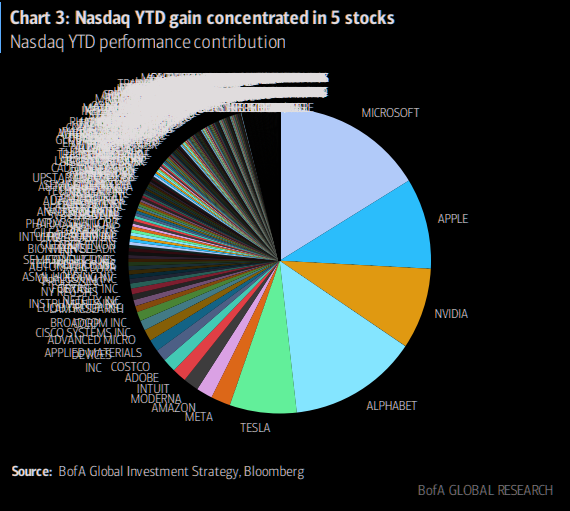
Concentration Nirvana

Did you know that 64% of 23% YTD gain in Nasdaq (3780 stocks) is attributable to 5 stocks only. Mighty Microsoft/Google/Apple/Nvidia/Tesla must not fall…


TNX may be declining toward the 100-day Moving Average at 14.34, near the 50% Fibonacci retracement level at 14.40.  The 61.8% Fibonacci retracement lies at 14.17.  This action may be indication that liquidity  may be migrating out of stocks and into Treasuries.


Posted in Published | 2 Comments

December 10, 2021

7:50 am

Good Morning!

SPX futures rose to an overnight high of 4689.60 before settling down somewhat near 485.00.  SPX may have completed its first impulsive decline from the top at the close and is now in a corrective phase.  The 61.8% Fibonacci retracement is at 4690.00, but keep in mind that a Wave two may retrace up to the entire decline of Wave one.  Those that have opted out of their short positions may consider re-shorting at or near the 61.8% level.  Of course, the “safer” option may be to wait until SPX re-crosses its support at 4665.00-4675.00.

9:00 am:  The Cycles Model suggests this morning may be the end of a 4.3 day rally off last Friday’s low.  We’ll know more in the first two hours of trading today.  Could we see a new high?

Viewing the options market, 4685.00 to 4725.00 appears to be the gamma neutral zone, while there is a plethora of open interest in puts (59,375) vs a lack of interest in calls (7358) between 4670.00 and 4685.00.  Market makers and hedge funds have a keen financial interest in keeping the SPX above 4685.00 today.  A slip here would create a self-reinforcing decline into next week and beyond.

ZeroHedge reports, “US futures rebounded on Friday from Thursday’s selloff as traders waited with bated breath for an inflation report that could strengthen the case for an aggressive policy tightening by the Federal Reserve, while Oracle Corp jumped on an upbeat third-quarter outlook. At 730 a.m. ET, Dow e-minis were up 109 points, or 0.30%, S&P 500 e-minis were up 16.25 points, or 0.35%, and Nasdaq 100 e-minis were up 53.50 points, or 0.4%. Europe’s Stoxx 600 Index pared an earlier decline, while a Bloomberg gauge of Asian airlines fell. In China, Evergrande chairman Hui Ka Yan sold just over a 2% stake in the company, in the same week the property developer was officially labeled a defaulter for the first time. The dollar, Treasury yields and oil advanced.”


VIX futures declined to an overnight low of 20.54 in what appears to be a consolidation inside yesterday’s trading range.  Wednesday’s low may be considered a half Trading Cycle low.  That trading Cycle completes at the Master Cycle interval in the last week of December.

Investing opines, “I am flabbergasted at the collapse of the fear index. In the span of just a few days, it was crushed to almost half its level, collapsing from the mid-30s back into the teens.

We see plainly that buy the dip rules the human mind. My view is that this will be recognized as an error in judgment. I hate to put so much weight on one report, but I again point to tomorrow morning’s CPI data as a potential inflection point.”


The NYSE Hi-Lo Index closed at -4.00 yesterday, giving investors a sell signal.  That, with the VIX above the 50-day Moving Average, is a reliable indicator of a pending reversal in equities.  Of course, we will watch the index today, which may open positive due to last night’s correction.  Staying beneath yesterday’s high at 30.00 may be a neutral reading, at worst.


TNX is rising above mid-Cycle support at 14.84.  Today begins a period of high trending strength in the Cycles Model.  There is a strong likelihood of a breakout above the 50-day Moving Average at 15.48.  That trend may last through the third week of February.

ZeroHedge announced, “Having surged faster than expected in 7 of the last 8 months, all eyes are on this morning’s Consumer Price Index as this is the last big release ahead of next Wednesday’s Federal Reserve decision, where Deutsche Bank economists (among many others) are expecting they’ll double the pace of tapering. Chair Powell himself reinforced those expectations in recent testimony, stopping just shy of unilaterally announcing the faster taper. Crucially, he noted this CPI print and the evolution of the virus were potential roadblocks to a faster taper next week.

And sure enough, CPI printed +6.8% YoY – right as expected and the fastest rate of increase since 1982…


USD futures declined to 96.10 this morning, testing the Cycle Top support at 96.08.  We may see the uptrend continue as resumes its rally into next week.


Posted in Published | 2 Comments

December 9, 2021

8:30 am

Good Morning!

SPX futures are in decline, approaching the aggressive sell level at 4675.00 (sound familiar?)  Confirmation may come at the Short-term and mid-Cycle supports at 4642.56.  Apparently a 3-day short-covering rally does not sho on the Cycles Model for the SPX, nor does it register on the VIX Model.  The Cycles appear to be telling us that the decline may resume.

ZeroHedge reports, ” After three days of torrid gains, US futures and European markets fell as concerns about economic risks from restrictions to control the new variant outweighed optimism about the efficacy of vaccines after a study from Japan found that the omicron variant is 4.2 times more transmissible (as largely expected) in its early stage than delta. Both S&P 500 and Nasdaq futures dropped around -0.4% as traders awaited earnings from Broadcom, Oracle and Costco after the market close and tomorrow’s key CPI print, while European equities drifted lower in quiet trade with little fresh news flow to drive price action.

Uncertainty about monetary policy could keep stocks “significantly volatile,” according to Pierre Veyret, a technical analyst at ActivTrades in London. “Investors are likely to remain cautious and keep on monitoring the macro outlook, especially today’s U.S. initial jobless claims, in order to gather more clues on what and when could be the Fed’s next move,” said Veyret.”


VIX futures rose to an overnight high of 20.81, thus far.  The Cycles Model calls for the next interval to be in the last week of December.  Should the Wave structure be correct, Minor Wave 3 may be 3-5 times the size of Wave 1!  We’ll discuss actual targets as this rally unfolds.  VIX Guy may have made the same error that I had, referring to the lower 5-month”Head & Shoulders” at 28.79.  It faked both of us out.  However, the Cycles Model pointed to Friday’s high at 35.32, since necklines usually fall at the top or bottom of Wave 1, giving us an 11-month formation, which is ignored by many technicians.

ZeroHedge remarks, “VIX guy continues nailing it

NASDAQ futs unch, SPX futs unch. What is the vol of that? As a reminder, this is what our favorite VIX (inverse) indicator told us a week ago (here):

“His main idea was to buy VIX here. Needless to say we are starting to sell volatility here. One way to play it is via put spreads in VIX. After all, volatility is mean reverting and our VIX guy has continued holding the perfect 100% inverse track record. Will he nail it again?”

Here we are with the VIX having crashed and it continues moving lower today. Dealers are in long gamma, and unless this moves asap, they will add to vol selling as well as funds getting involved in overwriting stuff post the squeeze move. Chart showing the VIX as well as the 2/8 months spread imploding.


The NYSE Hi-Lo closed between the 50-day Moving Average at 54.36 and mid-Cycle resistance at 77.03.  Monday would have given a Hi-Lo buy signal, having crossed above the Cycle Bottom at -116.00, but I had looked at the absolute below zero reading and failed to point that out.   My error.  Compounding this, neither the SPX nor the VIX Models gave a buy signal.


TNX is testing the mid-Cycle support at 14.85.  It may decline further as it is due for a minute retracement.  Should it decline beneath that level, the 100-day Moving Average at 14.30 may hold.  Today would be day 253 of the (early) Master Cycle which was registered last Friday.  I am not expecting further lows. but the window for another low has not slammed shut yet.

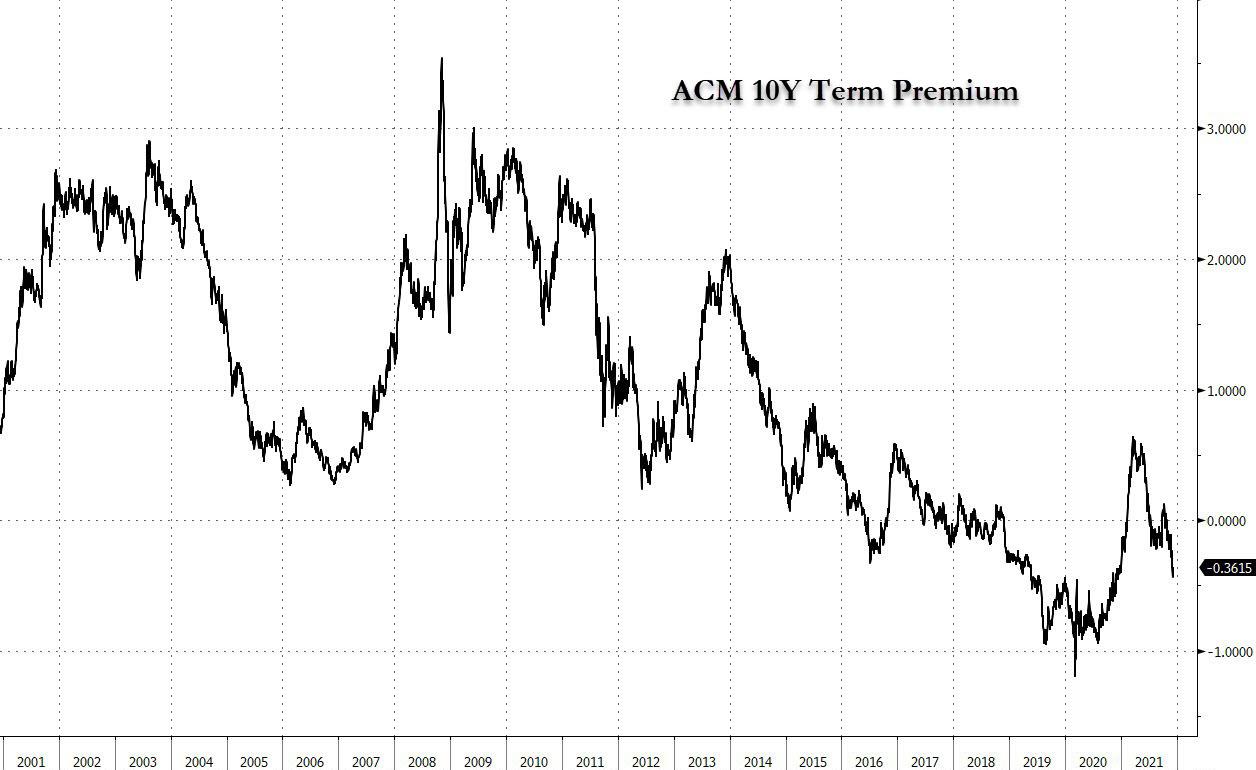
ZeroHedge observes, “If you asked your bank manager for a loan, the rate you will be offered will vary proportionally with not only how much you borrow, but also how long you borrow for. That, of course, is a no-brainer since the longer the bank is willing to lend to an individual, the greater the risk of something going wrong. Mainly, they encompass credit and inflation risks, and in the case of institutional investments, liquidity as well.

Yet, in the market for Treasuries and several other major developed markets, investors have recently become indifferent to the risk surrounding the longevity of their loans to governments. In other words, they are essentially saying, there is no more inflation risk in lending to Uncle Sam over, say, 10 years than there is when lending for a far shorter period. That is a massive irony against a backdrop where inflation is Le probleme du jour.


USD futures have bounce back above the Cycle Top support at 96.02.  It appears that USD may continue to ride the Cycle Top support higher with increasing strength towards the end of December.


The Shanghai Composite Index may be making an early Master Cycle high at 3688.40 today (day 245).  The Cycles have been punctuated with some dramatic moves this past year, evidence of a “managed” economy.  Plastering over the rot with more liquidity only makes the economy more unstable.  Having challenged the Cycle Top resistance, the new Master Cycle can only decline to the Cycle Bottom or lower by the end of Janusry, the next Master Cycle interval.

ZeroHedge remarks, “This is the way Evergrande ends: not with a bang but a whimper.

Three months after an initial shockwave of fear that China’s largest and most indebted property developer was set to default, roiled global markets only to see the company repeatedly kick the can on several occasions even as the final default was always just a matter of when not if (due to billions in interest payments and tens of billions in upcoming debt maturities), overnight ratings agency Fitch (with Moodys and S&P set to follow shortly) officially downgraded insolvent property developers China Evergrande Group and Kaisa Group, saying they had defaulted on offshore bonds.

The downgrades to so-called “restricted default” status came days after the companies failed to make an offshore bond interest payment, even though Evergrande and Kaisa have not officially announced defaults that will result in drawn-out debt restructuring processes and potentially nationalization.”


Posted in Published | Comments Off on December 9, 2021

December 8, 2021

2:47 pm

TNX rose to 15.37 this morning until short covering came in before the 10-year Treasury auction.  The Cycles Model shows strength of trend continuing through the weekend, suggesting TNX may breakout above the 50-day Moving Average at 15.9 in the next few days.

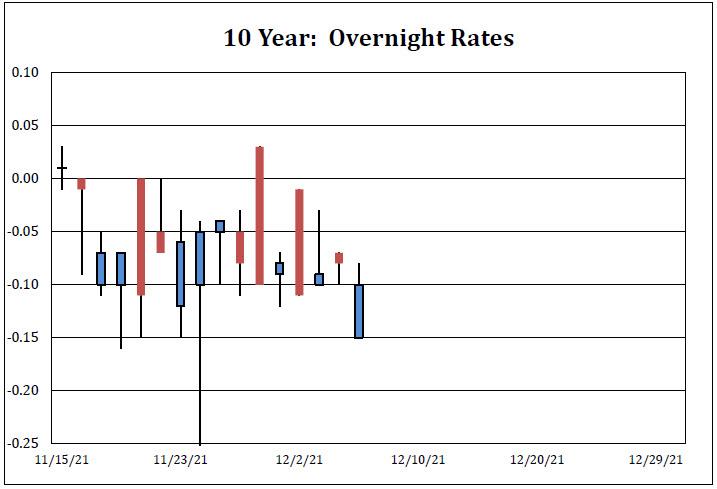
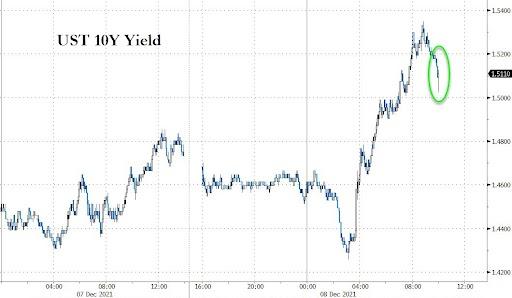
ZeroHedge remarks, “Similar to yesterday’s 3Y TSY action, the 10Y note was trading special in repo overnight ahead of today’s $36BN auction.

However, unlike yesterday’s 3Y auction, which stopped through generously, today’s 10Y auction did not do as expected and tailed modestly, as yields dropping sharply seconds after our tweet…

… expecting a big stop through did not help.”


10:00 am

Good Morning!

SPX futures may have taken another stab at the resistance at 4700.00 this morning, altering the structure of the correction.  Corrective moves are often hard to follow, since they can morph into different structures.  There is still a chance of attempting to overcome round number resistance as it completes its course.  The next hourly Cyclical interval is due shortly, so we may not have long to wait.  Should it do so, a new high may be in the offing.

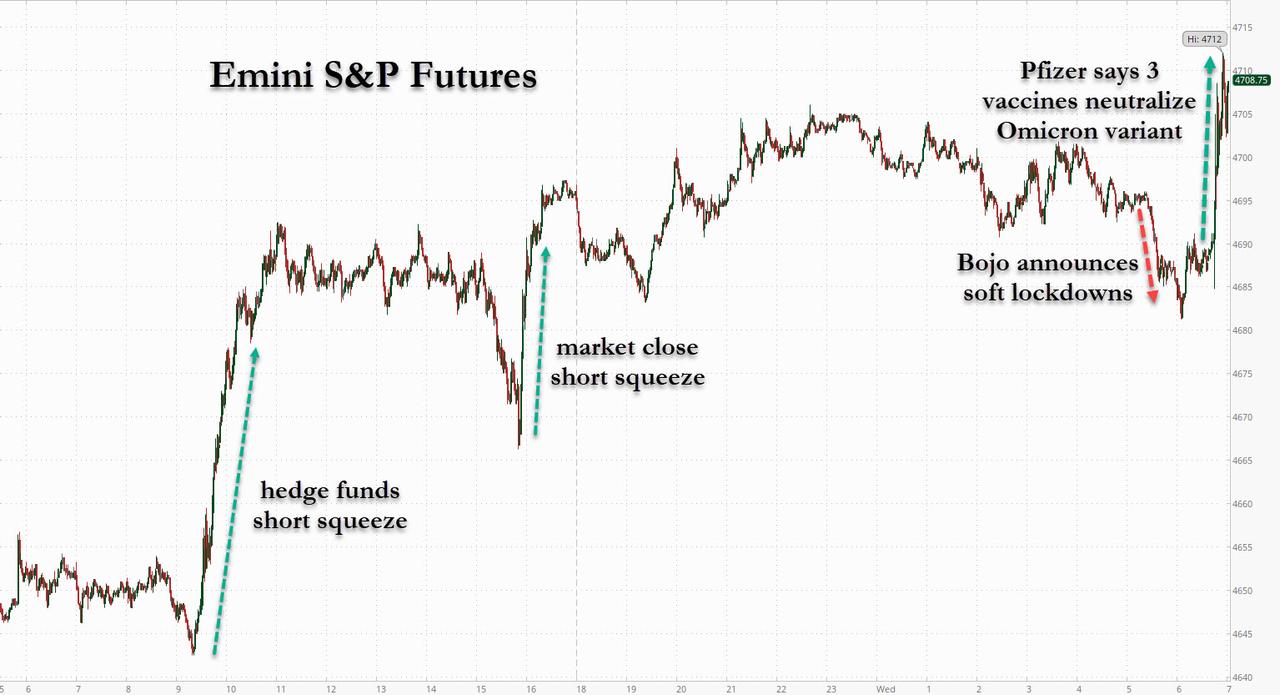
ZeroHedge reports, “Much of the overnight session was a snooze fest with stocks drifting first higher then lower after surging on Tuesday, as the narrative meandered from “omicron fears ease” optimism to “vaccines won’t work” pessimism, before futures took a sudden leg lower, dropping into the red just after 530am ET, following news that UK’s Boris Johnson would introduce new restrictions in England to curb Omicron spread, sparking fears that Omicron is more dangerous that expected (and than futures reflected). However, this episode of pessimism proved short-lived because just an hour later, the WSJ confirmed that Omicron is really just a pitch for covid booster shots when it reported that even though the covid vaccine loses significant effectiveness against Omicron in an early study, this is miraculously reversed with a booster shot as three doses of the vaccine were able to neutralize the variant in an initial laboratory study, and the companies said two doses may still protect against severe disease.

Futures quickly shot up on the news, spiking above the gamma “all clear” level of 4,700 in a move best summarized with the following chart.”


VIX has made a 68% retracement of Wave 1.  Its Cycle matches that of the SPX, so a turn may be imminent.  The open gap poses an obstacle for traders who anticipate the VIX declining further.  However, the VIX remains on a buy signal.  A reversal (higher) here may be very chaotic.


The NYSE Hi-Lo Index closed above its 50-day Moving Average yesterday and continues to trade in that area this morning.  This may be a buy signal, but not one we can put a lot of confidence in.


TNX is trading above its mid-Cycle support at 14.87.  The Cycles Model puts TNX on a buy signal to the third week of February.  It suggests that TNX may be well over 20.00 by then.  In fact, the weekly charts show the next major resistance near 33.00.  In the meantime, rising rates pout more pressure on equities.

ZeroHedge reports, “Update (2010ET): Senate Minority Leader Mitch McConnell (R-KY) is hitting friction within his own party over Tuesday’s debt deal announcement – which would essentially hand Democrats a blank check to continue raising the debt ceiling in exchange for ‘owning’ whatever negative effects it may have.

“There are always very diverse points of view within our conference on these types of issues,” said Sen. John Thune (R-SD), the #2 Senate Republican.

Republicans were describing the measure Tuesday as setting up a one-time exception to the filibuster. Though a GOP aide noted that the Senate routinely has a fast-track process for other issues like arms sales and trade deals, the debt agreement was drawing criticism from conservatives who don’t want to lift a finger to help Democrats extend the nation’s borrowing limit. –The Hill.”


USD futures have pulled back to the Cycle Top support at 95.97 this morning as prepares for the next move higher.  The Cycles Model suggests the uptrend may last to the second week of January.


Posted in Published | Comments Off on December 8, 2021

December 7, 2021

10:55 am

SPX has spent 10 hours in the short squeeze rally instead of the 8.6 that I had proposed.  The reason is that the structure of the rally is an A-B-C correction, which generally does not follow Cycle structure as closely.  However, it has its own structure.  C equals A near 4700.00.  That, plus round number resistance, may put an end to the squeeze.  You can see that most investors and hedge funds wend short between 4675.00 and 4700.00.  f this is indeed a squeeze, the rally may run out of steam imminently.

ZeroHedge observes, “The massive short-squeeze continues with “Most Shorted” stocks now up almost 9% from yesterday’s post-open plunge lows…

Source: Bloomberg

That sparked a near-vertical ramp at the cash open today…”


8:45 am

SPX futures rose to an overnight high of 4657.90, just above the 61.8% Fibonacci level of 4648.82 and a complete retracement of Minor Wave C.  The Wave C of (B) rally may take 8.6 hours should it complete in the first hour of the morning after an 8.6 day decline from the top.  The overlapping Waves gave away the structure, although Leading Diagonal first waves may also overlap.

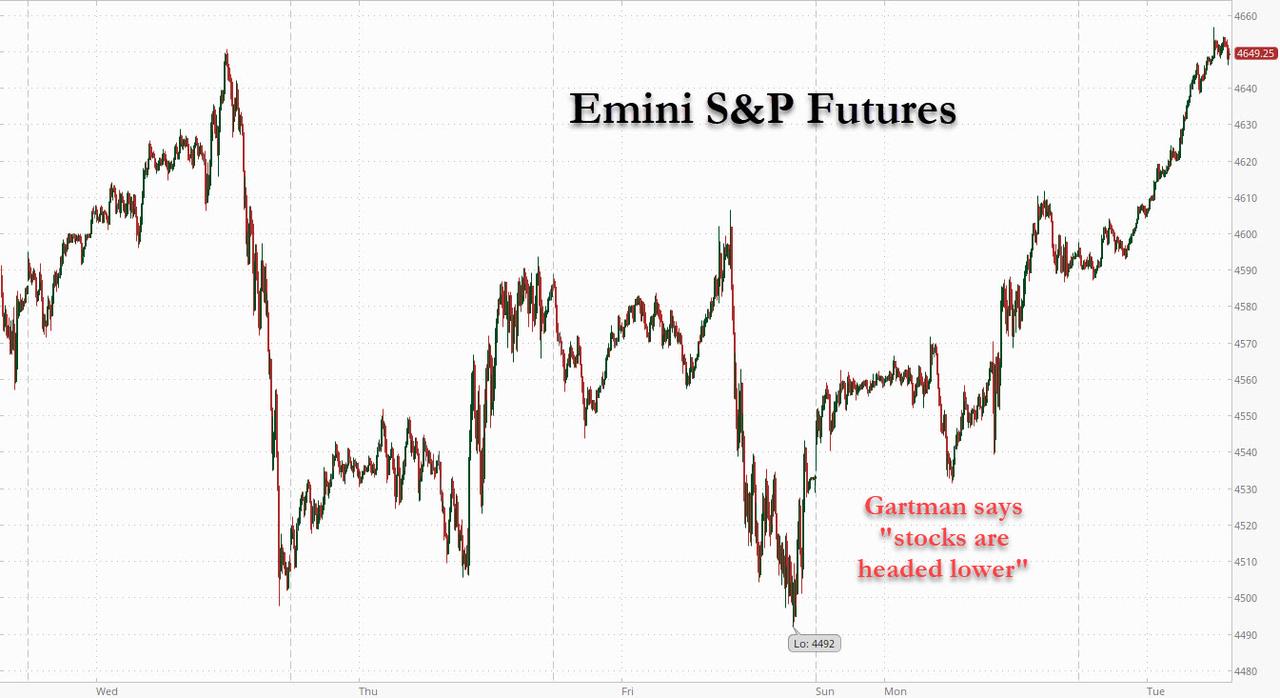
ZeroHedge reports, “U.S. index futures rallied, led by gains for Nasdaq 100 contracts, amid waning omicron worries and a booster shot of Chinese stimulus lifted world stock markets and oil on Tuesday and left traders offloading safe-haven currencies and bonds for the second day in a row. Emini S&P futures were up 61 point to 4,650.75 or about 120 points higher then where Gartman said “stocks are headed lower” some 24 hours ago. Nasdaq futures were up 1.8% and Dow futures rose 1% in premarket trading. In fact, futures are now just 50 points away from where they were below the Black Friday Omicron panic plunge.”


VIX futures declined to a low of 23.49 this morning, very near the 50% retracement level at 25.03.  A possible further retracement may be to the 61.8% Fib level at 22.60.  Note that the gap may remain unfilled.

ZeroHedge remarks, “When looking at the latest Goldman Prime Broker data, our collective jaws fell to the floor: while perhaps not a huge surprise, Goldman writes that the last two weeks saw that “largest 10-day net selling in US equities since Apr ’20 led by Macro Products as well as Info Tech/Consumer Disc stocks” with the bank elaborating that “North America and to a lesser extent EM regions were the most net sold, while DM Asia was net bought driven by short covers.”

But what was stunning was Goldman’s drilldown into the flow, where GS Prime found that the selling of US stocks – which made up more than 85% of the global $ net selling (-1.4 SDs) – was driven almost entirely by short sales and to a lesser extent long sales (9 to 1).”


The NYSE Hi-Lo closed above its Cycle Bottom support/resistance  at -116.00.  The Hi-Lo may open positive this morning, but there is no confirmation of a rally in the SPX or the VIX.


TNX opened higher this morning, having crossed above the 100-day Moving Average at 14.23 yesterday.  It may have made a buy signal and appears to confirm the early (day 247) Master Cycle low made on Friday.  Confirmation of the buy signal comes above the mid-Cycle resistance at 14.98.


USD futures rose to 96.59 this mornig, approaching a breakout above the prior peak.  The Wave structure is complex and the Cycles Model suggests a continued uptrend through mid-January.


Posted in Published | 1 Comment

December 6, 2021

2:47 pm

SPX finally reveals its structure as it completes a Wave (c) of [ii].  I have been warning of a coming panic and now it is time.  The Decline to Friday’s low was 8.6 days.  The Cycles Model suggests another 4.3 days from Friday’s low may be needed to complete Wave (1).  The Hi-Lo swung back and forth this morning, but remains stuck at -40.00.

ZeroHedge observes, “While the hard de-risking of Friday has seen a calming overnight (thanks to a ‘meh’ China RRR cut), The Fed’s recent coordinated messaging-shift to “inflation fighter” remains top of mind for most investors.

A smorgasbord of Fedspeak late last week made it clear that The Fed has:

  1. a clear desire for an accelerated taper (double-up to complete by March) in order to…
  2. …liftoff the policy rate sooner (commence June?)

For now it’s working as the market is fully pricing-in a rate-hike by June…

Nomura’s Charlie McElligott warns that the sudden flip-flop jawboning has risk-assets “stuck” in a deleveraging and exposure reduction cycle, particularly for a market parked in crowded “easy-policy” trades (like leveraged “bond” proxies of “Secular Growth” profitless Tech)…”


7:35 am

Good Morning!

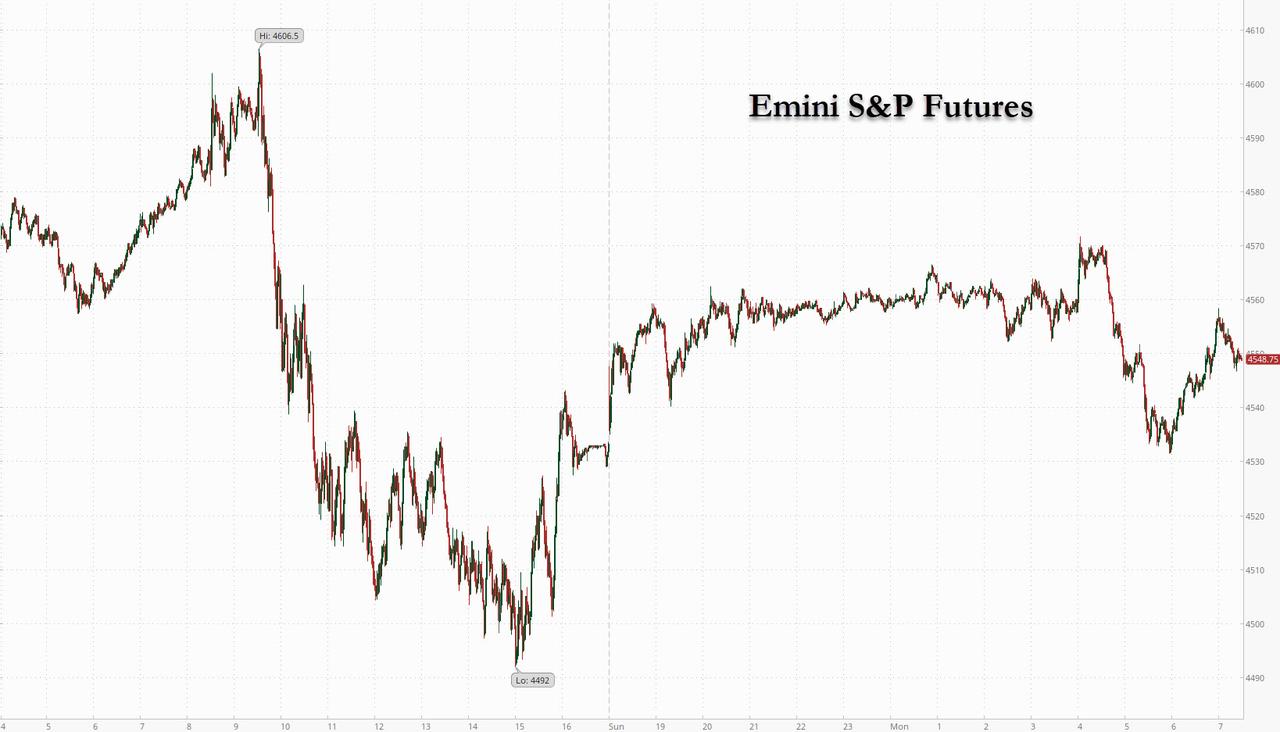
SPX futures rose to a weekend high of 4573.80. a 70% retracement of Friday’s decline, before pulling back.  It is currently hovering near the 50-day Moving Average at 4540.03.  At Friday’s close it bounced from the 100-day Moving Average at 4491.13.  Crossing the Ending Diagonal trendline at 4500.00 puts the SPX on a sell signal with a potentially complete reversal of the rally from March 2020.  A violation of the 100-day simply confirms the sell signal.

While lighter than the past, today’s SPX options expiration shows positive gamma a 4560.00 and higher, while negative gamma starts at 4550.00.  Max Pain appears to be near 4555.00.  Wednesday’s options expiration is very light, but Max Pain rises to 4580.00.

ZeroHedge reports, “&P futures and European stocks rebounded from Friday’s selloff while Asian shares fell, as investors took comfort in reports from South Africa which said initial data doesn’t show a surge of hospitalizations as a result of the omicron variant, a view repeated by Anthony Fauci on Sunday. Meanwhile, fears about a tighter Fed were put on the backburner.

Also overnight, China’s central bank announced it will cut the RRR by 50bps releasing 1.2tn CNY in liquidity, a move that had been widely expected. The cut comes as insolvent Chinese property developer Evergrande was said to be planning to include all its offshore public bonds and private debt obligations in a restructuring plan. US equity futures rose 0.3%, fading earlier gains, and were last trading at 4,550. Nasdaq futures pared losses early in the U.S. morning, trading down 0.4%. Oil rose after Saudi Arabia boosted the prices of its crude, signaling confidence in the demand outlook, which helped lift European energy shares. The 10-year Treasury yield advanced to 1.40%, while the dollar was little changed and the yen weakened.”


VIX futures challenged the neckline by declining to 28.54, but has bounced back since then.  VIX has tripped its Head & Shoulders trendline, with follow-through on its way.  A month ago volatility was considered boring.  Despite the rally in VIX, analysts are gearing up for a Christmas rally instead of a further sell-off.

MarketEar comments, “Recently realized volatility has exploded. The 1 month realized SPX vol is now well above the 3 month. Moves have picked up. Add to it imploding market depth, as well as the overall dealer gamma picture and you understand why things have been slightly chaotic. Recall, all of these factors work both ways…”


The NYSE Hi-Lo Index closed a bit lower on Friday than the prior day.  I have marked last Tuesday as a possible Master Cycle low on day 250.  Today is only 6 days later, so we are still in the timeframe for a much deeper low this week.  While equities appear to be “on the edge” of the Christmas rally, a move in the wrong direction may develop into a panic decline.  The Hi-Lo remains on a sell signal.


USD futures consolidated within Friday’s trading range, albeit with gains from the close.  The next Master Cycle turning point is in mid-January, so the uptrend is likely to continue.


TNX appears to have made a bounce from Friday’s low (day 247) this morning, but it may not indicate a true true reversal from a Master Cycle low.  Today is day 250, so there may yet be another probe lower, possibly as low as the Cycle Bottom support at 11.94.  The uncertainty may be short-lived, as the pattern may reveal itself over the next week or so.  A further equities sell-off would likely boost inflows into bonds.


Posted in Published | Comments Off on December 6, 2021

December 3, 2021

3:45 pm

SPX is finally beneath the trendline this afternoon.   The VIX is above 32.00 and the hi-Lo is currently at -120.00.  The Decline is underway.   Panic next week?

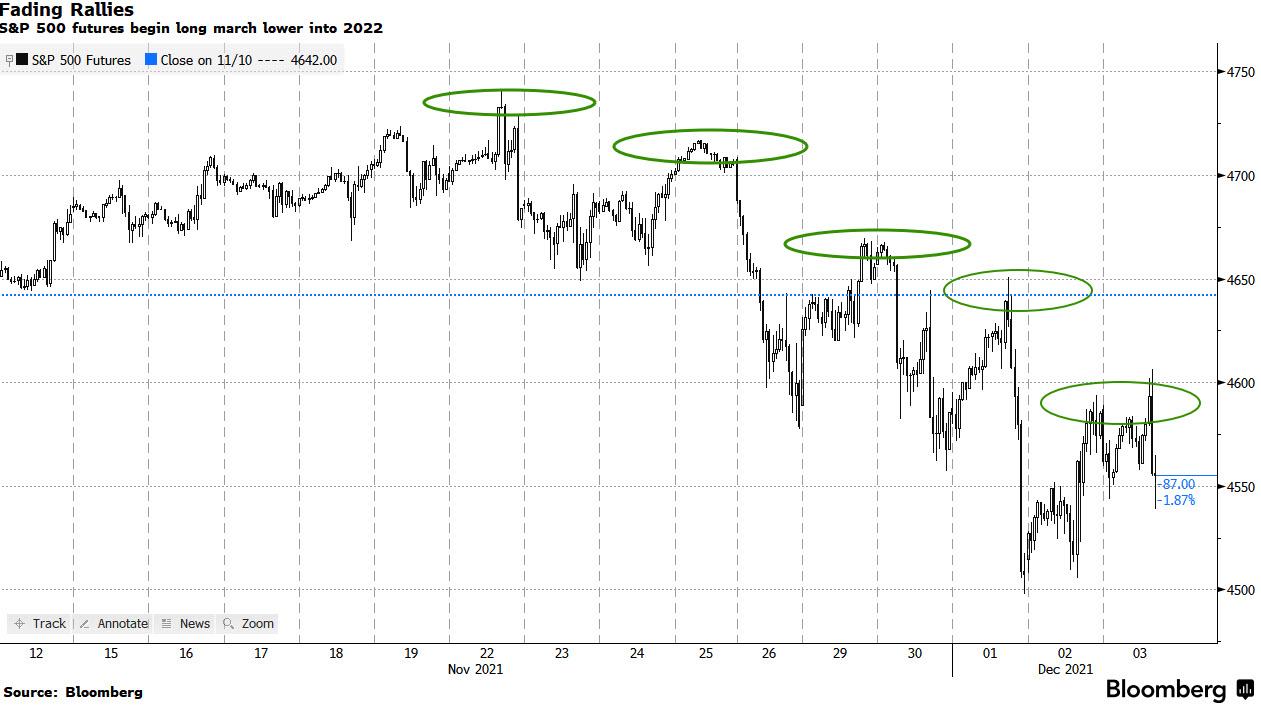
ZeroHedge observes, “S&P 500 futures have a distinctly bearish tone after a week of whiplash trading, which began with the post-Thanksgiving Day meltdown.

Though it hasn’t been a one-way street lower, intraday bounces for the contract have been fading at lower peaks.

That is a clear enough signal for short-term traders to see if they are positioned for a declining asset.

And even though non-farm payrolls did miss forecasts, the Fed won’t be derailed from its path to tighter policy.

Moreover, the blackout period ahead of the Dec. 15 FOMC decision begins this weekend, which means there won’t be any walking back of the hawkish noises heard this week.”


9:42 am

There may have been an effort to get the SPX out of negative gamma territory, which extends to 1630.00.  However, it appears to have failed at the 12.9-hour Cyclical interval.  Should the decline re-establish itself, we may see a probable 300-point plus decline through Monday.  Instead of “buy the dip,” there appears to be a movement to “sell the bounce.”

ZeroHedge questions, “Why are CEOs and corporate insiders selling their stocks at a far faster rate than we have ever seen before?  Do they know something that the rest of us do not?  If stock prices are going to continue soaring into the stratosphere like many in the mainstream media are suggesting, these insiders that are dumping stocks like there is no tomorrow will miss out on some absolutely enormous profits.  On the other hand, if a colossal market crash is coming in 2022, then 2021 was absolutely the perfect time to get out.  As I have said countless times before, you only make money in the stock market if you get out in time.  Could it be possible that many of the richest people in the world have picked the absolutely perfect moment to pull the trigger?”


7:25 am

Good Morning!

SPX futures probed down to 4546.10 before rising back to the close.  Dips are still being bought, but on lighter volume while hedge funds, owners and institutions are selling.  There is yet another week of selling ahead before a probable hiatus going into options week.

ZeroHedge reports, “U.S. equity futures were flat, rebounding from an overnight slide following news that 5 “mild” Omicron cases were found in New York, and European stocks wavered at the end of a volatile week as traders waited for the latest jobs data to assess the likely pace of Federal Reserve tightening and accelerated tapering. Emini S&P futures traded in a narrow range, and were up 2 points or 0.04%, Nasdaq futures were flat,while Dow Jones futures were up 8 points. The dollar edged higher, along with the euro after ECB President Christine Lagarde said inflation will decline in 2022. Crude advanced after OPEC+ left the door open to changing the plan to raise output at short notice.


ZeroHedge observes the technical side, “Earlier today we observed that amid the market turmoil of the past month, hedge funds have been unwinding net exposure at a furious pace and selling (or shorting) to retail investors, who paradoxically have been buying at the fastest pace on record.

We got some incremental data this morning from Goldman, which noted that the bank’s prime book (hedge fund-facing) was heavily net sold to start December (largest 1-day $ net selling since September, -2.5 SDs vs. the average daily net flow of the past year), driven by continued short sales and to a much lesser extent long sales (9 to 1). The frenzied shorting, which occurred in the context of sharp net deleveraging…”


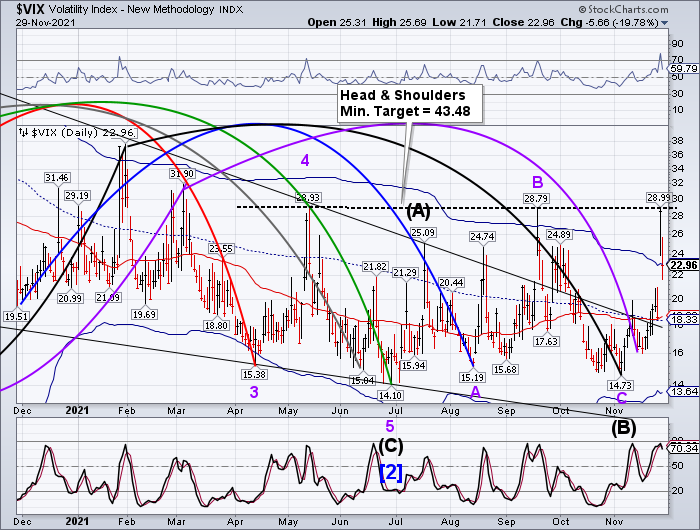
VIX futures continue to hover beneath the Head & Shoulders neckline at 28.79.  This appears to be a consolidation after the breakout as the VIX gathers strength for its next move.   The Cycles Model suggests enough of a boost in strength to hurl the VIX above the neckline and towards its intended target.  Indications are that the actual target for Wave [iii]  of 3 may be closer to 50.00.


The NYSE Hi-Lo Index opened at -43 yesterday and has gone lower into the close.  It is hard to see how the market can rally when so many stocks are making new lows.  What this is really telling us is that the rallies, though sharp, are facing lower and lower limits to their efficacy.


TNX futures are hovering just above the 100-day Moving Average at 14.20 in a consolidation, waiting for the next surge of strength that may come later today.  Whether this is enough to cuse a breakout in rates is unknown, but the Cycles MOdel points to a triple burst of strength starting mid-week and extending through the weekend.


USD futures are moving higher, having risen to an overnight high of  96.32.  The Cycles Model indicates a continued uptrend through the second week of January.


Posted in Published | Comments Off on December 3, 2021

December 2, 2021 – The worst is yet to come…

3:10 pm

SPX has taken 10 hours into the afternoon high from yesterday’s high.  It is said that both time and price requirements must be met to complete a Cycle.  the 61.8% retracement is at 4596.37.  Thus far, the bounce has gone to 4592.13.  The retracement pattern appears complete.

The Hi-Lo (-110.00) remains beneath its Cycle Bottom resistance at 101.70.  The VIX remains within a point of its neckline at 28.79.


12:55 pm

I spoke too hastily this morning.  SPX is now approaching the 61.8% retracement at 4596.37 and has spent 8.6 hours making the hourly Cycle from 4562.94 to 4588.81.  Whereas Minor Wave 1 – 2 took 43 hours (8.6 X 5), Minute Wave [i] – [ii] only took 8.6 hours.  It is likely that Wave [iii] – [iv] may elongate.  I suspect that Wave [iii] alone may take 8.6 hours, putting the low at mid-afternoon tomorrow.   Most onlookers view this pattern as chaotic.  I see a distinct rhythm.

The NYSE Hi-Lo Index rose to -108.00, but still very bearish.  VIX is consolidating at the neckline.  NDX has completed a 42% retracement of a nearly 685 point decline.

ZeroHedge relates, “While US equity indexes have been relatively stable despite the recent spike in volatility, what is going below the surface is sheer turmoil.

Take the Nasdaq: while the index remains just shy of all time highs, this is entirely thanks to the five or so gigacaps, the GAMMA (fka FAAMG) stocks, which has found solid support in recent days. Alas, the same can not be said for the rest of the tech-heavy Nasdaq where as the chart below shows, we have just seek the biggest spike in new 52-week lows since the March 2020 crash.

This, when coupled with the recent bloodbath observed in the median stock (as measured by the Value Line Geometric), is why yesterday we rhetorically noted that “they better not start selling the generals” or else everything will come crashing down.


10:33 am

SPX made a 43% retracement of yesterday’s decline, far less than the “worst case” scenario (61.8%) I painted near yesterday’s close.  It is clearly in negative gamma territory and bearishness may heighten at the crossing of the 50-day Moving Average at 4532.45.  Today and tomorrow may see a panic develop as equities complete their next 4.3-day Cycle (3rd Wave) late on Friday.

The 100-day Moving Average lies at 4489.03, of which traders may take note.  The 200-day Moving Average is near 4300.00.  The massive Orthodox Broadening Top trendline is near 4000.00.  Finally, the daily Cycle Bottom is at 3935.00.  All of these potential supports may be taken out in Wave (1), due to end late next week.

VIX has climbed to 30.39, above the neckline a 28.79 and the Hi-Lo has declined from an open of -43 to a low of -151.00.

NDX has made a new low at 15770.92, beneath yesterday’s close at 15877.72.

ZeroHedge advises, “This morning’s melt-up from the cash open was extremely technical, lifting the US majors above various key technical levels.

However, that surge of buying did not last long and now that Omicron has struck in a second place in the US, the S&P (back below its 50DMA), Nasdaq (back below its 50DMA), and Dow (back at 200DMA) are all fading fast…

So what really changed? 

Nomura’s Charlie McElligott explains:

It’s pretty obvious: the Fed has green-lighted an accelerated taper in order to pull-forward a dense-but-short “lift-off,” as Jerome Powell is clearly now much more concerned about inflation (which is no longer transitory) than about economic growth

And Nomura’s “Economic Quadrant” playbook highlights the fact that the current Equities risk-premium / thematic return profile very closely mirrors what they said it would do upon this the phase shift from “Expansion” into “Slowdown” being confirmed in the first week of October (and holding since)…”


8:15 am

Good Morning!

SPX futures rose to an overnight high of 4554.00, for the first time not overlapping its previous low.   This may be an indicator that Wave 3 of (1) is underway, as Wave 1 may overlap, but generally impulsive Waves do not.  Yesterday may have been the  half-way point of this decline and it may become much more impulsive as it progresses.  It currently sits just above the 50-day Moving Average at 4631.51.  It remains deeply in the negative gamma zone.  Should it open beneath the 50-day, all hell may break loose as dominoes start falling hard.

ZeroHedge reports, “U.S. index futures regained some ground alongside Asian markets while European stocks slumped to session lows in a delayed response to yesterday’s late Omicron-driven US selloff, as markets remained volatile following the biggest two-day plunge in more than a year, spurred by concern about the omicron coronavirus variant and Federal Reserve tightening. Investors await data for unemployment claims, as well as earnings from companies including Dollar General and Kroger. Tech is the weakest sector, dropping in sympathy after Apple warned its suppliers of slowing iPhone demand. Nasdaq futures pared earlier gains of up to 0.8% to trade down 0.1% while S&P futures are only 0.2% higher after rising as much as 0.9%.

While the knee-jerk reaction of stock investors may “continue to be to take profits before the end of the year,” there is “plenty of liquidity available to drive stock prices higher as dip-buyers enter the market,” Ed Yardeni wrote in a note. The U.S. economy grew at a modest to moderate pace through mid-November, while price hikes were widespread amid supply-chain disruptions and labor shortages, the Federal Reserve said in its Beige Book survey Tuesday.”


VIX futures dipped beneath the Head & Shoulders neckline at 28.99 but has recovered to rise back above it as I write.   The Cycles Model suggests trending strength may be growing over the weekend, indicative of a third Wave.  As mentioned before, the H&S target is a minimum.  There is also a Cup with Handle formation with a potential target near 50.00 for Wave 3 of (C).


The NYSE Hi-Lo Index closed at -202.00 yesterday,, the second lowest close of the week.  Dip buyers appeared in the morning, as it opened at 5.00., but it appears that hedge funds and institutions saw this as an opportunity to liquidate.

ZeroHedge observes, “Over the weekend, and then again on Monday we reported that It had been a catastrophic week for hedge funds: heading into Black Red Friday, losses were staggering with Goldman Prime reporting that many hedge funds were caught off-guard by news of the Omicron variant as they had bought Reopen stocks and sold Stay-at Home names in the past week. As a result, in the week ending Nov 25, GS Equity Fundamental L/S Performance Estimate fell -1.57% between 11/19 and 11/25, driven by alpha of -1.12% which was “the worst alpha drawdown in nearly six months” and beta of -0.45% (from market exposure and market sensitivity combined).

It only got worse on Friday and then again Monday, when Moderna – the 3rd most popular short in the hedge fund universe with some $4.5BN of the stock held short by the 2 and 20 crowd…”


TNX is challenging the 100-day Moving Average at 14.20 this morning, but has not yet broken beneath the previous low at 14.12.  Should it break through, the decline may continue for another week, according to the Cycles Model.  The next support level is the Cycle Bottom at 11.97.


USD futures consolidated, making an overnight low of 95.83, just above the Cycle Top Support at 95.71.  The Cycles Model suggests gathering strength over the weekend with possible new highs early next week.


BKX broke through its Ending Diagonal trendline on Tuesday and now its atop it mid-Cycle support at 128.75.  That, and the 200-day Moving Average at 127.86 are due to be skewered.  The Cycles Model suggests the decline may pick up intensity next week with the Cycle Bottom at 115.67 being the next potential support.


WTIC futures made a new low at 63.85 this morning, breaking through the Broadening Wedge trendline at 64.40.  The current shorting opportunity was made last week when the bounce was rejected at the 50-day Moving Average.  The Cycles Model suggests a Master Cycle low early next week, with a probable target at the Cycle Bottom support at 56.84.  From there we may expect another bounce lasting up to 2 weeks to retest the trendline.

ZeroHedge observes, “An earlier trial balloon of a smaller 200k b/d production hike was been popped as Russia moves with a formal proposal for OPEC+ to lift oil output by 400,000 b/d for January, sending oil markets crashing.

Energy Intel’s Deputy Bureau Chief & Chief Opec Correspondent Amena Bakr confirms that “All ministers appear to be in agreement with an increment of 400k for Jan (i.e. a rollover of the current policy)” according to sources.

This is what was planned by OPEC+ but not what the market was ‘hoping’ for.

WTI plunged further on the headlines, tumbling to a $62 handle.”


After a week-long consolidation, gold  futures made a new low this morning at 1768.40.  It is approaching its own Broadening Wedge trendline at 1760.00.  Should it break through, the next support may be the Head & Shoulder neckline at 1670.00.  The Cycles Model calls for a Master Cycle low in early January.  By then we may see gold near or below 1200.00.


Posted in Published | Comments Off on December 2, 2021 – The worst is yet to come…

December 1, 2021

4:10 pm

On a periodic basis I check the 2-hour, daily, weekly and monthly charts for consistency.  One of the problems with hourly and even daily charts is “drift,” where trendlines, formation outlines and even labels tend to become out of sync with their appropriate positions.  Today was one of those times where I found that the daily chart shows the 20-month trendline from March 2020 at 4510.00, where the bounce occurred.  I have remedied that error in the 2-hour chart.

This tells us to prepare for a potential bounce tomorrow morning.  If not, all the better, but SPX is in negative gamma territory all the way up to 4620.00.  The 61.8% Fibonacci retracement is at 4598.47, which still leaves it under the influence of negative gamma.


3:40 pm

SPX bounced off the 50-day Moving average at 4531.70.  It may save the move lower for the overnight session.   The NYSE Hi-Lo Index is at -131.00.  In addition, the SPX is in negative gamma territory (dominated by puts) beneath 4620.00.

ZeroHedge observes, “Update (1420ET): Reports that the Omicron variant has arrived in the US sent stocks and bond yields legging further down…

The Dow and Nasdaq just joined Small Caps in the red for the day…

And 30Y Yields are down 8bps from their intraday highs, back at yesterday’s lows…”


3:35 pm

VIX broke through the neckline of the Head & Shoulders formation.  Should start rocking over night.

12:30 pm

SPX rose above mid-Cycle resistance at 4627.00 due to a large call option position at 4640.00.  However, it appears that the “pull up” may not be strong enough to sustain the bounce.  Once the mid-Cycle support goes, the 50-day Moving Average at 4531.52 may be the next test.

VIX  is now rising from its Cycle Top at 23.17 and the Hi-Lo Index, which opened at 5.00 is now at -17.00.  There seems to be no confidence in this rally.

ZeroHedge explains, “As expected, yesterday’s bearish month-end rebalancing which saw over $8 billion in MOC for sale orders has given way to the traditional strong December equity inflows, sending futures sharply higher.

So now that reflexive fund flows have reversed and the narrative is quickly changing to one where both the bearish Omicron and Powell developments have been mitigated, at least according to today’s price action, the question is what comes next.”


8:00 am

Good Morning!

SPX futures bounced back to test Intermediate-term resistance at 4622.75as it establishes new support and resistance boundaries.  The decline thus far has been a stair-step affair with overlapping Waves.  Two nearby supports have yet to be challenged, the 50-day and the 20-month trendline.  The current Cycle has another 8 days to go, and the decline may be starting its panic phase, despite the steep retracements.
ZeroHedge reports, “Heading into yesterday’s painful close to one of the ugliest months since March 2020, which saw a huge forced liquidation rebalance with more than $8 billion in Market on Close orders, we said that while we are seeing “forced selling dump into the close today” this would be followed by “forced Dec 1 buying frontrunning after the close.”

And just as expected, despite yesterday’s dramatic hawkish pivot by Powell, who said it was time to retire the word transitory in describing the inflation outlook (the same word the Fed used hundreds of times earlier in 2021 sparking relentless mockery from this website for being clueless as usual) while also saying the U.S. central bank would consider bringing forward plans for tapering its bond buying program at its next meeting in two weeks, the frontrunning of new monthly inflows is in full force with S&P futures rising over 1.2%, Nasdaq futures up 1.3%, and Dow futures up 0.9%, recovering almost all of Tuesday’s decline.”


VIX futures declined to a low of 23.47, remaining above Cycle Top support at 23.14 as it prepares to vault above the Head & Shoulder neckline.  The current Master cycle may run to the end of December, so there is time for a breakout above the Head & Shoulders neckline.

CharlesHughSmith relates, “ne of the most famous examples of smart people being sucked into a bubble and losing a packet as a result is Isaac Newton’s forays in and out of the 1720 South Sea Bubble that is estimated to have sucked in 80–90% of the entire pool of investors in England.

Some have claimed that Newton did not buy early in 1711, sell in April 1720 for a nice profit and then sink the majority of his substantial fortune in the bubble as it peaked in summer, then suffering heavy losses as the bubble popped in September, but evidence supports this chain of events.

Newton “bought the dip” on the way up and then added to his position as the mania rolled over, making his final fatal purchase as a “buy the dip” just before the “last chance to exit” spike — which is precisely the point the current bubble has finally reached, when everyone is all in and “buying the dip” to increase the profits that everyone agrees are essentially guaranteed because the Fed.”


The NYSE Hi-Lo Index opened in the negative and became more so throughout the day yesterday.  The story being told here is that shares of a lot of companies are being distributed to eager speculators willing to buy the dip.  The Cycles Model suggests the Hi-Lo may see a bottom next week, which implies a bounce during options week.  However, there appears to be no corresponding Master cycle low in the stock indices or in the VIX.


TNX futures surged to 15.06 this morning, challenging the mid-Cycle resistance at 14.92 before puling back at the open.  It has begun an Intermediate Wave (C), which, by any standards, is coming on strong and fast.  The Cycles Model suggests a cotiued rally through the week of January 15.


USD futures consolidated above Cycle Top support at 95.64 in the overnight session.  By staying above that support, the uptrend is preserved.  The Cycles Model suggests a continued uptrend to mid-January.


BKX broke through its 13-month trendline yesterday, strengthening the sell signal already confirmed beneath the 50-day Moving Average.  The implication is that the entire rally from March 2020 is in danger of being retraced.  It is in day 224 of the 258-day Master Cycle, leaving more than a month to go for the next low.


Gold futures bounced this morning to test the 50-day Moving Average at 1790.26.  The decline is still underway with a Master Cycle low anticipated during the week of December 13.  The Broadening Wedge trendline at 1760.00 is is under consideration to be broken with a possible support at the Head & Shoulders neckline at 1680.00 for the next Master Cycle low.


Posted in Published | Comments Off on December 1, 2021

November 30, 2021

8:30 am

Good Morning!

SPX futures plunged beneath back beneath Intermediate-term support at 4616.50 this morning  to an overnight low of 4586.10 as the bear market resumes.   SPX completed a 4.3-day (top-to-top) Cycle at 1:00 pm yesterday and possibly set the pattern for the next Cycle high on Monday morning.  This decline is likely to take out the 50-day Moving Average at 4626.65 and challenge the trendline just above 4400.00.  Wave 3 may be a multiple the size of Wave 1.  Experts are still calling for a Christmas rally later in December.  However, the Cycles Model may not agree.

RealInvestmentAdvice opines, “Last week, we asked if there would be a market correction before “Santa visits Broad and Wall?”

“Investors’ ‘wish lists’ are hung by the chimney with care, hopeful the ‘Santa Claus rally’ will soon be there. While they remain ‘snug in their beds, the historical data dances in the heads.’ The chart below from @themarketear shows the annual “seasonality” from 1985 through 2019.

It certainly seems there is little to worry about. However, notice that dip at the beginning of December.“


VIX futures rose to an overnight high of 27.58 as the level of fear rises again.  Commentators suggest that VIX is trading more line February 2020 than a mere correction.


The NYSE Hi-Lo Index is not offering any support for the bulls.  Although at a higher low, the Hi-Lo Index Cycles Model doesn’t call for a low until December 8-10.  That’s nearly 2 weeks of negative market to look forward to.


TNX has declined to a morning low of 14.24.   Wave (B)appears to be turning into an Expanded Flat correction that may find a bottom near 14.15.  The Cycles Model suggests that the bottom is near and an abrupt reversal may be at hand.


USD futures made an overnight low at 95.65, just above Cycle Top support at 95.58.  The Cycles Model also calls for a sharp reversal today in USD.


Posted in Published | 1 Comment