August 3, 2022

2:53 pm

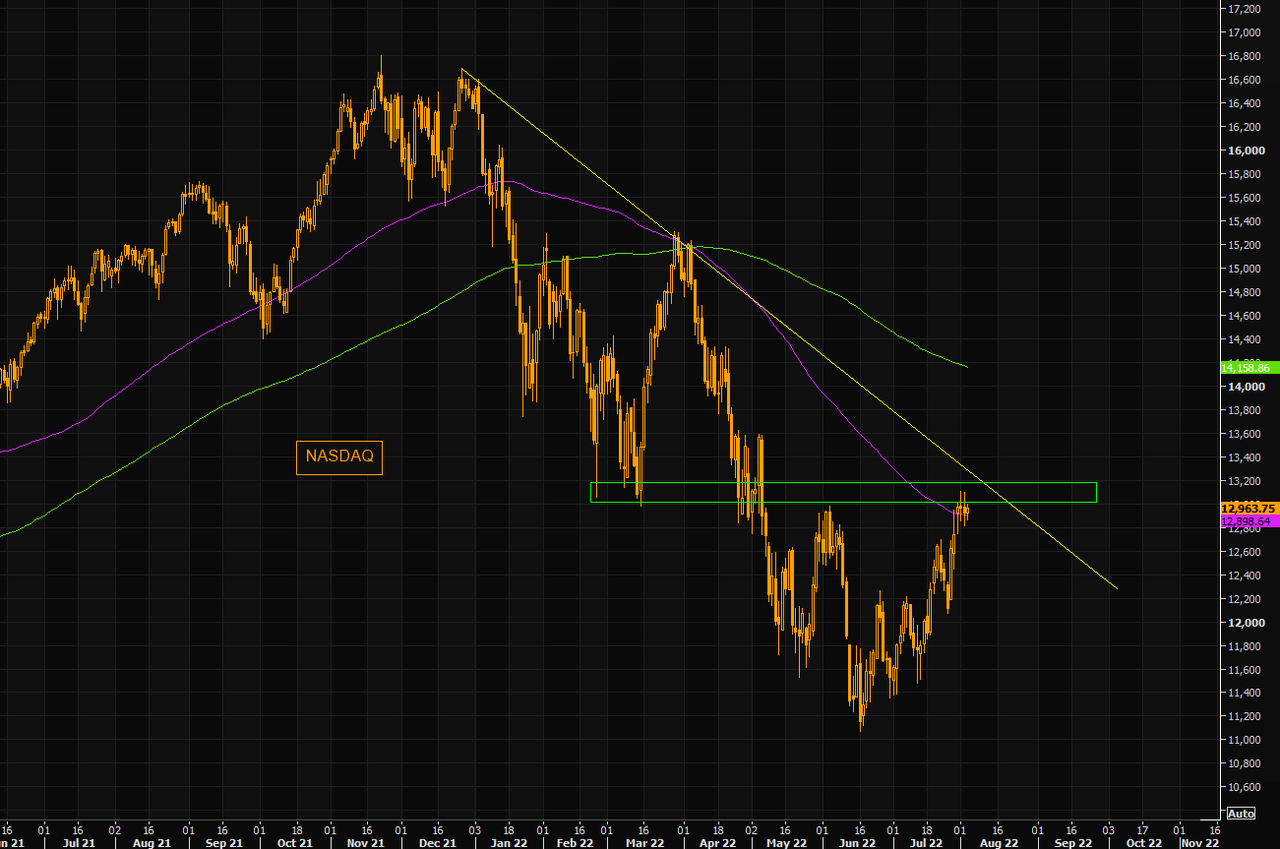
NDX has slipped above the Lip/Neckline at 13020.00 to reach the 38.2% retracement value at 13213.31.  I currently have no higher target for this rally.  Mid-Cycle resistance at 14002.00 may be a faint possibility.  Friday also stands as a potential reversal day.  However, a decline beneath the trendline at 13020.00 is useful as a sell signal.

ZeroHedge observes, “NASDAQ – huge levels watch

NASDAQ is back to the 100 day moving average. As Bear Traps notes, this has been the longest period of tech trading below the 100 day moving average since Lehman. 13000/13200 is a huge resistance area to watch. Why not a flag here, another push higher, possibly overshoot the trend line and then another frustrating move lower. That would definitely be the main pain trade…


2:41 pm

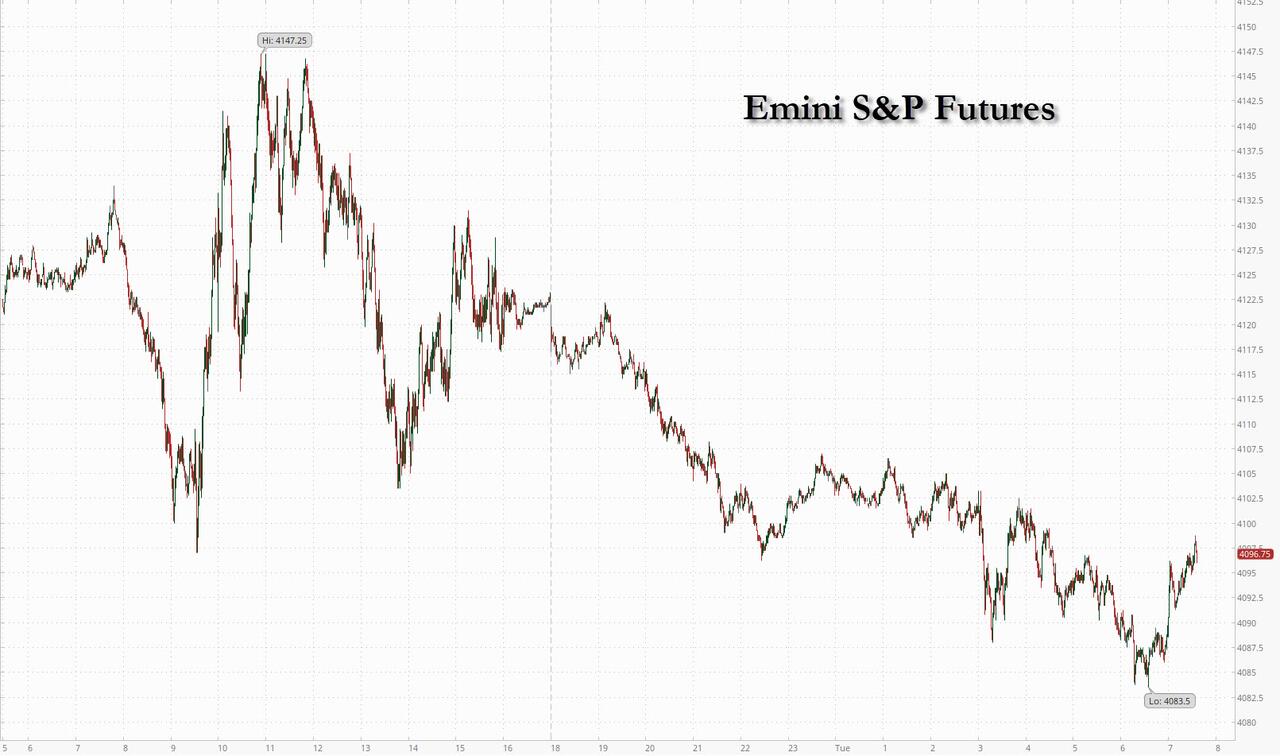
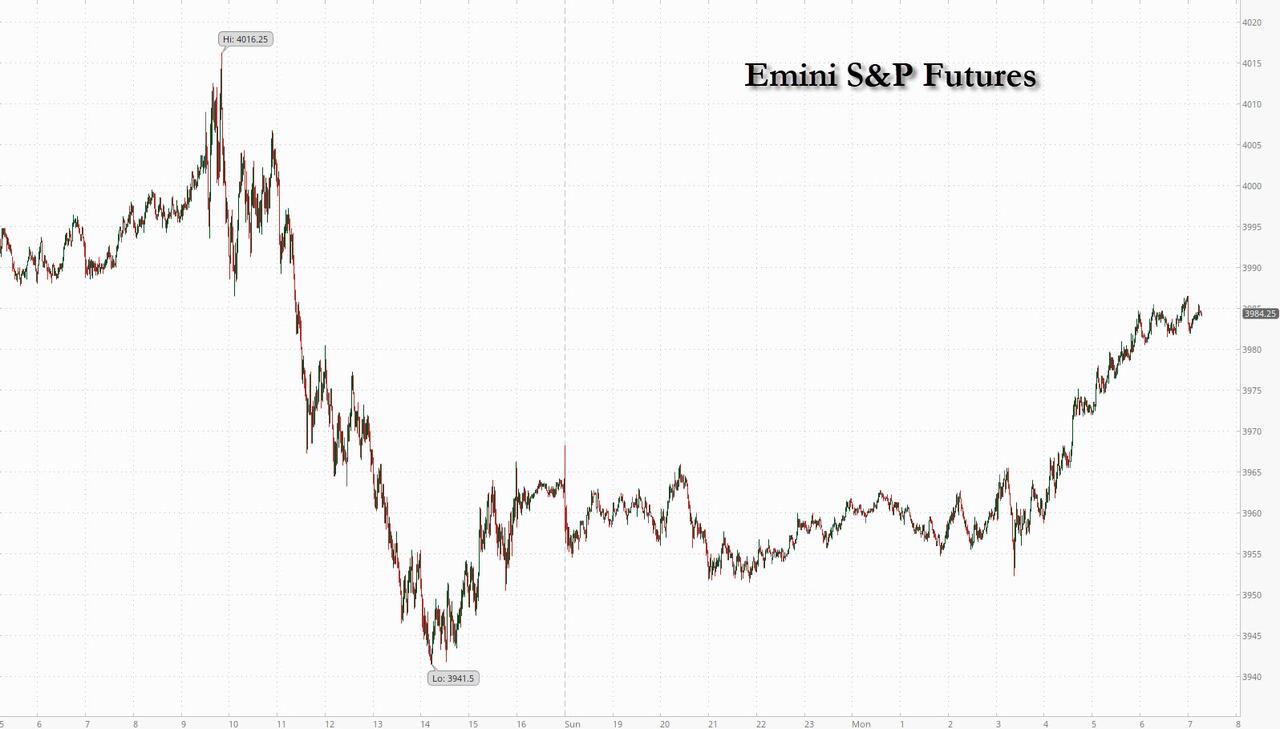
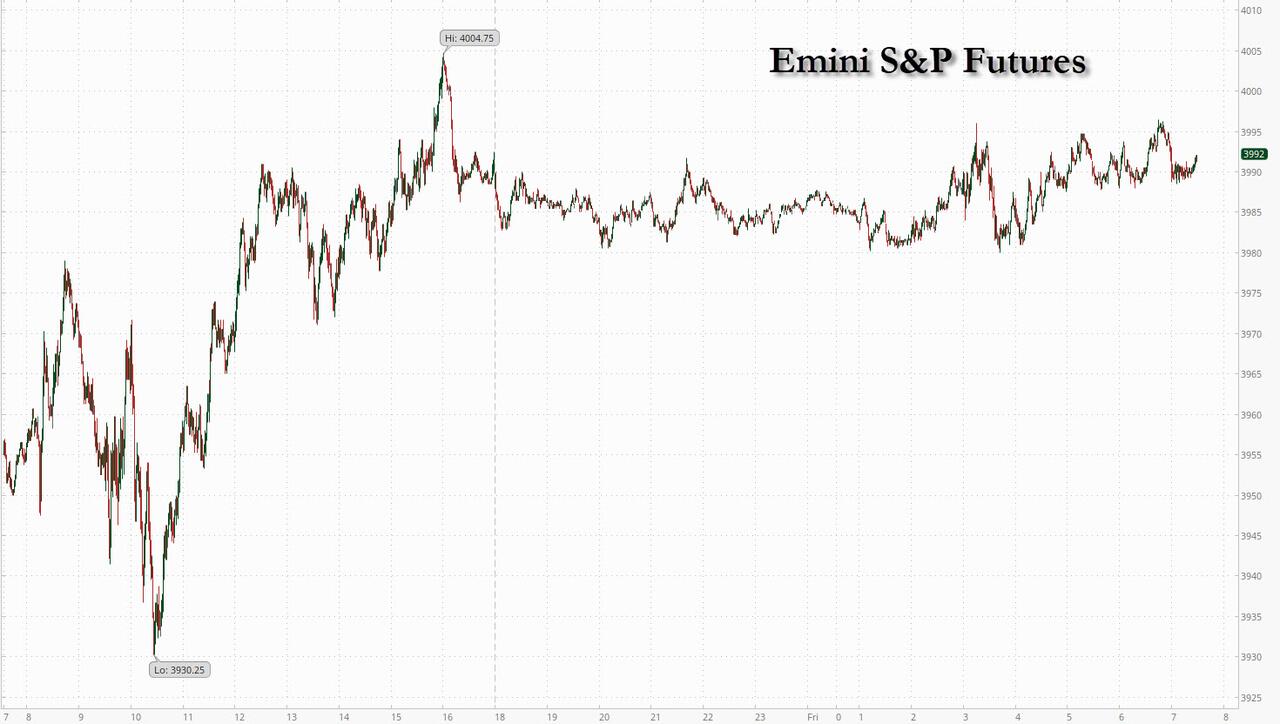
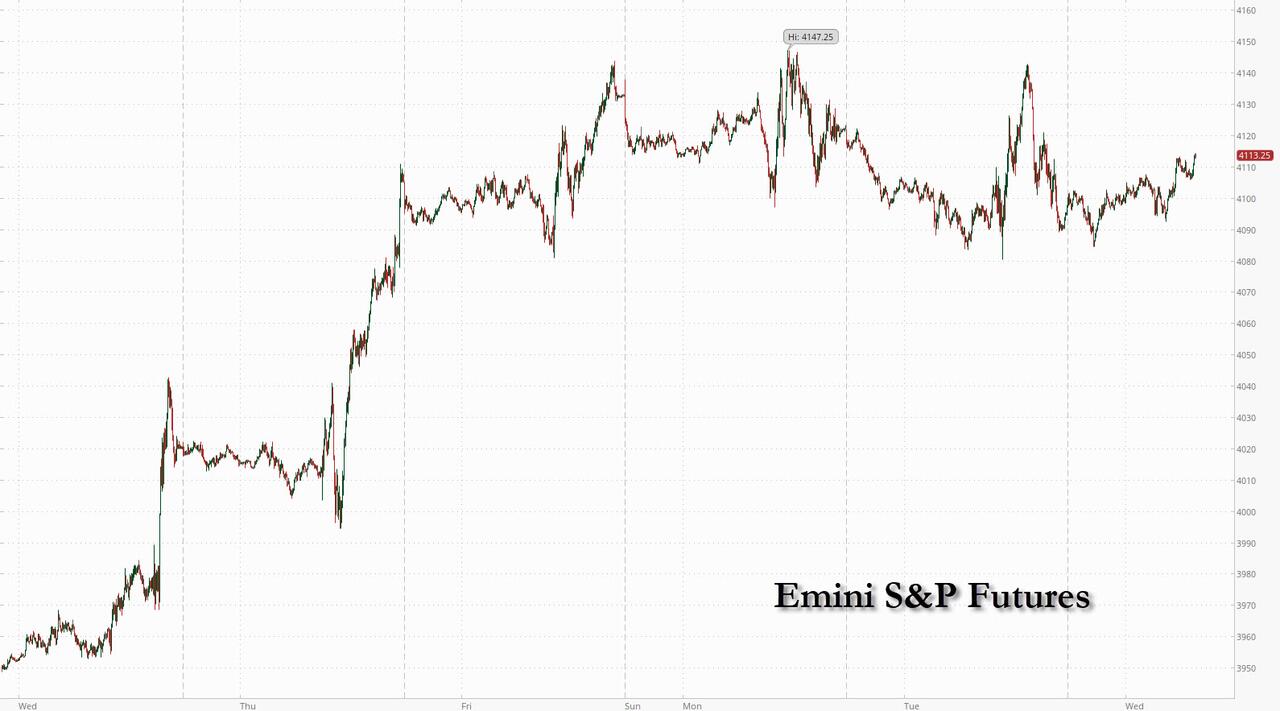
SPX has subdivided into an Ending Diagonal with a potential target near 4200.00.  The Cycles Model infers that the reversal may come on Friday, although it may come sooner.  The main resistance is now at 4225.62, the 50% retracement value and location of the Lip/Neckline of the Head & Shoulders formation.  In the meantime, a reversal beneath the Cycle Top at 4130.75 may call an end to this rally.  The 100-day Moving Average at 4118.00 may confirm the sell signal, should SPX decline beneath it.


8:40 am

Good Morning!

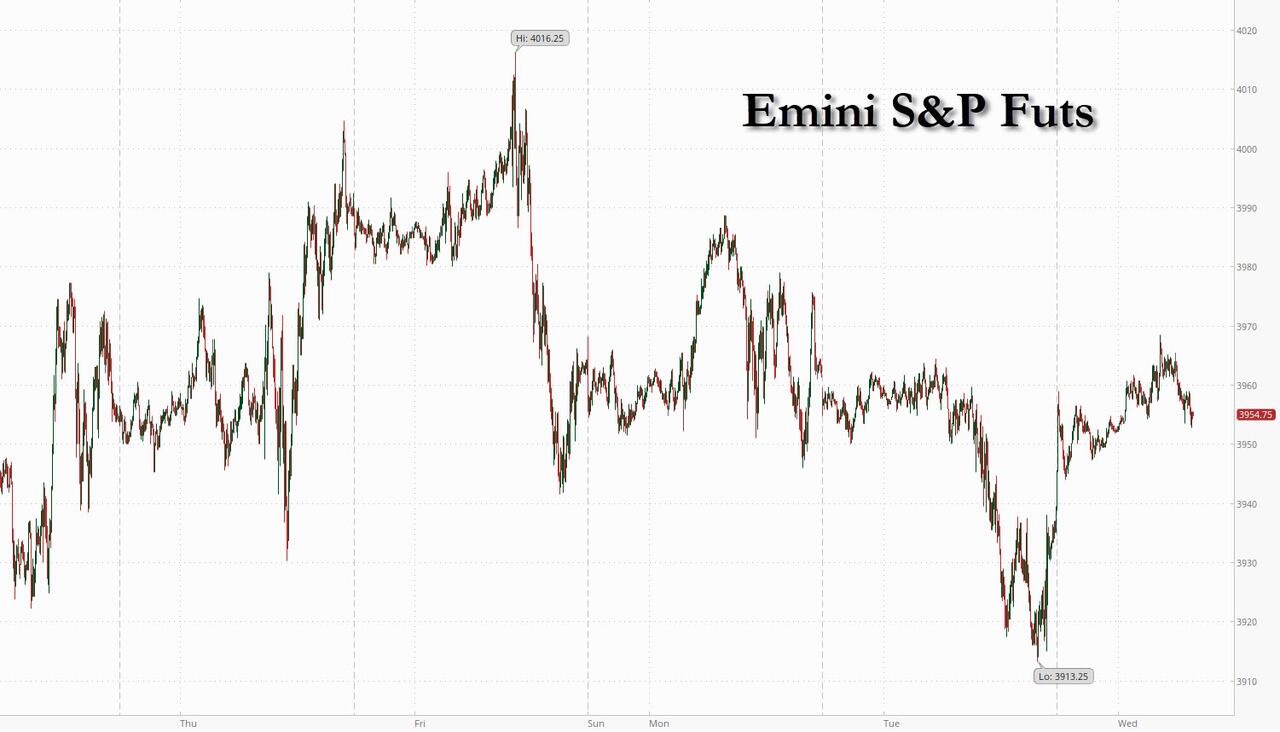
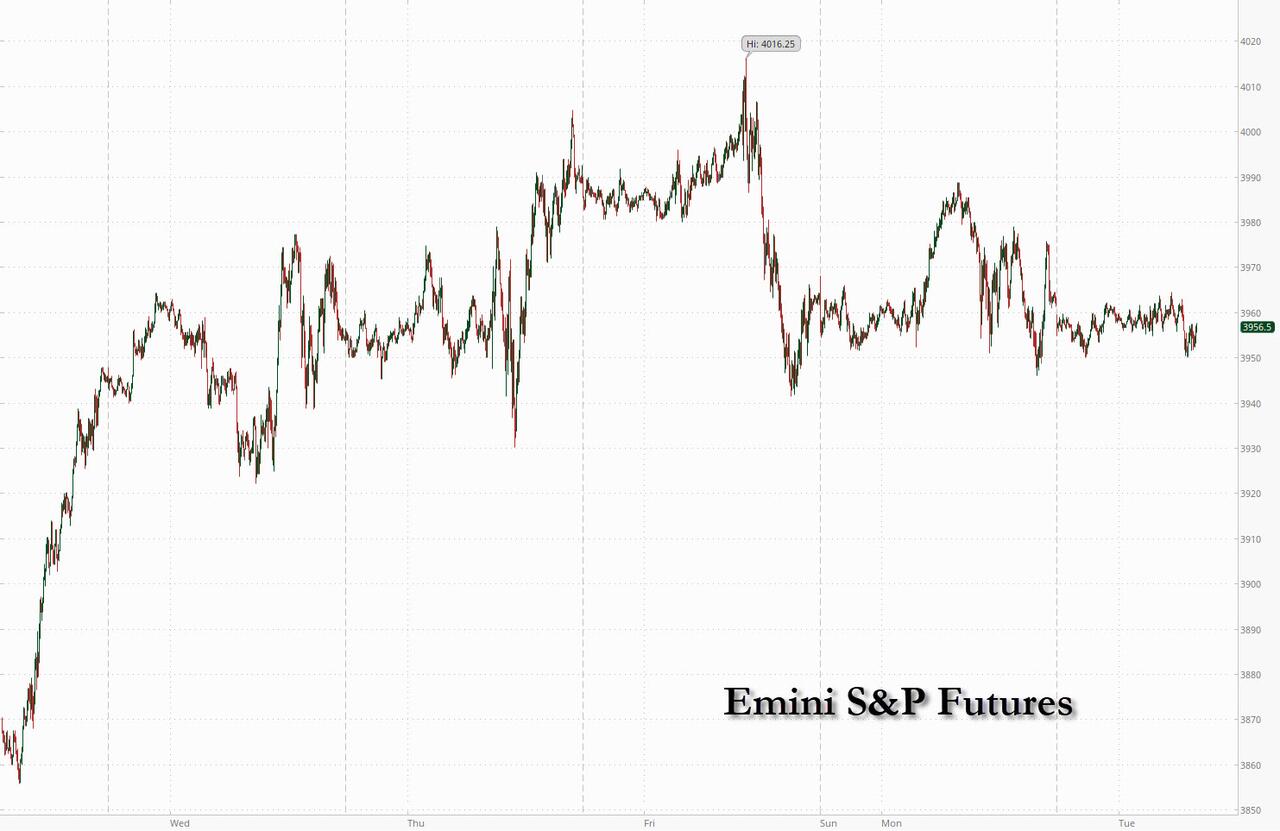
SPX futures rose to an overnight high of 4118.90, just beneath the 100-day Moving Average at 119.80.  It may be on an aggressive sell signal, subject to closing beneath the 100-day.  Today is day 254 of the Master Cycle.  Thus far, the high occurred on Monday, day 252, which also marked an inverted Trading Cycle high.

In today’s op-ex, Max Pain is at 4090.00 in a thinly populated market.  Calls rule above 4120.00  while puts have the majority beneath 4075.00.

ZeroHedge reports, “If yesterday morning markets were losing their mind over the potential risk of World War 3 ahead of Nancy Pelosi’s arrival in Taiwan, this morning it has been a mirror image, with risk assets rising and fears unclenching as investor anxiety over tense US-China ties eased after Pelosi left Taiwan less than 24 hours after arriving after pledging solidarity and hailing its democracy, leaving a trail of Chinese anger over her brief visit to the self-ruled island that Beijing claims as its own. Meanwhile, despite all the jawboning, China’s response to Pelosi’s Taiwan visit fell short of more aggressive expectations raised by nationalists like Hu Xijin, the former editor-in-chief of the Global Times, giving markets a breather. Among them:

  • Trade: Beijing added boycotts to fish and fruit imports from Taiwan and banned natural sand exports. It also prohibited dealings with some Taiwanese companies including Hyweb.
  • Markets: China’s potential to weaponize its almost $1 trillion pile of US bonds became a source of chatter after yesterday’s surge in Treasury yields.
  • On the ground: Pelosi flew off after vowing the US wouldn’t abandon Taiwan as she met with President Tsai Ing-wen. She was expected to meet with TSMC’s chairman.

As a result, both S&P 500 and Nasdaq 100 futures rose by about 0.5%. In New York premarket trading, while Treasuries extended a slide sparked by hawkish Federal Reserve comments (and the lack of world war). The dollar fell against most G-10 peers, gold fluctuated and oil was lower ahead of an OPEC+ meeting where some report output may be boosted by a modest 100kb/d  (or less jet-fuel than Biden consumed flying on Air Force One to Jedda last month) as Saudis “appease” the president.”


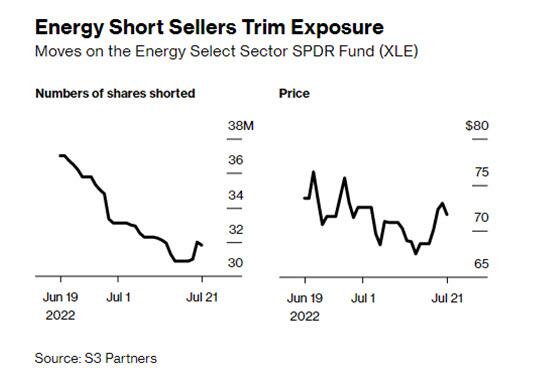
VIX futures consolidated, making a low of 23.13 and a high of 23.92.  Yesterday’s high tested the mid-Cycle resistance at 24.91.  It is commonly believes that the VIX may give a buy signal above 25.00.  Max Pain in today’s op-ex is at 24.00 with calls going gamma long at 25.00.  Shorts are thinning out.

DailyFX comments, ”  When it comes to implied (expected) volatility measures, there is a certain revision-to-mean characteristic that is expected. If there isn’t a crisis-level event, it is likely that the VIX volatility index and its acolytes tend to deflate over time. While there has been meaningful retreat in the capital market benchmarks these past months, it is fair to say that there wasn’t much in the way of outright panic-like price action that would charge hedging costs to exceptional heights. That said, there is a point where the market can become too complacent in the face of tangible threats, and I do believe we had already passed that threshold. My assessing markets are ‘too quiet’ is one thing, for the financial system to come to the same conclusion usually takes an overt motivator to force balance. That recognition seemed to come with the headlines around a prominent US politicians visit to Taiwan, adding geopolitics to the threat of recessionary pressures and restrictive monetary policy that has dominated the fundamental scene of late. Just like the S&P 500’s slip, a check higher from the VIX and volatility of volatility index (VVIX) is best served with a clear charge for motivation rather than taking its traction on belief.”


TNX continues its rally that may last through options expiration.  This may come as a surprise for those who had watched the decline for the past month.  The odds are even that TNX may make a new high in the next three weeks.  If so, the chances of an extension even higher may increase.

ZeroHedge reports, “In a time when the Fed’s QT is expected to soak up sloshing investor liquidity, while the end of Fed TSY buying (and phased out rolling of maturities) is meant to lead to a (gradual)  increase in Treasury auction sizes, today’s quarterly refunding announcement by the Treasury was counterintuitive, because instead of boosting the size of auctions across the curve for August and futures months, the Treasury reduced its quarterly sale of longer-term debt for a fourth straight time (in line with expectations) and laid out plans for cuts to a range of maturities in coming months, with the 20-year bond – which has long been “kinked” on the curve and paying a higher yield than even 30Y paper – singled out for the biggest trimming.

The Treasury Department said in a statement in Washington that it will sell $98 billion of long-term securities at its so-called quarterly refunding auctions next week — down from May’s $103 billion. According to Bloomberg, this marks the longest string of declines in about eight years. The offering sizes are as follows:

  • $42 billion of 3-year notes on Aug. 9, compared with $45 billion at the May refunding and $43 billion at the July auction
  • $35 billion of 10-year notes on Aug. 10, compared with $36 billion last quarter
  • $21 billion of 30-year bonds on Aug. 11, versus $22 billion in May”


The NYSE Hi-Lo made its Master Cycle high on July 29 on day 241, the earliest it can end its Master Cycle.  I’ll be watching this indicator for two reasons.  First, it may offer a sell signal below zero.  And, second, should the Hi-Lo reverse quickly, there may be enough time to extend the Master Cycle low during the week of August 15.  this offers another anomaly, since Monday’s high counts best as a Master Cycle for the SPX.  Yet there is time to make a very deep low in time for options expiration.  While it may not register as a Master Cycle in the SPX due to its proximity to the last Master Cycle, it may have the same magnitude as the crash in 2020, since these are both Intermediate-term declines.


USD futures made a new high at 106.40 as it gets another boost higher.  Although the USD may have only a week to go in its Master Cycle, it may get a turbo boost into options week, due to the rush to liquidity.

Investing.com comments, “Emerging markets posted a fifth straight month of portfolio outflows in July, setting the longest such streak in records going back to 2005, as global recession risk, inflation and a strong dollar drew away cash, data from the Institute of International Finance (IIF) showed on Wednesday.

Non-residents pulled $9.8 billion out of emerging market portfolios in July, the data show, compared with an outflow of $3.8 billion in June and a $35.1 billion inflow in July 2021.

Net outflow over the past five months totaled $39.3 billion, according to the IIF.”

Posted in Published | Comments Off on August 3, 2022

August 2, 2022

7:15 am

Good Morning!

NDX futures declined to 12797.50, beneath their 100-day Moving Average at 12879.76.  The Chart shows that NDX challenged the neckline at 13020.40 and failed to close above it yesterday.  There may be an aggressive sell signal at the bounce, provided it stays beneath the neckline.  NDX has the most obvious reversal points of all the indexes and may lead the charge lower.  While most analysts think that massive shorting leads to more short covering, there comes a point when the shorts are correct.  The beginning of Primary Wave [3] may leave little doubt of the market’s direction.

ZeroHedge remarks, “uly was a tremendous month for stocks, it was also a mediocre (at best) month for hedge funds which not only underperform the S&P when stocks slide (as they did during the crashes of 2020 and early this year), but also underperform the broader market during sharp squeezes like the one that took place in July, prompting some to ask just what is the point of paying someone 2 and 20 to some overweight billionaire to always underperform.

The question of hedge fund utility becomes that much more pressing when one reads in the latest Goldman Sachs Prime Services hedge fund weekly report that while the GS Equity Fundamental L/S Performance Estimate rose +0.57% between 7/22 and 7/28 (roughly a third the performance of broader – and free – MSCI World TR +1.74%), this return was driven almost entirely by beta of +0.56% (i.e., market exposure), with alpha of just +0.01%.

In other words, not only can’t hedge funds generate alpha, they can’t even keep up with the market’s own beta! That will cost 2 and 20, please.”


SPX futures declined to 4082.30 after failing to overcome the 100-day Moving Average at 4121.42.  This would be an early sign of a reversal and aggressive selling/shorting on the bounce may be advised, provided the 100-day is not breached.

Today’s op-ex shows Max Pain at 4115.00 in a thin market.  Options are long above 4120.00 and short beneath 4100.00.  Long gamma is not discernible, but short gamma may begin at 4050.00.  The shorts are becoming more confident in the options market.

ZeroHedge reports, “Forget inflation, stagflation, recession, depression, earnings, Biden locked up in the basement with covid, and everything else: today’s it all about whether Nancy Pelosi will start World War 3 when she lands in Taiwan in 3 hours.

US stocks were set for a second day of declines as investors hunkered down over the imminent (military) response by China to Pelosi’s Taiwan planned visit to Taiwan, along with the risks from weakening economic growth amid hawkish central bank policy. Nasdaq 100 contracts were down 0.7% by 7:30a.m. in New York, while S&P 500 futures fell 0.6% having fallen as much as 1% earlier. 10Y yields are down to 2.55% after hitting 2.51% earlier, while both the dollar and gold are higher.”


VIX futures rose to an overnight high of 24.58, just short of the mid-Cycle resistance at 24.87, where a buy signal lies waiting.  Of course, Friday’s (Master Cycle) low occurred on day 268, so confidence is high that the reversal was made yesterday.  This may be an aggressive long signal, as well.

InvestingCube explains, “The VIX index jumped sharply this week after steadily dropping since June. It is trading at $22.85, which is about 7.63% above last week’s low of $21.34. However, this price is about 37.54%, below the highest point in May this year. The rise coincides with the ongoing Dow Jones and S&P 500 sell-off.

Volatility inches up slightly

The VIX index is one of Wall Street’s most popular volatility gauges. It is used to measure the sentiment among investors by considering activity in the S&P 500 options market. In most periods, the index has an inverse relationship with the S&P 500, Dow Jones, Russell 2000, and Nasdaq 100.”


TNX futures declined again to a new low of 25.16 as it sinks toward the mid-Cycle support at 22.89.  Today is day 266 of the current Master Cycle, putting us on alert for an abrupt reversal.  The talk of a Powell pivot may be premature, as rates appear ready for a reversal higher.  Should TNX break out above the Cycle Top resistance in the next three weeks, we may see TNX reach 50.00 by year end.

ZeroHedge remarks, “For many people, former Fed Chairman Paul Volcker’s relevance today is rooted in how he broke the back of surging inflation in 1980. He is widely credited with employing the harsh policies that ended the high levels of inflation seen in the United States during the 1970s and early 1980s. back then few people realized his brave and bold move would shape the economic system for decades.

Paul Volcker served two terms as the 12th Chair of the Federal Reserve from 1979 to 1987. He was nominated to the position by President Jimmy Carter and renominated by President Ronald Reagan. Paul Volcker died on December 8, 2019. Before his death, Volcker participated in an interview with Ray Dalio. I recently stumbled upon this video from February 2019 on YouTube.


USD futures may have bounced off the 50-day Moving Average at 104.72 this morning, on day 251 of its Master Cycle.  If the low has been made, the USD may embark on a two-month rally.  The next resistance is the 2001 top at 121.21.


WTIC futures are in consolidation after threatening its July low.  This has thrown investors off, as this is a zigzag formation that will end mush higher in the next three weeks.  The 50-day Moving Average at 107.35 remains the target.


Posted in Published | 3 Comments

August 1, 2022

2:03 pm

SPX appears to be consolidating near its high.  It may still have yet another probe as high at 4225.00. the 50% retracement of the decline from January 4 to June 17.  Today is day 60 from the June 2 high, an inverted Trading Cycle (60 days).  It is also day 252 in the Master Cycle.  VIX has made a reversal from Friday’s low, so we may see the SPX reversal in the next few days.  VIX reversals often lead equity reversals by several days.  Current resistance is at the 100-day Moving Average at 4121.40.

Today’s op-ex shows Max Pain at 4095.00.  Calls rule above 4100.00 with long gamma at 4120.00.  Short gamma starts at 4025.00.


7:05 am  I will be taking my wife in for minor surgery this morning.  Please excuse the absence until later this morning or afternoon.

SPX futures are in a shallow pullback.  This may develop into something deeper, but the likelihood is strong that there may be a final push higher to reach the trendline above 4200.00.  The 50% retracement is at 4225.00.  Today is day 252 of the Master Cycle.  There is a potential for another week of rally.


VIX futures have reversed off Friday’s low in what may be a Master Cycle reversal.  Friday was day 258, so this may be a new trend forming.  VIX may temporarily go higher while SPX is still climbing.  No signal yet.


Posted in Published | 1 Comment

July 29, 2022

8:05 am

Good Morning!

NDX futures challenged the Wave (4) high resistance at 12897.63 by rising to 12906.70.  It has since pulled back from that resistance.  Should it go higher, the next resistance is the Lip/Neckline at 13020.40.  In today’s op-ex, calls dominate above 12450.00 in a thin market.  Gamma zones, if they exist, are difficult to place.  Op-ex in QQQ (309.81) shows Mas Pain at 304.00.  Calls dominate a 305.00 and above with long gamma beginning at 310.00.  Short gamma begins at 300.00.  Insurance companies, which have quietly dominated the calls in their indexed annuities, have now switched to offer limited downside protection (up to 20%) using puts.  This may make short gamma a much larger force in the next phase of the market.

ZeroHedge observes, “It was another torrid meltup for markets, one which steamrolled bears and underinvested hedge funds, but regular Zero Hedge readers were prepared for the move for two reasons: i) we previewed the dramatic impact the early Fed pivot would have a few weeks ago, and ii) over the weekend we warned that there is a massive tidal wave of buying on deck in the form of $11BN VWAP bids between stock buyback orders and CTAs blindly buying risk just because VIX keeps dropping.

Well, prepare for much more of the same because as a reminder, Goldman’s trading desk calculated that if spoos rise above 4070, CTAs will double their daily buying from $5BN to $10BN per day, to wit:

CTAs: have $5b of S&P to buy per week at these levels. North of 4070 (long term momentum) this demand essentially doubles.”


SPX futures rose above round number resistance to 4106.10 before easing back under it.  The 4000.00-4114.65 zone remains strong resistance.  Today is day 249 of the current Master Cycle.  A Master Cycle top maybe put in at any time in the next few market days.

In today’s op-ex, Max Pain is at 4015.00.  Long gamma starts at 4035.00 and short gamma begins at 3950.00.  Remember, long gamma forces the dealers to “buy high” to cover expiring in-the-money options.  This can be a painful process as they must sell longs to cover their liabilities.

ZeroHedge reports, “US and European stock were set for their best month since November 2020 following blowout earnings from the likes of Amazon and Apple last night, and record profits from energy giants Exxon and Chevron this morning, boosted by expectations of shallower Federal Reserve monetary tightening now that the US is technically in a recession. S&P futures rose 0.6% following yesterday’s meltup while Nasdaq 100 futures rose more than 1% after US stocks hit a seven-week high Thursday, as record underinvested hedge funds are forced to chase the move higher now that most downside catalysts (peak inflation, hawkish Fed, earnings disappointment) have been eliminated. The dollar was flat, and 10Y yields rose slightly to 2.70% after plunging as low as 2.65% yesterday after the Q2 GDP print confirmed news of the unofficial US recession.”


VIX futures made a new low at 21.81 on day 269 of its Master Cycle.  I had been puzzled by the “mismatch” of the SPX and VIX this month until now.  It is becoming evident that the current Master Cycle in the VIX is stretching, while the SPX Master Cycle is shrinking to make a match.  It may happen as early as today.


TNX rose from its Master Cycle low, made yesterday on day 261.  The new Master Cycle is scheduled to top out during the August options expiration.  It appears that the rally in TNX may go much higher than expected.

ZeroHedge reports, “After remarkably solid 2 and 5 year auctions earlier this week, moments ago the Treasury sold $38 billion in seven year paper in the week’s final coupon auction, which saw demand just as blistering as the previous two.

The high yield of 2.730% was a huge drop from the 3.280% in June, one of the biggest monthly drops on record, but in a testament to just how much duration is in demand today, the auction stopped through the When Issued 2.735% by 0.5bps despite the massive rally across the curve earlier, now the the US is in a recession.

The bid to cover of 2.604 was also a major jump from the 2.481 last month and well above the 2.46 six-auction average.”


Posted in Published | 1 Comment

July 28, 2022

3:45 pm

SPX has risen nearly to the 38.2% retracement of the entire decline from January 4 to June 17, approximately 5.5 months.  Today is calendar day 41 out of the low and 28 market days have elapsed since then.  The Cycles Model suggests another possible day of strength tomorrow.  The alternative may be a violent reversal, but that is more likely to happen early next week.  Yesterday I was marveling at the accuracy of the Cycles.  One or two days of extension does not alter the analysis.  It may fall within the “normal” range that allows these discrepancies.

Today is day 248 of the current Master Cycle.  While not common, a Master Cycle may turn in as little at 241 days.  There are three nearby resistance levels.  The first is the 38.2% Fibonacci level at 4085.07.  Next, Wave Equality is reached at 3091.00.  Finally, we have round number resistance at 4100.00.

ZeroHedge remarks, “The market’s dovish price-action response to the perception of “past peak tightening” from the Fed remains mutually exclusive from what was a “still hawkish on inflation” message, as Chair Powell did not stand-down there – repeating that it is the only mandate and largest challenge right now, outweighing any growth (i.e. “recession”) concerns.

“We’re going to be focused on getting inflation back down and as I’ve said on other occasions, price stability is really the bedrock of the economy.  Nothing works in the economy without price stability.  We can’t have a strong labor market without price stability for an extended period of time. We want to get back to the kind of labor market we had before the pandemic where differences between racial and gender differences and that kind of thing were at historic minimums.  That’s not going to happen without restoring price stability. So, that’s something we see as, as something we simply must do.  And we think that in the — we don’t see it as a trade-off with, with the employment mandate.  We see it as a way to facilitate the sustained achievement of the employment mandate in the longer term.”

And Nomura’s Charlie McElligott points out that this is how things can get “awkward” again in coming months to keep things “uneasy” versus the perception of “dovish pivot,” as Powell’s repeated emphasis on the June SEP (which shows ongoing rate hikes into 2023) looked clearly “intentional,” which would then seemingly push-back on the market’s “quick turn” pricing of early rate CUTS seen in start 1Q23…”


8:15 am

Good Morning!

SPX futures rose to 4027.20, then eased back toward 4000.00, as suggested at the close.  This is a very options-driven market, since today’s Max Pain is at 4010.00.  Long gamma may begin at 4025.00.  Puts take over beneath 4000.00.  In tomorrow’s op-ex however, Max Pain is at 3945.00.  The dealers’ dilemma is how to keep the market from going too far in either direction.

ZeroHedge reports, “One day after the Nasdaq 100 posted its biggest jump since November 2020 when the market exploded higher after it interpreted Powell’s forward guidance purge and comment that it is “likely appropriate to slow rate increases at some point” as more dovish than expected, US stocks were set to pull back as downbeat earnings and a dire outlook from bad to Metaworse weighed on demand. Futures contracts on the technology-heavy Nasdaq 100 dropped 0.5% by 7:15 a.m. in New York, after the underlying gauge rallied 4.3% in the previous session. S&P 500 futures were down 0.2% after the benchmark index jumped to its highest level in seven weeks. Treasury yields were little changed and the dollar and bitcoin edged up.


VIX futures declined further to 22.84, an 85% retracement.  The August 3 op-ex Max pain appears at 24.00 while long gamma begins at 26.00.  It is on an aggressive buy signal, confirmed above the mid-Cycle resistance at 24.78.


TNX appears to be consolidating in place, awaiting it’s reversal after a Master Cycle low.  The Cycles Model reveals no particular strength, suggesting that yields may flop around for a while before giving a directional push.

ZeroHedge observes, “Did He, Or Didn’t He? That Is The Question

Markets responded incredibly well to yesterday’s FOMC meeting. The Nasdaq was up over 4%, CDX IG tightened 4 bps, high yield bonds were up about 1%, the 2-year treasury dropped 6 bps (despite a 75 bp hike) and the 10-year moved a couple bps lower as well.

Did Powell come across as dovish? Did he make the case that the Fed would take into account economic risk? That the Fed was data dependent? That the Fed was almost done hiking?

I’ve read the transcript several times and keep thinking that:

  • He did a very good job suggesting that we are near a neutral rate. That is positive for markets and dovish.
  • He mentioned data dependency several times and did mention some concerns about the economy. Slightly dovish.
  • On the other hand, he tried to drive home the point that fighting inflation was still the priority. That he would sacrifice the economy and jobs for lower inflation, since inflation is so problematic. He didn’t take even 75 bps off for September and did say they could hike above neutral to fight inflation. Hawkish.


USD futures declined to 105.93 before moving higher.  The Cycles Model projects growing strength starting today and lasting the next two weeks.  A “normal” final push higher may take USD to 111.00-112.00.  Additional Cyclical strength may push it higher.


Crude oil futures rose to 99.83 in the overnight session, as it begins to test round number resistance at 100.00.  The Cycles Model suggests a bounce to mid-August with a potential target at the 50-day Moving Average at 108.16.


Posted in Published | 1 Comment

July 27, 2022

3:35 pm

SPX has reached a new high of 4039.56 as I write.  It is in long gamma which may force dealers to buy high to cover today’s maturing options.  In any event, we must see SPX come back down to 4000.00 by the close or the market may wake up with a hangover, since Dealers will have to sell their longs to pay today’s in-the-money options.

ZeroHedge remarks, “Yesterday, ahead of today’s FOMC meeting we were musing what would happen if the Fed followed in the ECB’s footsteps and killed forward guidance.

Well, we got the answer today when Powell effectively confirmed he is just as clueless as Lagarde when it comes to forecasting the future, and his admission that the Fed will be pretty much exclusively data-dependent…

  • *POWELL: PACE OF RATE HIKES TO DEPEND ON INCOMING DATA

… coupled with the Fed Chair’s confirmation that it will “likely be appropriate to slow increases at some point” is all the market needed to unleash a huge buying spree, sending the Nasdaq more than 4% higher, and triggering the biggest buy program since March 2021!”


3:15 pm

SPX made a new correction high, but I was amazed at the precision of it all.  From the 4177.51 high, it took 56 calendar days (18.5 X 3) ,exactly 37 market days (18.5 X 2) and 259 market hours (18.5 X 14).  You may recall that I mentioned that the market patterns were divisible by 18.5 (4.3 squared).  It seemed that this Cycle was breaking all the rules and I had attempted to find the new pattern, to no avail.  Today was like a bullseye.  We may now expect to see a 12.9-market day panic decline where Wave C may equal or exceed Wave A to fulfill the Head & Shoulders Minimum Target.


6:55 am

Good Morning!

I have a 7:30 breakfast appointment, so here is a brief summary to tide us over until I return.

SPX futures rallied to a 54% retracement of yesterday’s decline, at 3965.20.  It appears that the “status quo” is being held until the FOMC announcement later today.

In today’s op-ex, Max Pain is near 3940.00 with options favoring calls at 3950.00 with long gamma beginning at 4000.00.  Puts dominate  at 3915.00 and short gamma may begin at 3900.00.

ZeroHedge reports, “Global markets and US equity futures got a strong boost on Tuesday from reassuring big tech reports including Microsoft, Texas Instruments and Google, which delivered double-digit revenue growth reversing the doom and gloom from other reporters. Microsoft assuaged fears that the strong dollar and a weakening economy would hurt sales while Alphabet posted advertising revenue that surpassed analysts’ expectations amid an industry slowdown. Credit Suisse CEO Thomas Gottstein will to be replaced by asset-management head Ulrich Koerner next week after the Swiss bank posted its third straight quarterly loss and its worst trading first half in decades. All of that, of course, pales ahead of the day’s main event Later today, the Federal Reserve is expected to increase its benchmark interest rate by three quarters of a percentage point.

Nasdaq 100 contracts led gains rising 1.3% and reversing much of Tuesday’s plunge. S&P futures rose 0.8% alongside European stocks which also rose, with the banking sector up even as Credit Suisse Group AG posted a larger-than-expected loss, Deutsche Bank AG warned on costs, and the outlook on Italy’s sovereign debt ranking was lowered by S&P. The dollar and Treasury yields slipped, while oil and European natural gas prices extended gains.


  VIX futures pulled back to 24.04 after closing above the mid-Cycle support at 24.52.  It is on an aggressive buy signal with additional confirmation above the 50-day Moving Average at 27.17.  VIX is recognized as a “buy” above 25.00.

SeekingAlpha observes, “Summary

  • Since the beginning of 2022, the Cboe Volatility Index® (“VIX”) futures curve has shifted higher, indicating that expectations for volatility in the market remain elevated.
  • A state of contango represents the expectation that the VIX index will increase from its current level moving forward.
  • When the VIX futures curve does go into backwardation it could signal weakness and overall risk in the market but the market can recover quickly.


TNX remains slightly elevated above yesterday’s possible Master Cycle low (day 259).  The Cycles Model projects the next Master Cycle pivot (high) during the August monthly options expiration.  A likely target may be the Cycle Top resistance at 35.21, but may be higher.

Yesterday ZeroHedge reported, “After soaring last month to 3.27%, the highest level since July 2008, in what was an ugly auction that tailed by a whopping 3.5bps, moments ago the US Treasury sold $46 billion in a much more solid auction.

The high yield of 2.860% tumbled from last month’s 3.271%, the biggest one month drop since the Covid crash. It also stopped through the When Issued 2.870% by 1 basis point, a spike in demand which was no doubt facilitated by the concession during this morning’s modest selloff.

The bid to cover jumped from June’s dismal 2.28 to 2.46, the highest since March and above the six-auction average of 2.44.”

Today ZeroHedge observes, “What the Fed says at Wednesday’s meeting is going to matter much more than what they do.

That, according to Bloomberg’s Garfield Reynolds, will be the case even if Powell shocks us all by hiking less or more than the three-quarter point shift that’s been solidly priced in for most of the time since the June meet.

But assuming policy makers meet those projections, then all of the focus is going to be on what guidance we get from the policy commitment statement and Chair Powell’s presser. Traders are betting the cash rate will be about 3.1% in a year’s time and 2.6% in two years, following rate cuts which are expected to start in Q1 2023. Making matters more complicated, the Fed’s WSJ mouthpiece, Nick Timiraos today published an article warning that the Fed could nuke the practice of forward guidance (similar to what the ECB did last week).”


USD futures traded in range this morning, awaiting the FOMC announcement and guidance.  The Cycles Model shows USD ending the week in strength with only two more weeks left in this Master Cycle.


Posted in Published | Comments Off on July 27, 2022

July 26, 2022

2:32 pm

BKX, our liquidity proxy, just gave us a sell signal.  It has declined beneath the 50-day Moving Average at 106.43.  Yesterday it made its Master Cycle high on day 265.  The Cycles Model shows that the next Master Cycle low may not come in until September 30.  This may be the 15th reason for an economic crash in the second half of the year.

ZeroHedge gives the other 14 reasons, “It looks like we are going to get official confirmation that a recession has already begun when the GDP number for the second quarter comes out later this week.  But that isn’t what we should be focusing on.  Yes, things weren’t great during the first half of 2022, but they are going to be significantly worse during the second half.  Small businesses are starting to fail all over the country, a housing crash of potentially epic proportions has started, layoffs are on the rise from coast to coast and economic activity is really slowing down all around us.  So if you think that things are bad now, just wait, because they will soon be a whole lot more painful.”


10:23 am

SPX is making new lows and potentially challenging the 50-day Moving Average at 3921.00.  A decline beneath the 50-day confirms the sell signal.

ZeroHedge highlights Goldman’s change of tune, “Some very concerning market observations from Goldman trader John Flood discussing the real rot below the market surface:

Monday was the lightest volume session of the year with 9.32b shares trading across all US equity exchanges breaking previous low mark of 9.4b back on 7/11/22. YTD daily avg for shares traded across all US equity exchanges sits @ 12.5b. Monday was also the lightest notional trading session of the year w/ $392b trading vs ytd daily avg of $638b.

Our desk was a 3 on 1 – 10 scale in terms of overall activity levels. I am personally taken aback by how resilient mkt has been over the past few weeks.

I don’t see L/Os putting their ~$210b of cash to work. I am seeing them use pockets of strength to sell lower conviction more illiquid names in block form and raise even more cash. Last week our desk had 11 blocks which is noteworthy.

Positioning, sentiment and liquidity all incredibly depressed. Feels like we are due for a real pullback but clearly it wont be a straight line down.”


10:12 am

The Ag Index leaped higher with strength today as it emerges out of a very stretched correction.  The Cycles Model calls for up to three weeks of rally prior to a pause in mid-August.  Primary Wave [3] until late November or early December with the potential of more than 100% gains.   And excellent long potential.

ZeroHedge observes, “Wheat prices soared Monday after Russia attacked the Black Sea trade port in Odessa, Ukraine, on Saturday. The strike comes less than one day after Ukraine and Russia brokered an export deal — mediated by Turkey — to export millions of tons of grains.

On Friday, officials from the U.N., Turkey, Russia, and Ukraine signed an agreement to reopen three ports, including Odessa, the country’s largest port. It’s a move heralded by these officials to alleviate a global food crisis.

Kremlin spokesman Dmitry Peskov insisted the weekend missile attack is “in no way related to infrastructure used for the export of grain.”


7:50 am

Good Morning!

SPX futures dipped to a low of 3947.30, within yesterday’s trading range.  It appears to be marking time for the FOMC announcement.  The top of the squeeze may have made its appearance last Friday.  SPX is on an aggressive sell signal with confirmation beneath the 50-day Moving Average at 3921.54.

It should be no surprise that Max Pain in today’s op-ex is at 3965.00.  Options turn bullish at 3975.00 and long gamma begins at 4000.00.  Puts dominate at 3950.00 and short gamma may begin near 3925.00.  Wednesday’s Max Pain is at 3945.00 with very little call action.  Puts dominate beneath 3900.00.

ZeroHedge reports, “US stock futures dropped as investors braced for Wednesday’s Federal Reserve meeting, while Walmart’s surprise profit warning fueled concerns about the strength of US consumer spending. A barrage of earnings including notable misses by the likes of GM and a 3M guidance cut, did not help the mood. Contracts on the S&P 500 and the Nasdaq 100 were each down 0.4% by 7:45am in New York. European stocks rose driven by energy stocks amid a fresh surge in gas prices following Russia warnings of an imminent halving in NS1 shipments even as European Union countries reached a political agreement to cut their gas use. The dollar jumped and 10Y yields tumbled below 2.75% as a recession looks inevitable, no matter how Biden defines it.


VIX futures rose to 24.07, within yesterday’s trading range.   A breakout beneath the June low is encouraging shorting the futures and ETFs.

Next Wednesday’s op-ex shows Max Pain at 29.00 with calls dominating above 30.00.  Puts prevail at 28.00 and short gamma starts at 26.00.  The crowd has really piled on to the short side of the ledger, which is typical near a Master Cycle low.

Bloomberg proclaims, “A recent bout of volatility in US equities has prompted some traders to think Wall Street’s so-called fear gauge should be higher. For Goldman Sachs Group Inc., that isn’t necessarily the case.

In fact, strategists led by Rocky Fishman recommend investors buy puts on the Cboe Volatility Index, effectively betting on relative calm in coming months. The VIX, a gauge of cost for S&P 500 options, historically tends to move in the opposite direction of the equity gauge 80% of the time. At one level, the team’s prediction for lower VIX implies a call for higher share prices.”


TNX is challenging last Friday’s possible Master Cycle low.  Today is day 259 of the old Cycle, so there is a potential for making a marginal new low.  The Cycles Model calls for 3-4 weeks of rally that may exceed the previous high.  The next technical resistance appears at 53.16, made in 2007.  Recession risk is high, but that won’t stop the Fed from hiking aggressively, since that is the only tool they have left.

ZeroHedge comments, “Risk Assets Are Hoping July Will Be Last Jumbo Fed Hike

The way yields and equities are dropping underscores the message from investors to the Fed: “You better slow down!”

The recession drumbeats grew louder after last week’s slump in US activity gauges and with rates traders pricing for the Fed rate to peak some time between November and February at about 3.3%. That’s going to make it very hard for the central bank to do anything but ease back, unless it wants to create real panic across markets.

The inflation-recession conundrum remains for the Fed, however, so such “tough love” can’t be ruled out. There’s been a strong undercurrent in Fedspeak and commentary from former Fed officials that the central bank has to be willing to risk recession to tame inflation if that’s what is needed.”


USD futures rose to 107.14 this morning, signaling a change in direction.  The Cycles Model shows significant strength this week as it rises toward its Master Cycle high due during the second week of August.


Gold futures eased back toward the Cycle Bottom support at 1708.24 prior to a fresh rally higher.  The weakness may not last, as the Cycles Model shows exceptional strength for the rest of the week.  The next Master Cycle Pivot is due early next week.


Crude Oil futures rose to 98.98 this morning as the retracement continues for the next few weeks.  The target for the retracement appears to be the 50-day Moving Average, currently at 108.41.  A period of strength ignites later this week and continues with strength into the Master Cycle high, due in mid-August.  A probable tax increase may be the fly in the ointment to sour this rally.

Bloomberg reports, “Big Oil is poised for a record-breaking $50 billion profit in the second quarter, but the industry’s stellar performance could contain the seeds of its own decline.

The soaring earnings are direct result of the high energy prices that have stoked inflation, piled pressure on consumers, raised the risk of recession and prompted calls for windfall taxes. Amid this political and economic turbulence, shareholders may have to temper their expectations for rising returns.”


Posted in Published | Comments Off on July 26, 2022

July 25, 2022

11:28 am

The Ag Index may have extended its Master Cycle low to day 314 days from its September 2021 low in a double zigzag pattern.  If correct, the Ag Index may rally through mid-August.  I have no other explanation for this anomaly.  However, it may be said that the 50% retracement of its 2-year rally from its 2019 low was reached at 429.60.

ZeroHedge reports, “At perhaps the worst possible time, scorching heat and dry conditions are jeopardizing US agriculture – threatening soybeans, corn and other crops.

According to the Wall Street Journal, intense heat over the past week has put large portions of the United States – particularly the South and West – at risk during an important period during the Midwest crop-growing season.”


7:50 am

Good Morning!

SPX futures made a small retracement to 3986.30, a 65% retracement of the decline from Friday’s high after completing a 51-day (top-to-top) Cycle.  The Cycles Model projects a 12.9-17.2-day decline into mid-August.

Today’s op-ex shows Max Pain at 3945.00 with calls dominating above 3975.00.  Long gamma may begin at 3975.00 with short gamma beginning at 3900.00.

ZeroHedge reports, “Whether it’s because Goldman forecast over $11 billion in “forced” buying every day this week between the end of the buyback blackout period and systematic purchases amid the sliding VIX, or because hopes of an imminent recession prompted more expectations of a Fed pivot after Friday’s drop led to oversold conditions amid record bearishness, but this morning US equity futures have moved higher ahead of what will be an extremely busy week with 30% of the S&P reporting earnings including big tech, the US revealing if Q2 GDP was negative thus pushing the US into a recession, and the Fed hiking another whopping 75bps. Or perhaps the optimistic sentiment came out of China where Chinese property stocks rallied after a reported move by Beijing to establish a fund to support developers fueled optimism about a turnaround for the struggling sector.

Whatever the reason, stocks and US equity futures reversed earlier declines on Monday and traded near session highs with S&P 500 and Nasdaq 100 futures rising 0.6% and 0.5% respectively, while European stocks extended gains after their best week since May, rising 0.5%. Treasury yields advanced and a dollar gauge slipped. Oil also reversed earlier losses and last traded 0.9% higher.

The S&P 500 posted its biggest weekly gain in a month last week and is on a pace for its largest monthly increase since October. Stocks have gotten a lift as the corporate earnings season began with better-than-feared reports and as investors bet that a lot of the negative economic news was priced in.”


VIX futures are rising out of their Master Cycle low, made on Friday.  The Cycles Model suggests growing strength this week.  While SPX shows a potential Master Cycle low in mid-August, the VIX doesn’t show a Master Cycle high until the week after the monthly op-ex in September.


TNX leaped out of its Master Cycle low on Friday (day 255).  Wave 4 may have been stretched to fit the pattern calling for higher yields in August.  If so, the Cycles Model may call for up to 4 weeks of higher yields.


USD futures appear to be consolidating within Friday’s trading range.  If so, we may see USD on the rise again to a new high by mid-August.  Demand for the USD is ramping higher, as Europe’s economy collapses and may accelerate as equities are sold.


West Texas Crude futures are rising above the mid-Cycle support at 94.93.  The Cycles Model projects rising crude prices through monthly op-ex week in August.  The potential target may be the 50-day Moving Average at 107.82.

ZeroHedge observes, “With the price of oil still stuck in a bizarre jekyll and hyde standoff, where despite soaring physical demand futures prices have been sliding on expectations of an imminent recession setting up an inevitable collision between the two polar opposite camps, some are speculating that oil prices may be finally reaching a bottom.

According to Bloomberg, short positions in the top oil stock exchange traded fund, the USO, have tumbled 14% in the last 30 days. Such aggressive covering by mostly retail investors may indicate that traders see an end to the rout that has dragged oil prices down by more than 20% since mid-June despite consistently strong physical demand. That said, there is no consensus on what’s ahead: while some see a tight market and optimism a US recession will be shallow, others point to a grim demand outlook and robust supply growth.”


Posted in Published | Comments Off on July 25, 2022

July 22, 2022

3:06 pm

Today is (calendar) day 51 from the top of the current daily Cycle beginning on June 2.  There were 16 days of decline followed by 35 days of correction in this particular Cycle, as opposed to 37 down days followed by 14 days of rally in the first two Cycles.  Investors have been buying the dip, or at least covering their shorts on each of these 51.6-day Cycles that began on January 4, especially this one.  The next daily Cycle may be another top-to-top ending mid-September.   But the final Cycle may be measured from top-to-bottom, ending shortly after the mid-term election, in my estimation.

What may be noteworthy is that today’s close may be nearer to Max Pain (3930.00) than most would have expected.  The 50-day Moving Average is near 3925.00.

ZeroHedge brings out the (stumped) commentators, “As we end the week, the question – according to JPMorgan’s trading desk – is whether the bear market current rally has ended and what that means for stocks moving forward.

While the Banks painted a picture of strength in Consumer and Corporate sectors, bears will point to (lack of) hiring (and outright firing) in Tech and headlines from companies such as AT&T that consumers are behind on payments on their phone bills! Recall AT&T’s management said “we’re seeing an increase in bad debt to slightly higher than pre-pandemic levels, as well as extended cash collection cycles. However, it’s important to note that customers are making their accounts today consistent with historical patterns and previous economic cycles.”


9:48 am

The Ag Index appeared to have completed its Master Cycle low on July 6 very near the 3-year 50% Fibonacci retracement value of 429.64.  This morning, however, it declined lower, extending the correction to a possible 61.8% retracement at 387.78.  Critical support for this decline lies at 380.54.  An alternate view may be that GKX may have completed a PI Cycle of 314 days from its September, 2021 low in the place of its Master Cycle shown in the chart.  I have reached no conclusion, yet.

ZeroHedge reveals, “Turkey has announced that Russia and Ukraine are on the cusp of signing a deal that would allow for the resumption of crucial grain exports from Ukrainian ports, after days of intense negotiations in Istanbul. Expected to be signed Friday, details have yet to emerge, but The New York Times is reporting that Ukraine may have compromised on a key demand regarding demining its ports.

“The Turkish presidency says that a signing ceremony will be held on Friday to unveil a deal brokered between Ukraine and Russia” – which would allow some 20 million tons of Ukrainian grain to be released under the UN-sponsored plan, the Times reports. In the afternoon local time, Turkish President Erdogan said he’s about to give the world “good news” on grain exports later in the day.”


8:30 am

Good Morning!

NDX futures declined to 12498.10 and bounced.  However, NDX still remains in the red this morning. Equities may have completed a 50-day top-to-top Cycle, giving way to the next decline.  The next Master Cycle bottom may lie near mid-August, where the Head & Shoulders target may be in play.

In today’s op-ex, calls hold sway down to 12200.00. in a lightly populated options market.  Op-ex in QQQ (307.38) shows Max Pain at 299.00 with Long gamma starting at 310.00 and short gamma beginning at 295.00.  It appears that retail investors are more involved than institutions.

ZeroHedge notes, “Earlier today, we wrote that according to the Goldman flow desk, “most clients were hating this rally“, sentiment which Nomura’s Charlie McElligott picked up on later in the day when he wrote that the risk over the near term is a “further pile-on to the crowd who has expected another surge lower in stocks, instead squeezing their shorts and accelerating the enormous Systematic buying already going through as CTAs cover and flip long.”

Well, it appears that the most steadfast bears – who are recently capitulated bulls, and who according to the latest BofA Fund Manager Survey, are now the most pessimistic on record – are starting to capitulate yet again, this time calling a bottom to stocks, and are starting to buy. Indeed, as Goldman flow trader John Flood writes in his end of day wrap, “some noteworthy long-only clients have now started to passively buy on our desk throughout the day (velocity picked up this afternoon as mkt moved higher)” adding that “executed flow across US equities franchise had +338bp buy skew vs 30d avg of -30bp sell skew. L/Os buy skew +9.8% was highest here since since 6/30.”


SPX futures bounced from a low of 3977.10, but failed to make a new high in the overnight session.  Yesterday’s high was considered a breakout, but note that a normal 61.8% retracement value was 3970.00.  A decline beneath the 50-day Moving Average at 3925.12 may confirm a sell signal.

In today’s op-ex, Max Pain appears at 3930.00.  Long gamma begins at 4000.00, while short gamma resides at 3850.00.  Given a choice, dealers may not wish to pursue longs at this point.

ZeroHedge reports, “US futures were flat (bouncing off session lows), and a rally in tech stocks reversed after three days of gains as recessionary PMI data out of Europe and disappointing results from COF, CRSR, SAM, SIVB, STX and others raised concerns about sliding corporate profits amid slowing economic growth. Contracts on the Nasdaq 100 were down 0.5% as 7:30am in New York, while S&P futures ticked 0.3% lower, but are on pace to close the week more than 3% higher after solid rallies in the past two days.”


VIX futures made a new Master Cycle low at 22.85 this morning, stretching the Current Cycle to 261 days.  This decline may be due, in part, by short gamma.

Wednesday’s op-ex shows Max Pain at 29.00 with short gamma at 26.00.  Long gamma begins at 30.00.  If this weren’t the end of a Master Cycle, I would be bearish on VIX.

Bloomberg writes, “A recent bout of volatility in US equities has prompted some traders to think Wall Street’s so-called fear gauge should be higher. For Goldman Sachs Group Inc., that isn’t necessarily the case.”

ZeroHedge notes, “Longer-dated VIX futures: still fear

Longer-dated VIX futures are well above their pre-COVID range, reflecting persistent risk aversion.

Source: Goldman

Implied high

Implied volatility is well above pre-May levels across tenors.

Source: Goldman

VIX hedges

VIX call open interest on strikes ≥40 is at record highs.”


TNX made a surprise move this morning, indicating that the current Master Cycle (day 255) may end as low as mid-Cycle support at 22.51 in the few days that may be left of the Cycle.  Wave C reaches equality with Wave A at 23.64, so it may not be too much of a stretch to make up the difference.

ZeroHedge observes, “ECB hiked rates (50bps) for the first time in 11 years and attempted a word-salad to explain their defragmentation ‘tool’ to save spreads from blowing out. In the US, there was more ugly data today with 8-month highs for initial jobless claims and Philly Fed plunging to COVID-lockdown lows (and AT&T admits Americans can’t afford to pay their phone bills?!)

This prompted a very dovish dive in rate-hike expectations

Source: Bloomberg

Additionally expectations for a rate-cut in Q1 are re-accelerating…

Source: Bloomberg

As Curvature’s Scott Skyrm notes, after the rally today, the market is only pricing a 15% chance of a 100 basis point tightening next week. Of course, 75 basis points is still fully priced-in.


Posted in Published | Comments Off on July 22, 2022

July 21, 2022

1:15 pm

It finally took until today’s action to recognize that there is no Triangle formation in the SPX…yet.  Triangles usually denote one final move will follow.  This decline is far from over.  This Cycle has now taken 50 days from the last high.  The prior two Cycles were 51 and 52 days long.  This is close to the end of the current daily Cycle.  There are all types of speculation about the rally going higher.  The main thing to keep in mind is that it is a short squeeze and nothing more.  It may limit out near 4000.00.

ZeroHedge remarks, “Earlier today Goldman trader Rich Privorotsky confirmed something we said over the weekend, namely that most Goldman clients “are hating this rally.” Well, just a few hours later, Nomura’s Charlie McElligott made the continuation of this most hated rally the centerpiece of his daily note, writing that his focus “is a scenario in the near-term where this US Equities squeeze could further accelerate into next week and “drag in” the folks who’ve been bearish and expecting this qtr’s earnings to be the one that shows the damage inflicted from tighter FCI…but in fact, might not yet be the broad case.”


7:50 am

Good Morning!

SPX futures faded, but remained above the 50-day Moving Average at 3928.00.  For those who have not yet gone short, a decline beneath the 50-day confirms the sell signal.  The Cycles Model suggest yet another possible 17 days of decline to the bottom of Wave C of (3) and next Master Cycle low.

ZeroHedge reports, “US equity futures edged slightly lower on Thursday but rebounded off session lows, as China’s worsening property crisis, political chaos in Italy where Mario Draghi rasigned as PM, and Russia’s plans to annex occupied Ukrainian territory all damped global sentiment, which however was offset by news that flows via the Nord Stream 1 pipeline had resumed and oil prices tumbled on fading US gasoline demand and a ramp up in Libyan output. Yes, as Bloomberg succinctly puts it, it has been an “eventful day” for Europe,  that includes the resignation of Italian Prime Minister Mario Draghi, an ECB rate decision and the restart of Russian gas flows via the Nord Stream pipeline.

Investors were also waiting for American unemployment claims to gauge their potential impact on Federal Reserve policy tightening and for earnings from companies including AT&T, Philip Morris and Snap. A European Central Bank meeting that’s expected to result in its first rate-hike in more than a decade is also among a flurry of concerns for traders.

S&P 500 contracts were down just 0.1% and those on the Nasdaq 100 little changed as of 715am in New York. The tech-heavy Nasdaq 100 index had gained for a second day on Wednesday, rising to the highest level since June. The Stoxx Europe 600 Index and the euro recouped losses following the resignation of Italy’s Prime Minister Mario Draghi. Treasury yields rose, pushing the 10-year benchmark above 3% and the dollar was flat. Bitcoin slumped after Tesla announced it had sold 75% of its holdings.


VIX futures rose to test the mid-cycle support/resistance at 24.57 this morning.  A cross above that confirms the buy signal off the Master Cycle low made yesterday, on day 259.  The Wave structure appears to be complete.  This may be a good time to accumulate VIX ETF shares and options.

SeekingAlpha reports, “Market volatility declined on Wednesday, sending the S&P VIX Index (VIX) below its 200-day moving average for the first time since late April. The subdued volatility has had implications on benchmark index tracking ETFs and volatility-based ETFs and ETNs.

The VIX fell to as low as 23.4 as of Wednesday’s late-morning action. This marked its lowest level since April 22 and first time below its 200-day moving average since April 21.”


USD futures are down modestly after testing the trendline at 107.50.  There may be room for a modest new low.  However, USD is on the verge of a triple strength breakout that may challenge the 2001 peak at 121.21.  This will complete a 21.5-year Top-to-top Cycle.


TNX rallied this morning above the 50-day moving Average at 30.06 and is challenging Intermediate-term resistance at 30.76.  The Cycles Model suggests the probe higher may fizzle out next week, but not before challenging the June 27 peak at 34.83.  The fear of rising rates may be the trigger for lower stock prices.

ZeroHedge reports, “With the 20Y part of the curve still deeply kinked and inverted (due to lack of buyside liquidity for this tenor) and offering the highest absolute yield of any US treasury, moments ago a $14 billion auction for 20Y paper (19-year, 10-month reopening of cusip TH1), showed that there was blockbuster demand for duration.

Pricing at a high yield of 3.420%, this was not only the first drop in yield since December 2021, but also stopped through the When Issued 3.447% by 2.7bps, the 2nd highest on record with only April’s 3.0bps higher.

The bid to cover of 2.65 was above last month’s 2.60 and the highest since April.”


West Texas crude futures declined to 96.42 this morning, again challenging mid-Cycle support at 94.81.  The Cycles Model infers another 4 weeks of rally to challenge the 50-day Moving Average currently at 109.06 before moving much lower.  Higher prices at the pump are in store until Labor Day, when real demand destruction sets in.

ZeroHedge comments, “WTI Crude is back below $100 this morning, down almost 5%, after a perfect mini-storm of headlines hit energy bulls (in the short-term).

On the demand side there were drivers on both sides of the Atlantic.

Official US data on gasoline inventories showed significant demand destruction (building 3.5mm barrels despite a modest cut in refinery runs) – a particularly negative development in the middle of what’s known as summer driving season in the US.

“In aggregate,” wrote analysts at Sevens Report Research, “all of these data points continue to suggest high prices are resulting in demand destruction among consumers as inflation continues to pressure personal balance sheets.”


Posted in Published | Comments Off on July 21, 2022